CHAPTER 12
Analysis of Investing Activities
THINKING BEYOND THE QUESTION
How do assets create value for our business?
A company can improve its return on assets by increasing its revenues,
QUESTIONS
Q12-1 Investing activities are important because they provide a basis for future
earnings and cash flows. A company invests in resources that provide a
Q12-2 Additional investment in resources, including plant assets and current
assets, is a basis for company growth. This investment provides re-
Q12-3 Investing activities involve the acquisition or disposal of long-term as-
sets. This includes assets such as productive equipment, investments in
other companies, and intangible assets. The choice to acquire equipment
with certain capabilities rather than other equipment having different ca-
352 Chapter 12
Q12-4 Investments in companies with high fixed costs involve more rather than
less risk. Companies with high fixed costs can be described as having
Q12-5 The balance sheet of a financially strong company will show that it main-
tains sufficient cash to meet its ongoing cash requirements. It should not
maintain an excess of cash, however, because cash does not earn a re-
turn until it is invested. Other than the cash balance at the end of a fiscal
year, the balance sheet does not provide much information about cash.
Q12-6 These facts suggest that the company has well-established products in
mature markets but that there is not much opportunity for growth or ex-
pansion. It is encouraging that profits are being earned and that cash flow
from operations is also positive. It is interesting, however, that the scale
Analysis of Investing Activities 353
Q12-7 It depends on the nature of the business involved. Some businesses, by
their very nature, require huge and costly investments in facilities and
equipment. Oil refineries or auto manufacturers would be good examples
Q12-8 Both amounts are stated in terms of cost. Therefore, the portion of cost
that has been depreciated already yields information about the general
age of the assets. Depending on the nature of the business, this can be
Q12-9 Asset turnover is a function of two components: sales and total assets.
Clearly, if the acquisition of new assets had no effect on sales, the pres-
ence of the additional assets would cause asset turnover to fall. But
Q12-10 Generally, companies become more valuable because of growth in sales
and profits. One way to increase sales and profits is by expanding the
scale of operations. This means making new investments in assets that
354 Chapter 12
Q12-11 Return on assets is a reflection of investing decisions made in the past.
Because of past investing decisions, the company has a certain collec-
tion of assets available today for use in generating profits. If wise (or
Q12-12 The formula to compute asset turnover is sales divided by total assets.
Therefore, any strategy that increases the numerator proportionately
more than the denominator will generate higher asset turnover. Similarly,
Q12-13 Revenues and expenses do not always increase proportionately. Consid-
er grocery stores, for example. If sales increase during a certain week
over prior weeks, there are many costs that do not increase at all. For ex-
ample, the costs related to the store building and equipment do not in-
Q12-14 Investing activities often require financing. As new assets are acquired,
new liabilities are created that may increase the risk of liabilities already
in place. Therefore, creditors (particularly long-term creditors) monitor
Analysis of Investing Activities 355
Q12-15 A company’s balance sheet identifies the costs of its assets and the
sources of finances used to acquire them. Financial assets and liabilities
may be adjusted for changes in market value, but the balance sheet does
EXERCISES
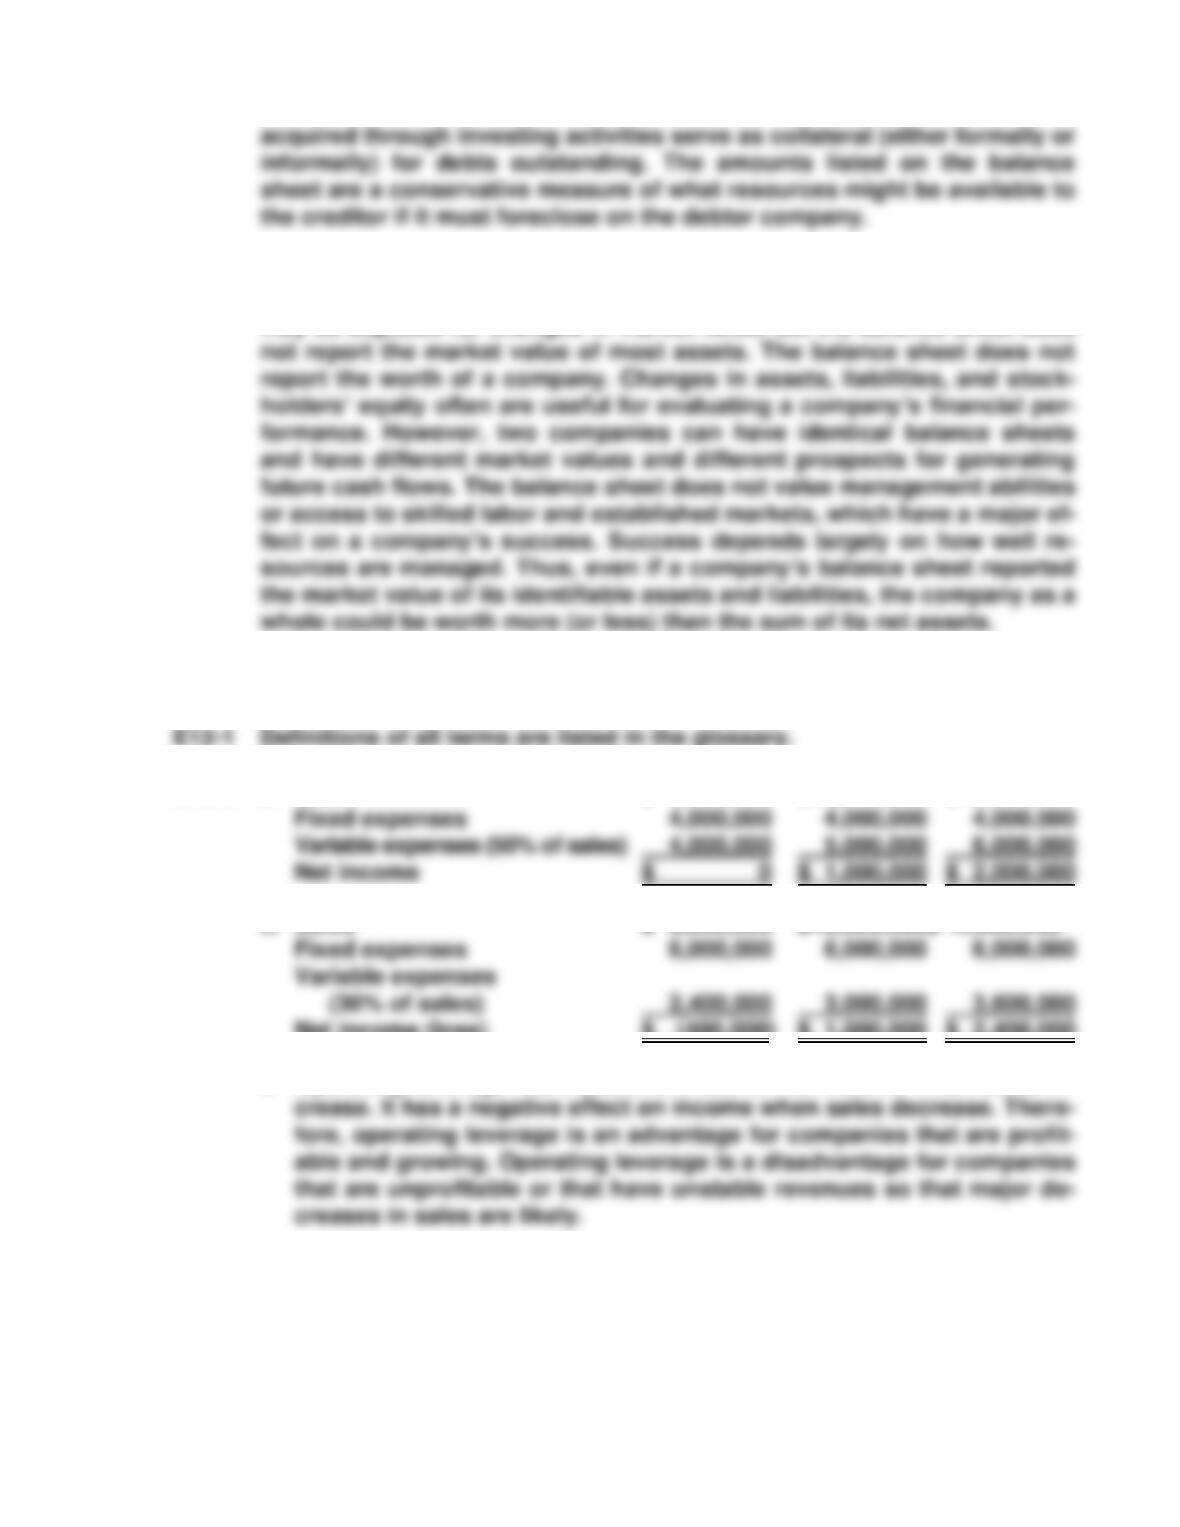
E12-2 a. Sales $ 8,000,000 $10,000,000 $ 12,000,000
b. Sales $ 8,000,000 $10,000,000$ 12,000,000
Net income (loss) $ (400,000) $ 1,000,000 $ 2,400,000
c. Operating leverage has a positive effect on net income when sales in-
356 Chapter 12
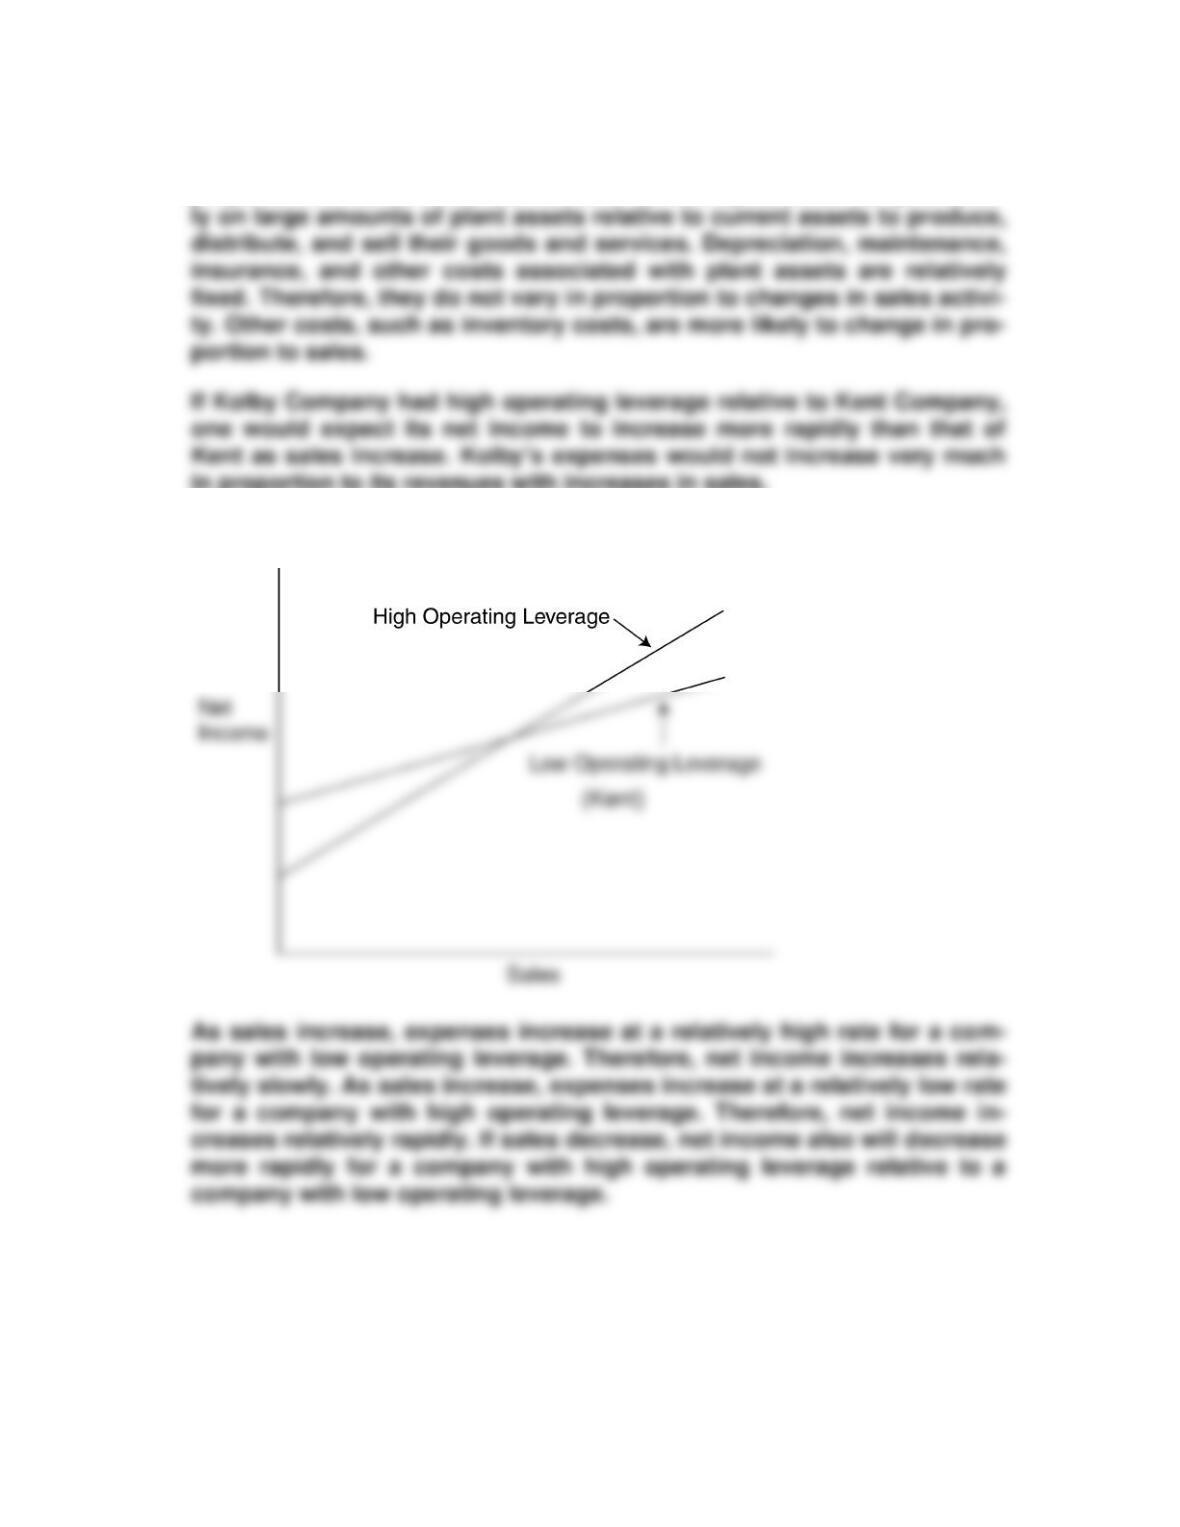
E12-3 Operating leverage can be measured as the percentage of a company’s
total costs accounted for by fixed costs. Some companies have higher
proportions of fixed costs than others. For example, some companies re-
in proportion to its revenues with increases in sales.
The following diagram illustrates the relationship:
(Kolby)
Analysis of Investing Activities 357
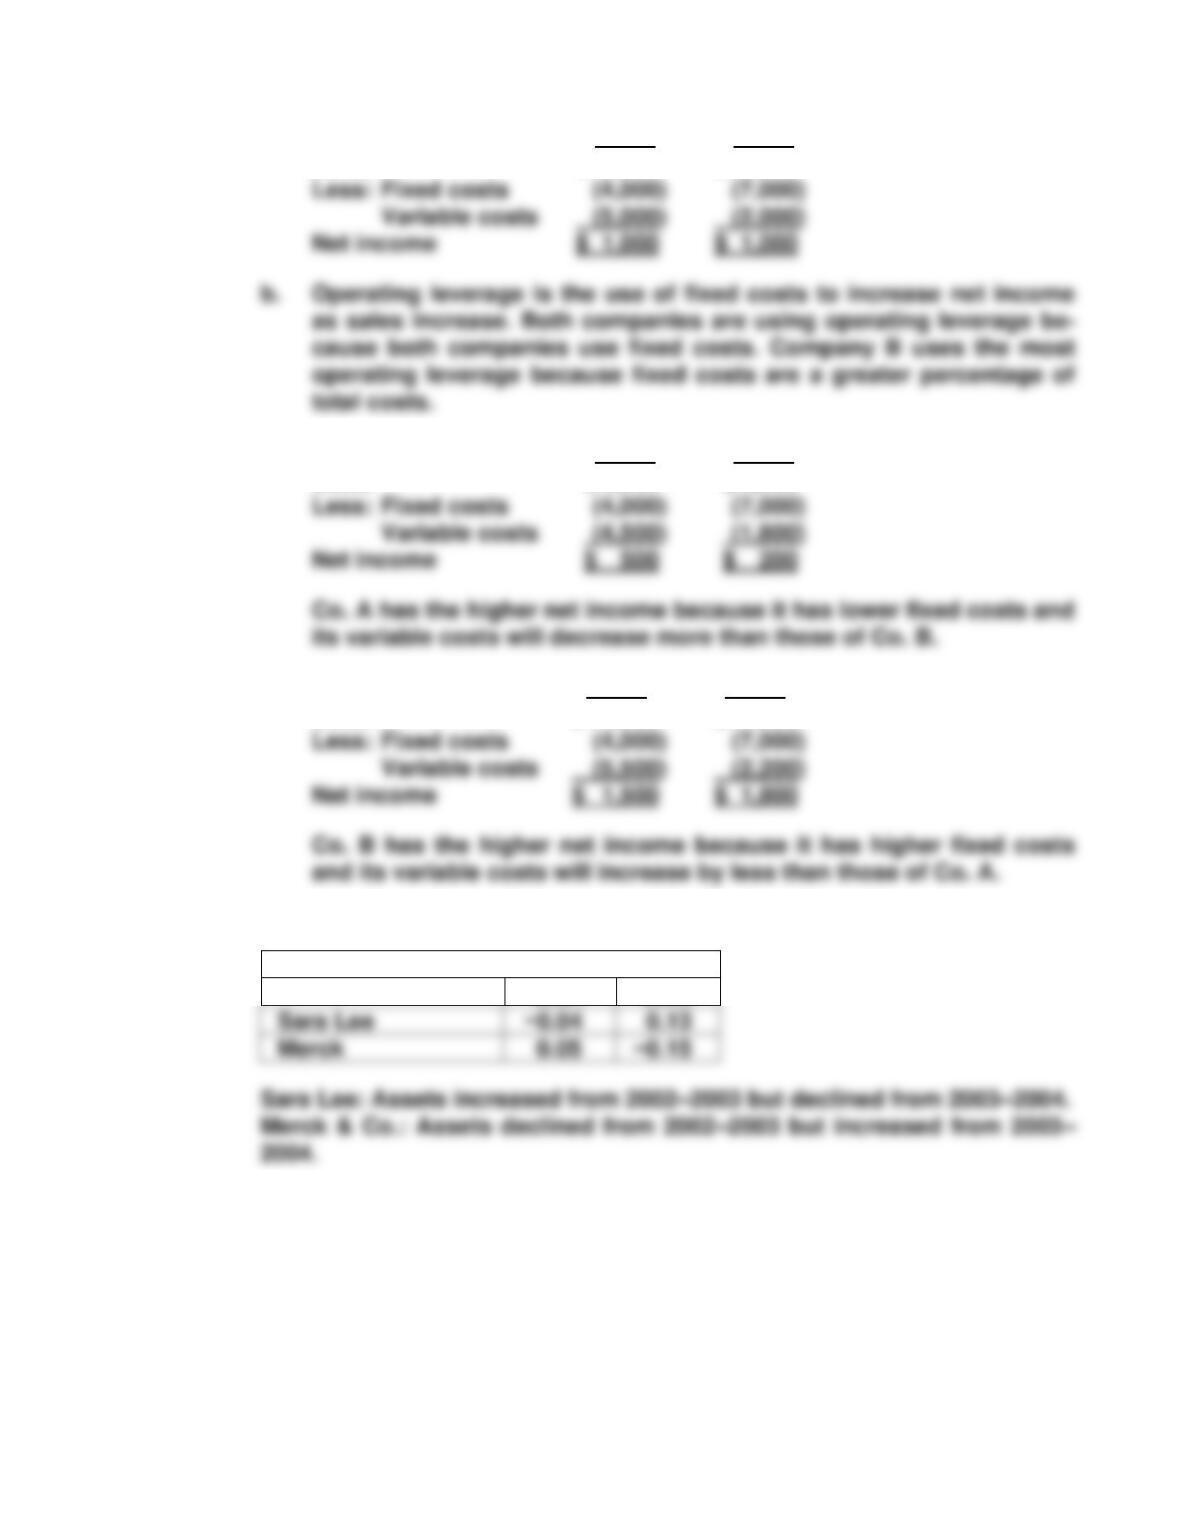
E12-4 a. Co. A Co. B
Sales $10,000 $10,000
c. Co. A Co. B
Sales $ 9,000 $ 9,000
d. Co. A Co. B
Sales $ 11,000 $11,000
E12-5
Change in total assets from prior year
2004
2003
0.13
(continued)
358 Chapter 12
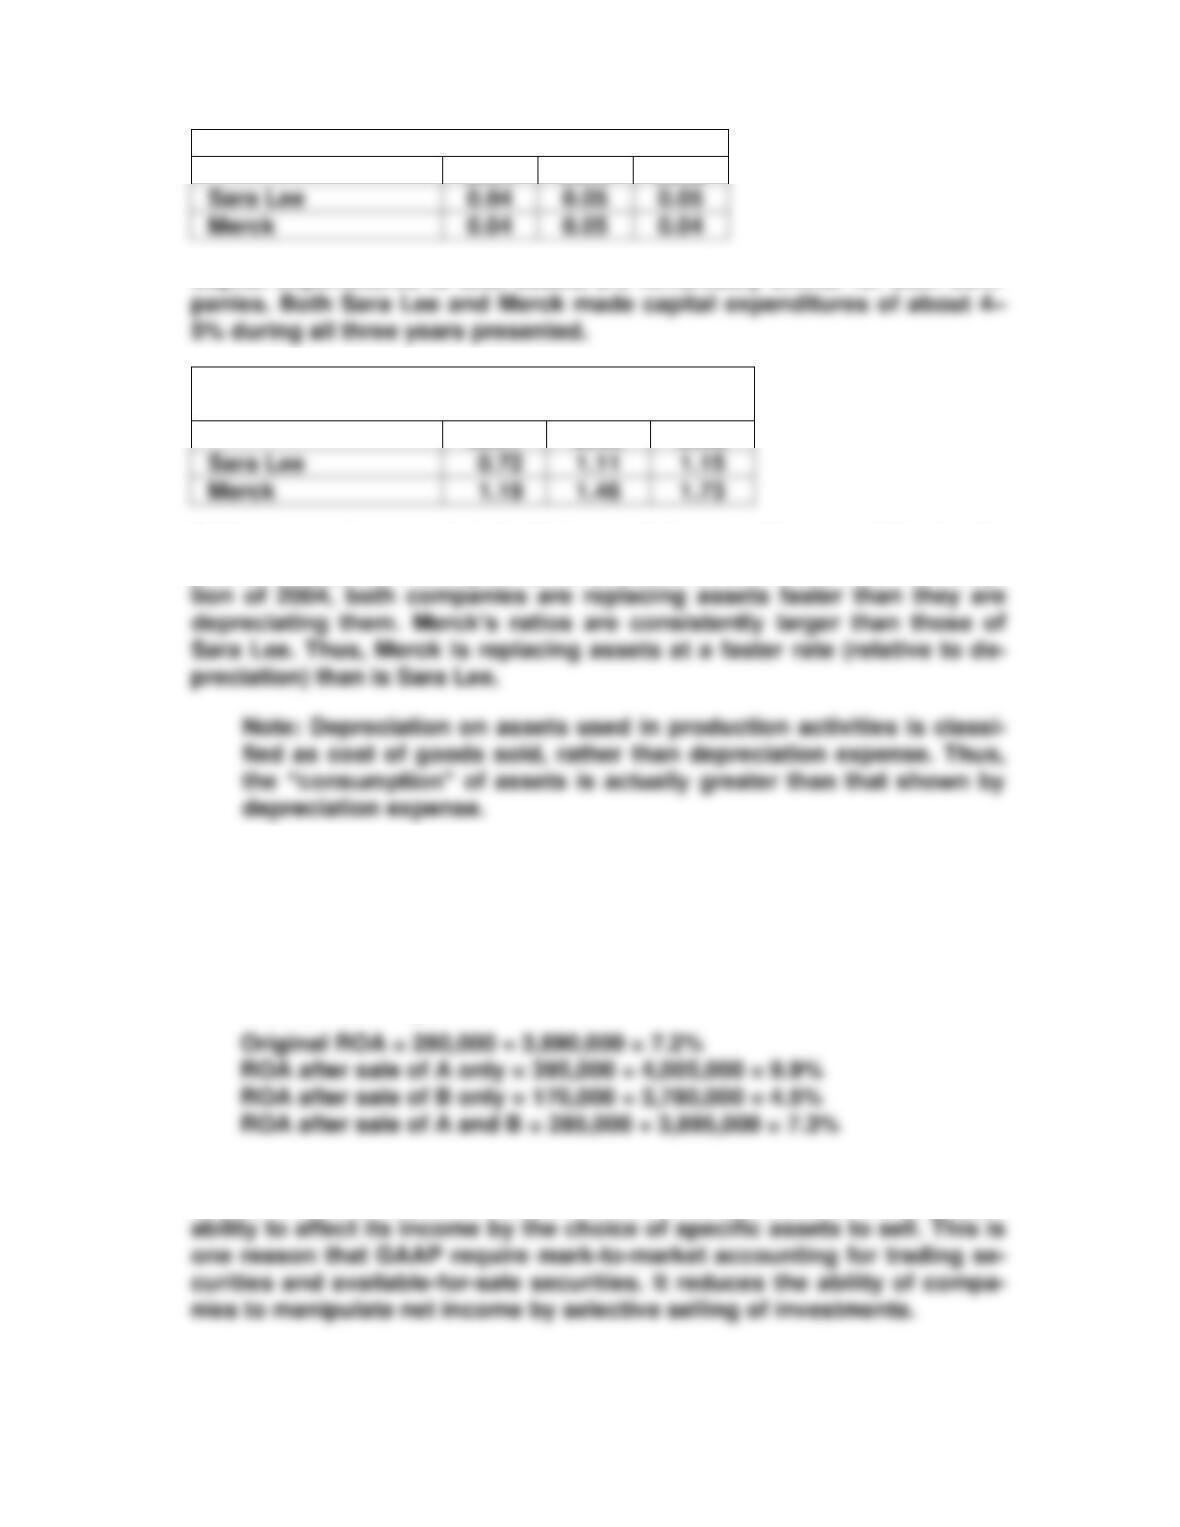
Capital expenditures to total assets
2004
2003
2002
Capital expenditures to total assets are remarkably similar for both com-
Capital expenditures to
depreciation and amortization
2004
2003
2002
Both companies reported declining capital expenditures relative to de-
preciation expense during the periods reported. However, with the excep-
E12-6 The effect of the sales on the company’s accounts would be as follows:
A. Total assets would increase by $115,000, as would net income and
retained earnings.
B. Total assets would decrease by $110,000, as would net income and
retained earnings.
The sale of investment A or B has a noticeable effect on the company’s
net income and return on assets. Historical costs conceal a company’s
Analysis of Investing Activities 359
E12-7 2004 2003 2002
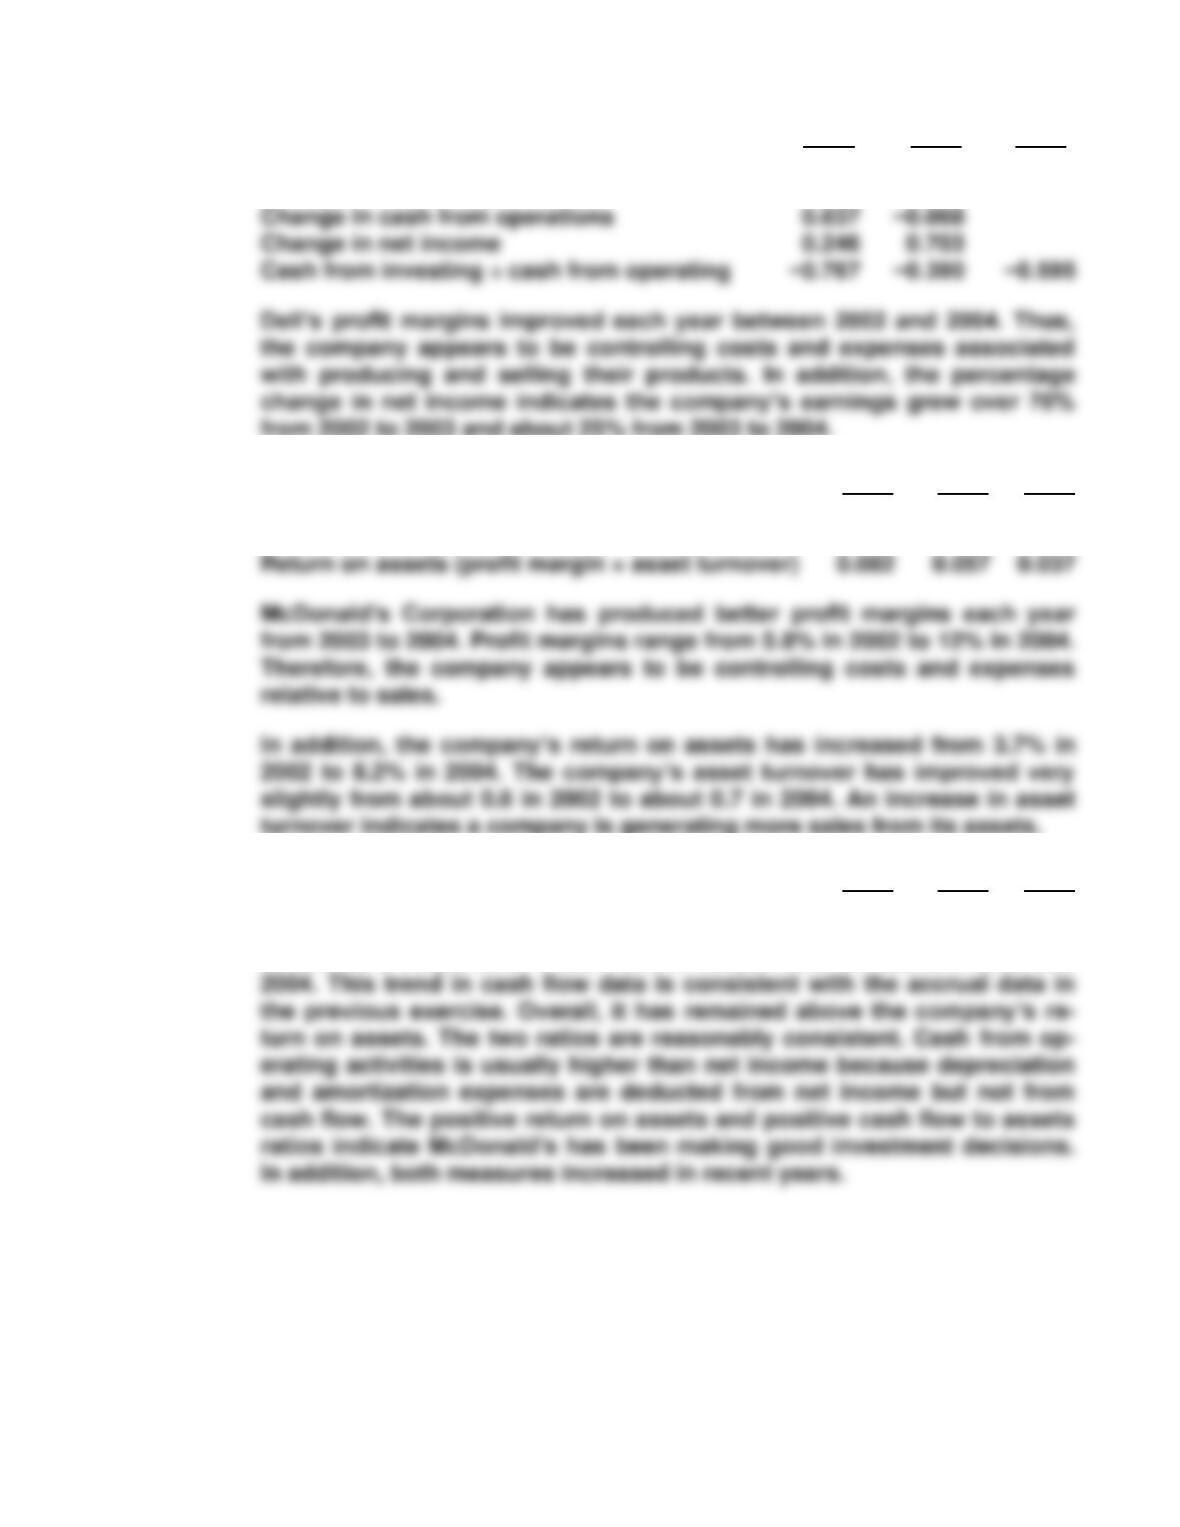
Profit margin (net income ÷ net revenue) 0.064 0.060 0.040
Change in capital expenditures 0.079 0.007
E12-8 2004 2003 2002
Profit margin (net income ÷ net revenue) 0.120 0.086 0.058
Asset turnover (revenues ÷ total assets) 0.685 0.663 0.643
E12-9 2004 2003 2002
Cash flow from operating activities to assets 0.140 0.127 0.121
McDonald’s Corporation’s cash flow to assets ratio increased in 2003 and
360 Chapter 12
E12-10
Lucy’s Lockets
Desi’s Delights
2008
2007
2008
2007
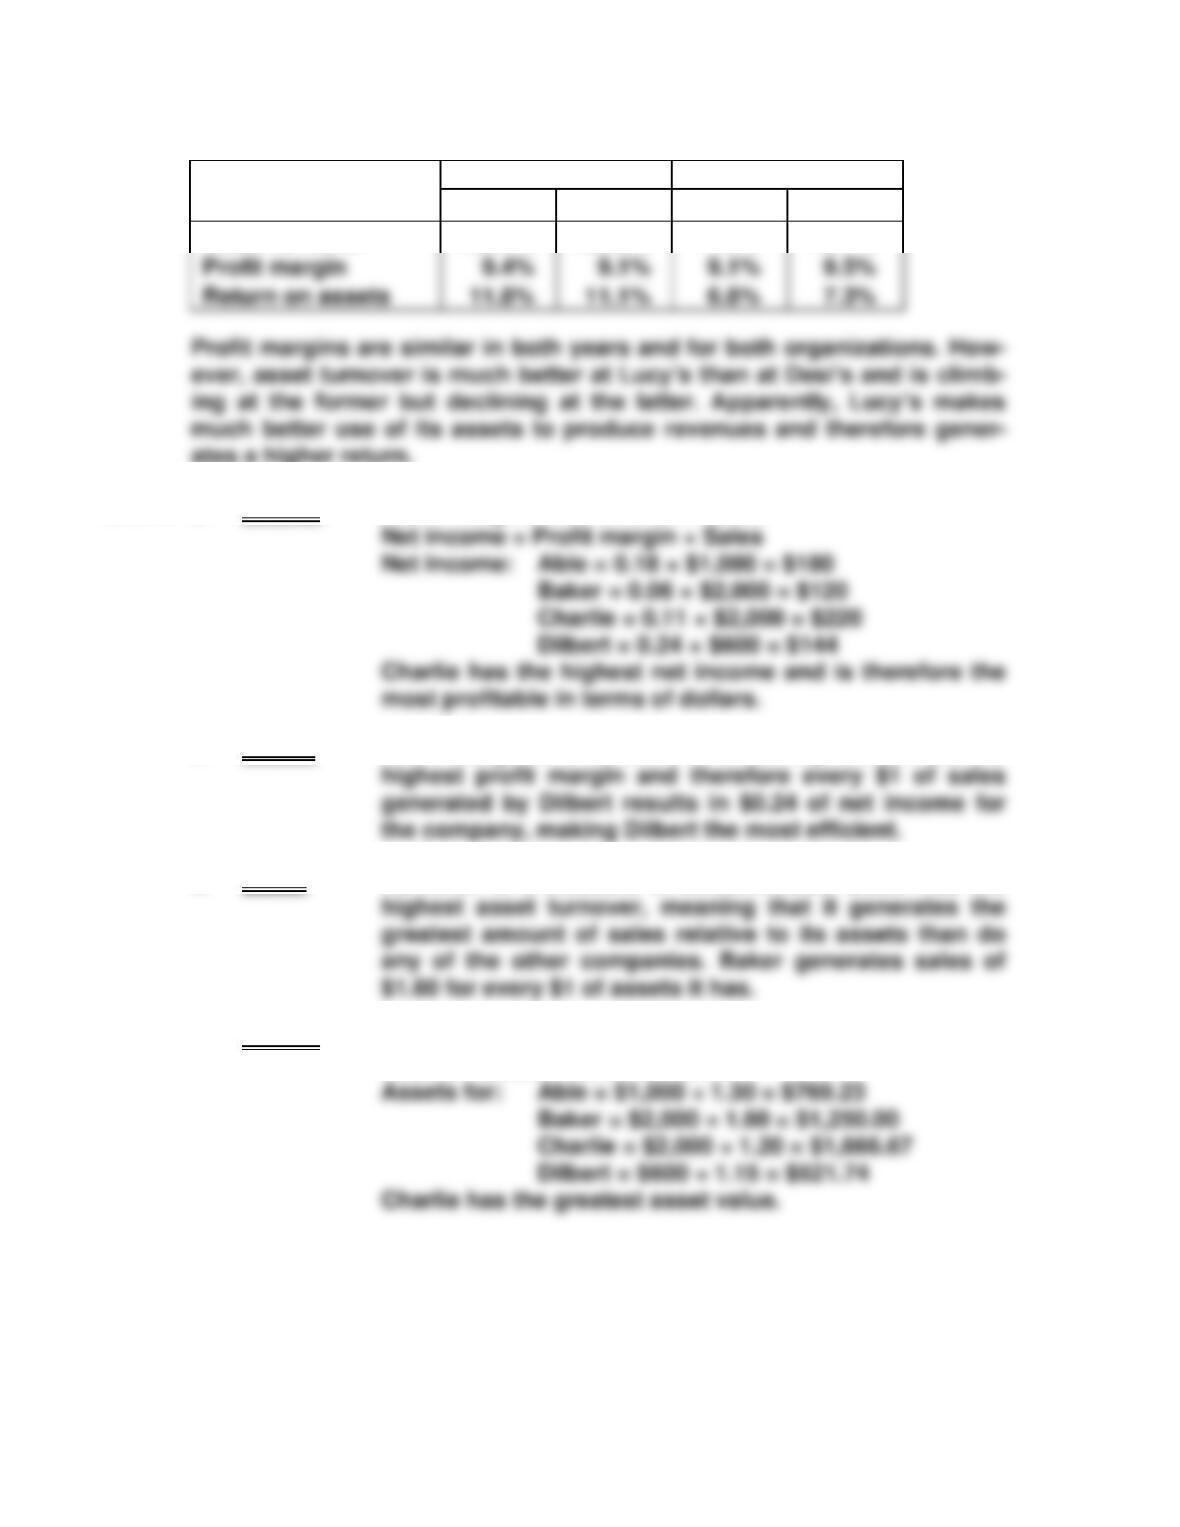
Asset turnover
126.0%
122.2%
74.3%
76.7%
ates a higher return.
E12-11 a. Charlie Profit margin = Net income ÷ Sales
b. Dilbert Profit margin is a measure of efficiency. Dilbert has the
c. Baker Turnover is a measure of effectiveness. Baker has the
d. Charlie Asset turnover = Sales ÷ Assets
Assets = Sales ÷ Asset turnover
Analysis of Investing Activities 361
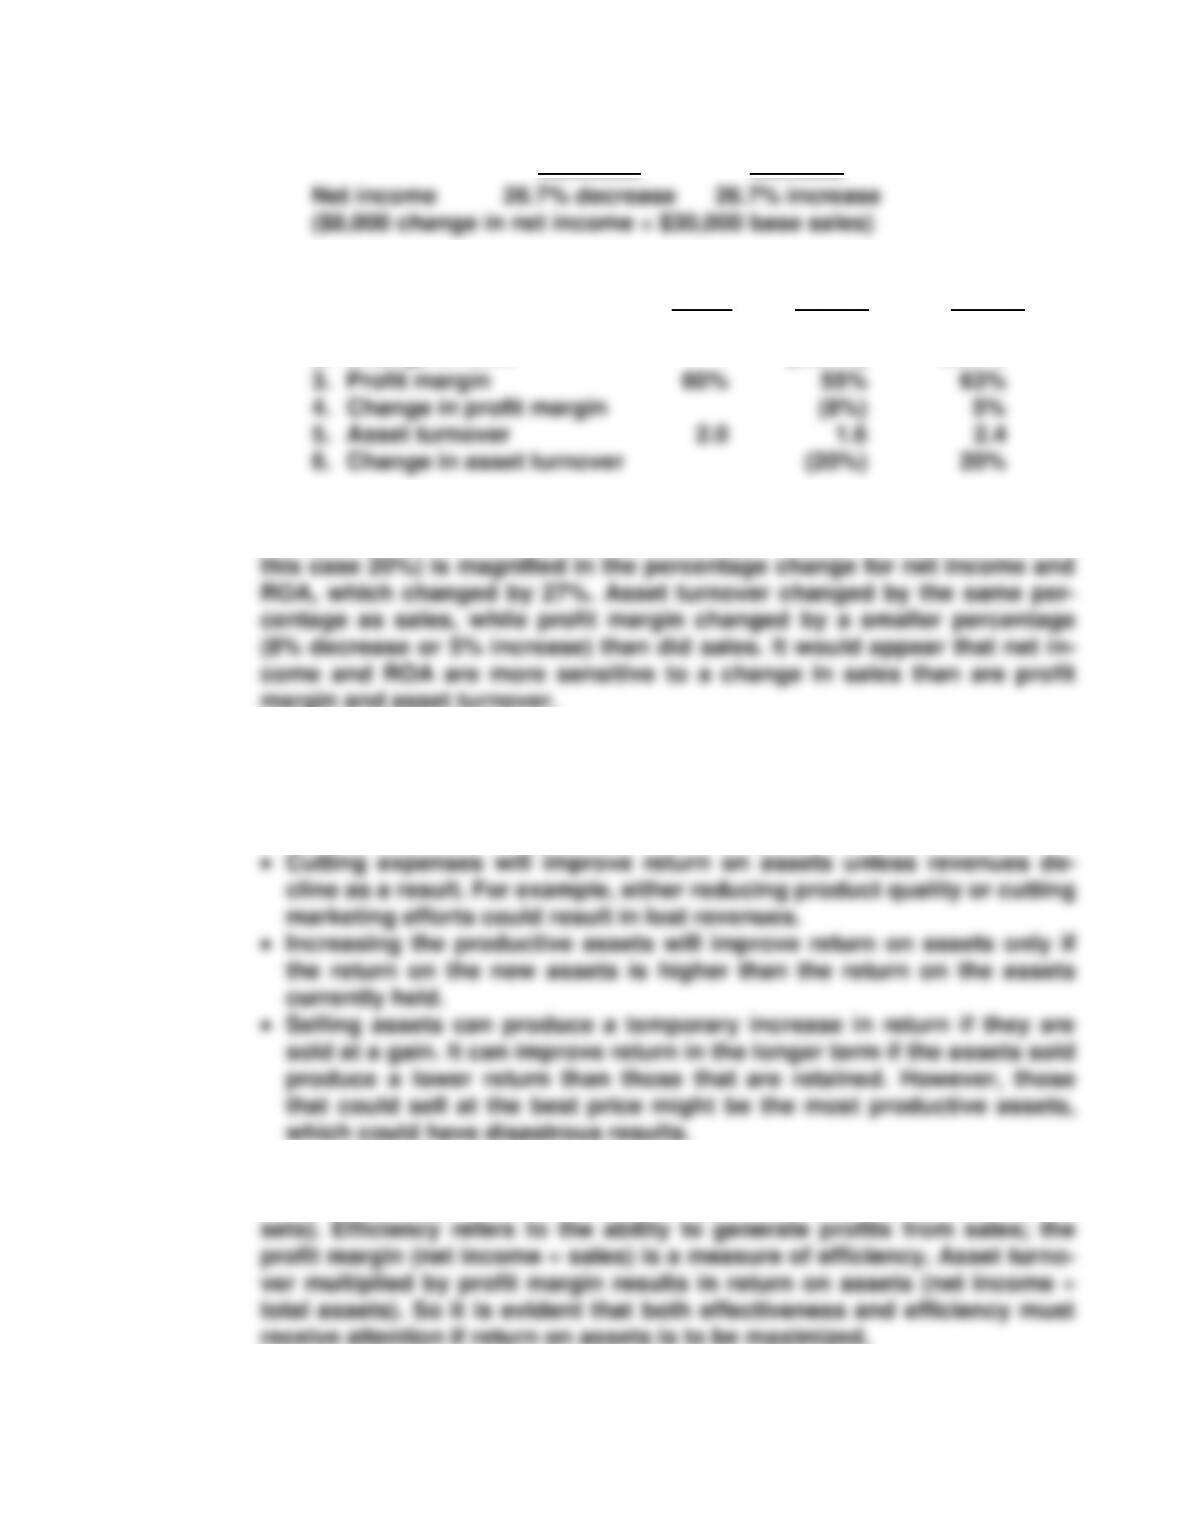
E12-12 a. 20% Sales 20% Sales
Decrease Increase
b. Current Decrease Increase
Sales of 20% of 20%
1. ROA 1.2 0.88 1.52
2. Change in ROA (26.7%) 26.7%
If sales change, then net income, ROA, profit margin, and asset turnover
change in the same direction. However, a percentage change in sales (in
E12-13 Each strategy could have a positive effect on return on assets. In the right
combination with other factors, each also has its risks as follows:
• Increased sales without an increase in assets will improve return on
assets unless the increase causes more expenses than revenues.
E12-14 Effectiveness refers to a company’s ability to use its assets to generate
sales; it can be measured by calculating asset turnover (sales total as-
362 Chapter 12
E12-15 Return-related ratios with and without the new product line can be calcu-
lated as follows:
Last Year
Pro Forma
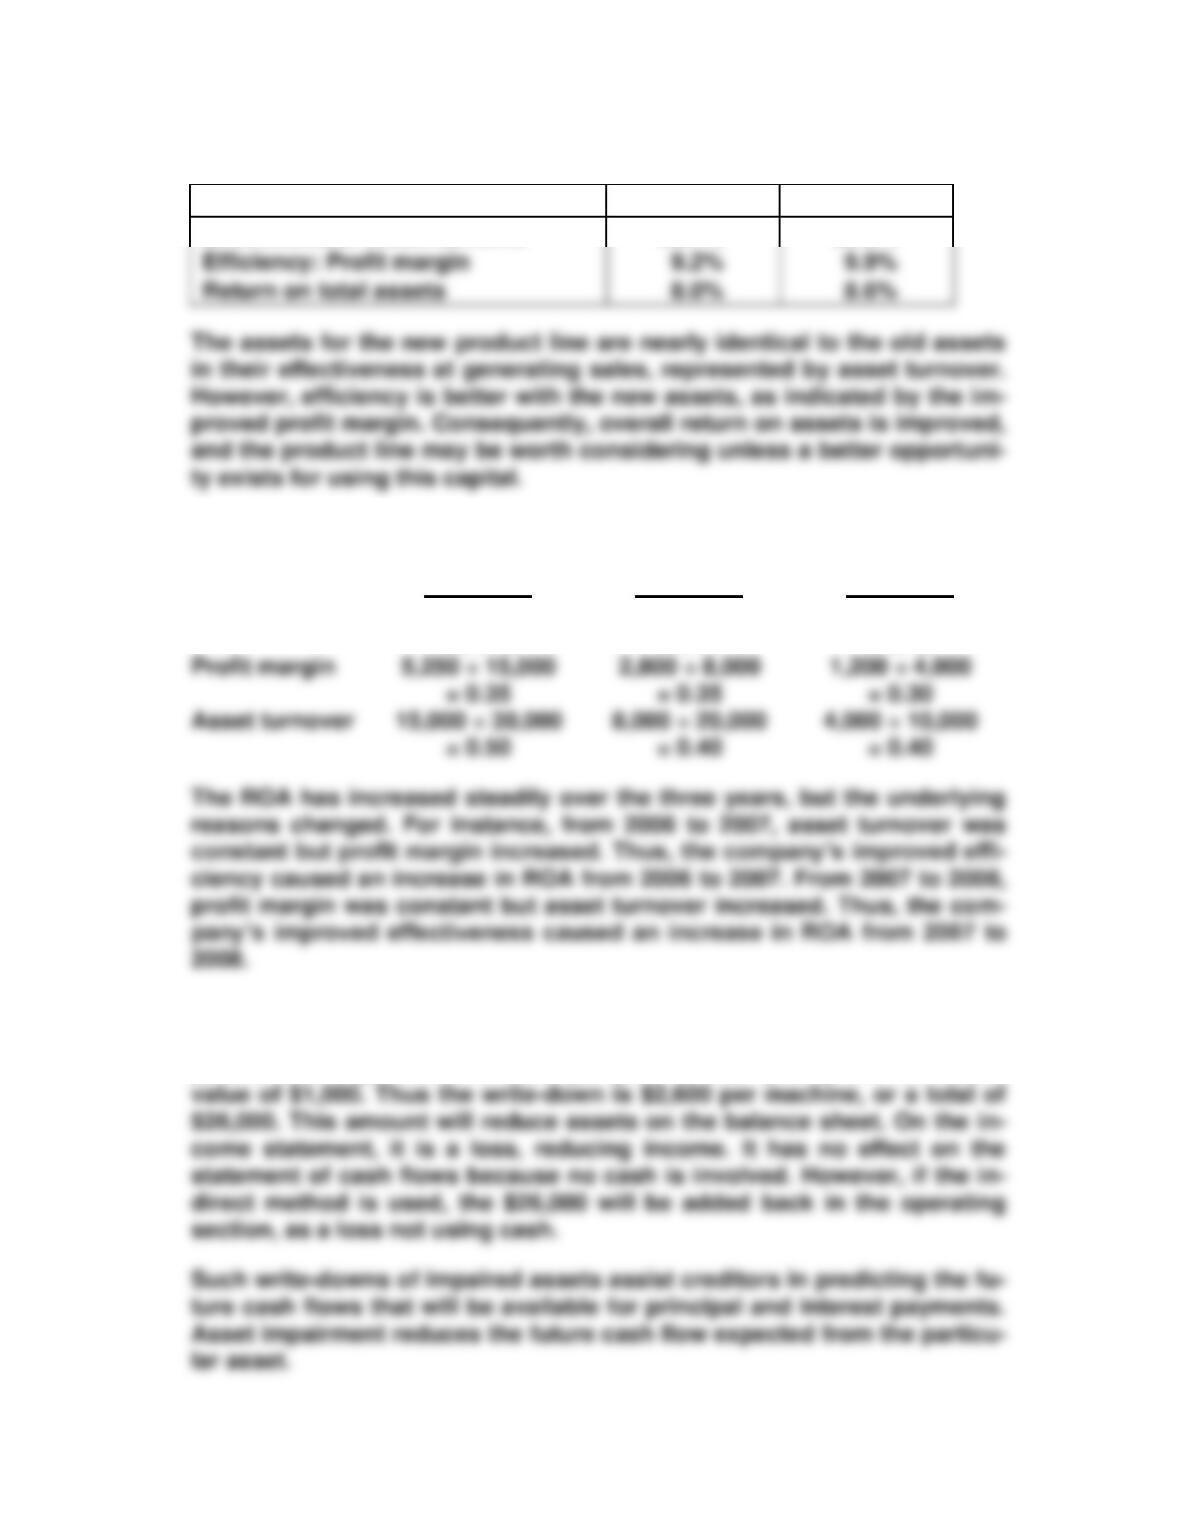
Effectiveness: Asset turnover
86.7%
86.6%
E12-16
Year 2008
Year 2007
Year 2006
ROA
5,250 ÷ 30,000
= 0.175
2,800 ÷ 20,000
= 0.14
1,200 ÷ 10,000
= 0.12
Profit margin
5,250 ÷ 15,000
E12-17 These impaired assets should be written down to their current market
value. The amount involved for each machine is the book value of $3,600
($6,000 less depreciation of $600 per year for four years) less the resale
Analysis of Investing Activities 363
E12-18 Return on equity should increase because of decreased outstanding eq-
uity and decreased interest expense. However, if the reduced debt de-
creased leverage, this effect may not occur. The increase in cash flow
E12-19 Cash flow from operations has increased by 19% during the three-year
period [($3,195 − $2,688) ÷ ($2,688)]. It appears that the investing activities
have been successful in generating additional operating cash flow.
At this point, cash flow from operating activities is sufficient to cover in-
vesting and financing activities. In fact, 29% of the operating cash flow
364 Chapter 12
PROBLEMS
P12-1 (student name, address, date)
Ivan Steeger
1352 Bull Run Road
Milltown, OR 97111
Dear Ivan:
You asked about issues to consider in your decisions about equipment
for the new cookie business. Given your own background with small
businesses, I’m sure you already have a number of topics for discussion.
But I do have a few suggestions.
If you purchase the automated equipment, you will have higher operat-
ing leverage. Your fixed costs will be higher, but you will avoid the varia-
ble cost of employees used to shape cookies by hand. The automated
equipment could bring higher cash flow if sales are high. However, the re–
lated fixed costs would increase possible losses if revenues were small.
The larger-capacity equipment would take care of your projected sales
for several years, at a lower total price than a purchase of smaller equip-
ment now and additional equipment later. On the other hand, your risk of
Analysis of Investing Activities 365
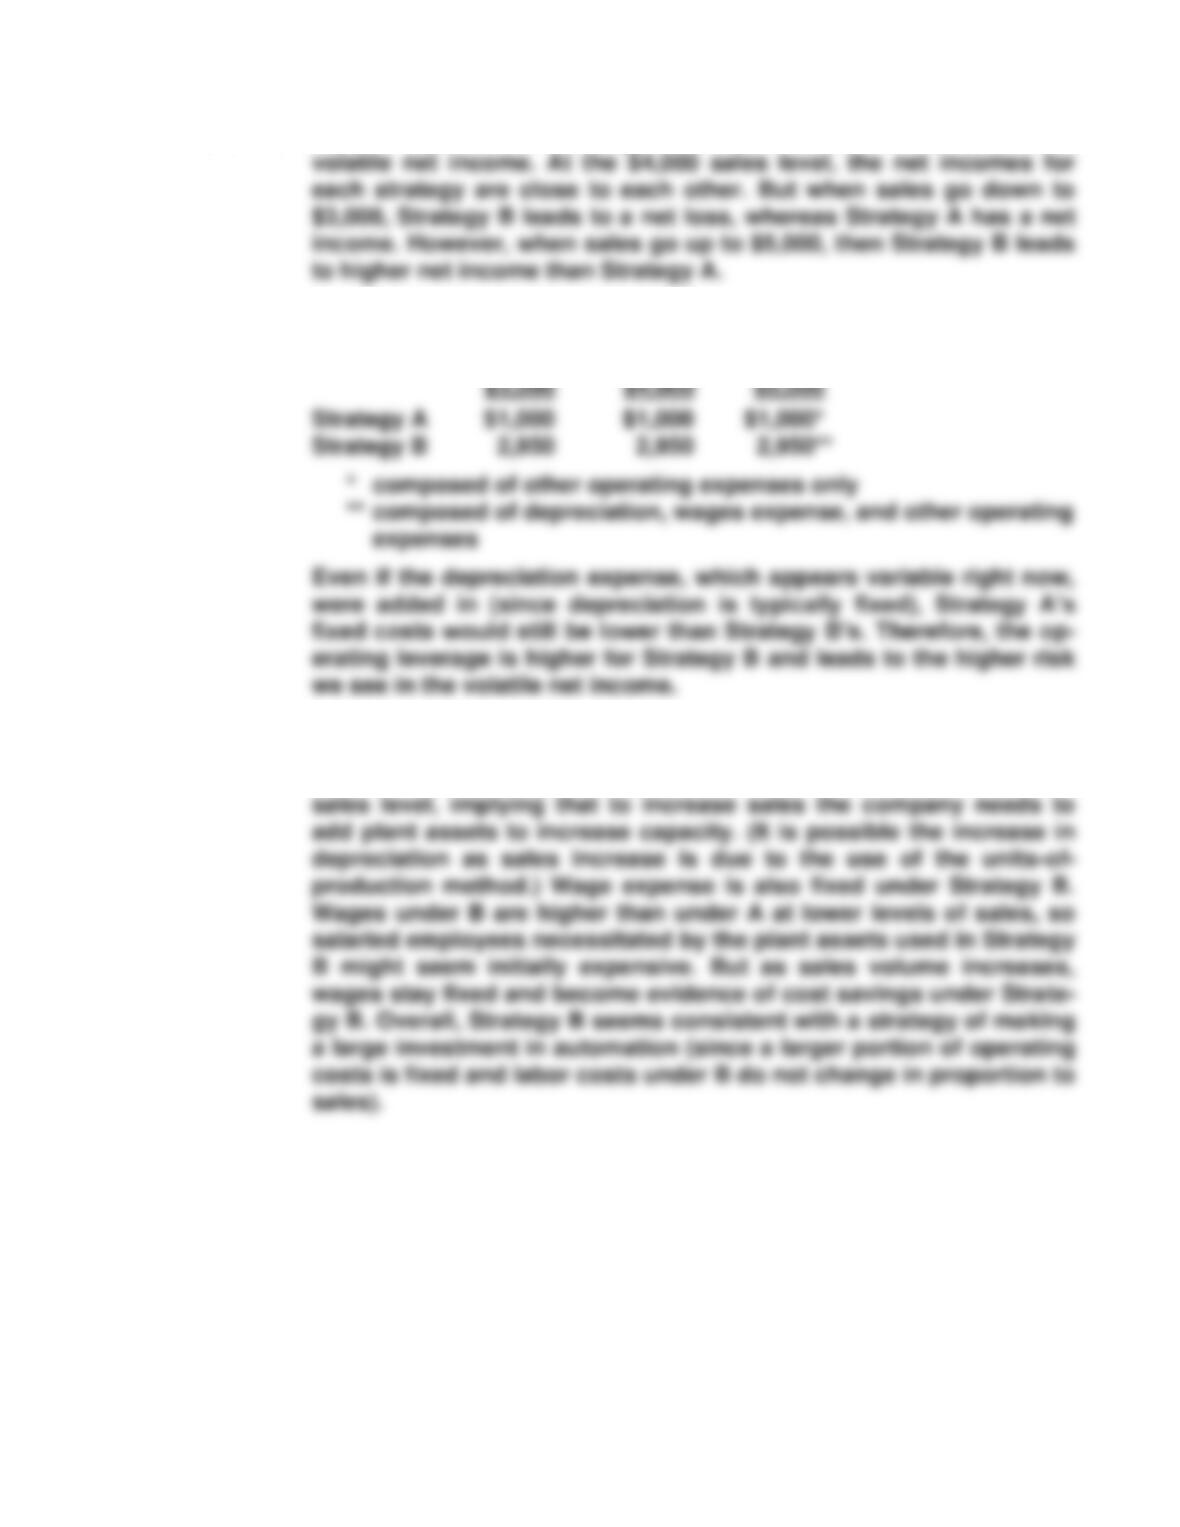
P12-2 A. Risk: It appears that Strategy B is riskier because it leads to more
B. Operating leverage: The apparent fixed costs are as follows:
Sales of Sales of Sales of
C. Investment strategy: It appears that Strategy B involves a greater
amount invested in plant assets, because depreciation is higher and
fixed. Under Strategy A, depreciation expense increases at each
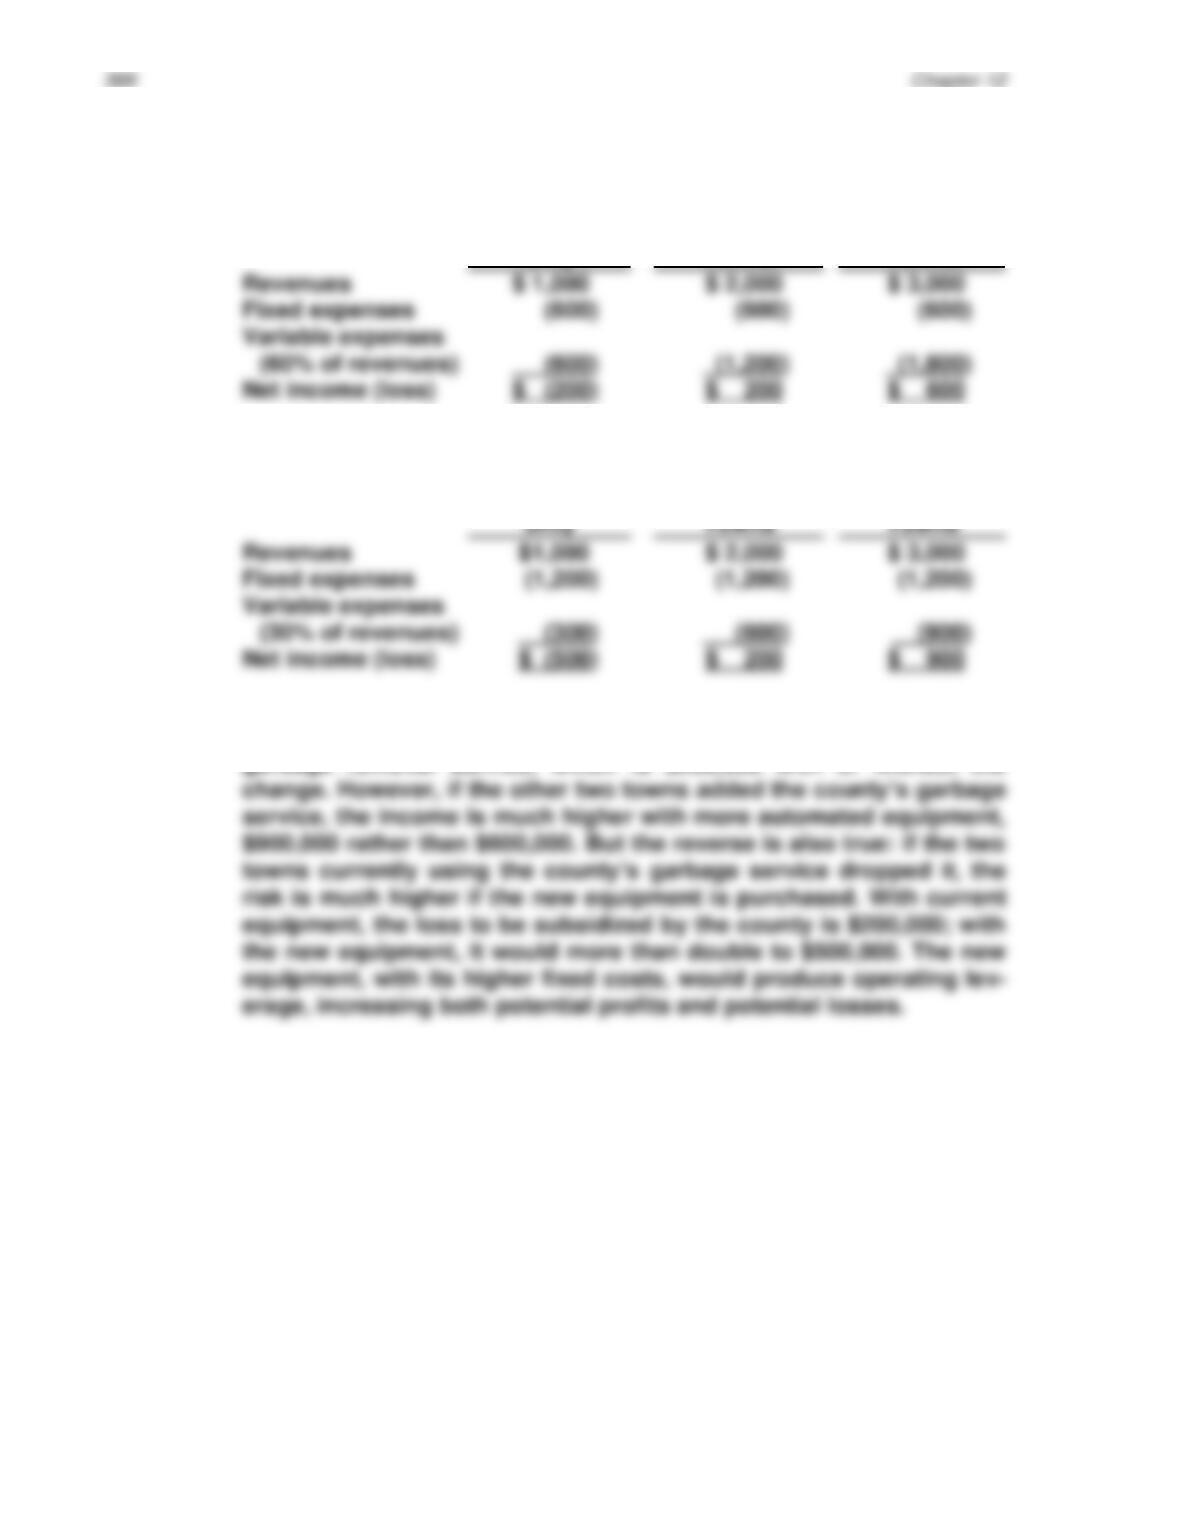
P12-3 (In thousands)
A.
Old equipment
Outlying
Rural Areas
Only
Outlying
Rural Areas
Plus Two
Towns
Outlying
Rural Areas
Plus Four
Towns
Revenues
$ 3,000
Fixed expenses
Net income (loss)
$ 600
B.
New equipment
Only
Revenues
$ 3,000
Fixed expenses
Net income (loss)
$ 900
Outlying
Rural Areas
Outlying
Rural Areas
Plus Two
Outlying
Rural Areas
Plus Four
C. In this case, under the current revenue conditions, changing to the
new equipment has no effect on the projected net income from the
garbage removal service, which is $200,000 with or without the
Analysis of Investing Activities 367
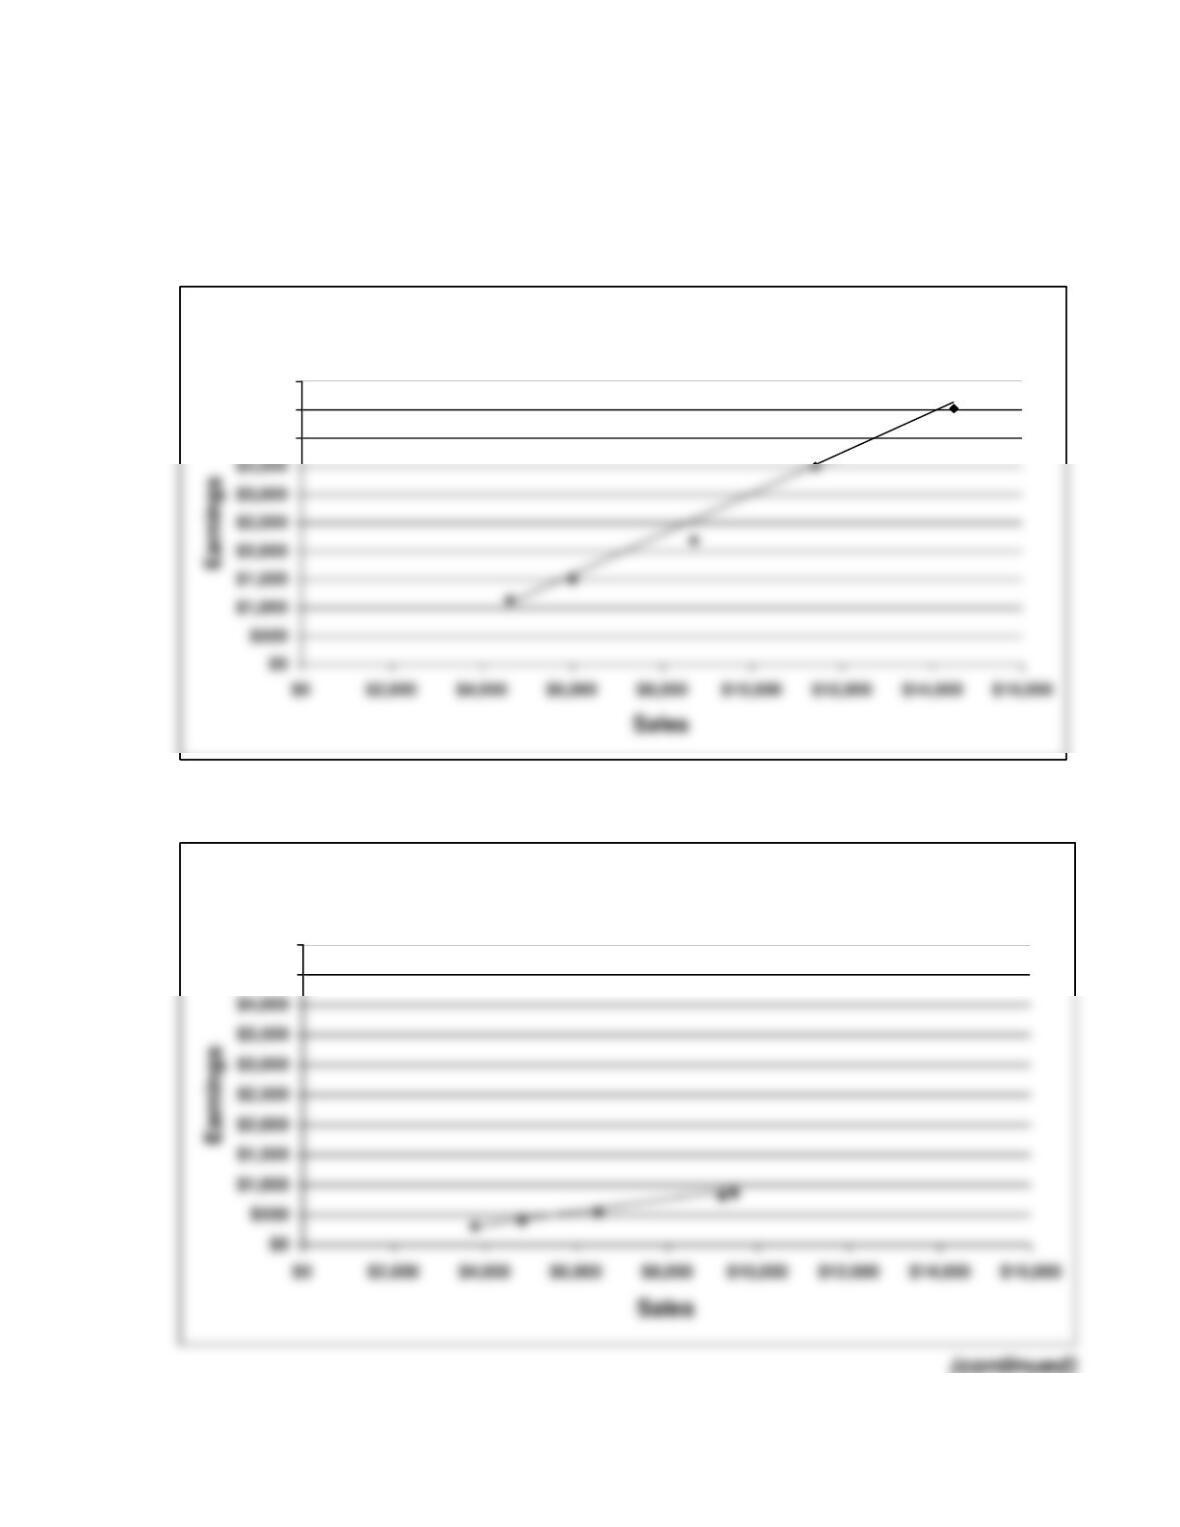
P12-4 A graph of the relationship between sales and earnings for each company
shows the following:
Solution Software, Inc.
$4,000
$4,500
$5,000
Fashion Clothing Co.
$4,500
$5,000