
Exercise 12-9 (continued)
2. Company A: The focus on new product design suggests an emphasis on
product innovation and a product leadership customer value proposition.
Company B: The focus on patent approval, patent protected sales, and
an interest in the customers’ perception of product leadership clearly
indicates a product leadership customer value proposition.
Company D: The focus on time and efficiency suggests an operational
excellence customer value proposition.

Exercise 12–10 (20 minutes)
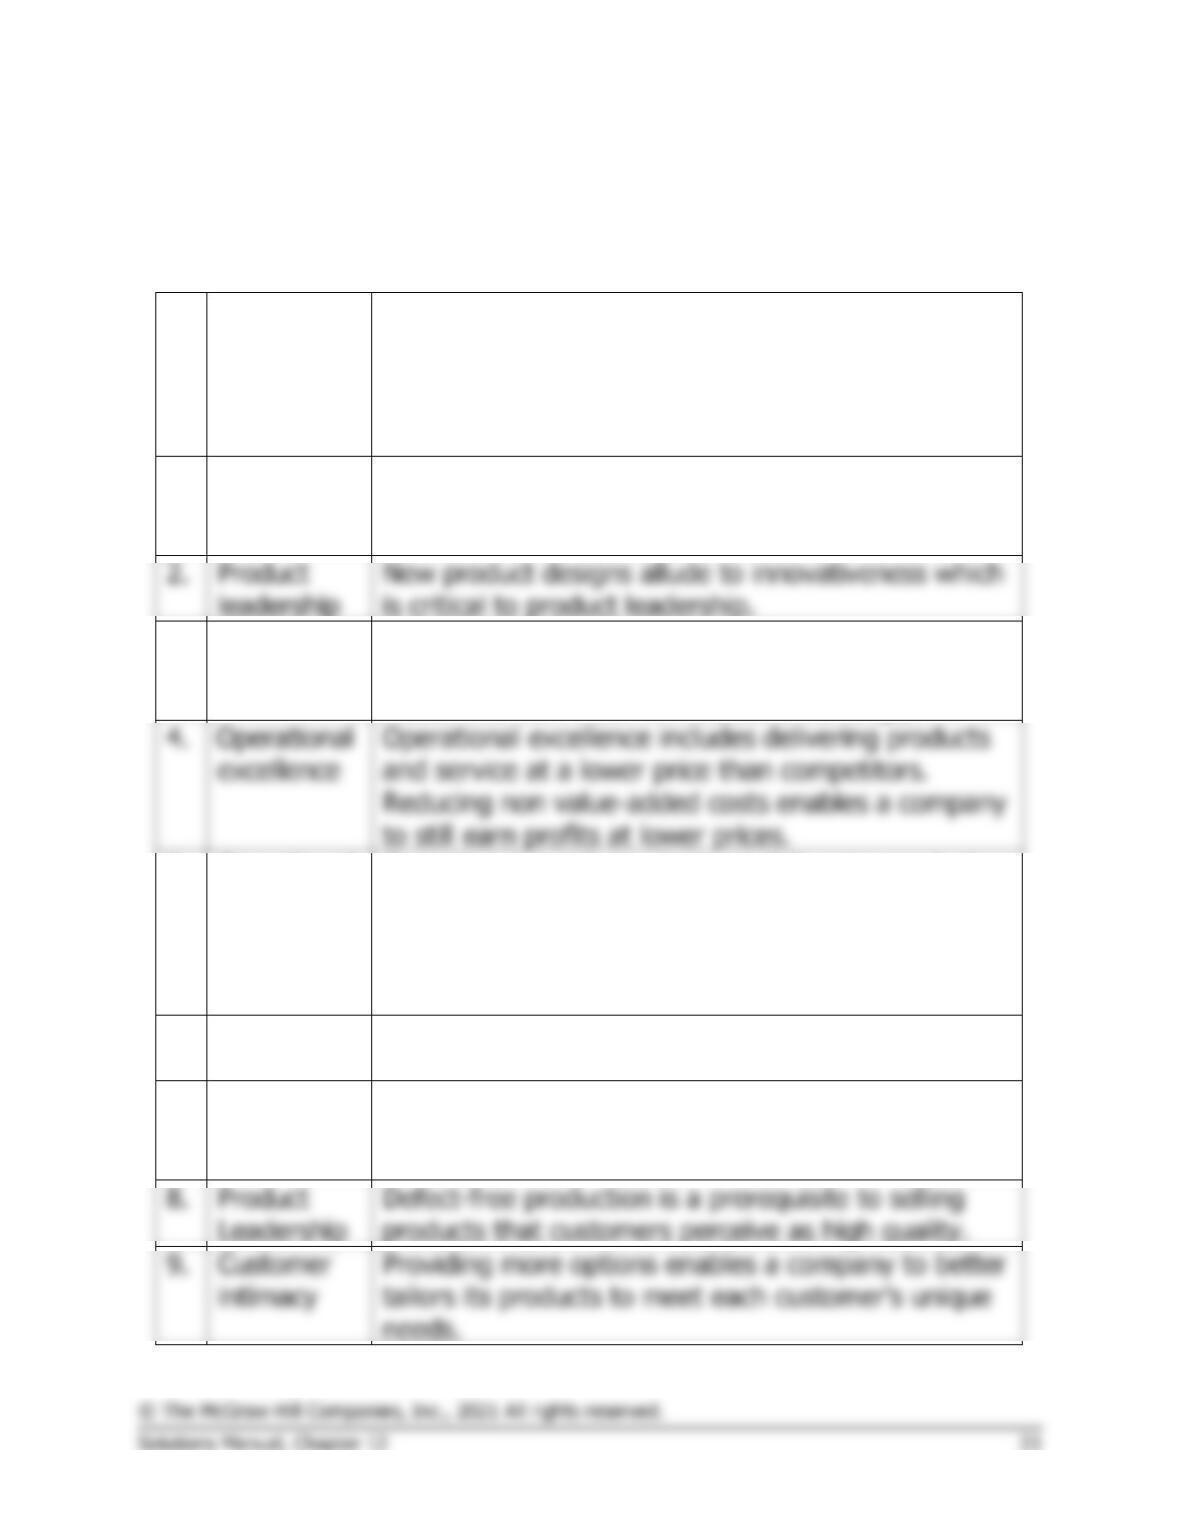
There are not absolute right and wrong answers to this question. The goal
is to have students express plausible explanations for their choices. The
Operational
Excellence
Product
Leadership
Customer
Intimacy
X
2.
Number of new products
designed (+) ………………..
X
3.
Average contact hours per
customer (+) ……………….
4.
Non-value-added activity
costs (–) ……………………..
X
5.
Percent of suppliers with
long-term contracts (+) ….
X
6.
Number of modular product
designs (+) ………………….
X
7.
Number of customized
8.
Defect-free units as a
9.
Number of options available
Exercise 12–10 (continued)
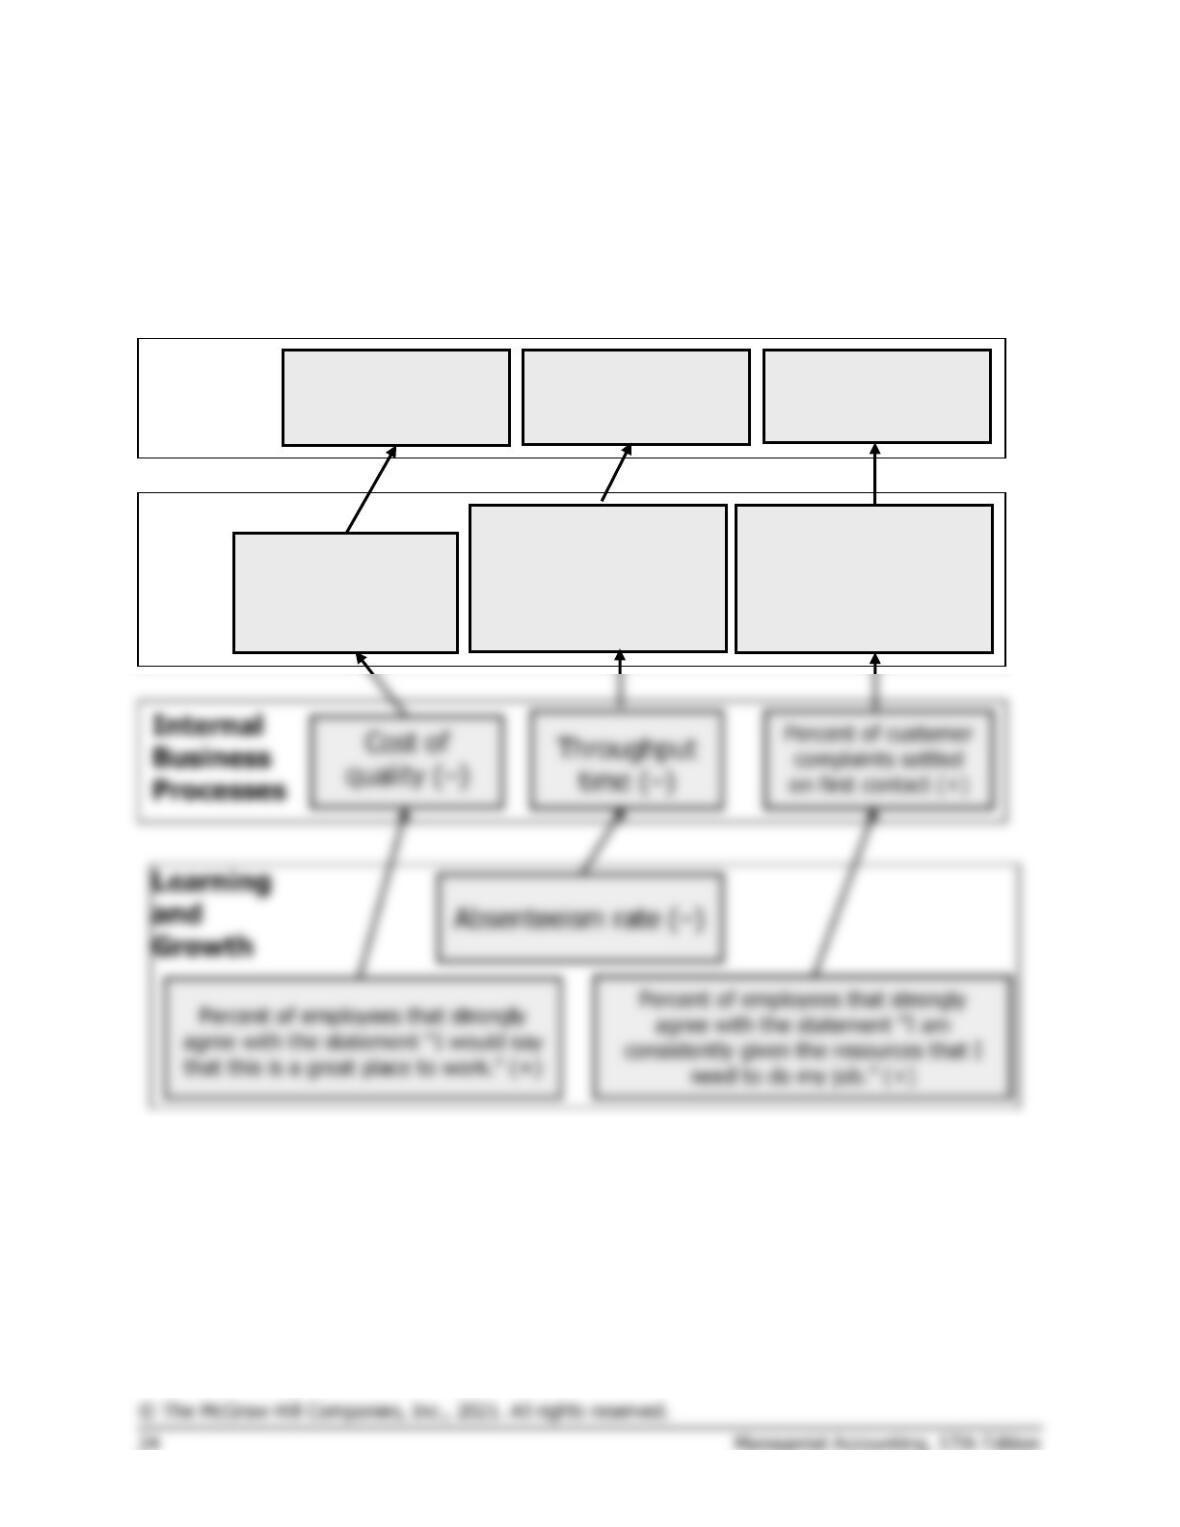
The explanations that justify the customer value proposition for each item
are as follows:
Customer
Value
Proposition
Explanation
1.
Operational
excellence
Operational excellence is about delivering products
and services faster than competitors. Delivery cycle
time is a time-based measure.
2.
Product
leadership
New product designs allude to innovativeness which
is critical to product leadership.
3.
Customer
intimacy
Increasing customer contact time enables a
company to learn more about its customers’ unique
needs and then tailor its outputs accordingly.
5.
Operational
excellence
Operational excellence is about delivering products
and services faster than competitors. Having long-
term, reliable suppliers decreases the likelihood of a
company experiencing delays in serving its
customers due to shortages in raw material inputs.
6.
Product
leadership
Modular product designs enable companies to more
readily configure innovative products.
7.
Customer
intimacy
Involving customers in the product design process
ensures that the tailored outputs will meet their
unique needs.
8.
Product
Leadership
Defect-free production is a prerequisite to selling
products that customers perceive as high quality.
Exercise 12–11 (30 minutes)
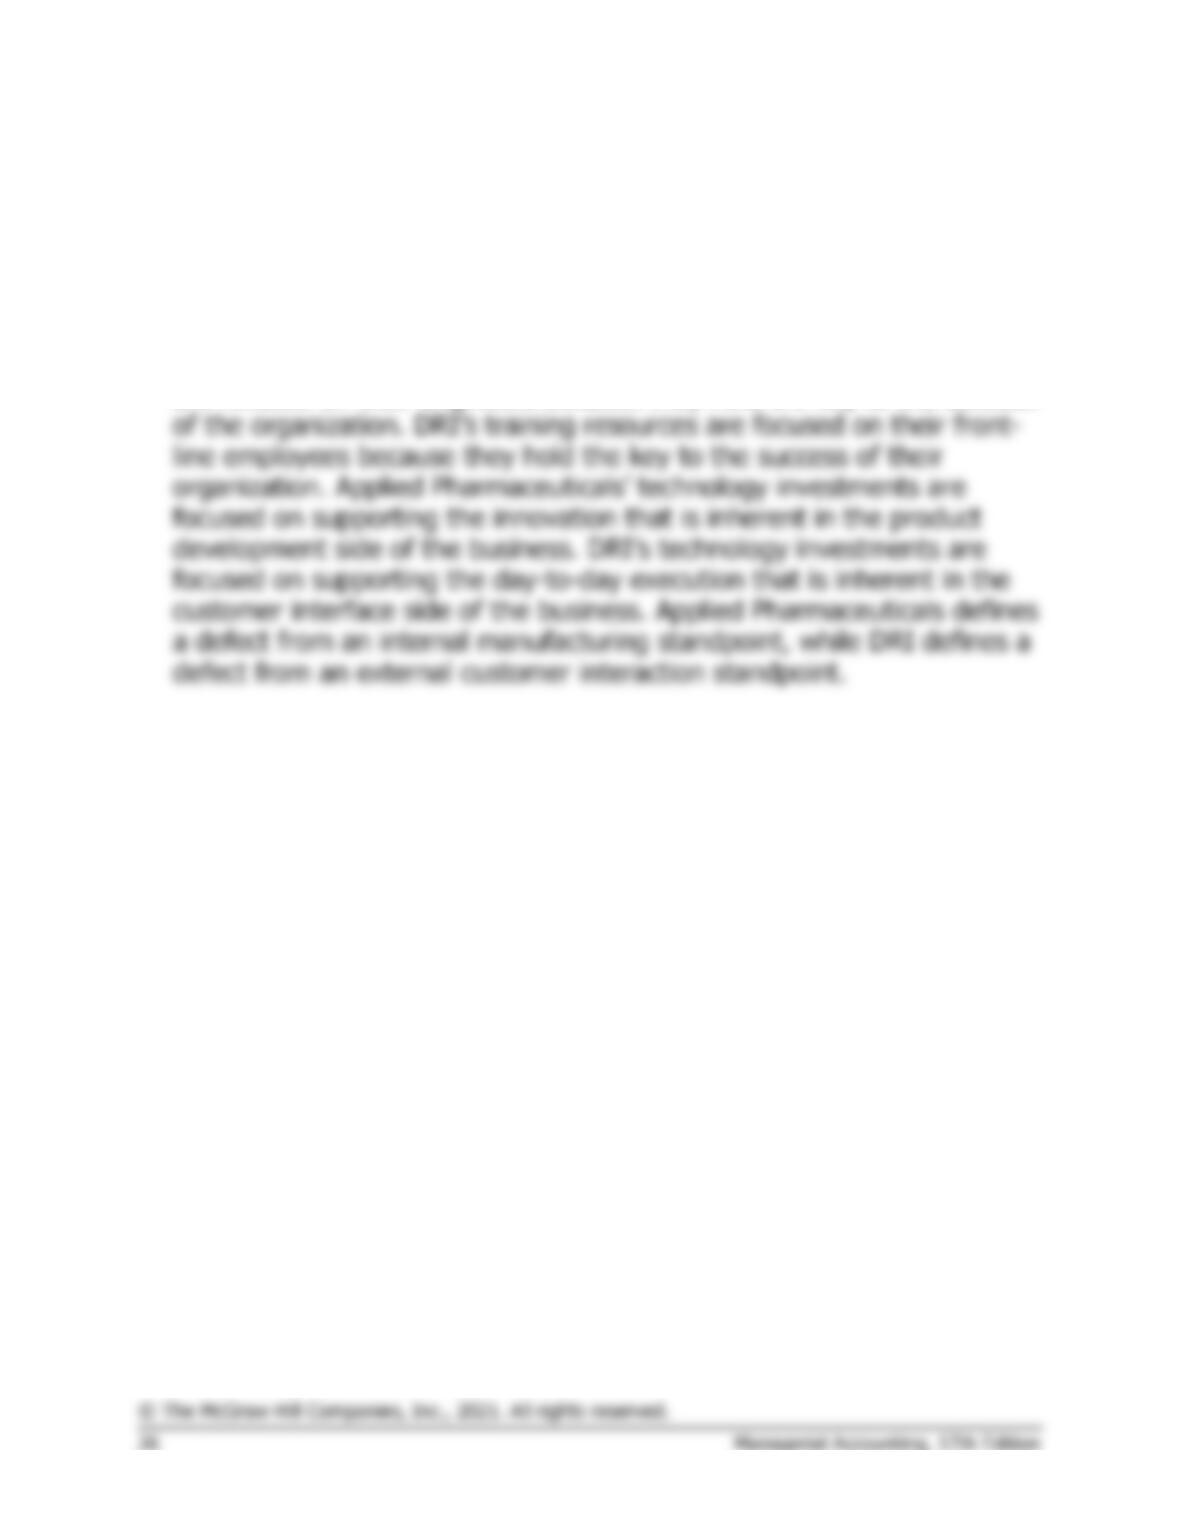
There are not absolute right and wrong answers to this question. The goal
is to have students express plausible explanations for their choices. The
solution shown below depicts one set of credible answers to requirements
1-3.
Gross margin
percentage (+)
Financial
Average gross
margin per
order (+)
Percent of customers
that strongly agree with
the statement “My
problem was resolved
quickly.” (+)
Customer
Customer
perception of
operational
excellence (+)
Net profit margin
percentage (+)
Net cash flow from
operating activities
(+)

Problem 12–12 (20 minutes)
1a. Utilization rate = Actual run time ÷ Machine time available
Utilization rate = 6,600 minutes ÷ 11,000 minutes
Utilization rate = 0.60
1d. OEE = Utilization rate × Efficiency rate × Quality rate
OEE = 0.60 × 0.85 × 0.70
OEE = 0.357
The answers to 2a through 2c are:
The supporting calculations are as follows:
Maximum possible output (11,000 × 6) (a) ………
66,000
Utilization loss [(11,000 – 6,600) × 6] …………….
26,400
Efficiency loss [(6 – 5.1) × 6,600] ………………….
5,940
Quality loss (33,660 – 23,562) ………………………
42,438
Defect-free output (b) …………………………………
Overall equipment effectiveness (b) ÷ (a) ………..
Problem 12–13 (90 minutes)
1. Both companies view training as important; both companies need to
leverage technology to succeed in the marketplace; and both companies
are concerned with minimizing defects. There are numerous differences
between the two companies. For example, Applied Pharmaceuticals is a
product-focused company and Destination Resorts International (DRI) is
a service-focused company. Applied Pharmaceuticals’ training resources
are focused on their engineers because they hold the key to the success
Problem 12–13 (continued)
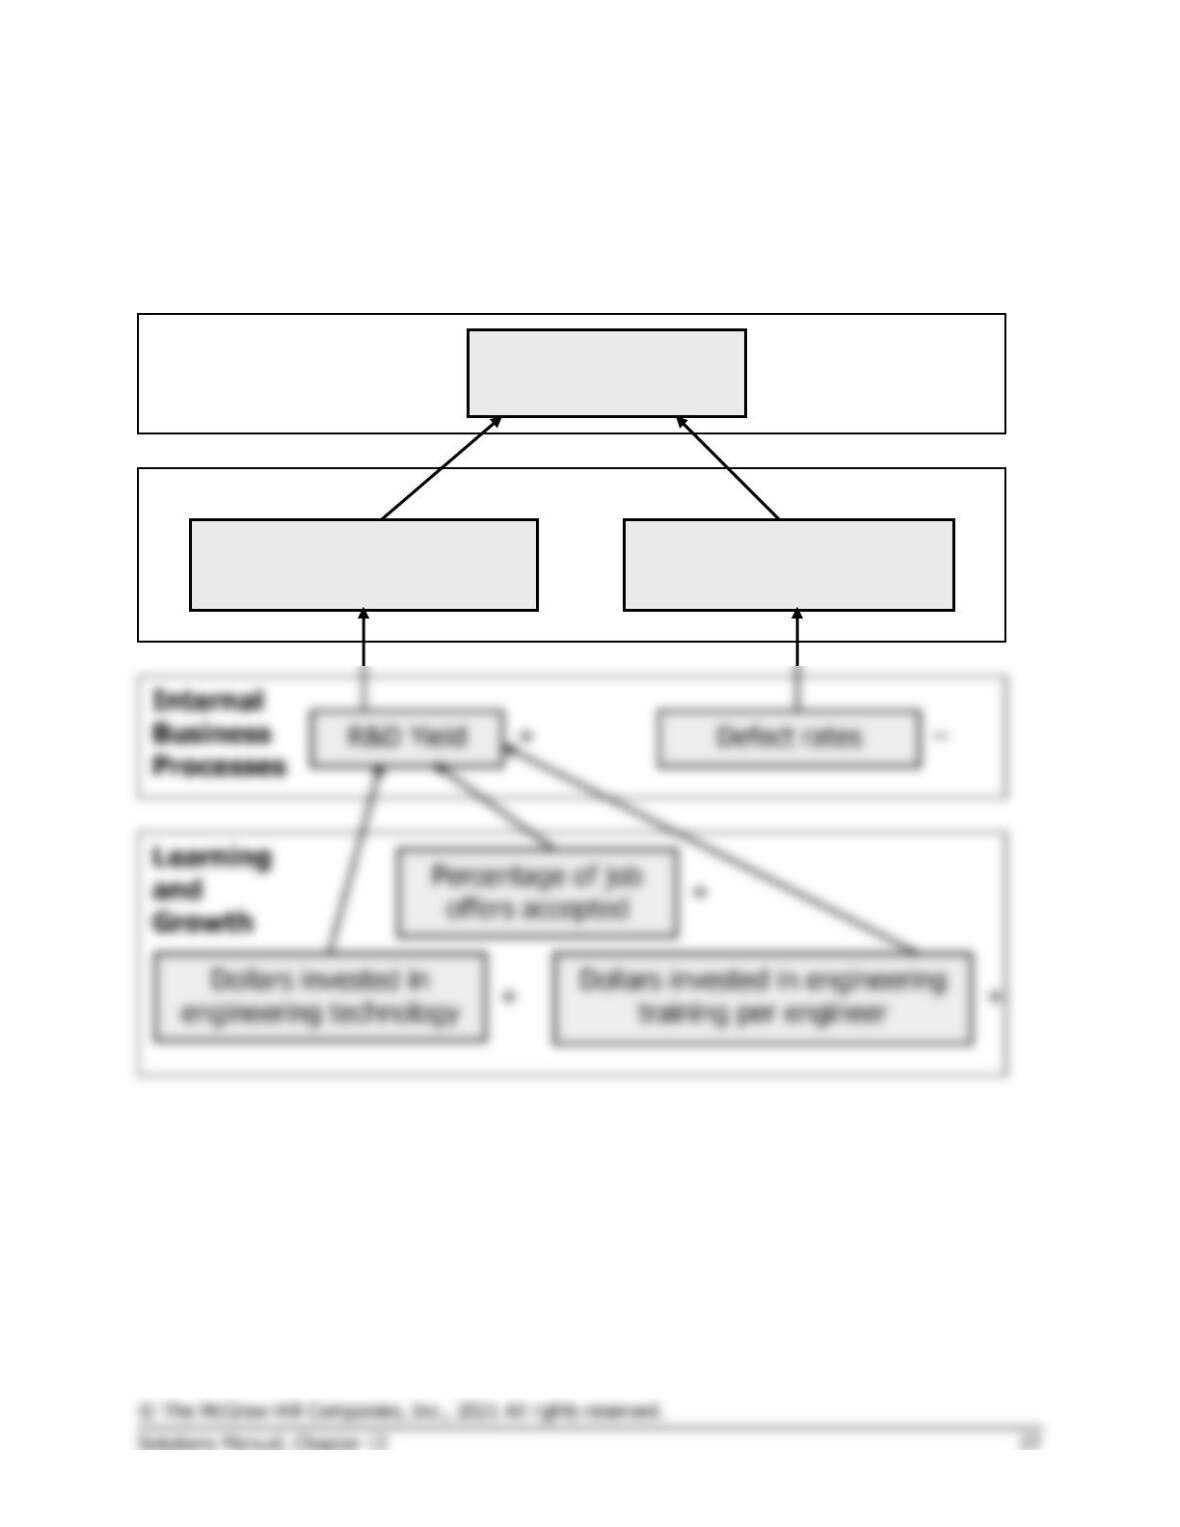
2. Students’ answers may differ in some details from this solution.
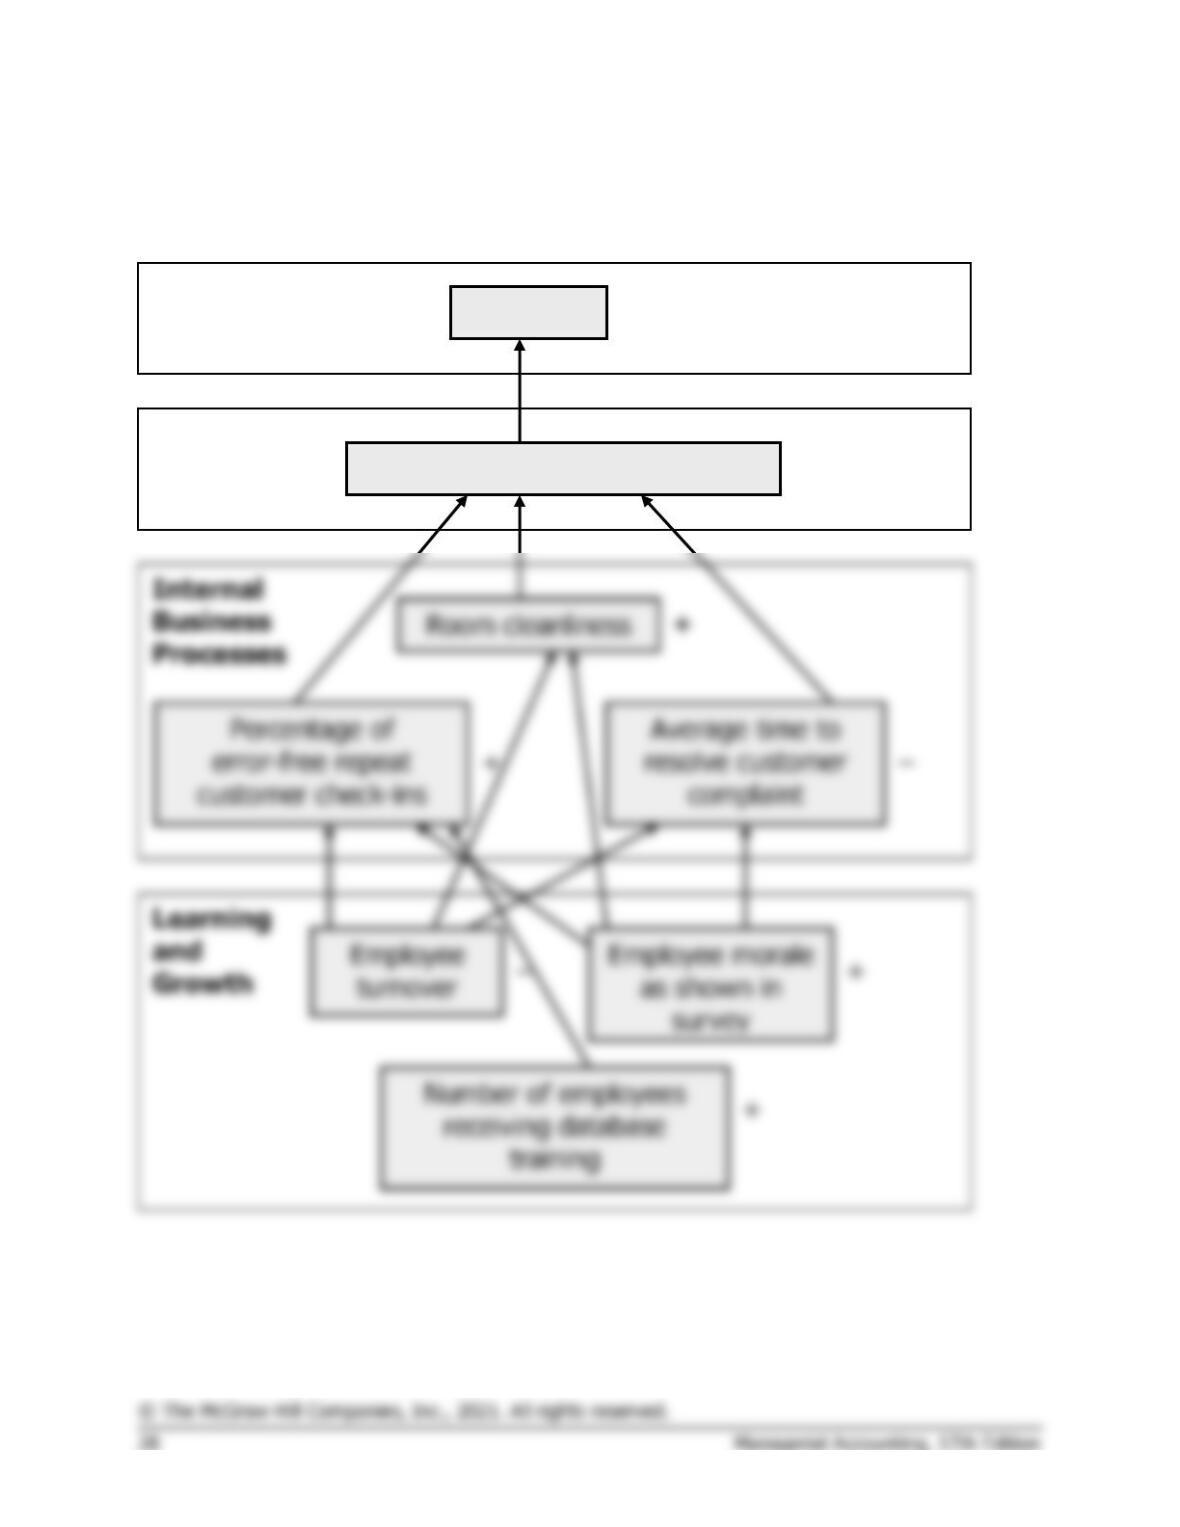
Applied Pharmaceuticals
Return on
Stockholders’ Equity
Financial
Customer perception of
first-to-market capability
Customer perception of
product quality
Customer
Dollars invested in engineering
+
+
+
+
+
+
+
Problem 12–13 (continued)
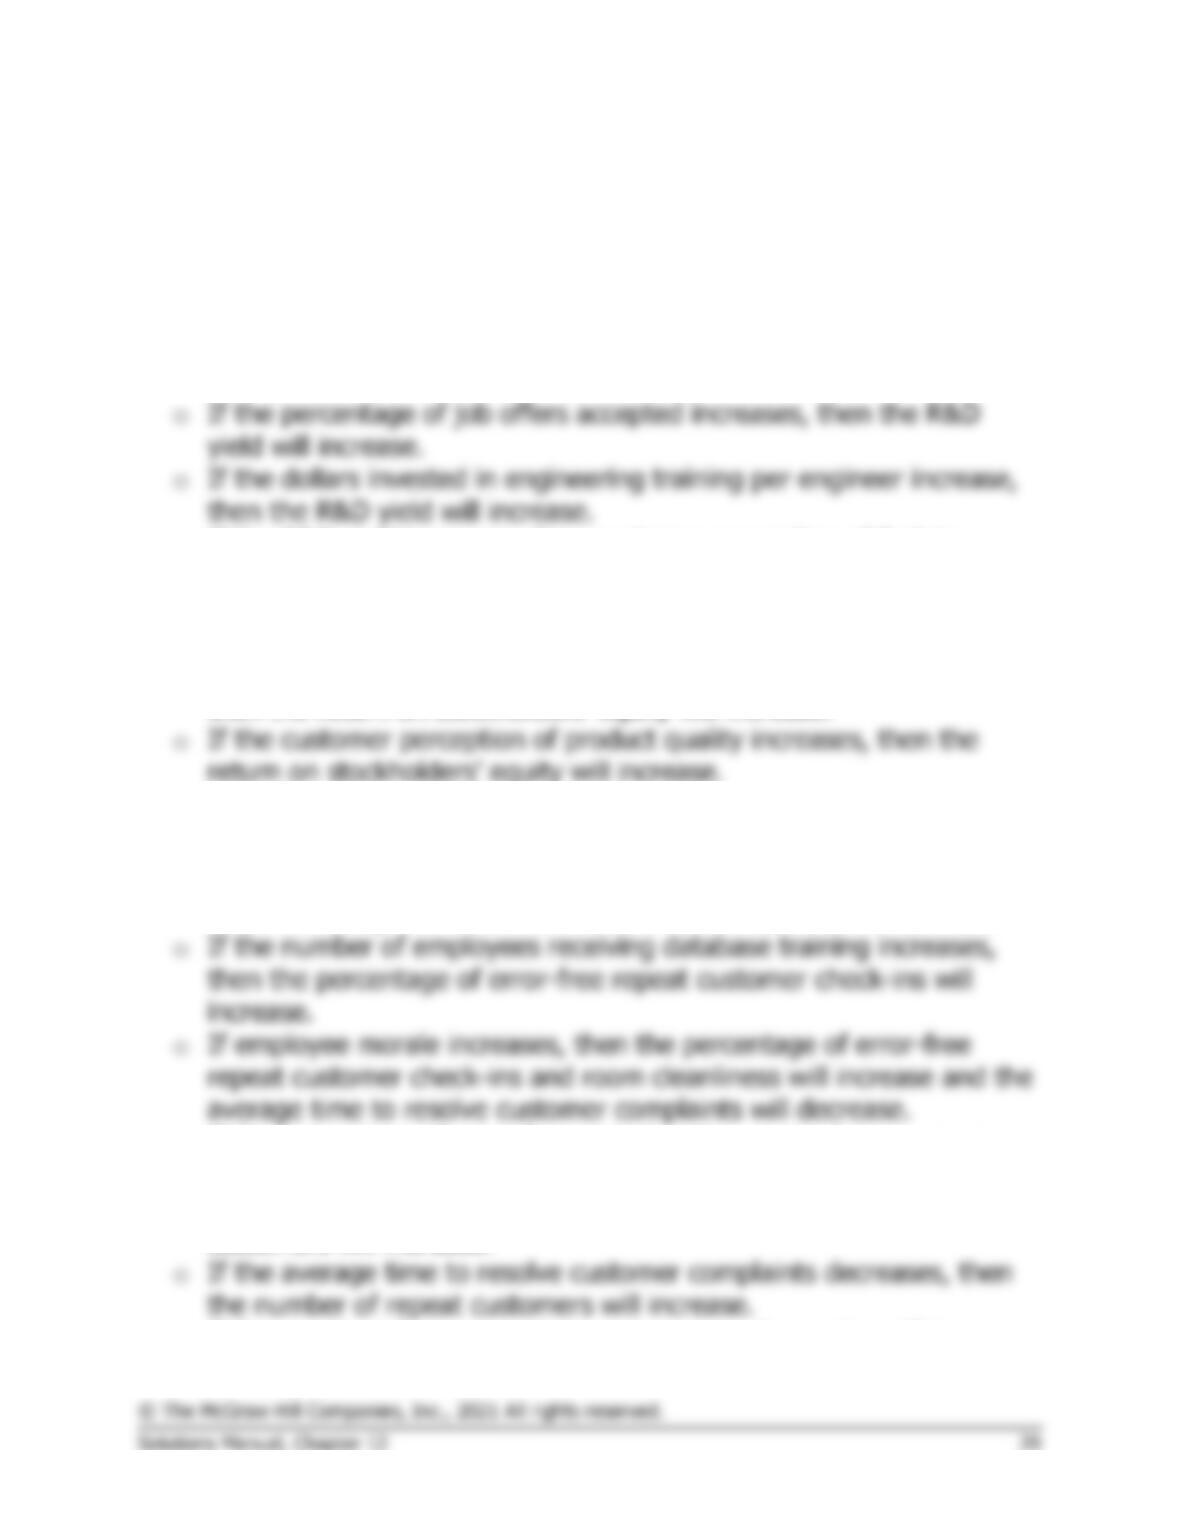
Destination Resorts International
Financial
Sales
+
Customer
+
Number of repeat customers
Problem 12–13 (continued)
3. The hypotheses underlying the balanced scorecards are indicated by the
arrows in each diagram. Reading from the bottom of each balanced
scorecard, the hypotheses are:
Applied Pharmaceuticals
o If the dollars invested in engineering technology increase, then the
R&D yield will increase.
o If the R&D yield increases, then customer perception of first-to–
market capability will increase.
o If the defects per million opportunities decrease, then the customer
perception of product quality will increase.
o If the customer perception of first-to-market capability increases,
return on stockholders’ equity will increase.
Destination Resort International
o If the employee turnover decreases, then the percentage of error-
free repeat customer check-ins and room cleanliness will increase
and the average time to resolve customer complaints will decrease.
o If the percentage of error-free repeat customer check-ins increases,
then the number of repeat customers will increase.
o If the room cleanliness increases, then the number of repeat
o If the number of repeat customers increases, then sales will increase.

Problem 12–13 (continued)
Each of these hypotheses is questionable to some degree. For example,
in the case of Applied Pharmaceuticals, R&D yield is not the sole driver
of the customers’ perception of first–to-market capability. More
specifically, if Applied Pharmaceuticals experimented with nine possible
drug compounds in year one and three of those compounds proved to
be successful in the marketplace it would result in an R&D yield of 33%.
Problem 12–14 (45 minutes)
The answers below are not the only possible answers. Ingenious people
can figure out many different ways of making performance look better
even though it really isn’t. This is one of the reasons for a
balanced
scorecard
. By having a number of different measures that ultimately are
linked to overall financial goals, “gaming” the system is more difficult.
1. Speed-to-market can be improved by taking on less ambitious projects.
Instead of working on major product innovations that require a great
2. In this case, the ground crews raced from one arriving airplane to
another in an effort to unload luggage from these airplanes as soon as
possible. However, once the luggage was unloaded from the airplane it
3. In real life, the production manager simply added several weeks to the
delivery cycle time. In other words, instead of promising to deliver an

Problem 12–14 (continued)
4. As stated above, ratios can be improved by changing either the
numerator or the denominator. Managers who are under pressure to
increase the revenue per employee may find it easier to eliminate
employees than to increase revenues. Of course, eliminating employees
may reduce total revenues and total profits, but the revenue per
employee will increase as long as the percentage decline in revenues is
less than the percentage cut in number of employees. Suppose, for
Before eliminating
the business unit
After eliminating
the business unit
Total revenue …………….
Total profits ………………
Problem 12-15 (30 minutes)
1. a., b., and c.
Month
1
2
3
4
Throughput time in days:
Process time …………………………….
2.1
2.0
1.9
1.8
Inspection time …………………………
0.8
0.7
0.7
0.7
Move time ……………………………….
0.3
0.4
0.4
0.5
Queue time during production ……..
2.8
4.4
6.0
7.0
Total throughput time …………………
6.0
7.5
9.0
10.0
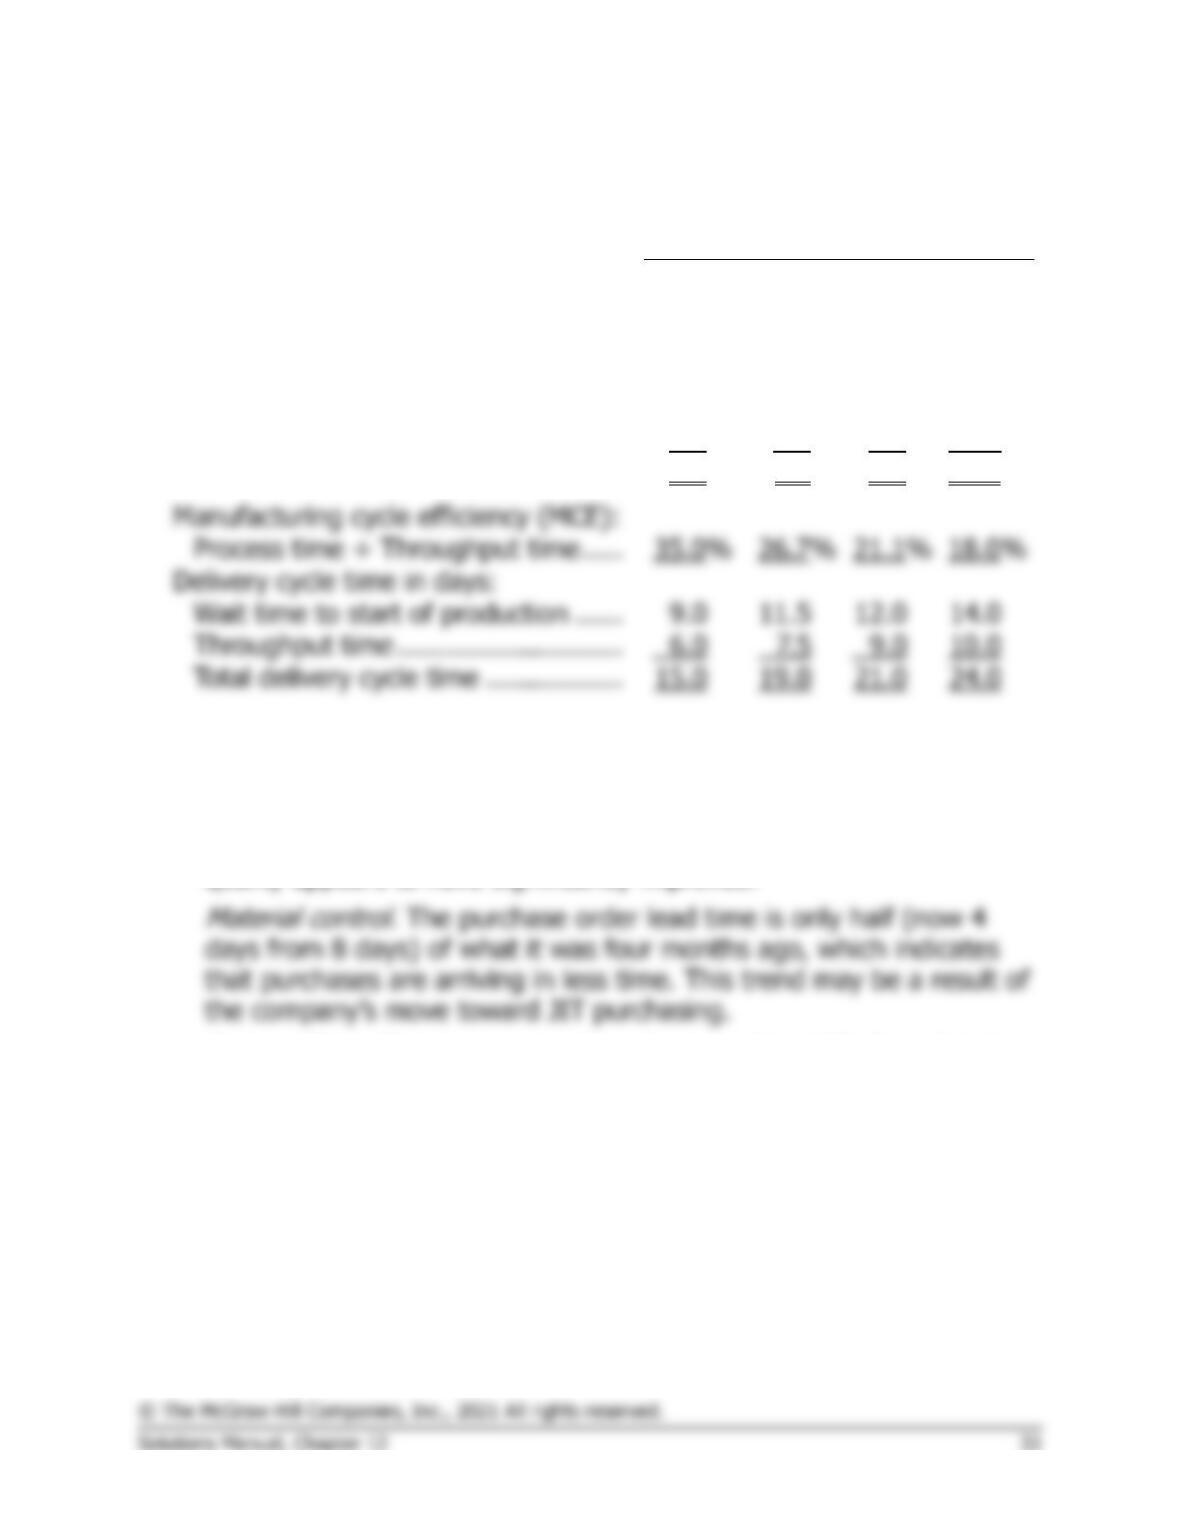
Manufacturing cycle efficiency (MCE):
Wait time to start of production ……
Throughput time ……………………….
Total delivery cycle time ……………..
2. a. Areas where the company is improving:
Quality control.
The number of defects has decreased by over 50%
(from 185 to 91) in the last four months. Moreover, both warranty
claims and customer complaints are down sharply. In short, overall
Process Time.
The process time has decreased by 14% from 2.1 days
to 1.8 days over the last four months.
Problem 12-15 (continued)
b. Areas of deterioration:
Material control.
Scrap as a percentage of total cost has tripled (from
1% to 3%) over the last four months.
Delivery performance.
All delivery performance measures are moving
in the wrong direction. Throughput time and delivery cycle time are
both increasing, and the manufacturing cycle efficiency is decreasing.
3. a. and b.
Month
5
6
Throughput time in days:
Process time ……………………………………
1.8
1.8
Inspection time ………………………………..
0.7
0.0
Move time ………………………………………
0.5
0.5
Queue time during production …………….
0.0
0.0
Total throughput time ……………………….
3.0
2.3
Manufacturing cycle efficiency (MCE):
Process time ÷ Throughput time………….
Problem 12-16 (45 minutes)
1. MPC’s previous manufacturing strategy was focused on high-volume
production of a limited range of paper grades. The goal of this strategy
was to keep the machines running constantly to maximize the number
of tons produced. Changeovers were avoided because they lowered
2. Employees focus on improving those measures that are used to evaluate
their performance. Therefore, strategically-aligned performance
measures will channel employee effort towards improving those aspects
of performance that are most important to obtaining strategic
Problem 12-16 (continued)
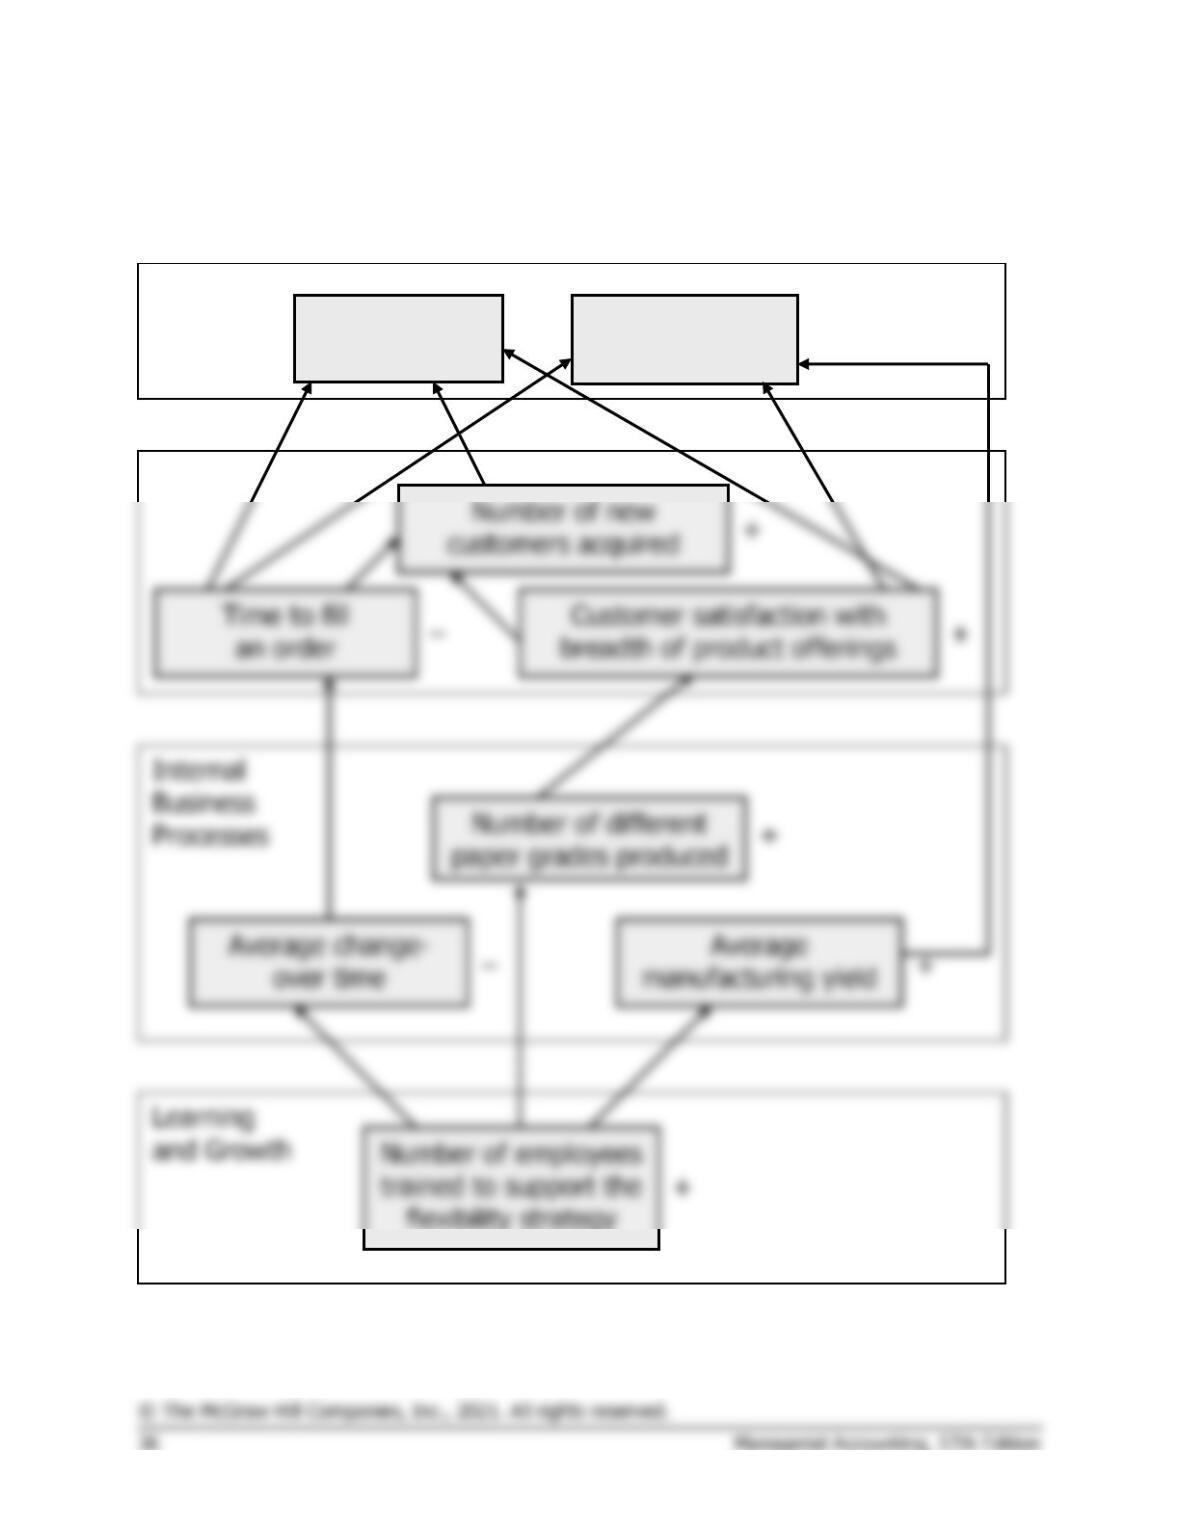
3. Students’ answers may differ in some details from this solution.
+
+
Sales
Contribution
margin per ton
Financial
Customer
+
+