CHAPTER 26 (FIN MAN); CHAPTER 12 (MAN)
CAPITAL INVESTMENT ANALYSIS
DISCUSSION QUESTIONS
1. The principal objections to the use of the average rate of return method are its failure to
consider the expected cash flows from the proposals and the timing of these flows.
2. The principal limitations of the cash payback method are its failure to consider cash flows
occurring after the payback period and its failure to use present value concepts.
4. A one-year payback will not equal a 100% average rate of return because the payback period
is based on cash flows, while the average rate of return is based on income. The depreciation
on the project will prevent the two methods from reconciling.
7. The $7,900 net present value indicates that the proposal is desirable because the proposal is
expected to recover the investment and provide more than the minimum rate of return.
9. The computations for the net present value method are more complex than those for the
methods that ignore present value. Also, the method assumes that the cash received from the
proposal during its useful life will be reinvested at the rate of return used to compute the
present value of the proposal. This assumption may not always be reasonable.
10. The computations for the internal rate of return method are more complex than those for the
methods that ignore present value. Also, the method assumes that the cash received from the
proposal during its useful life will be reinvested at the internal rate of return. This assumption
may not always be reasonable.
CHAPTER 26 (FIN MAN); CHAPTER 12 (MAN) Capital Investment Analysis
BASIC EXERCISES
BE 26–1 (FIN MAN); BE 12–1 (MAN)
Estimate average annual income
$117,000 ($936,000 ÷ 8 years)
BE 26–2 (FIN MAN); BE 12–2 (MAN)
8.8 years ($374,000 ÷ $42,500)
BE 26–3 (FIN MAN); BE 12–3 (MAN)
BE 26–4 (FIN MAN); BE 12–4 (MAN)
20%
[($463,565 ÷ $115,000) = 4.031, the present value of an annuity factor for nine
periods at 20%, from Exhibit 5]
BE 26–5 (FIN MAN); BE 12–5 (MAN)
a.
Present value of $50,000 per year at 12% for 8 years* ……………………..
$ 248,400
Present value of $8,000 at 12% at the end of 8 years** …………………….
3,232
CHAPTER 26 (FIN MAN); CHAPTER 12 (MAN) Capital Investment Analysis
EXERCISES
Ex. 26–1 (FIN MAN); Ex. 12–1 (MAN)
Project A
Project Z
Average annual income:
$57,600 ÷ 12 ………………………………………………………………………….
$ 4,800
$63,000 ÷ 15 ………………………………………………………………………….
$ 4,200
Average investment:
($55,000 + $5,000) ÷ 2 ……………………………………………………………
($50,000 + $6,000) ÷ 2 ……………………………………………………………
Average rate of return:
$4,800 ÷ $30,000 ……………………………………………………………………
$4,200 ÷ $28,000 ……………………………………………………………………
Ex. 26–2 (FIN MAN); Ex. 12–2 (MAN)
Average Rate Average Annual Income
=Average Investment
of Return
CHAPTER 26 (FIN MAN); CHAPTER 12 (MAN) Capital Investment Analysis
Ex. 26–3 (FIN MAN); Ex. 12–3 (MAN)
Average Rate Average Annual Income
=Average Investment
of Return
Ex. 26–4 (FIN MAN); Ex. 12–4 (MAN)
Year 1
Years 2–9
Last Year
Initial investment ………………………………………..
$(120,000)
Operating cash flows:
Annual revenues (5,000 units × $18) ………
$ 90,000
$ 90,000
$ 90,000
Selling expenses (3% × $90,000) ……………
(2,700)
(2,700)
(2,700)
CHAPTER 26 (FIN MAN); CHAPTER 12 (MAN) Capital Investment Analysis
Ex. 26–5 (FIN MAN); Ex. 12–5 (MAN)
Location 1: $975,000 ÷ $150,000 = 6.5-year cash payback period.
Location 2: 5-year cash payback period, as follows:
Net Cash
Flow
Cumulative
Net Cash
Flows
Year 1 ………………………………………………………………………………..
$275,000
$275,000
Ex. 26–6 (FIN MAN); Ex. 12–6 (MAN)
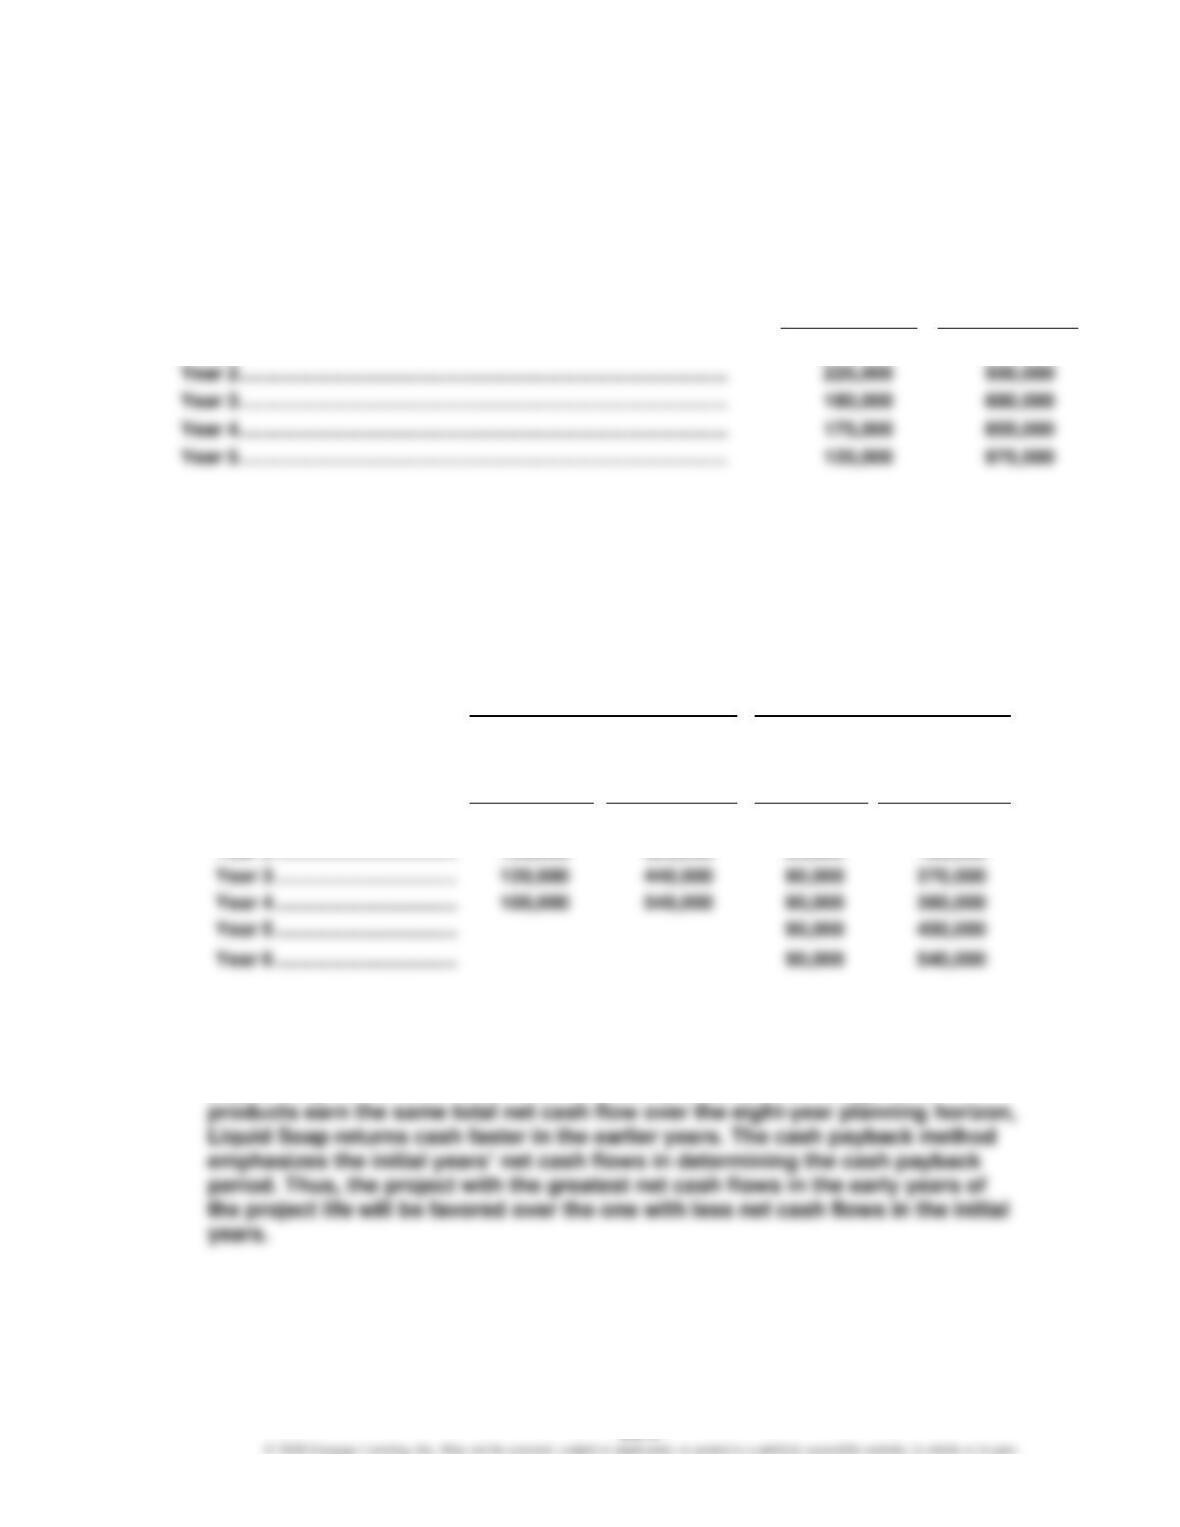
a. The Liquid Soap product line is recommended, based on its shorter cash
payback period. The cash payback period for both products can be determined
using the following schedule:
Initial investment: $540,000
Liquid Soap
Body Lotion
Cumulative
Cumulative
Net Cash
Net Cash
Net Cash
Net Cash
Flow
Flows
Flow
Flows
Year 1 …………………………….
$170,000
$170,000
$90,000
$ 90,000
Liquid Soap has a four-year cash payback period, and Body Lotion has a six-
year cash payback.
b. The cash payback periods are different between the two product lines because
Liquid Soap earns cash faster than does Body Lotion. Even though both
CHAPTER 26 (FIN MAN); CHAPTER 12 (MAN) Capital Investment Analysis
Ex. 26–7 (FIN MAN); Ex. 12–7 (MAN)
Present Value
Net Cash
Present Value of
a.
Year
of $1 at 15%
Flow
Net Cash Flow
1
0.870
$ 80,000
$ 69,600
b. Yes. The $24,520 net present value indicates that the return on the proposal is
greater than the minimum desired rate of return of 15%.
Ex. 26–8 (FIN MAN); Ex. 12–8 (MAN)
a.
20Y1
20Y2
20Y3
20Y4
20Y5
Revenues ………………………
$ 65,000
$ 65,000
$ 65,000
$ 65,000
$ 65,000
Net Cash Flow
Present Value
Present Value of
b.
Year
[from part (a)]
of $1 at 12%
Net Cash Flow
20Y1
$19,000
0.893
$ 16,967
20Y2
17,000
0.797
13,549
20Y4
13,000
0.636
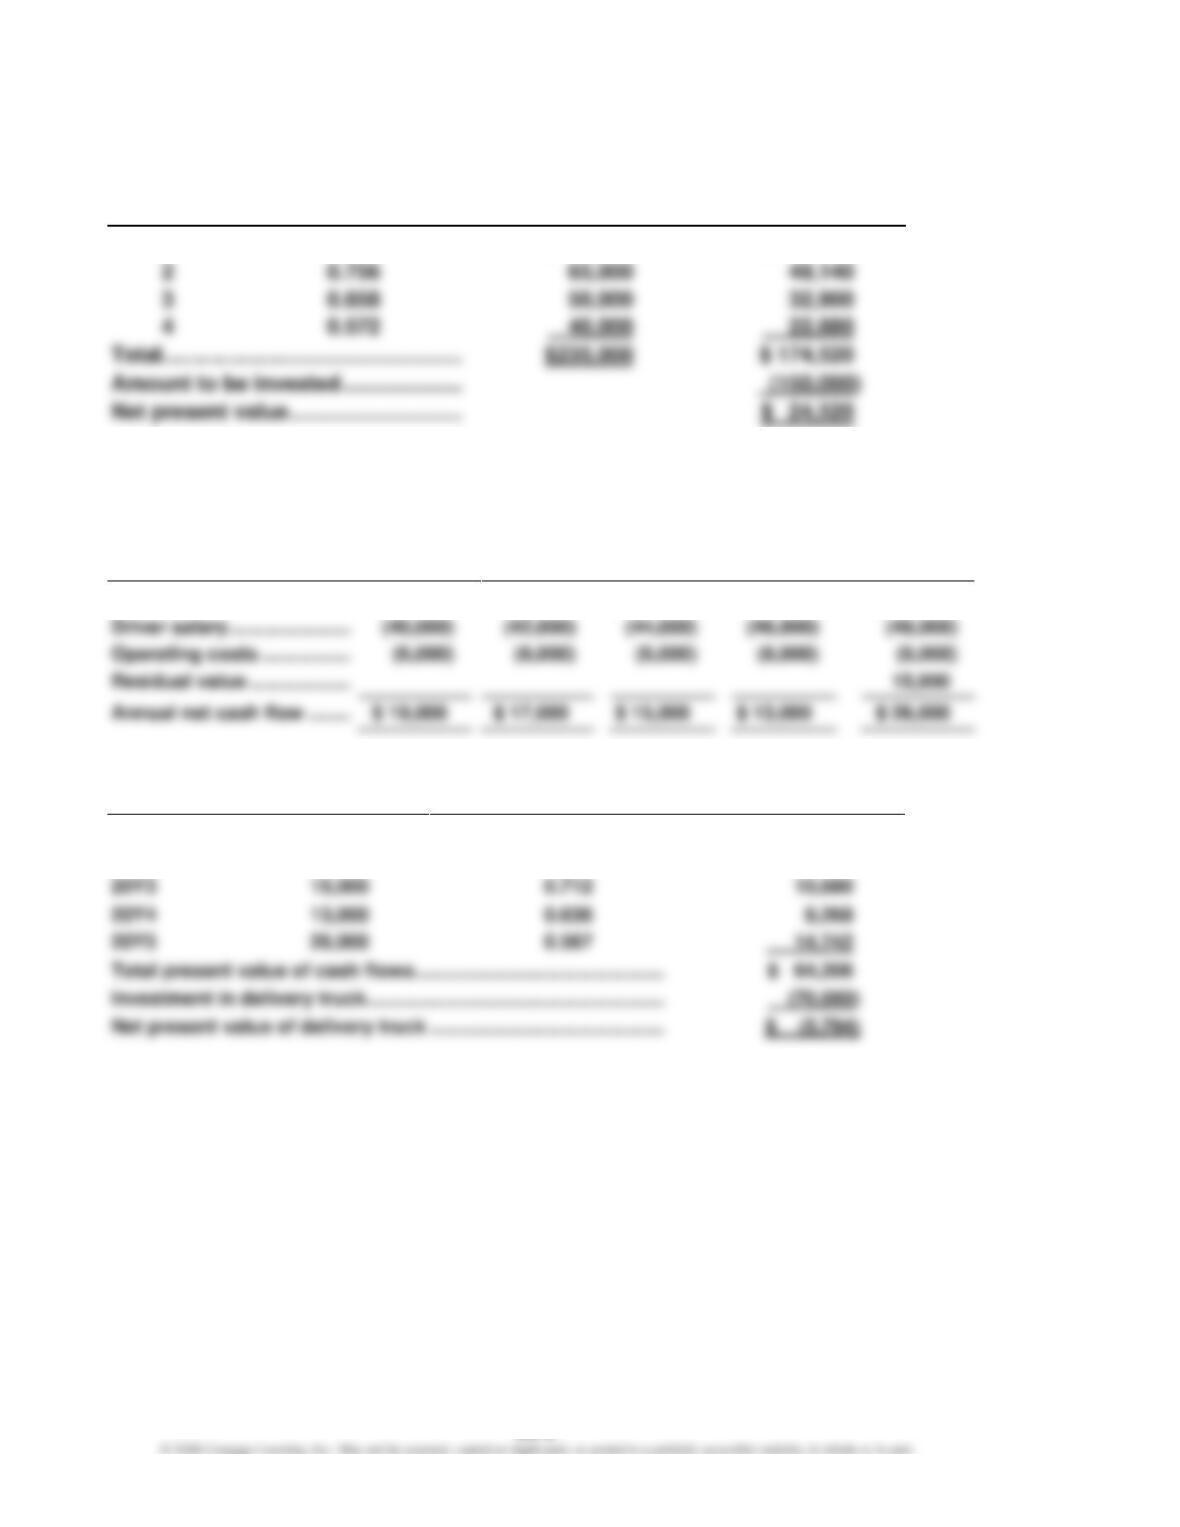
c. The total present value of cash flows from the delivery truck investment is
less than the total purchase price of the truck. That is, the net present value
is negative. Thus, this analysis does not support investment in the truck.
CHAPTER 26 (FIN MAN); CHAPTER 12 (MAN) Capital Investment Analysis
Ex. 26–9 (FIN MAN); Ex. 12–9 (MAN)
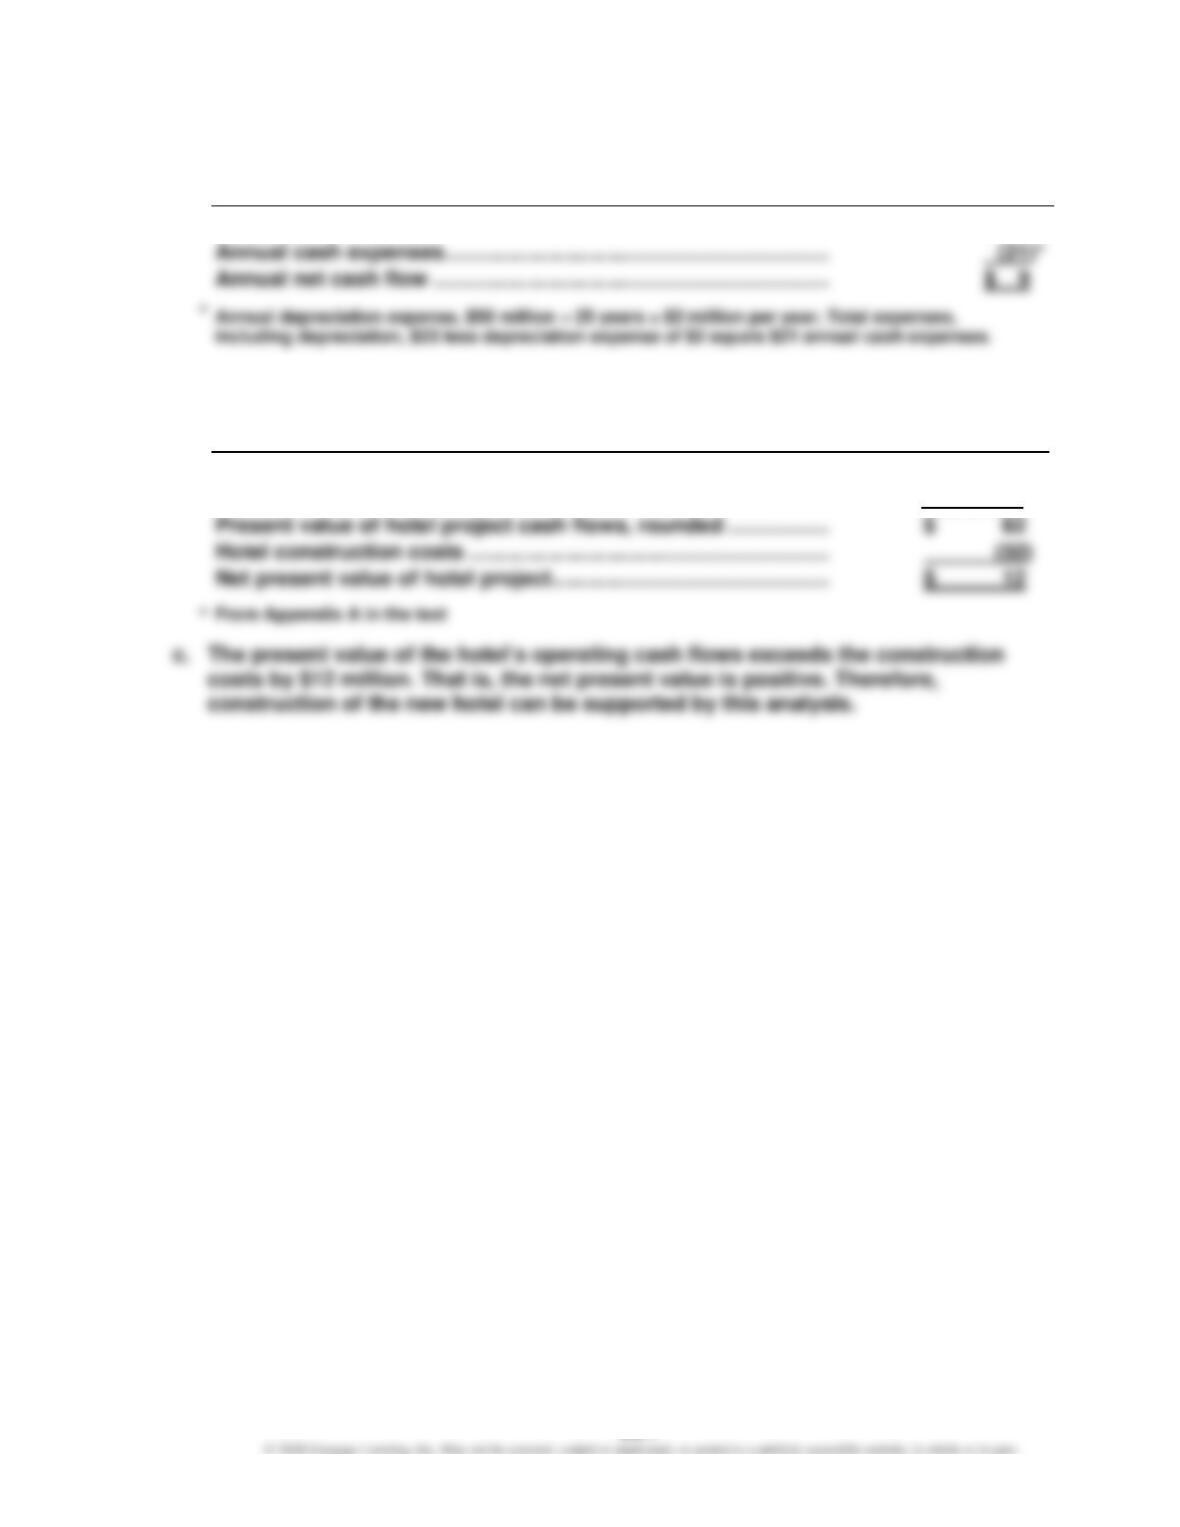
a.
(in millions)
Annual revenues ……………………………………………………………….
$ 30
Annual cash expenses ……………………………………………………….
b.
(in millions
except present
value factor)
Annual cash flows ……………………………………………………………..
$ 9
Present value of an annuity of $1 at 14% for 25 periods ……….
× 6.87293*
Present value of hotel project cash flows, rounded ……………..
$ 62
Hotel construction costs ……………………………………………………
Net present value of hotel project ……………………………………….
$ 12
CHAPTER 26 (FIN MAN); CHAPTER 12 (MAN) Capital Investment Analysis
Ex. 26–10 (FIN MAN); Ex. 12–10 (MAN)
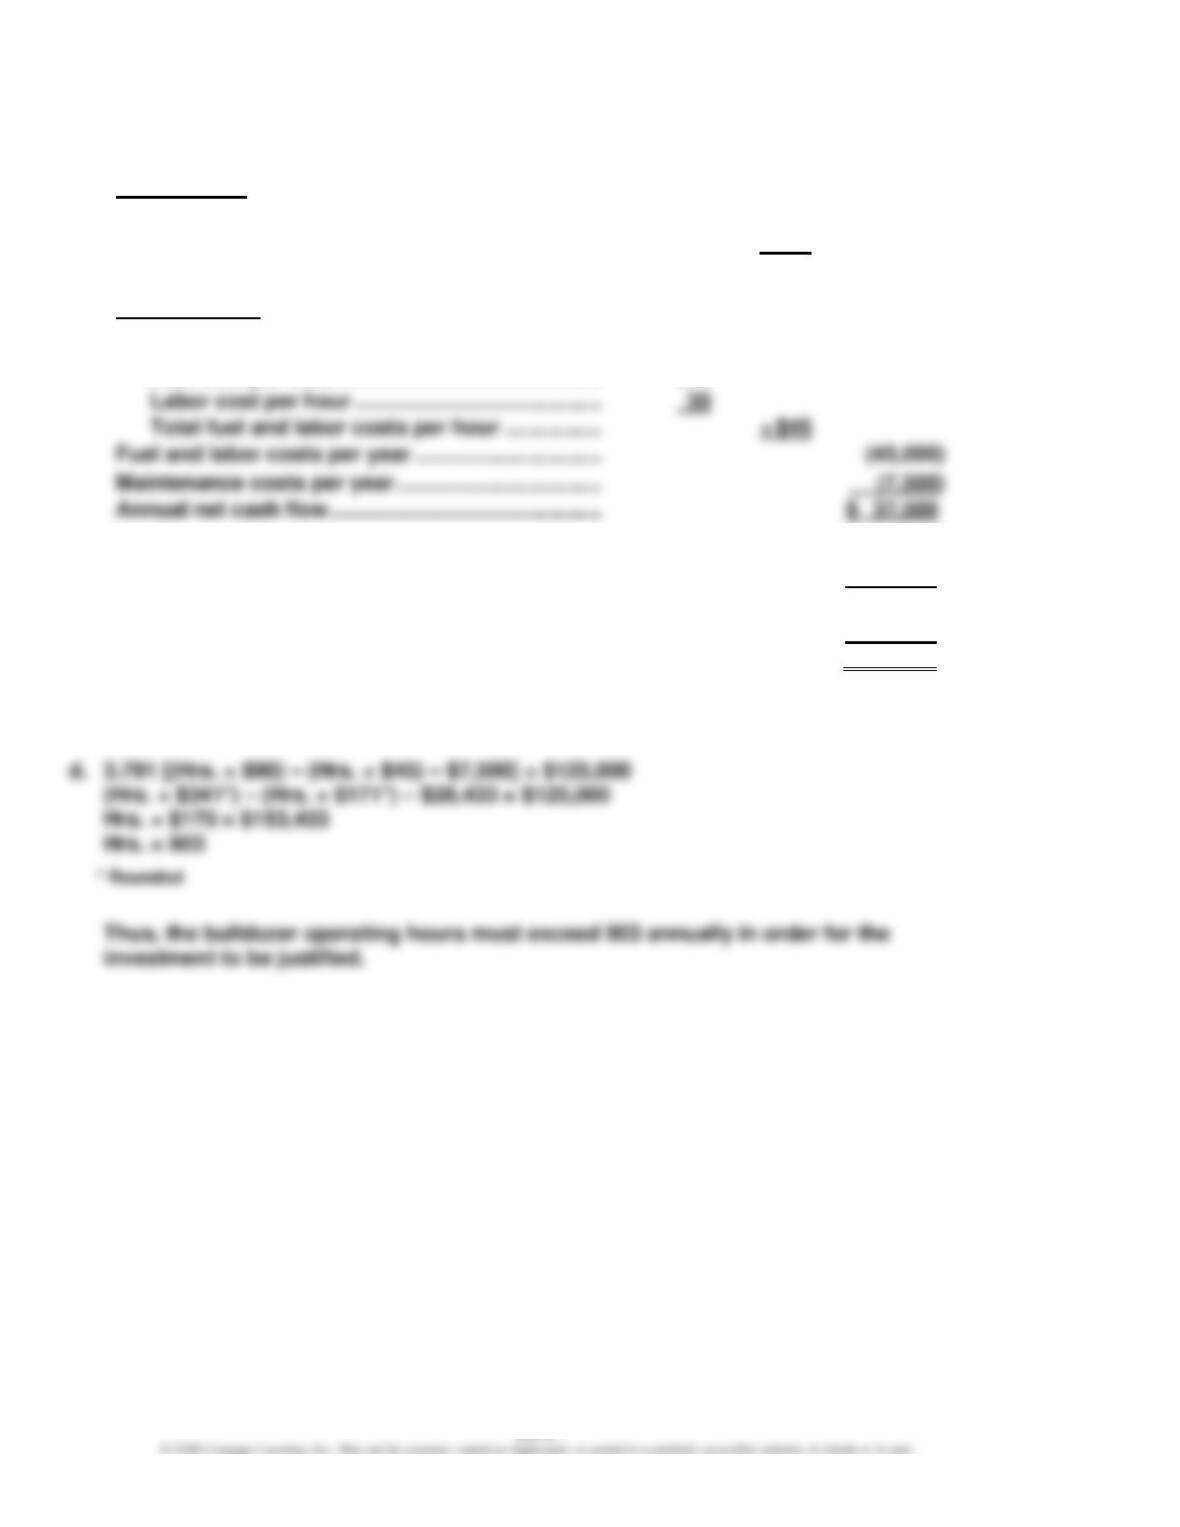
a.
Cash inflows:
Hours of operation ………………………………………….
1,000
Revenue per hour …………………………………………..
× $90
Revenue per year ……………………………………………
$ 90,000
Cash outflows:
Hours of operation ………………………………………….
1,000
Maintenance costs per year …………………………….
Annual net cash flow ………………………………………
$ 37,500
Fuel cost per hour ……………………………………..
$15
b.
Annual net cash flow (at the end of each of five years) …….
$ 37,500
Present value of annuity of $1 at 10% for five periods ………
× 3.791
Present value of annual net cash flows …………………………..
$ 142,163
Amount to be invested …………………………………………………..
(125,000)
Net present value …………………………………………………………..
$ 17,163
c. Yes. Jones should accept the investment because the bulldozer cost is less than the
present value of the cash flows at the minimum desired rate of return of 10%.
CHAPTER 26 (FIN MAN); CHAPTER 12 (MAN) Capital Investment Analysis
Ex. 26–11 (FIN MAN); Ex. 12–11 (MAN)
a.
Revenues (3,600 × 340 days × $280) ………………………………………….
$ 342,720,000
Variable expenses (3,600 × 340 days × $100) ……………………………..
(122,400,000)
Fixed expenses (other than depreciation) ………………………………….
(90,000,000)
Annual net cash flow ………………………………………………………………..
$ 130,320,000
Ex. 26–12 (FIN MAN); Ex. 12–12 (MAN)
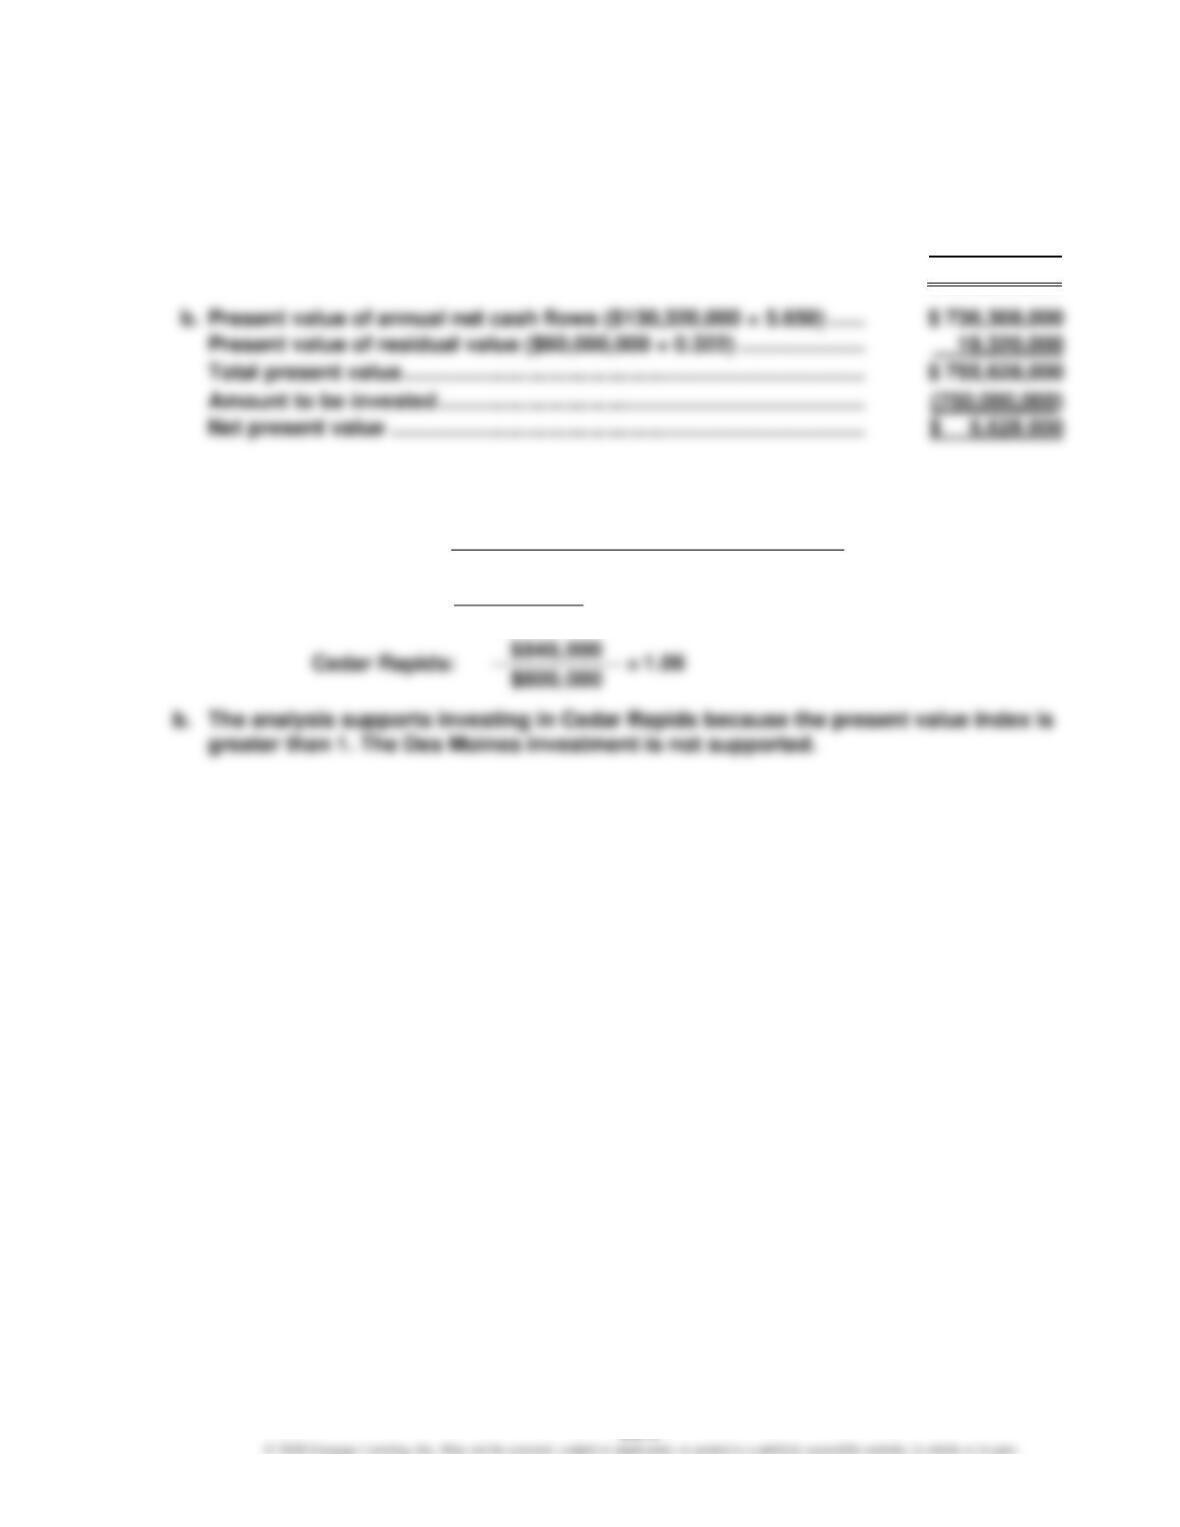
a.
Total Present Value of Net Cash Flow
Present Value Index = Amount to Be Invested
Des Moines:
$712,500 = 0.95
$750,000
CHAPTER 26 (FIN MAN); CHAPTER 12 (MAN) Capital Investment Analysis
Ex. 26–13 (FIN MAN); Ex. 12–13 (MAN)
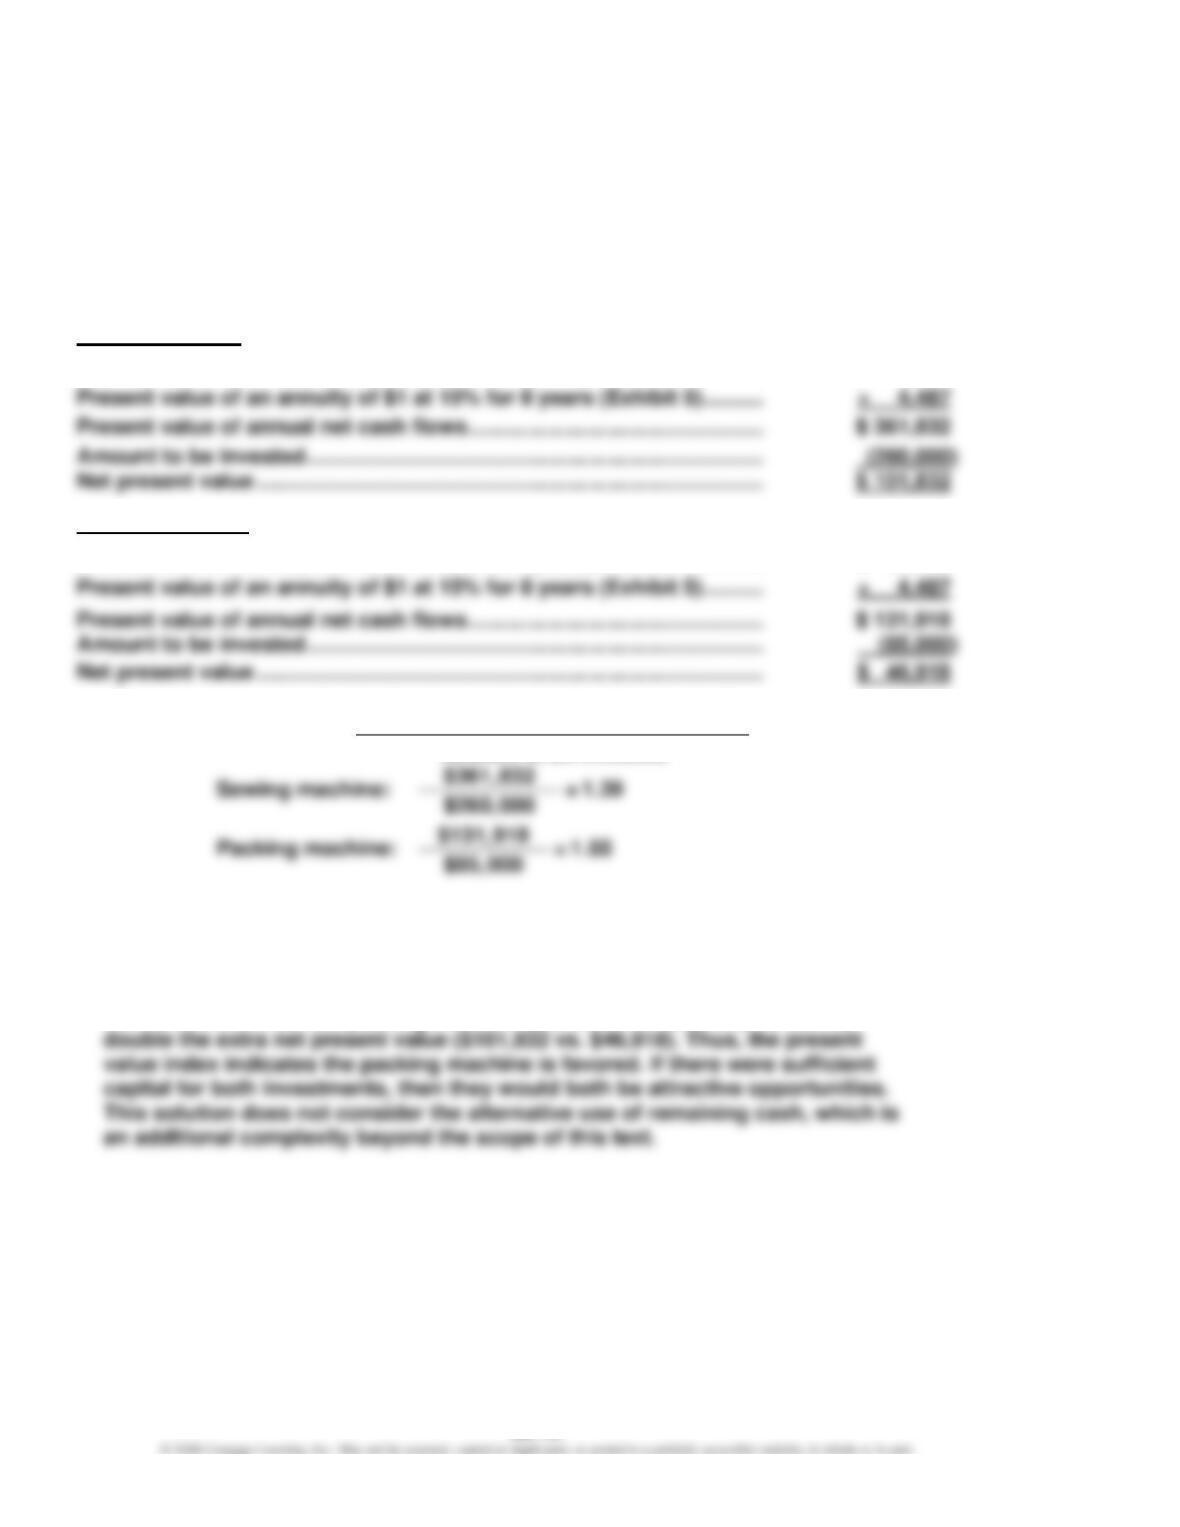
a. Annual net cash flow—Sewing Machine:
$80,640 = 1,800 hours × (290 baseballs – 150 baseballs) × $0.32 per baseball
Annual net cash flow—Packing Machine:
$29,400 = 1,400 hours × $21 labor cost saved per hour
Sewing Machine:
Annual net cash flow (at the end of each of 8 years) ……………………….
$ 80,640
Present value of annual net cash flows ………………………………………….
Packing Machine:
Annual net cash flow (at the end of each of 8 years) ……………………….
$ 29,400
Present value of an annuity of $1 at 15% for 8 years (Exhibit 5) ……….
b.
Total Present Value of Net Cash Flow
Present Value Index = Amount to Be Invested
c. The present value index indicates that the packing machine would be the
preferred investment, assuming that all other qualitative considerations are
equal. Note that the net present value of the sewing machine is greater than
the packing machine’s. However, the sewing machine requires more than triple
the investment than the packing machine ($260,000 vs. $85,000), for barely
CHAPTER 26 (FIN MAN); CHAPTER 12 (MAN) Capital Investment Analysis
Ex. 26–14 (FIN MAN); Ex. 12–14 (MAN)
a.
$156,250 *
Average rate of return on investment : = 25%
($1,250,000 + $0) ÷ 2
* The annual earnings are equal to the cash flow less the annual depreciation expense,
shown as follows:
$312,500 – ($1,250,000 ÷ 8 years) = $156,250
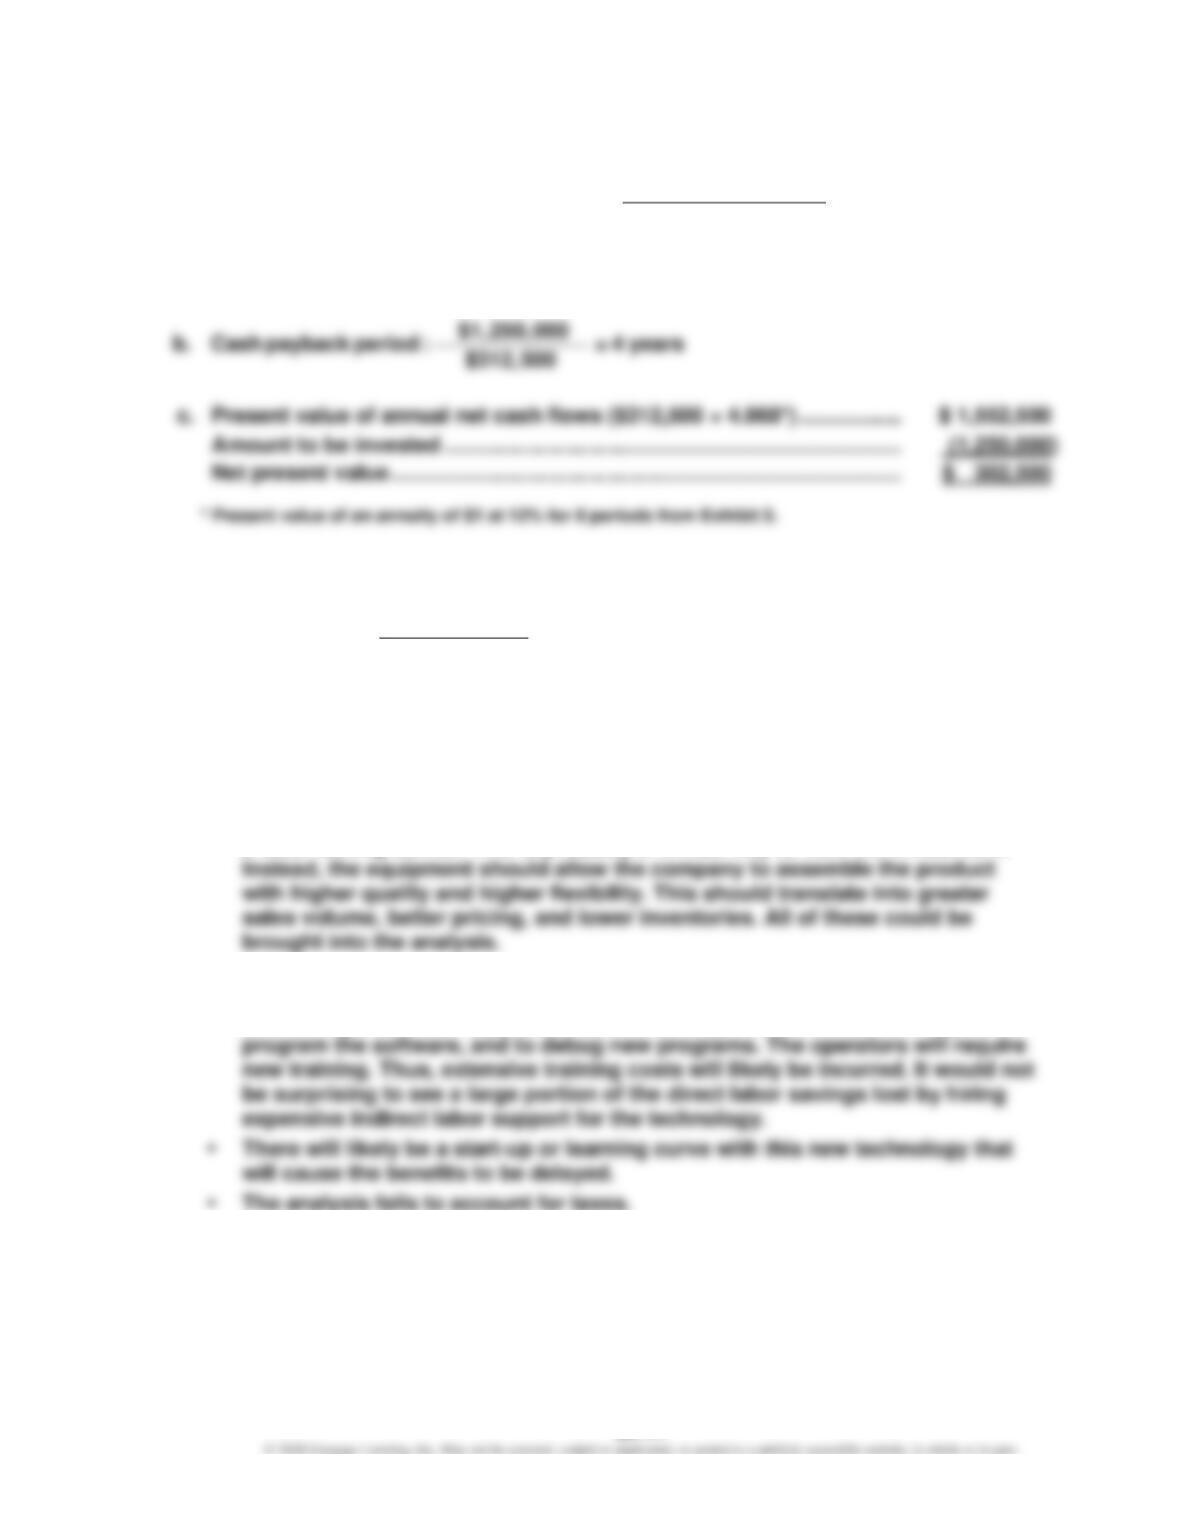
Ex. 26–15 (FIN MAN); Ex. 12–15 (MAN)
a.
$1, 400,000
Payback period : = 4 years
$350,000
b. Net present value:
Present value factor for an annuity of $1, 10 periods at 10%: 6.145
Net present value = (6.145 × $350,000) – $1,400,000 = $750,750
c. Some critical elements that are missing from this analysis are:
• The manager is viewing the acquisition of automated assembly equipment as
a labor-saving device. This is probably a limited way to view the investment.
• The cost of the automated assembly equipment does not stop with the initial
purchase price and installation costs. The equipment will require the company
to hire engineers and support personnel to keep the machines running, to
• The analysis fails to account for taxes.
CHAPTER 26 (FIN MAN); CHAPTER 12 (MAN) Capital Investment Analysis
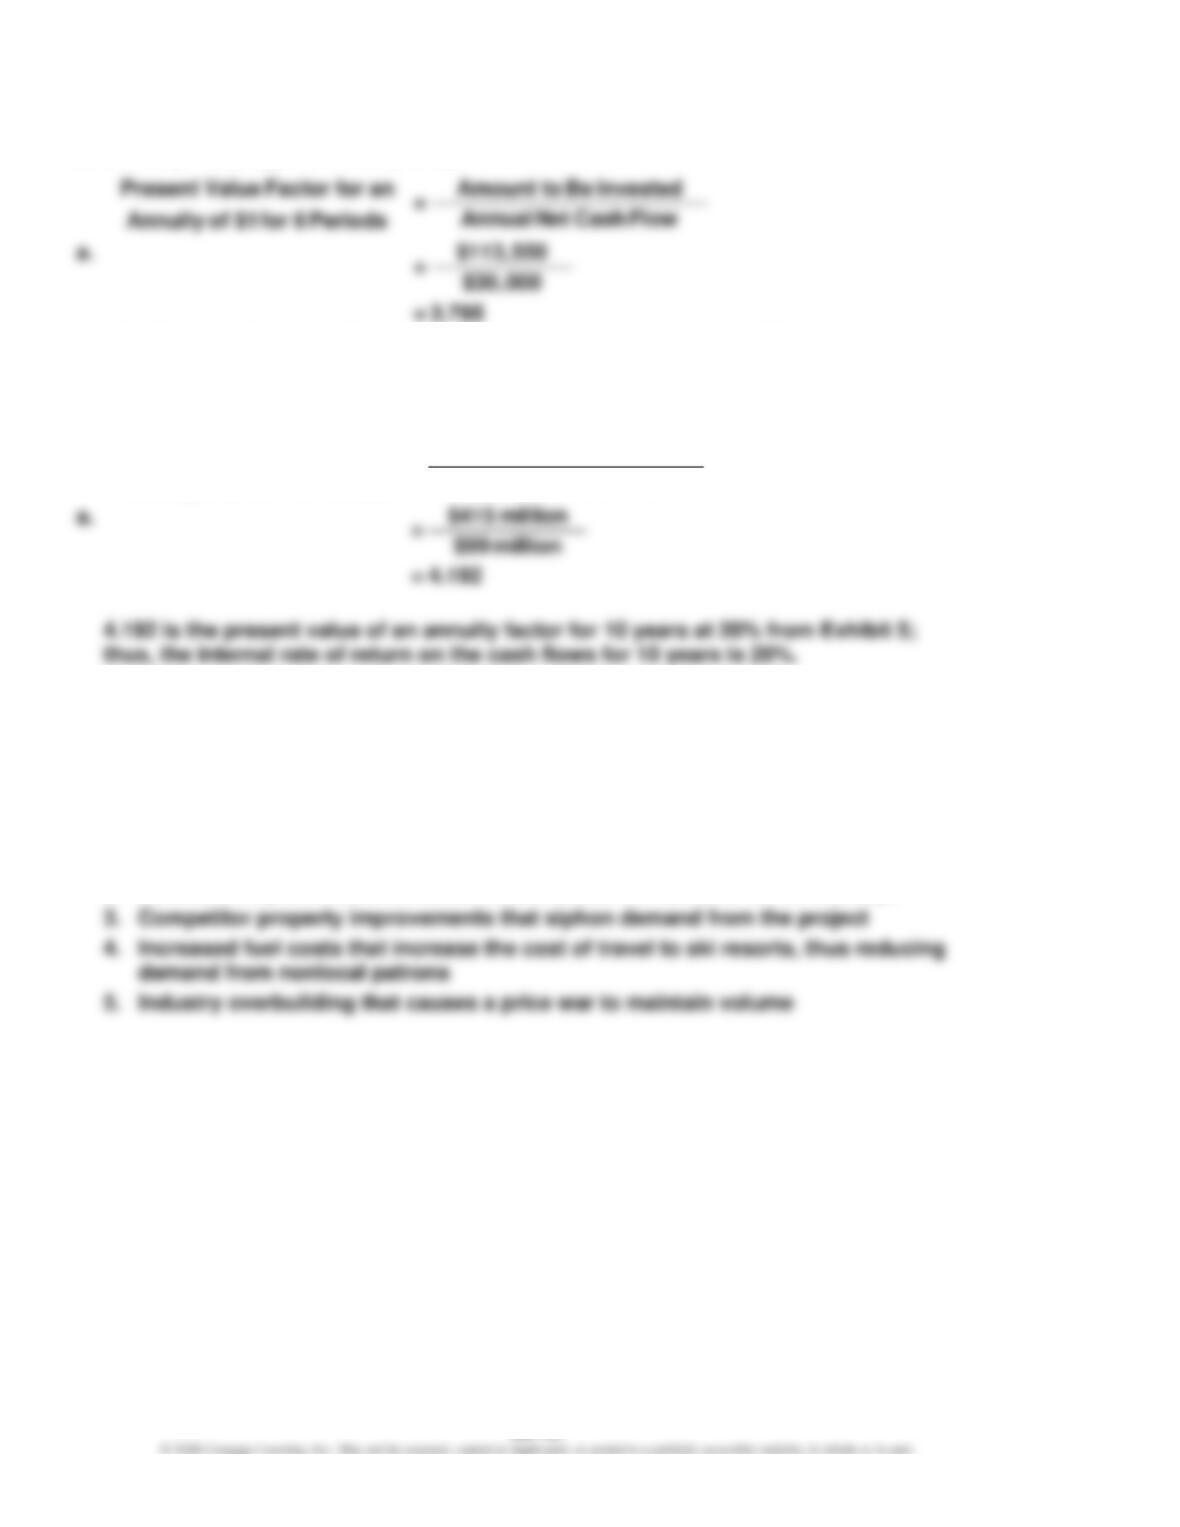
Ex. 26–16 (FIN MAN); Ex. 12–16 (MAN)
Present Value Factor for an Amount to Be Invested
b. 15% Row 6 in Exhibit 5. The column associated with the factor 3.785 is 15%.
Ex. 26–17 (FIN MAN); Ex. 12–17 (MAN)
Present Value Factor for an Amount to Be Invested
=Annual Net Cash Flow
Annuity of $1 for 10 Periods
b. There are many uncertainties that could adversely impact a project of this scale
and scope. There are uncertainties affecting the initial investment and the annual
cash flow assumptions. Regarding the initial investment, the construction cost
could be higher than $415 million, due to delays, labor issues, and other
construction site problems. The annual cash flow assumptions could be adversely
impacted by uncertainties such as:
1. Warm weather conditions, or no snow
2. Recessionary economic conditions that reduce the demand for ski holidays
CHAPTER 26 (FIN MAN); CHAPTER 12 (MAN) Capital Investment Analysis
Ex. 26–18 (FIN MAN); Ex. 12–18 (MAN)
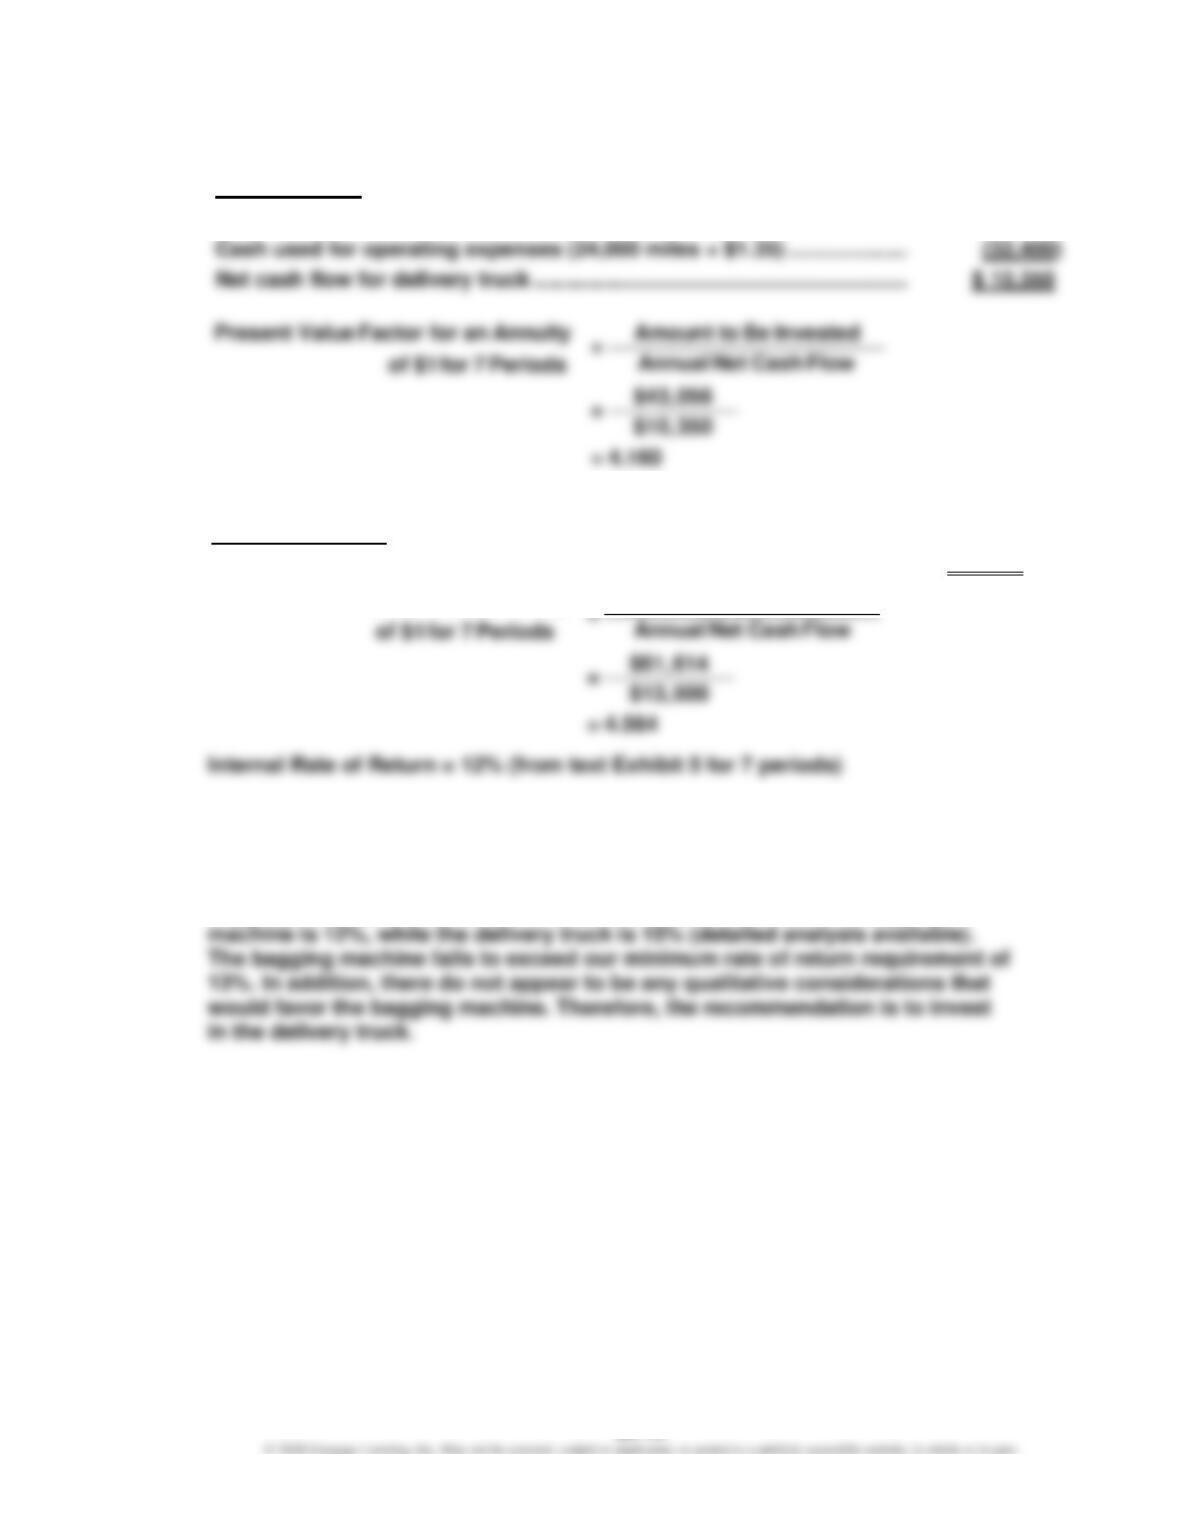
a.
Delivery Truck
Cash received from additional delivery (95,000 bags × $0.45) …………..
$ 42,750
Cash used for operating expenses (24,000 miles × $1.35) ………………..
Internal Rate of Return = 15% (from text Exhibit 5 for 7 periods)
Bagging Machine
Direct labor savings (3 hrs./day × $18/hr. × 250 days/yr.) …………………
$13,500
Present Value Factor for an Annuity Amount to Be Invested
b. To: Management
Re: Investment Recommendation
An internal rate of return analysis was performed for the delivery truck and
bagging machine investments. The internal rate of return for the bagging
CHAPTER 26 (FIN MAN); CHAPTER 12 (MAN) Capital Investment Analysis
Ex. 26–19 (FIN MAN); Ex. 12–19 (MAN)
a.
Present value of annual net cash flows ($35,000 × 4.968*) ……………….
$ 173,880
Amount to be invested ………………………………………………………………….
(186,725)
Net present value ………………………………………………………………………….
$ (12,845)
*
Present value of an annuity of $1 at 12% for 8 periods from text Exhibit 5.
b. The rate of return is less than 12% because there is a negative net present
value.
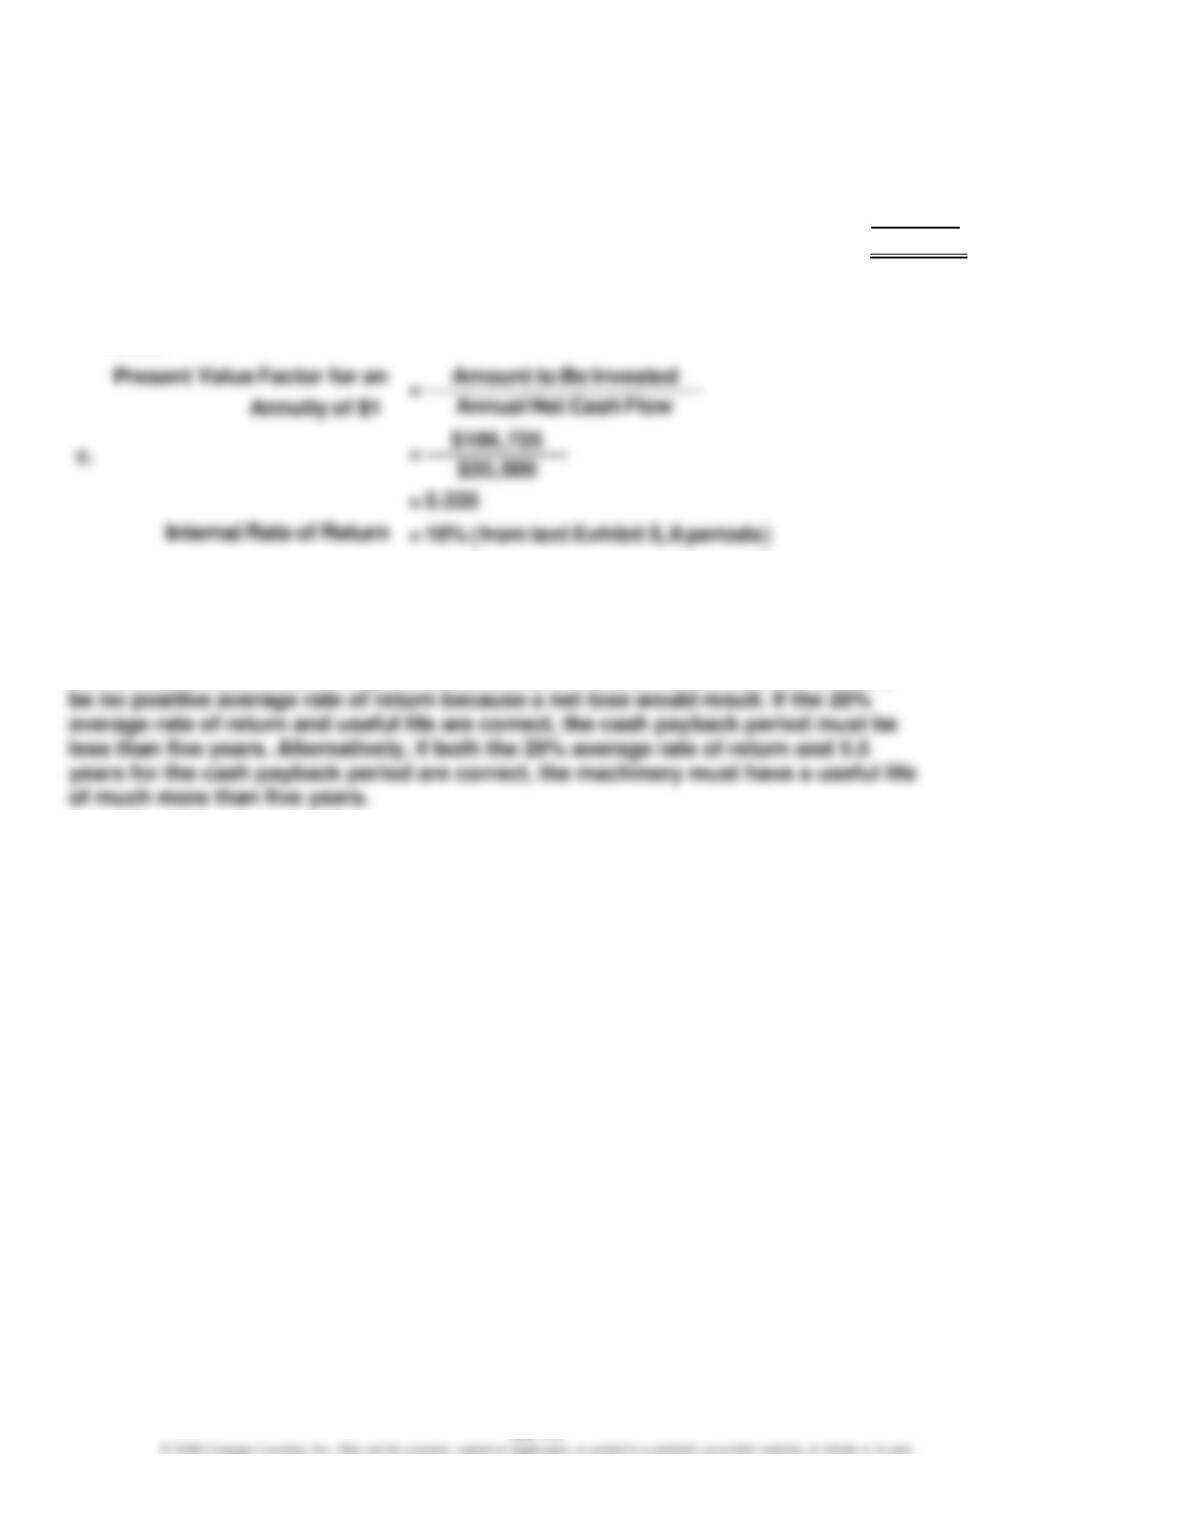
Ex. 26–20 (FIN MAN); Ex. 12–20 (MAN)
With an expected useful life of five years, the cash payback period cannot be
greater than five years. This would indicate that the cost of the initial investment
would not be recovered during the useful life of the asset. In addition, there would
CHAPTER 26 (FIN MAN); CHAPTER 12 (MAN) Capital Investment Analysis
Ex. 26–21 (FIN MAN); Ex. 12–21 (MAN)
Processing Mill
Present Value
Net Cash
Present Value of
Year
of $1 at 15%
Flow
Net Cash Flow
1
0.870
$ 310,000
$ 269,700
2
0.756
260,000
196,560
0.658
0.572
Electric Shovel
Year
Present Value
of $1 at 15%
Net Cash
Flow
Present Value of
Net Cash Flow
1
0.870
$ 330,000
$ 287,100
2
0.756
325,000
245,700
3
0.658
325,000
213,850
0.572
Note to Instructors: Because the investment amount is the same, the net present value
can be compared to determine preference. That is, the present value index will show
the same preference ordering.
CHAPTER 26 (FIN MAN); CHAPTER 12 (MAN) Capital Investment Analysis
Ex. 26–22 (FIN MAN); Ex. 12–22 (MAN)
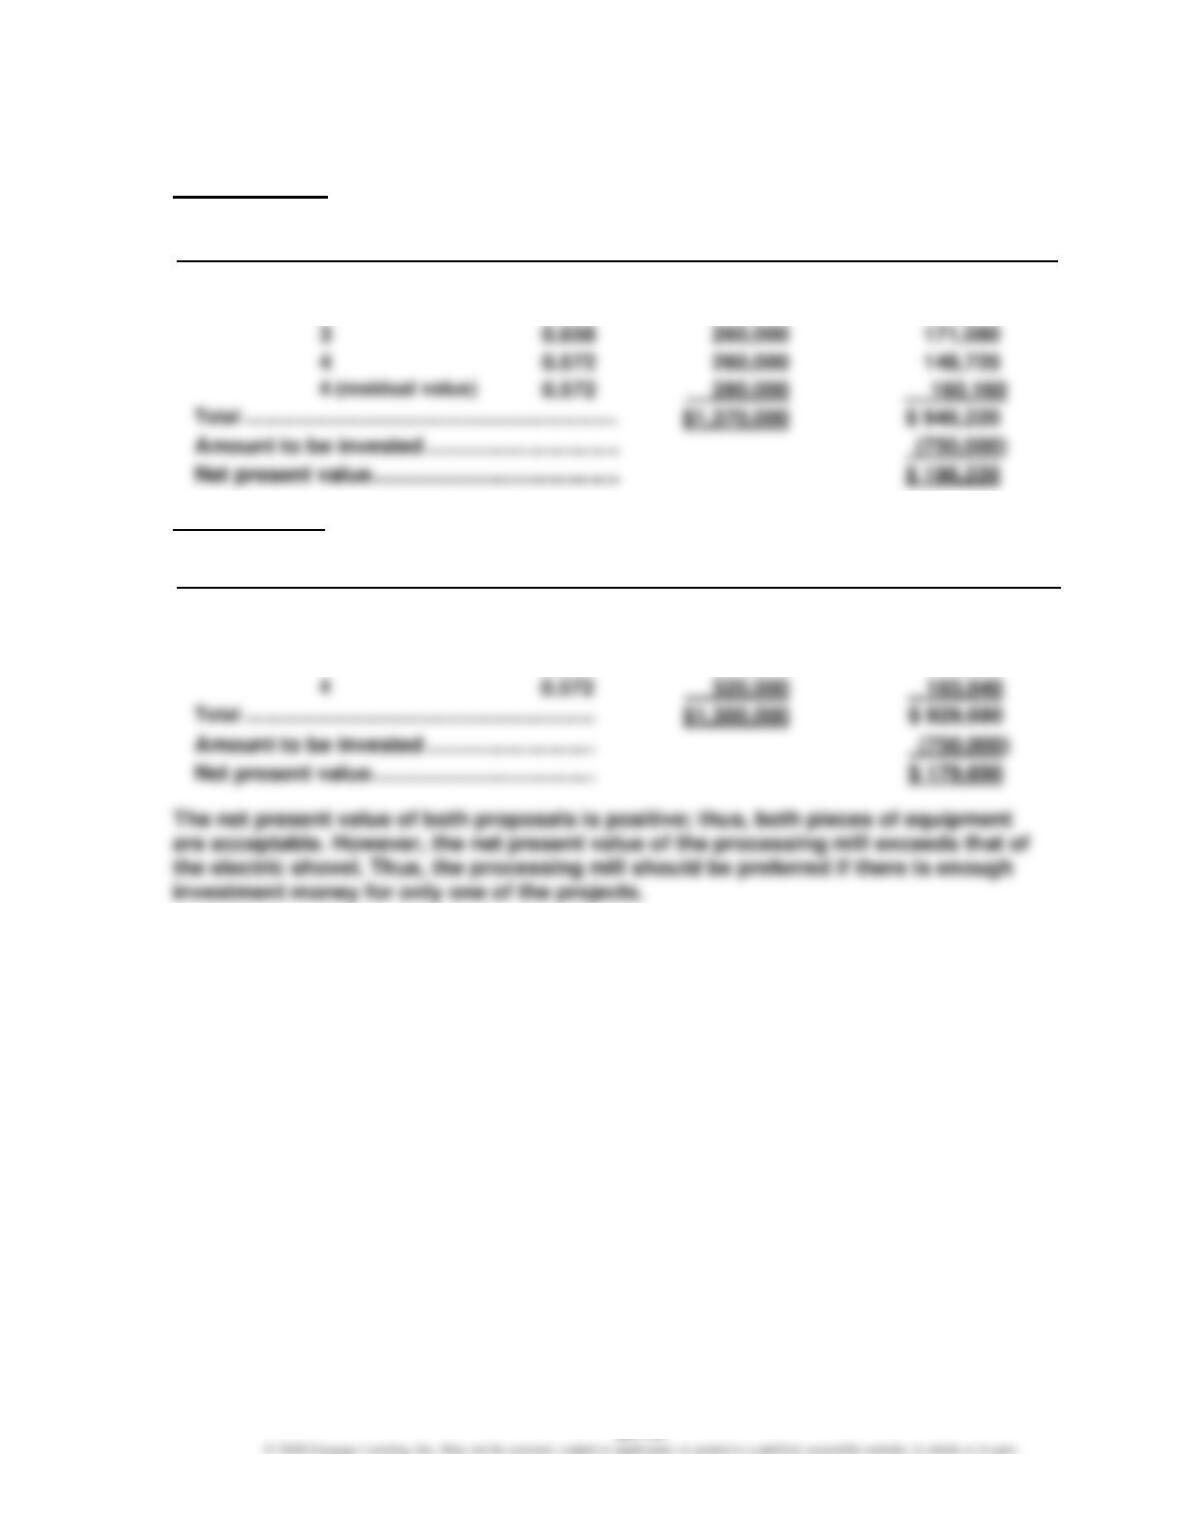
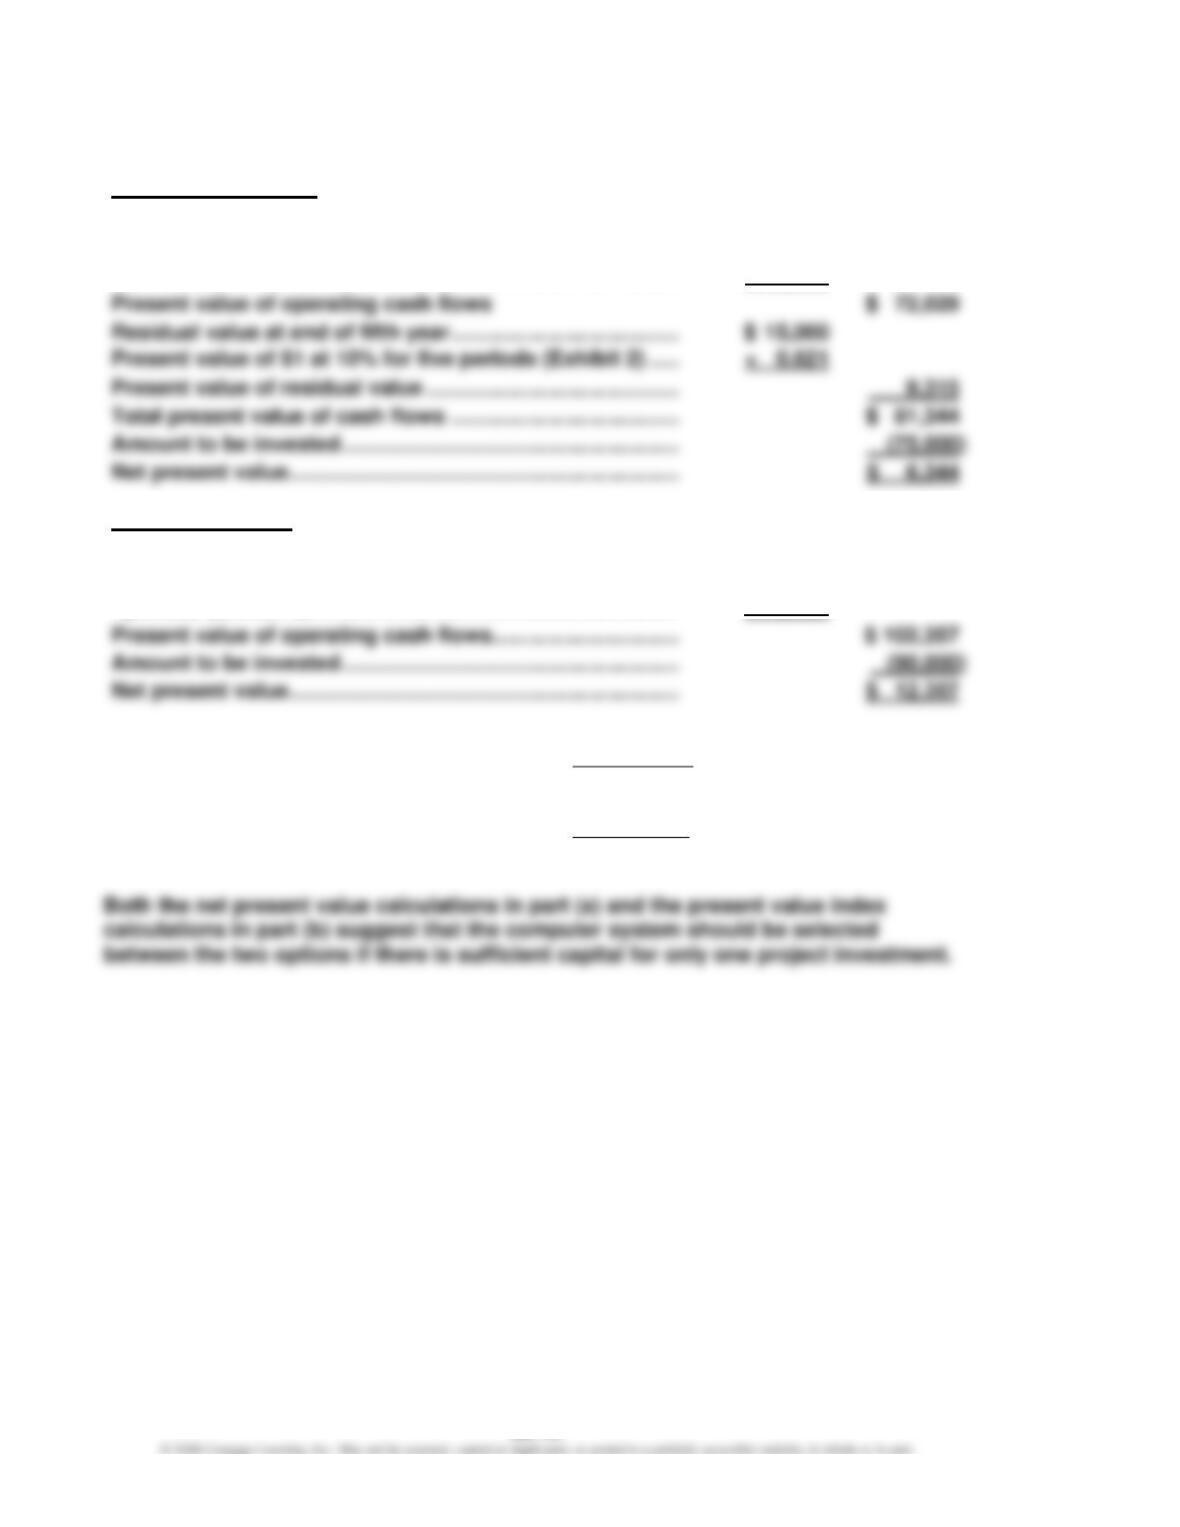
a. Blending Equipment
Equal annual cash flows for Years 1–5 …………………………
$ 19,000
Present value of a $1 annuity at 10% for five
periods (Exhibit 5) …………………………………………………….
× 3.791
Residual value at end of fifth year ………………………………..
Computer System
Equal annual cash flows for Years 1–5 …………………………
$ 27,000
Present value of a $1 annuity at 10% for five
periods (Exhibit 5) …………………………………………………….
× 3.791
b. Present value index of blending equipment:
$81,344 = 1.08
$75,000
Present value index of computer system:
$102,357 = 1.14
$90,000
CHAPTER 26 (FIN MAN); CHAPTER 12 (MAN) Capital Investment Analysis
PROBLEMS
Prob. 26–1A (FIN MAN); Prob. 12–1A (MAN)
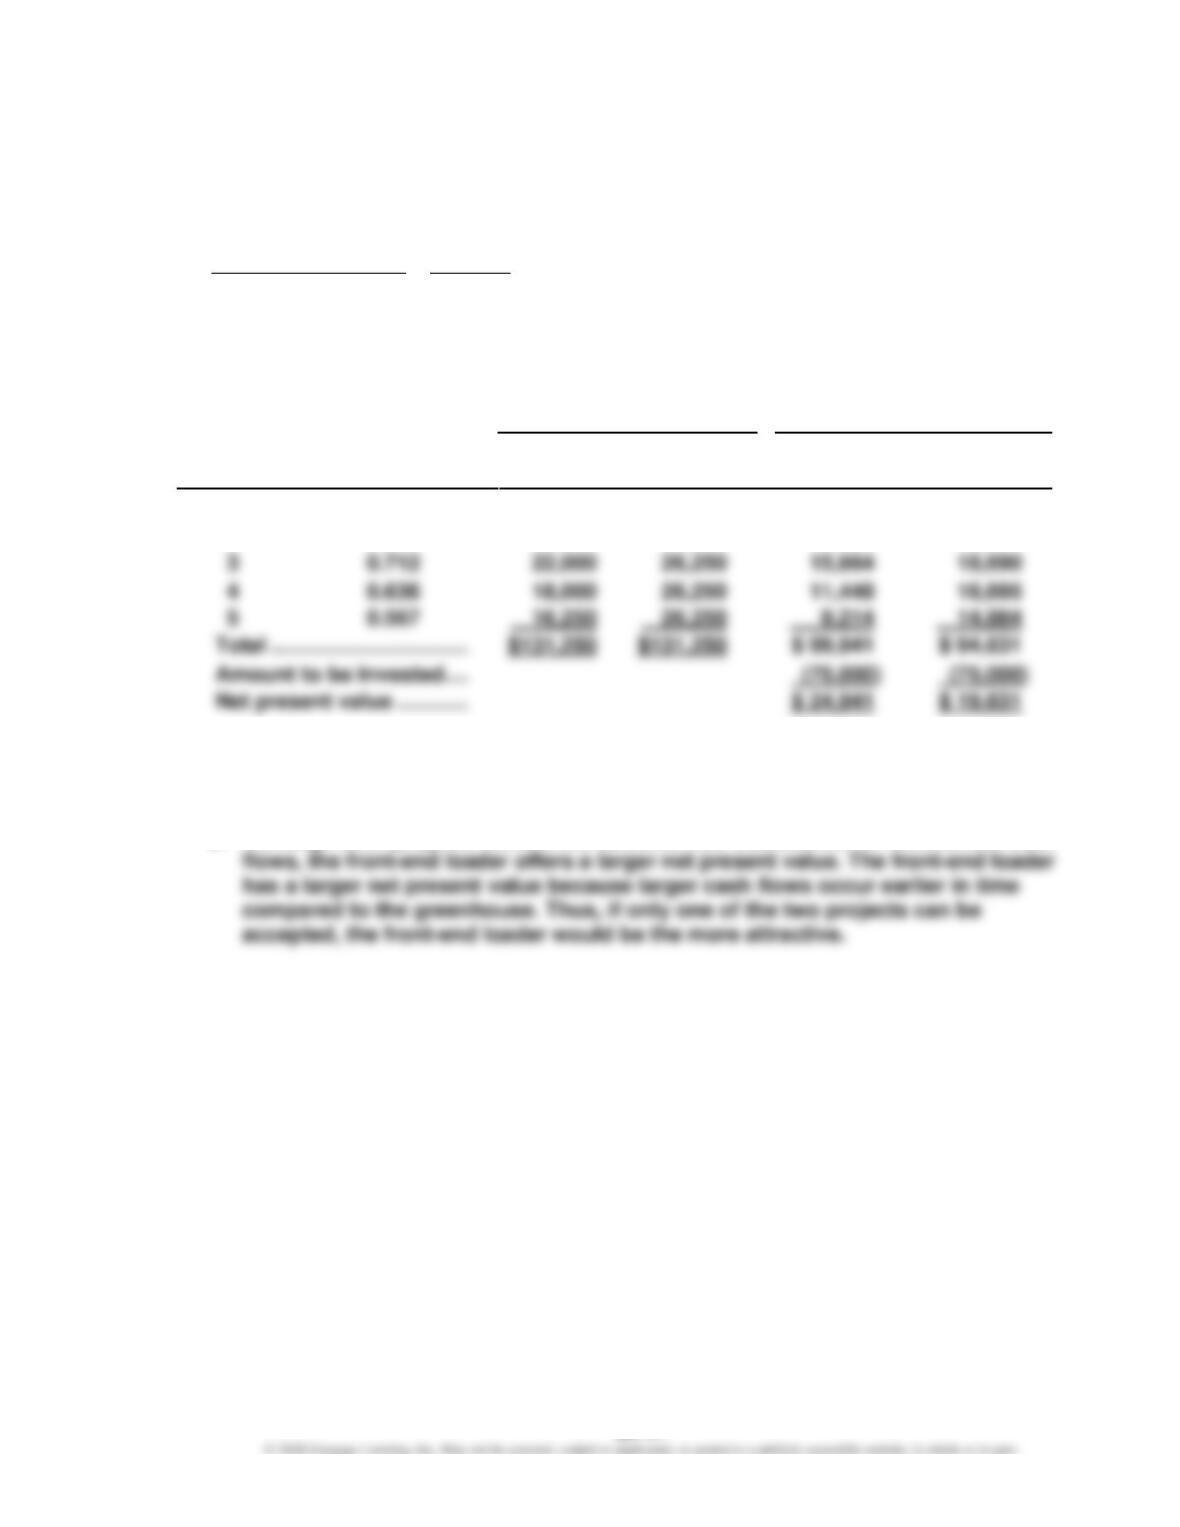
1. a. Average annual rate of return for both projects:
$56,250 ÷ 5 $11,250
= = 30.0%
($75,000 + $0) ÷ 2 $37,500
b. Net present value analysis:
Present Value of
Present
Net Cash Flow
Net Cash Flow
Value of
Front-End
Front-End
Year
$1 at 12%
Loader
Greenhouse
Loader
Greenhouse
1
0.893
$ 40,000
$ 26,250
$ 35,720
$ 23,441
2
0.797
35,000
26,250
27,895
20,921
4
0.636
16,695
(75,000)
$ 24,941
2. The report to the capital investment committee can take many forms. The report
should, as a minimum, present the following points:
a. Both projects offer the same average annual rate of return.
b. Although both projects exceed the selected rate established for discounted cash
CHAPTER 26 (FIN MAN); CHAPTER 12 (MAN) Capital Investment Analysis
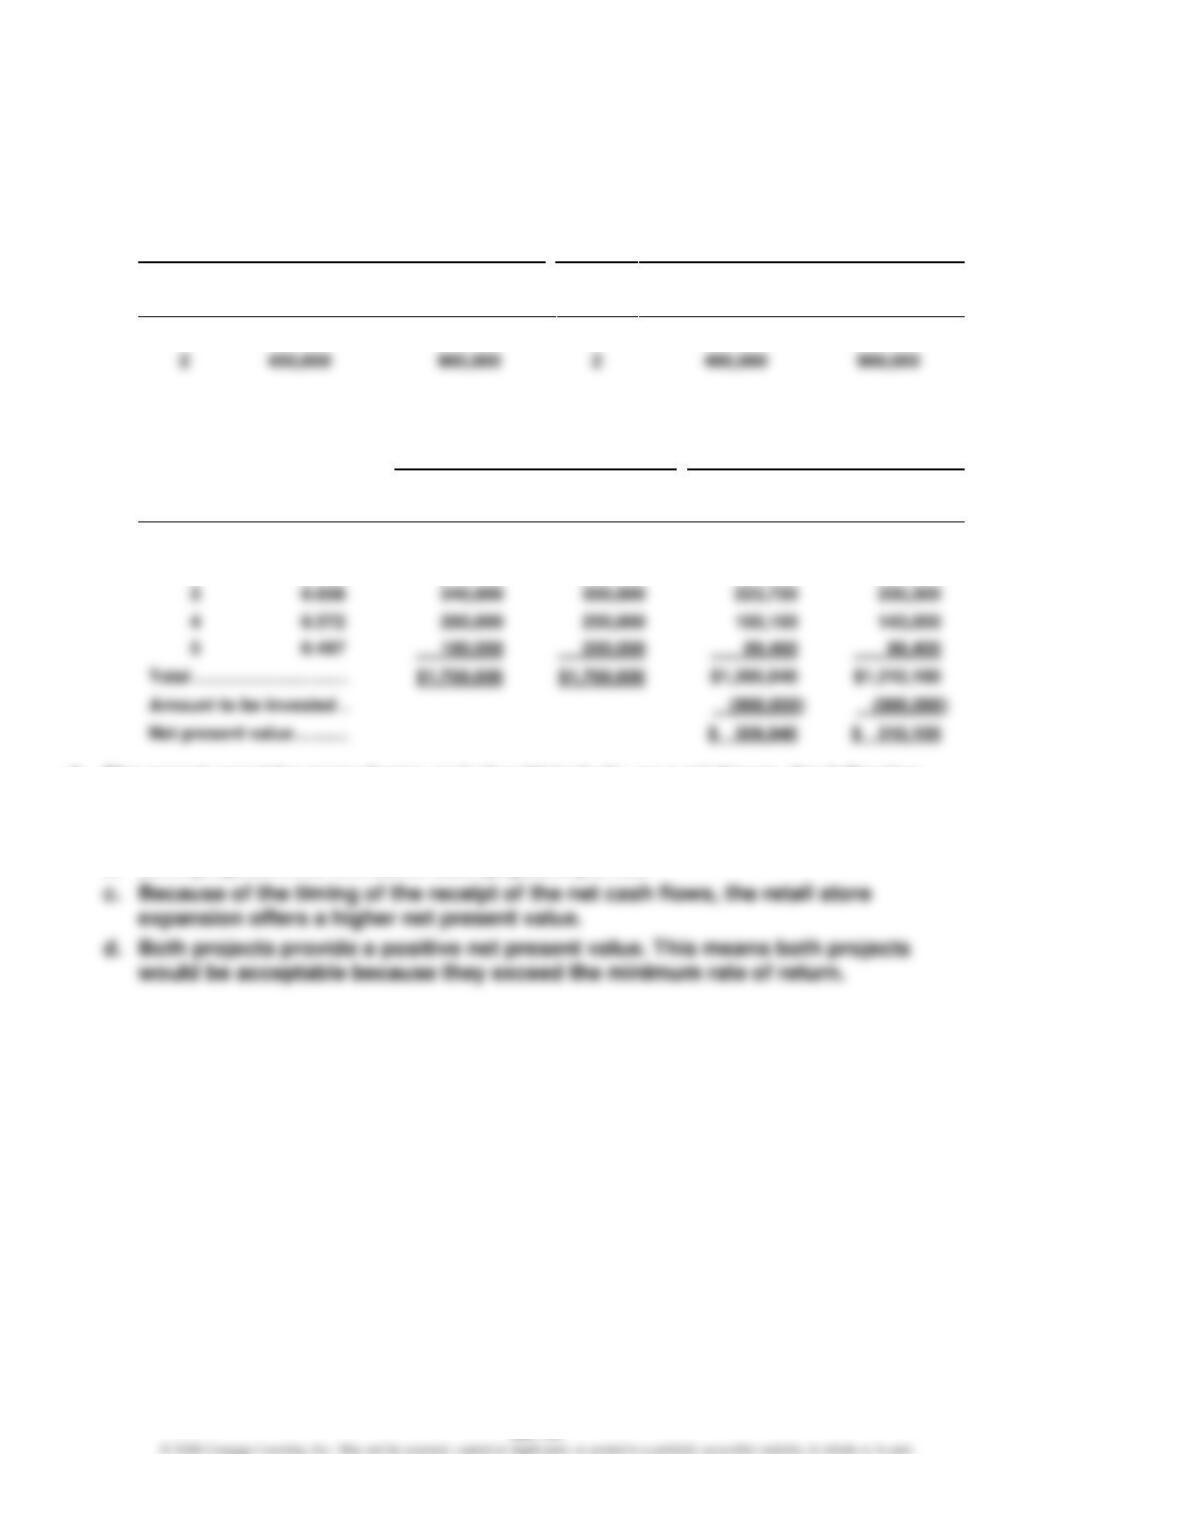
Prob. 26–2A (FIN MAN); Prob. 12–2A (MAN)
1. a. Cash payback period for both projects: 2 years (the year in which accumulated
net cash flows equal $900,000), shown as follows:
Plant Expansion
Retail Store Expansion
Net Cash
Cumulative
Net Cash
Cumulative
Year
Flow
Net Cash Flow
Year
Flow
Net Cash Flow
1
$450,000
$450,000
1
$500,000
$500,000
2
2
b. Net present value analysis:
Present Value of
Present
Net Cash Flow
Net Cash Flow
Value of
Plant
Retail Store
Plant
Retail Store
Year
$1 at 15%
Expansion
Expansion
Expansion
Expansion
1
0.870
$ 450,000
$ 500,000
$ 391,500
$ 435,000
2
0.756
450,000
400,000
340,200
302,400
3
0.658
340,000
350,000
223,720
230,300
4
0.572
143,000
2. The report can take many forms and should include, as a minimum, the following
points:
a. Both projects offer the same total net cash flow.
b. Both projects offer the same cash payback period.
CHAPTER 26 (FIN MAN); CHAPTER 12 (MAN) Capital Investment Analysis
Prob. 26–3A (FIN MAN); Prob. 12–3A (MAN)
1.
Maintenance Equipment
Present Value
Net Cash
Present Value of
Year
of $1 at 20%
Flow
Net Cash Flow
1
0.833
$ 4,000,000
$ 3,332,000
3
0.579
2,500,000
1,447,500
Ramp Facilities
Present Value
Net Cash
Present Value of
Year
of $1 at 20%
Flow
Net Cash Flow
1
0.833
$12,000,000
$ 9,996,000
2
0.694
10,000,000
6,940,000
$31,000,000
Net present value ………………………………………
$ 2,147,000
Computer Network
Present Value
Net Cash
Present Value of
Year
of $1 at 20%
Flow
Net Cash Flow
1
0.833
$ 6,000,000
$ 4,998,000
2
0.694
5,000,000
3,470,000
3
0.579
4,000,000
2,316,000
CHAPTER 26 (FIN MAN); CHAPTER 12 (MAN) Capital Investment Analysis
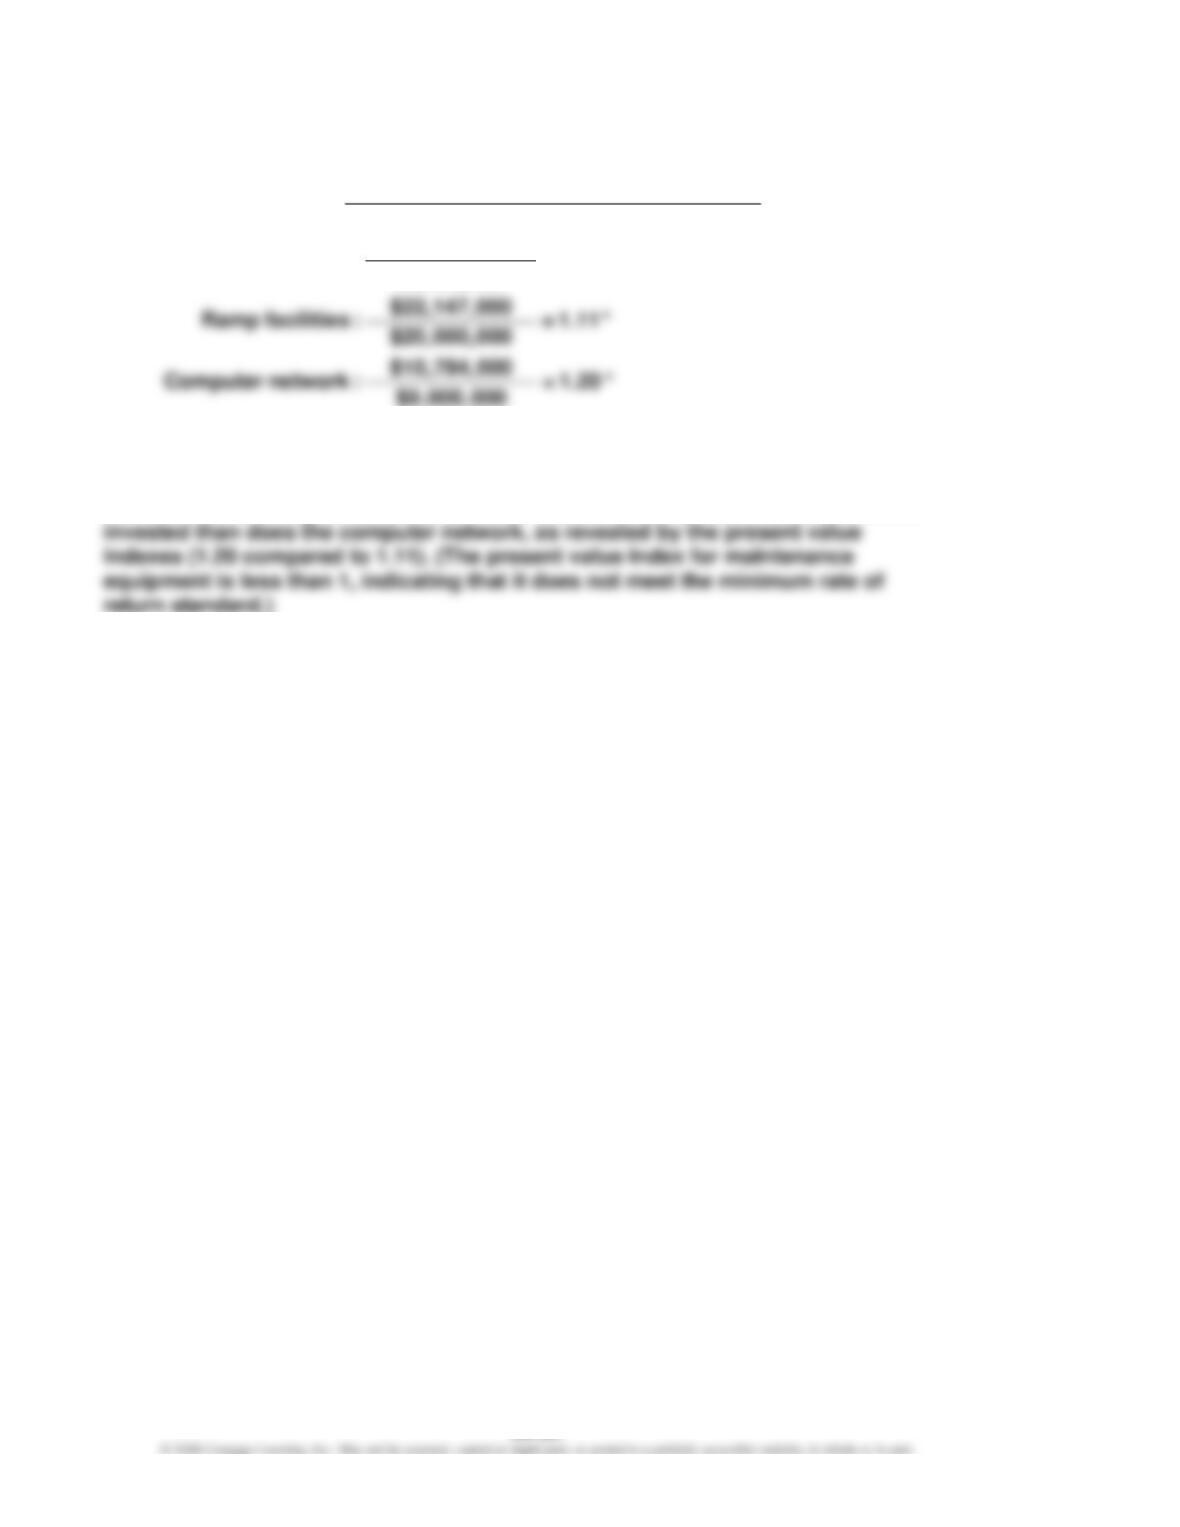
Prob. 26–3A (FIN MAN); Prob. 12–3A (MAN) (Concluded)
2.
Total Present Value of Net Cash Flow
Present Value Index = Amount to Be Invested
$7,208,500
Maintenance equipment : = 0.90 *
$8,000,000
* Rounded
3. The computer network has the largest present value index. Although ramp
facilities has the largest net present value, it returns less present value per dollar