12-1
CHAPTER 12
STRATEGY, BALANCED SCORECARD, AND
STRATEGIC PROFITABILITY ANALYSIS
12-1 Strategy specifies how an organization matches its own capabilities with the
opportunities in the marketplace to accomplish its objectives.
12-2 The five key forces to consider in industry analysis are: (1) competitors, (2) potential
entrants into the market, (3) equivalent products, (4) bargaining power of customers, and (5)
bargaining power of input suppliers.
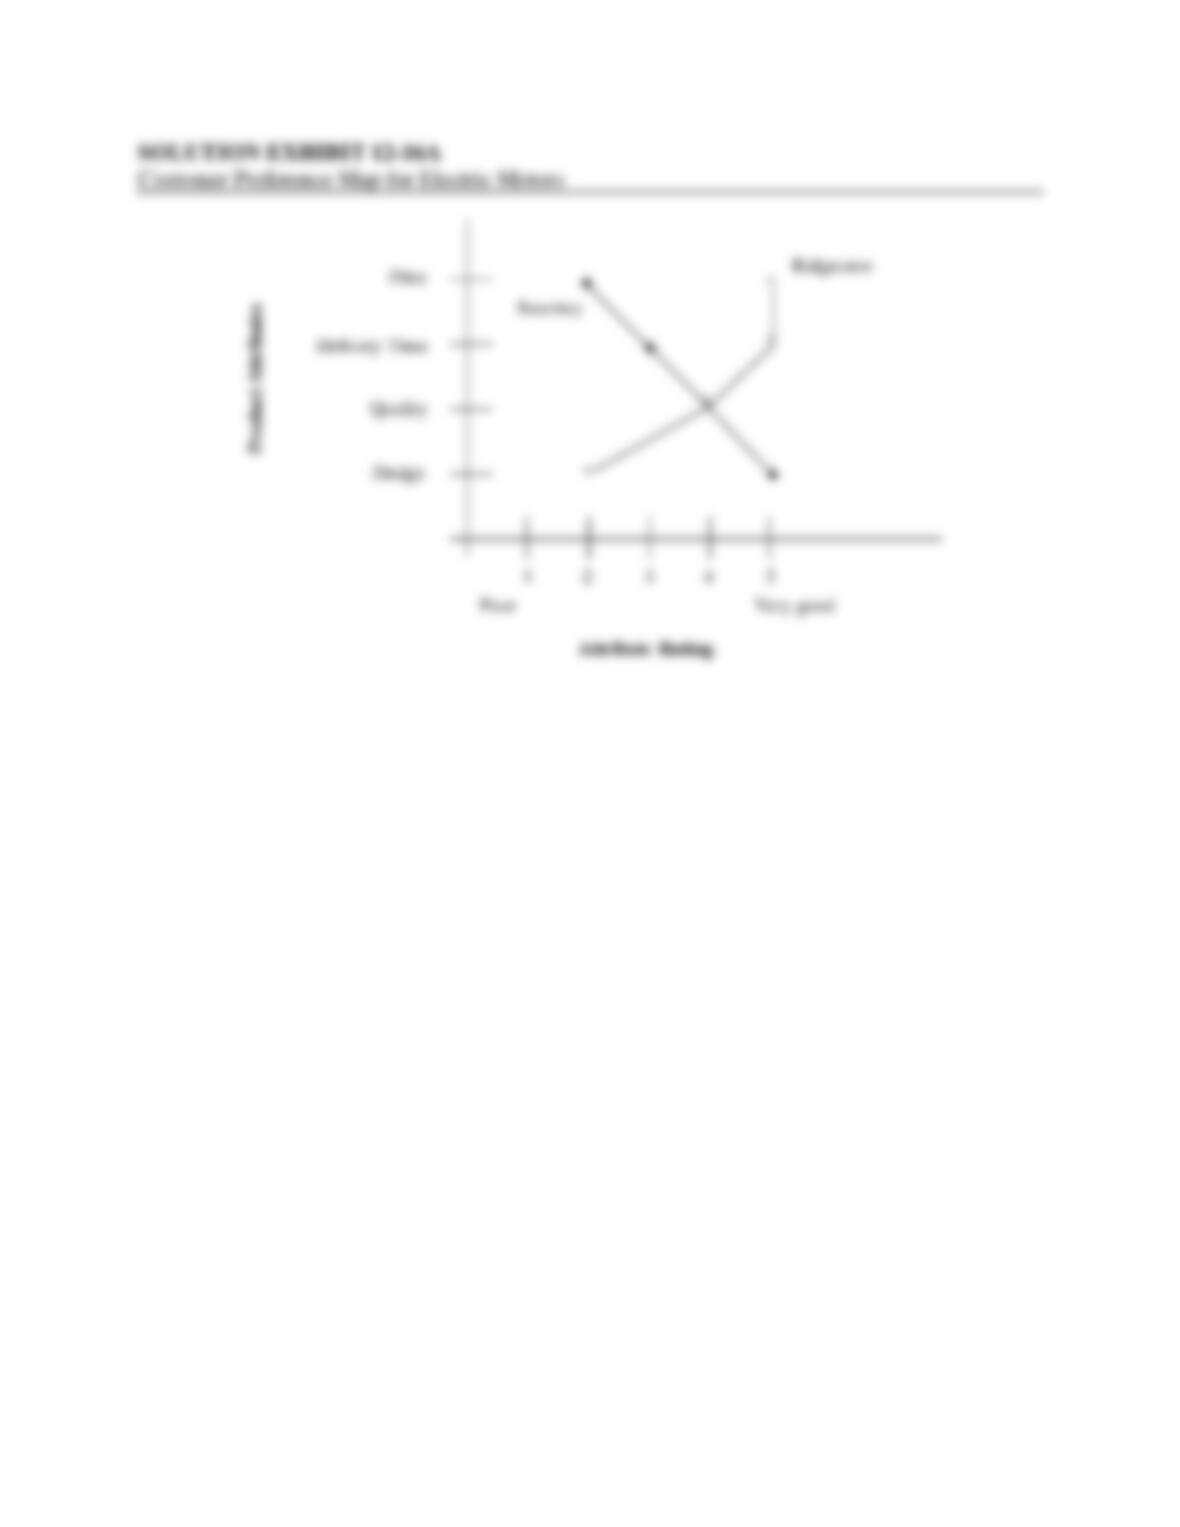
12-4 A customer preference map describes how different competitors perform across various
product attributes desired by customers, such as price, quality, customer service, and product
features.
12-5 Reengineering is the fundamental rethinking and redesign of business processes to
achieve improvements in critical measures of performance such as cost, quality, service, speed,
and customer satisfaction.
12-7 A strategy map is a diagram that describes how an organization creates value by
connecting strategic objectives in explicit cause-and-effect relationships with each other in the
financial, customer, internal business process, and learning and growth perspectives.
12-2
3. It places strong emphasis on financial objectives and measures in for-profit companies.
Nonfinancial measures are regarded as part of a program to achieve future financial
performance.
4. It limits the number of measures to only those that are critical to the implementation of
strategy.
5. It highlights suboptimal trade-offs that managers may make when they fail to consider
operational and financial measures together.
12-10 Three key components in doing a strategic analysis of operating income are the
following:
1. The growth component, which measures the change in operating income attributable
solely to the change in quantity of output sold from one year to the next.
2. The price-recovery component, which measures the change in operating income
attributable solely to changes in the prices of inputs and outputs from one year to the
next.
3. The productivity component, which measures the change in costs attributable to a change
in the quantity and mix of inputs used in the current year relative to the quantity and mix
of inputs that would have been used in the previous year to produce current year output.
12-12 Engineered costs result from a cause-and-effect relationship between the cost driver,
output, and the (direct or indirect) resources used to produce that output. Discretionary costs
arise from periodic (usually annual) decisions regarding the maximum amount to be incurred.
They have no measurable cause-and-effect relationship between output and resources used.
12-3
12-14 A partial productivity measure is the quantity of output produced divided by the quantity
of an individual input used (e.g., direct materials or direct manufacturing labor).
12-16 (15 min.) Balanced scorecard.
Ridgecrest Electric manufactures electric motors. It competes and plans to grow by selling high–
quality motors at a low price and by delivering them to customers quickly after receiving
customers’ orders. There are many other manufacturers who produce similar motors. Ridgecrest
believes that continuously improving its manufacturing processes and having satisfied employees
are critical to implementing its strategy in 2013.
Required:
1. Is Ridgecrest’s 2013 strategy one of product differentiation or cost leadership? Explain
briefly.
2. Kearney Corporation, a competitor of Ridgecrest, manufactures electric motors with more
sizes and features than Ridgecrest at a higher price. Kearney’s motors are of high quality but
require more time to produce and so have longer delivery times. Draw a simple customer
preference map as in Exhibit 12-1 for Ridgecrest and Kearney using the attributes of price,
delivery time, quality, and design features.
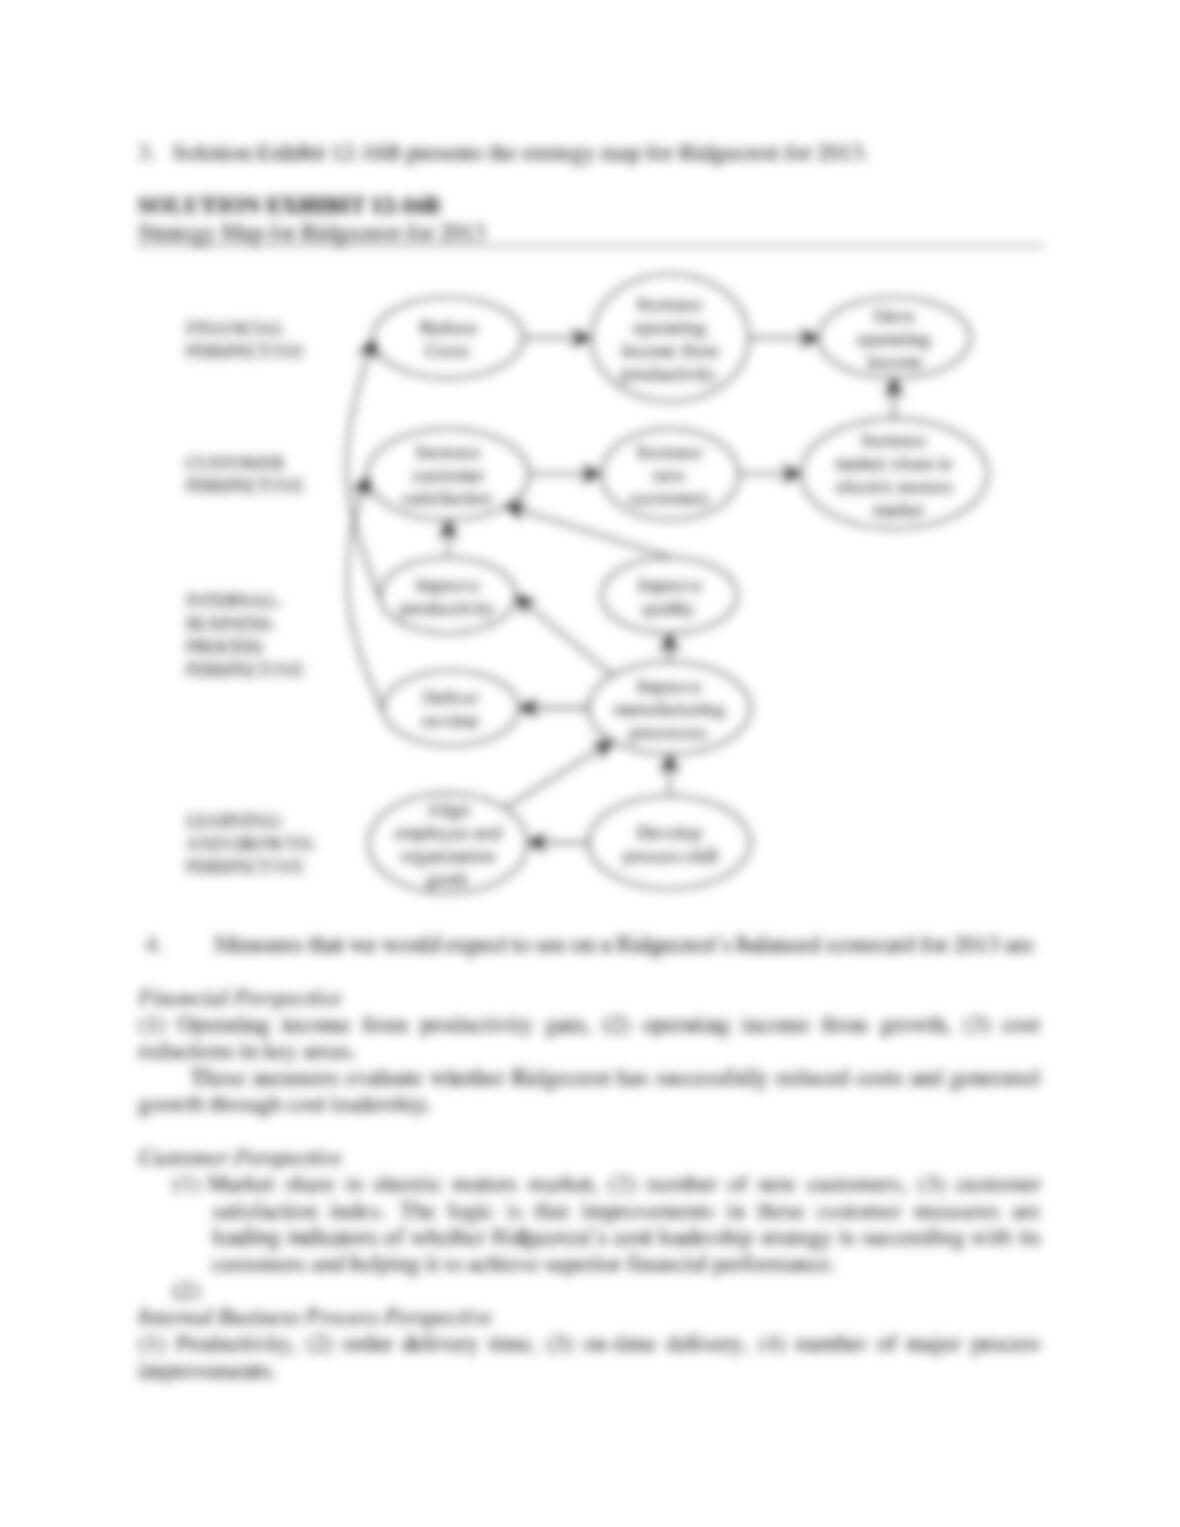
3. Draw a strategy map as in Exhibit 12-2 with two strategic objectives you would expect to see
under each balanced scorecard perspective.
4. For each strategic objective indicate a measure you would expect to see in Ridgecrest’s
balanced scorecard for 2013.
SOLUTION
12-4
12-5
12-6
12-17 (20 min.) Analysis of growth, price-recovery, and productivity components
(continuation of 12-16).
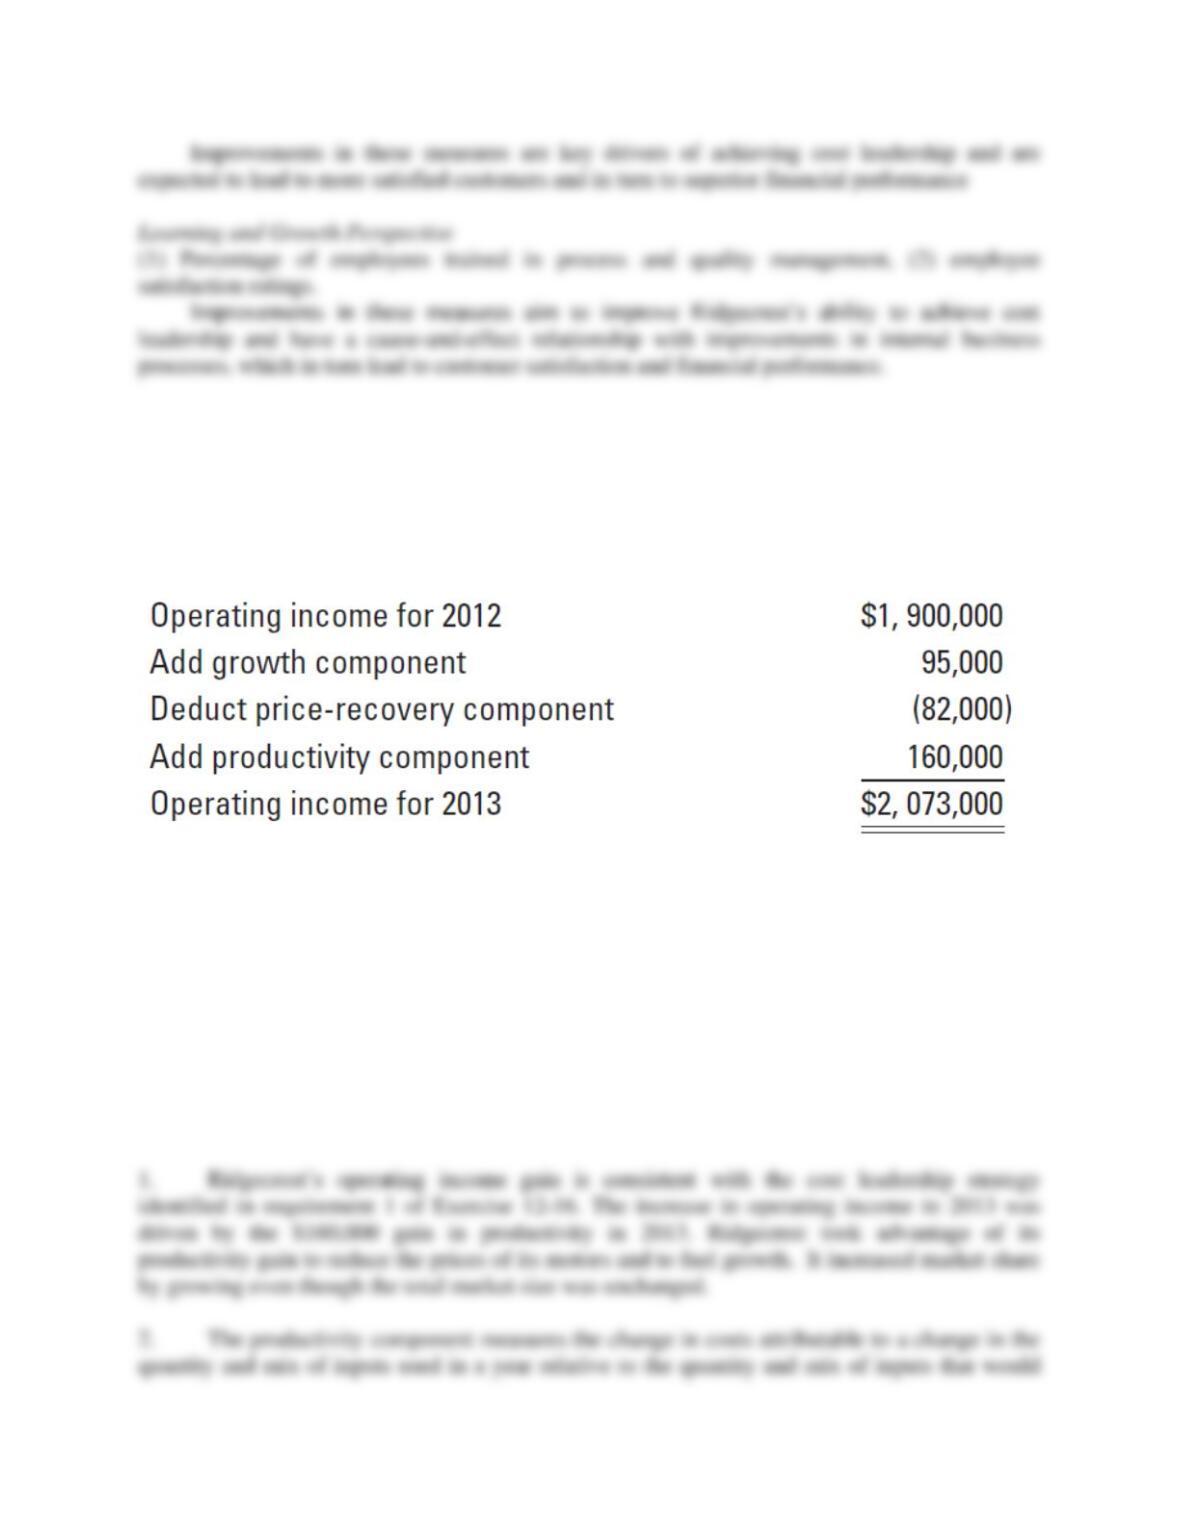
An analysis of Ridgecrest’s operating-income changes between 2012 and 2013 shows the
following:
The industry market size for electric motors did not grow in 2013, input prices did not change,
and Ridgecrest reduced the prices of its motors.
Required:
1. Was Ridgecrest’s gain in operating income in 2013 consistent with the strategy you
identified in requirement 1 of Exercise 12-16?
2. Explain the productivity component. In general, does it represent savings in only variable
costs, only fixed costs, or both variable and fixed costs?
SOLUTION
12-7
12-18 (20 min.) Strategy, balanced scorecard, merchandising operation.
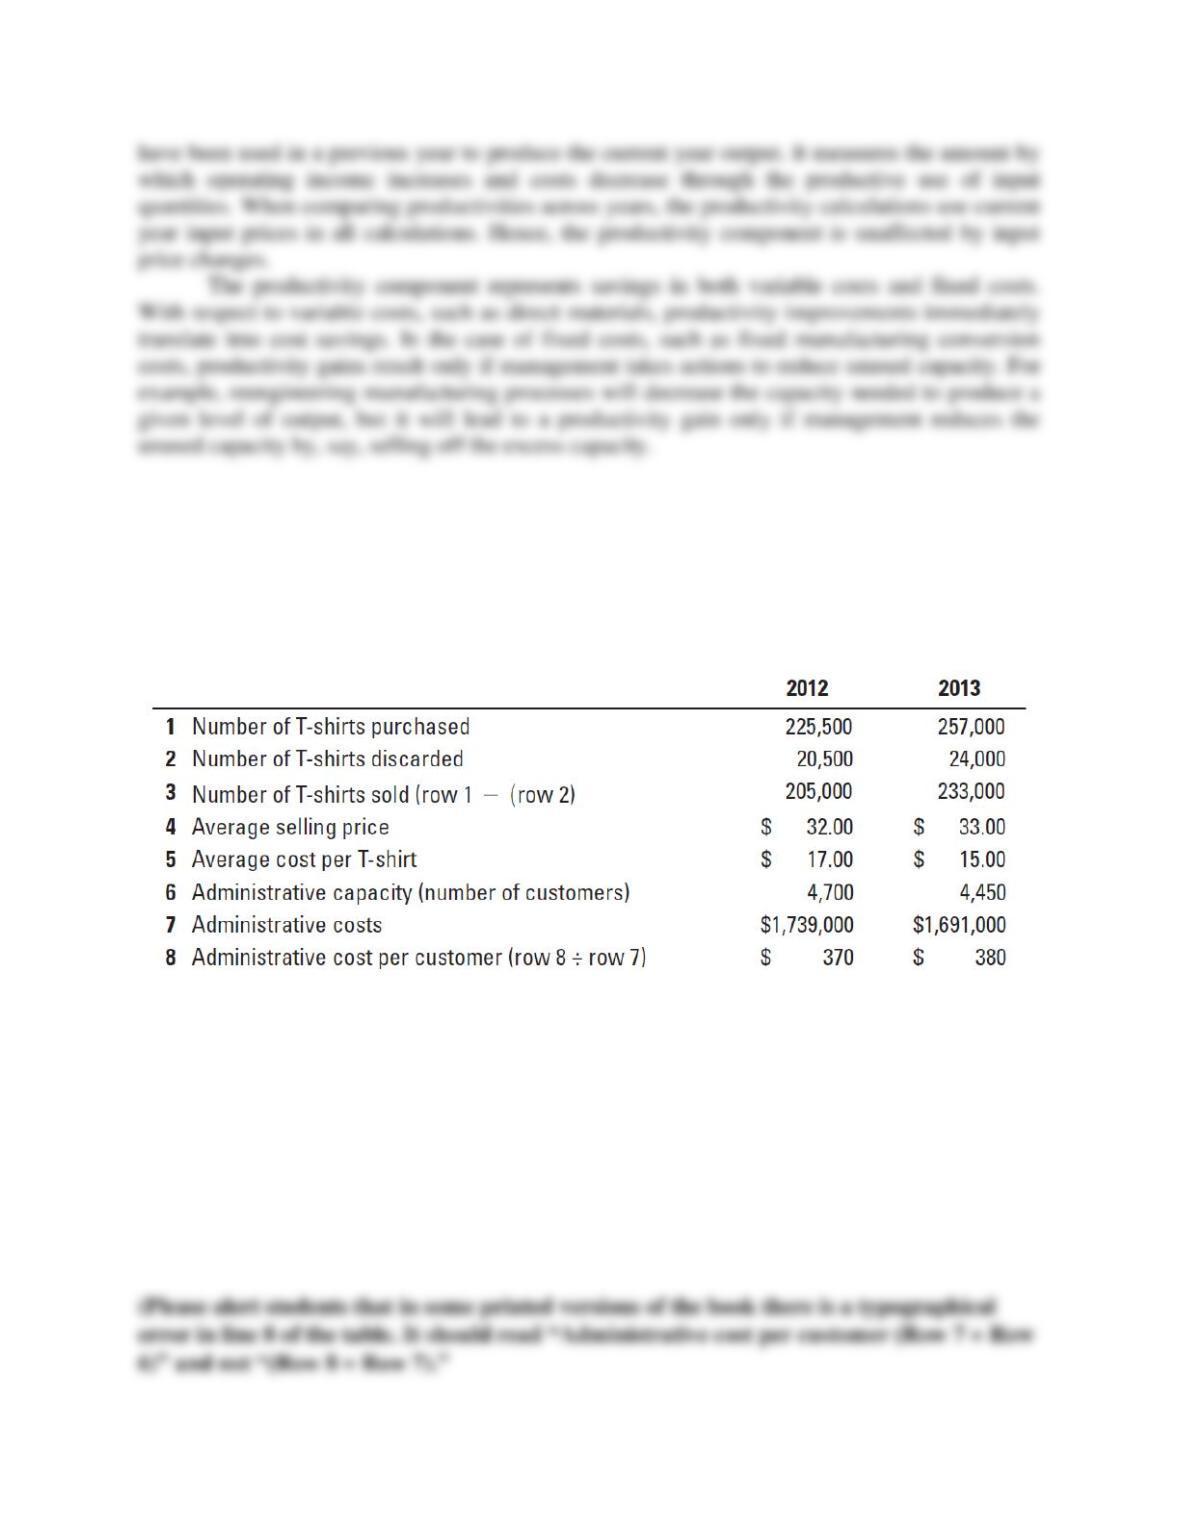
Ramiro & Sons buys T-shirts in bulk, applies its own trendsetting silk-screen designs, and then
sells the T-shirts to a number of retailers. Ramiro wants to be known for its trendsetting designs,
and it wants every teenager to be seen in a distinctive Ramiro T-shirt. Ramiro presents the
following data for its first two years of operations, 2012 and 2013.
Administrative costs depend on the number of customers Ramiro has created capacity to support,
not on the actual number of customers served. Ramiro had 4,300 customers in 2012 and 4,200
customers in 2013.
Required:
1. Is Ramiro’s strategy one of product differentiation or cost leadership? Explain briefly.
2. Describe briefly the key measures Ramiro should include in its balanced scorecard and the
reasons for doing so.
SOLUTION
12-8
12-9
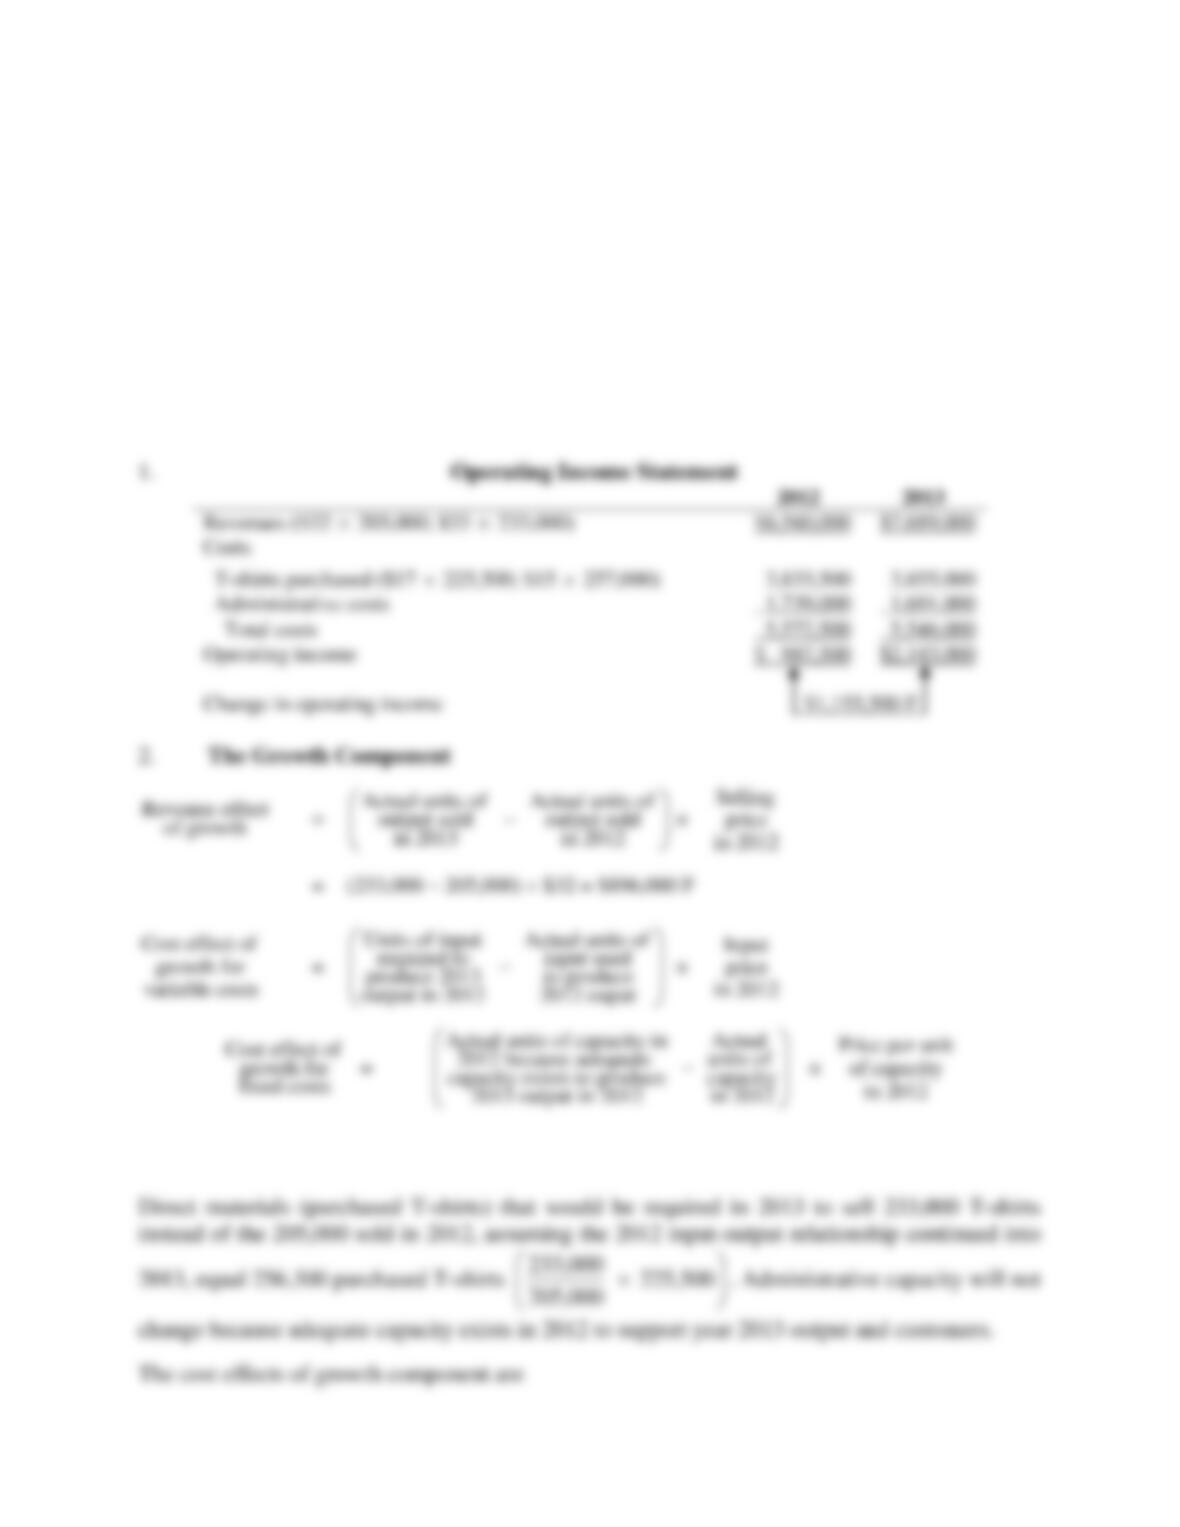
12-19 (25–30 min.) Strategic analysis of operating income (continuation of 12-18).
Refer to Exercise 12-18.
Required:
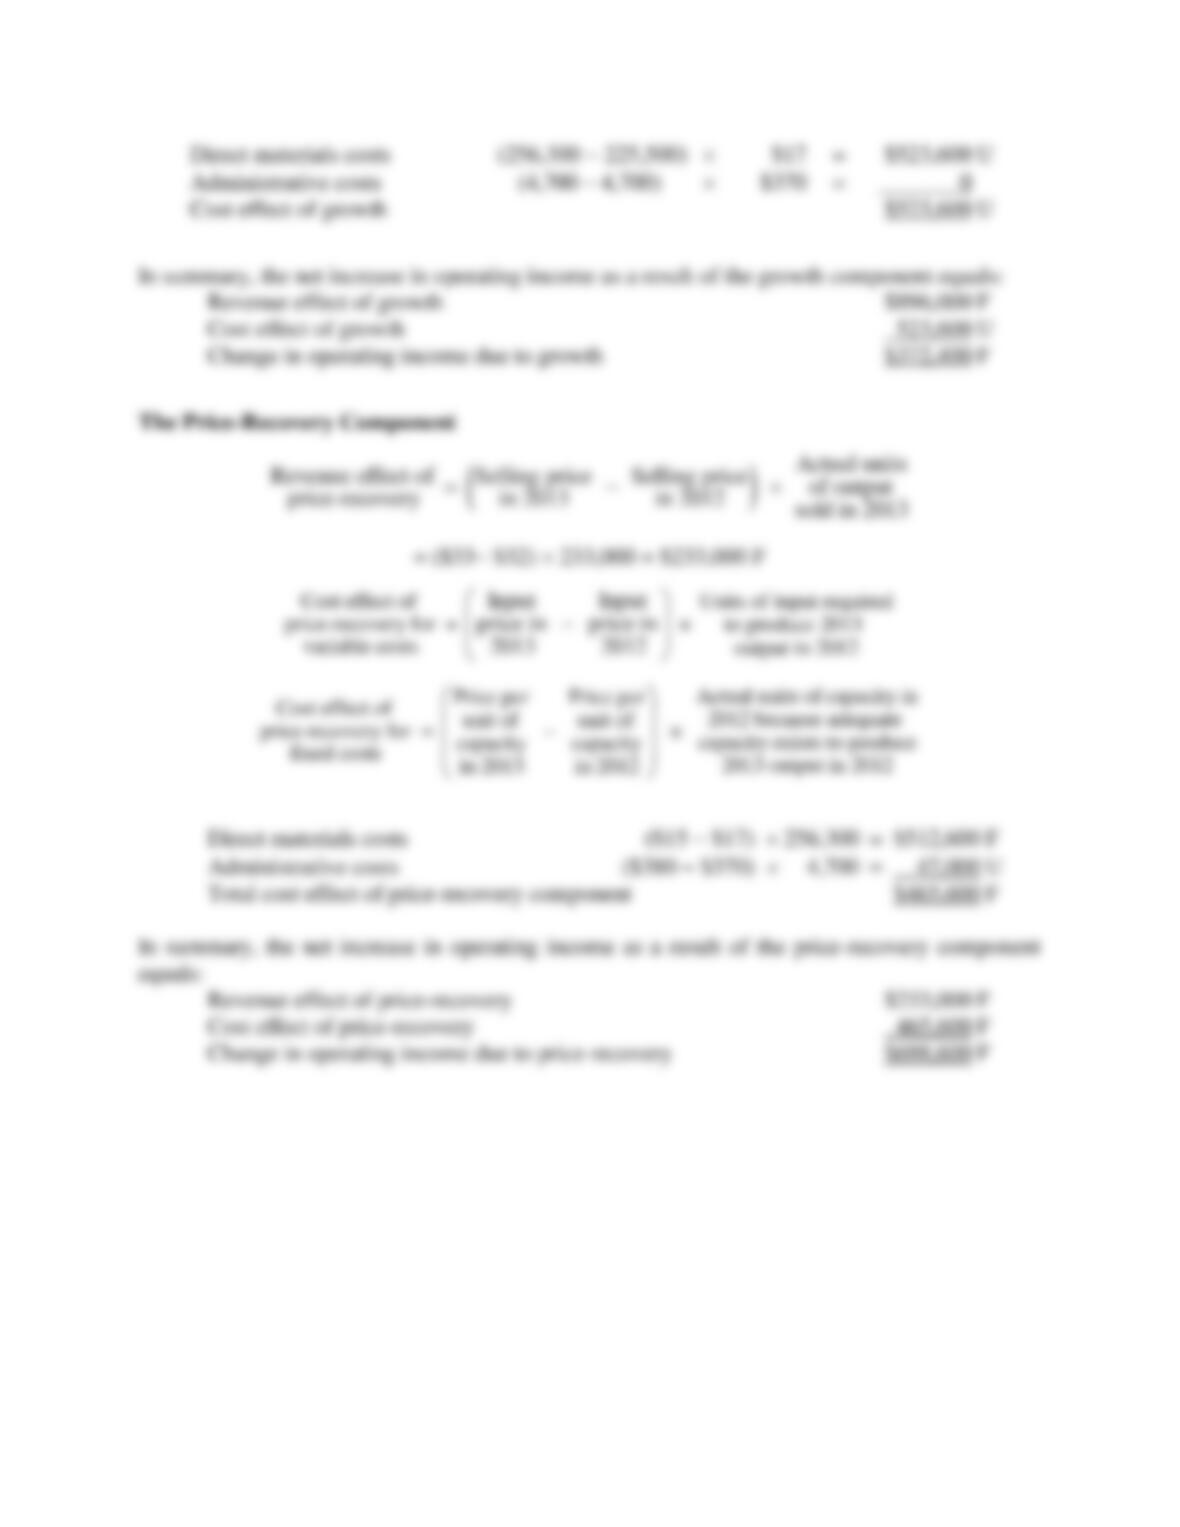
1. Calculate Ramiro‘s operating income in both 2012 and 2013.
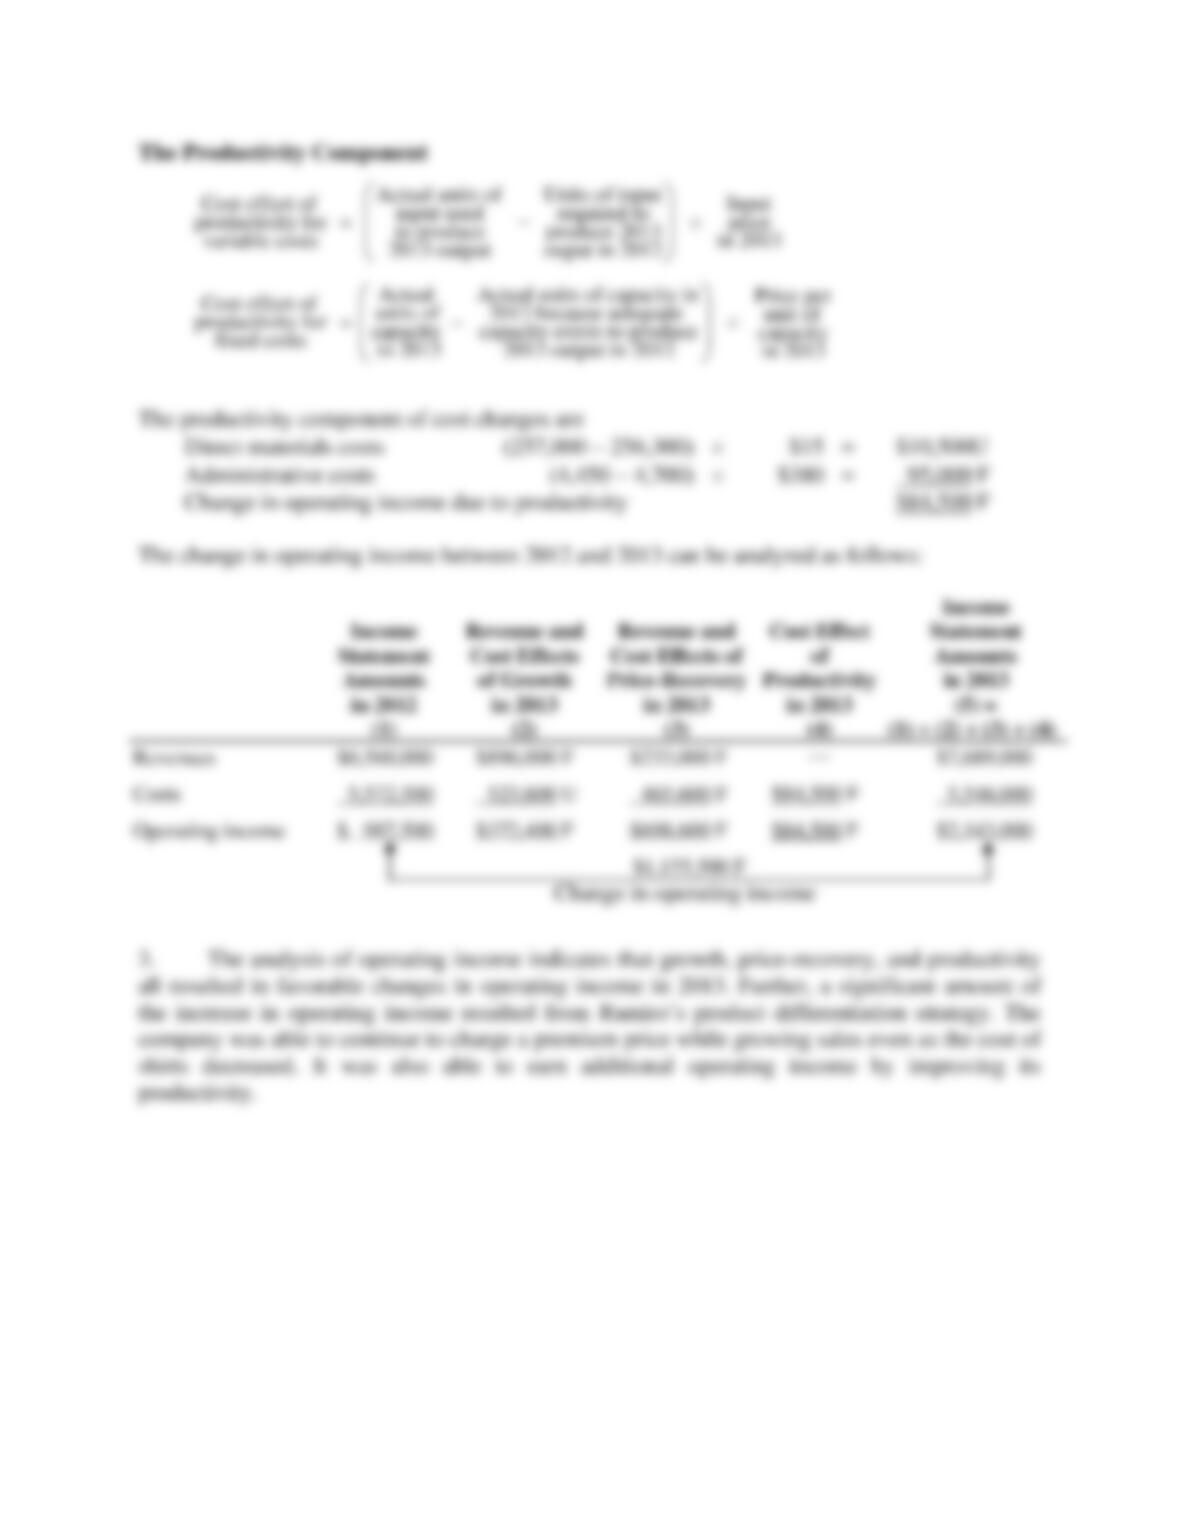
2. Calculate the growth, price-recovery, and productivity components that explain the change in
operating income from 2012 to 2013.
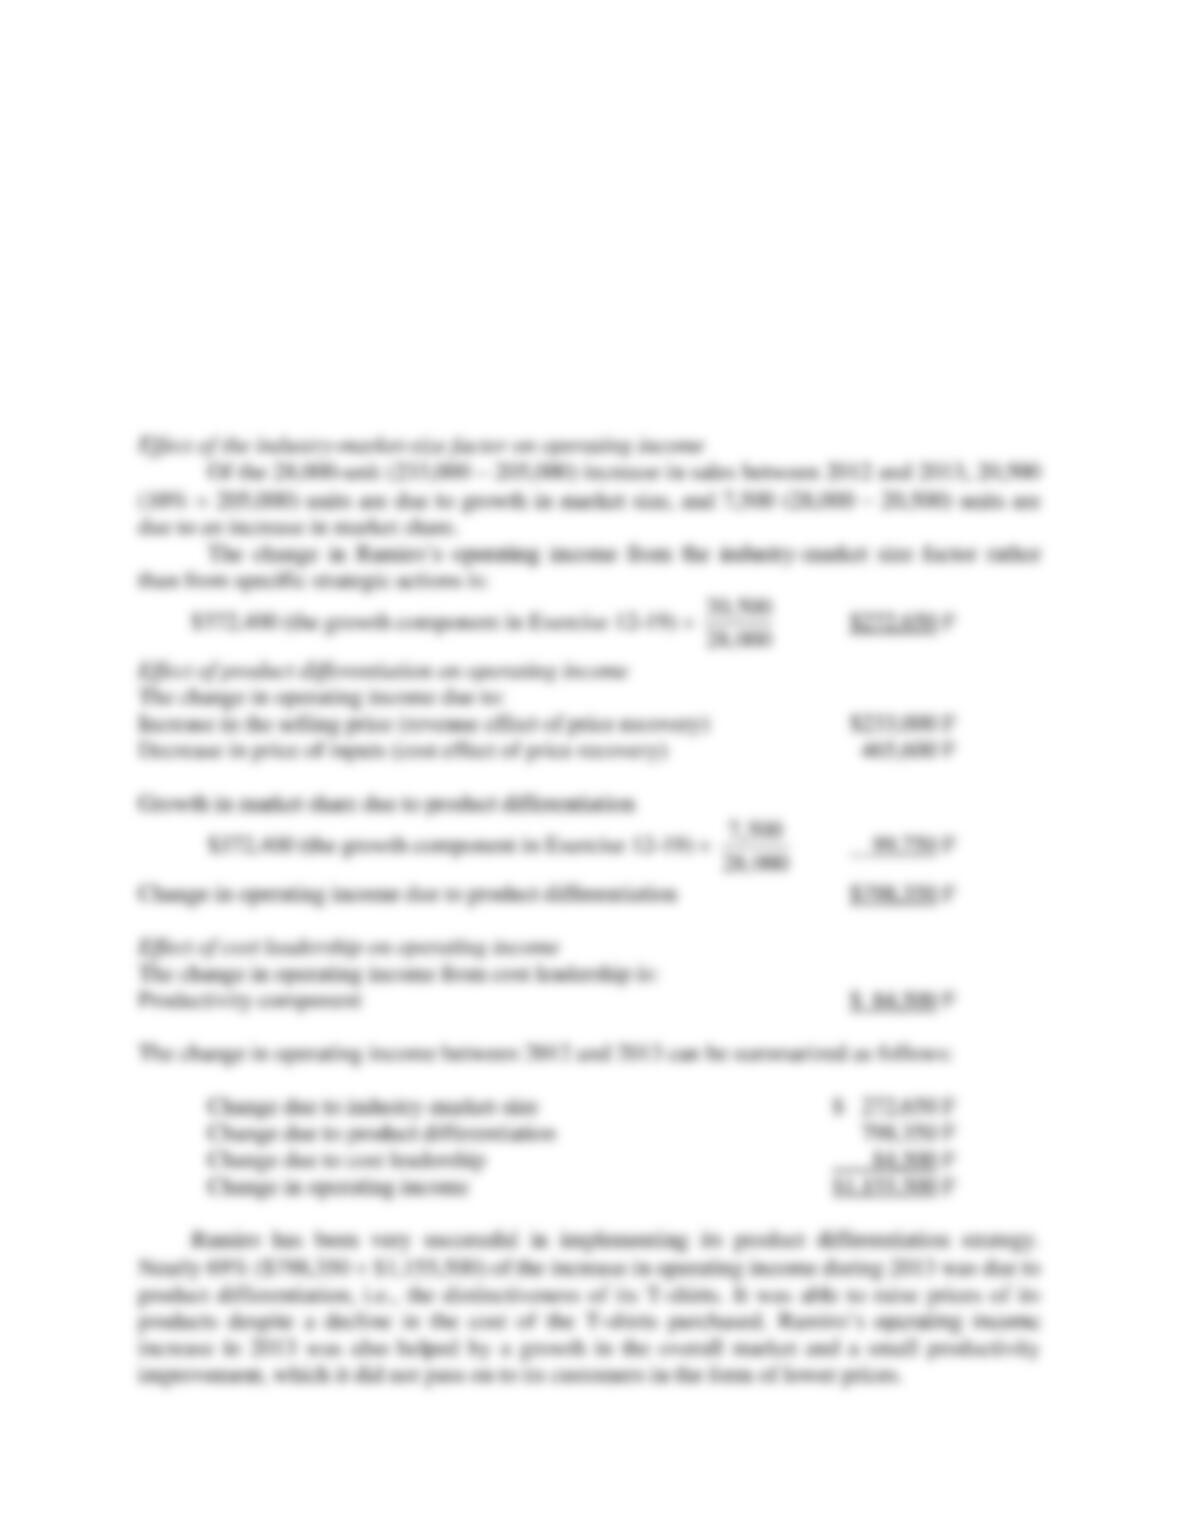
3. Comment on your answers in requirement 2. What does each of these components indicate?
SOLUTION
12-10
12-11
12-12
12-20 (20 min.) Analysis of growth, price-recovery, and productivity components
(continuation of 12-19).
Refer to Exercise 12-19. Suppose that the market for silk-screened T-shirts grew by 10% during
2013. All increases in sales greater than 10% are the result of Ramiro’s strategic actions.
Calculate the change in operating income from 2012 to 2013 due to growth in market size,
product differentiation, and cost leadership. How successful has Ramiro been in implementing its
strategy? Explain.
SOLUTION
12-13
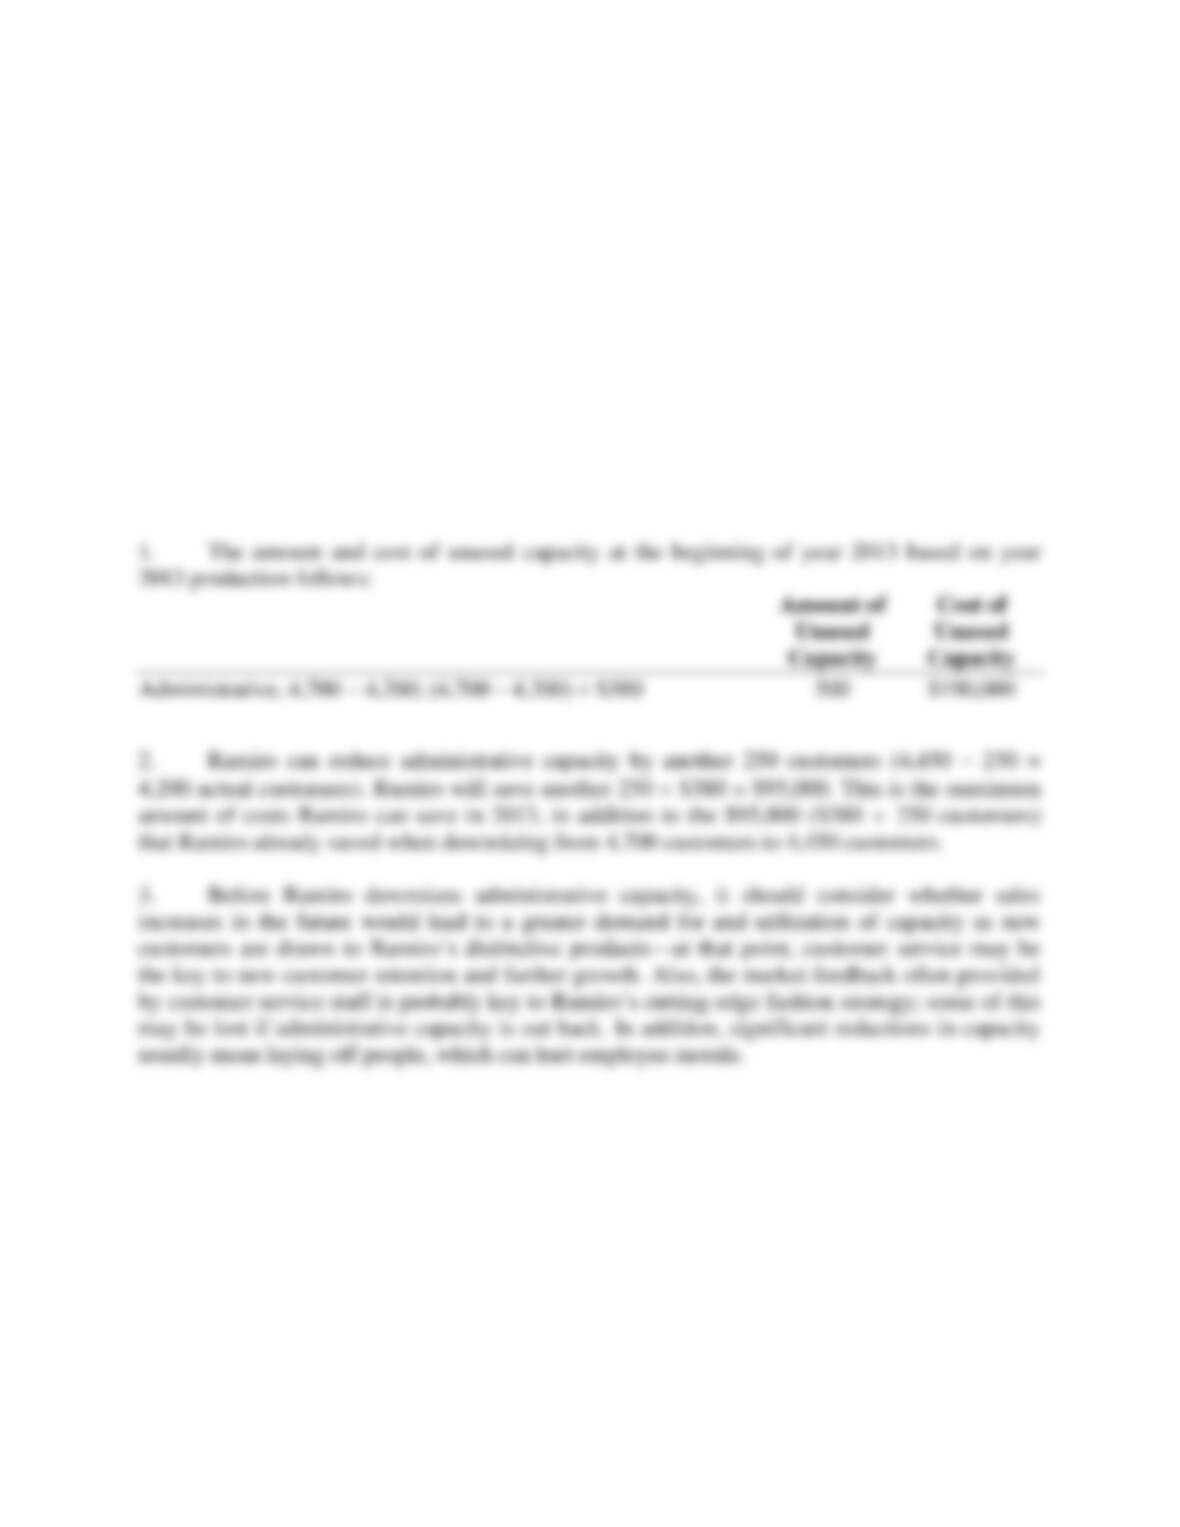
12-21 (15 min.) Identifying and managing unused capacity (continuation of 12-18).
Refer to Exercise 12-18.
Required:
1. Calculate the amount and cost of unused administrative capacity at the beginning of 2013,
based on the actual number of customers Ramiro served in 2013.
2. Suppose Ramiro can only add or reduce administrative capacity in increments of 250
customers. What is the maximum amount of costs that Ramiro can save in 2013 by
downsizing administrative capacity?
3. What factors, other than cost, should Ramiro consider before it downsizes administrative
capacity?
SOLUTION
12-14
12-22 (15 min.) Strategy, balanced scorecard.
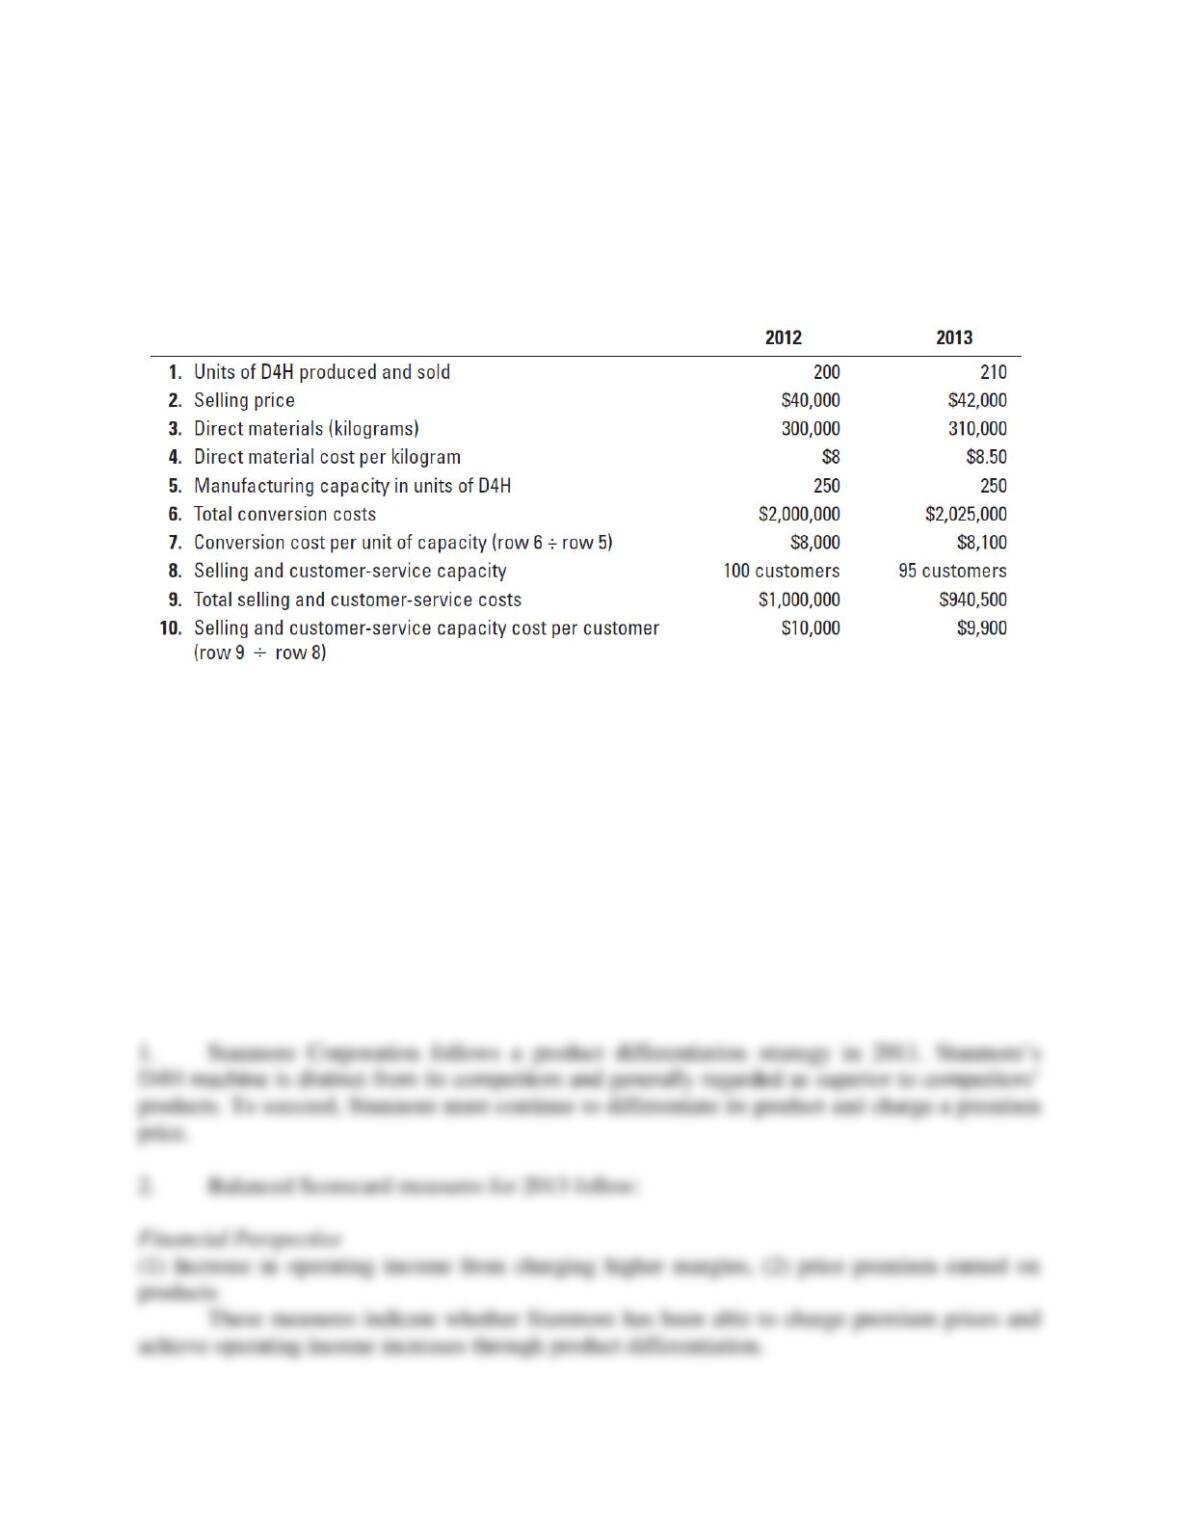
Stanmore Corporation makes a special-purpose machine, D4H, used in the textile industry.
Stanmore has designed the D4H machine for 2013 to be distinct from its competitors. It has been
generally regarded as a superior machine. Stanmore presents the following data for 2012 and
2013.
Stanmore produces no defective machines, but it wants to reduce direct materials usage per D4H
machine in 2013. Conversion costs in each year depend on production capacity defined in terms
of D4H units that can be produced, not the actual units produced. Selling and customer-service
costs depend on the number of customers that Stanmore can support, not the actual number of
customers it serves. Stanmore has 75 customers in 2012 and 80 customers in 2013.
Required:
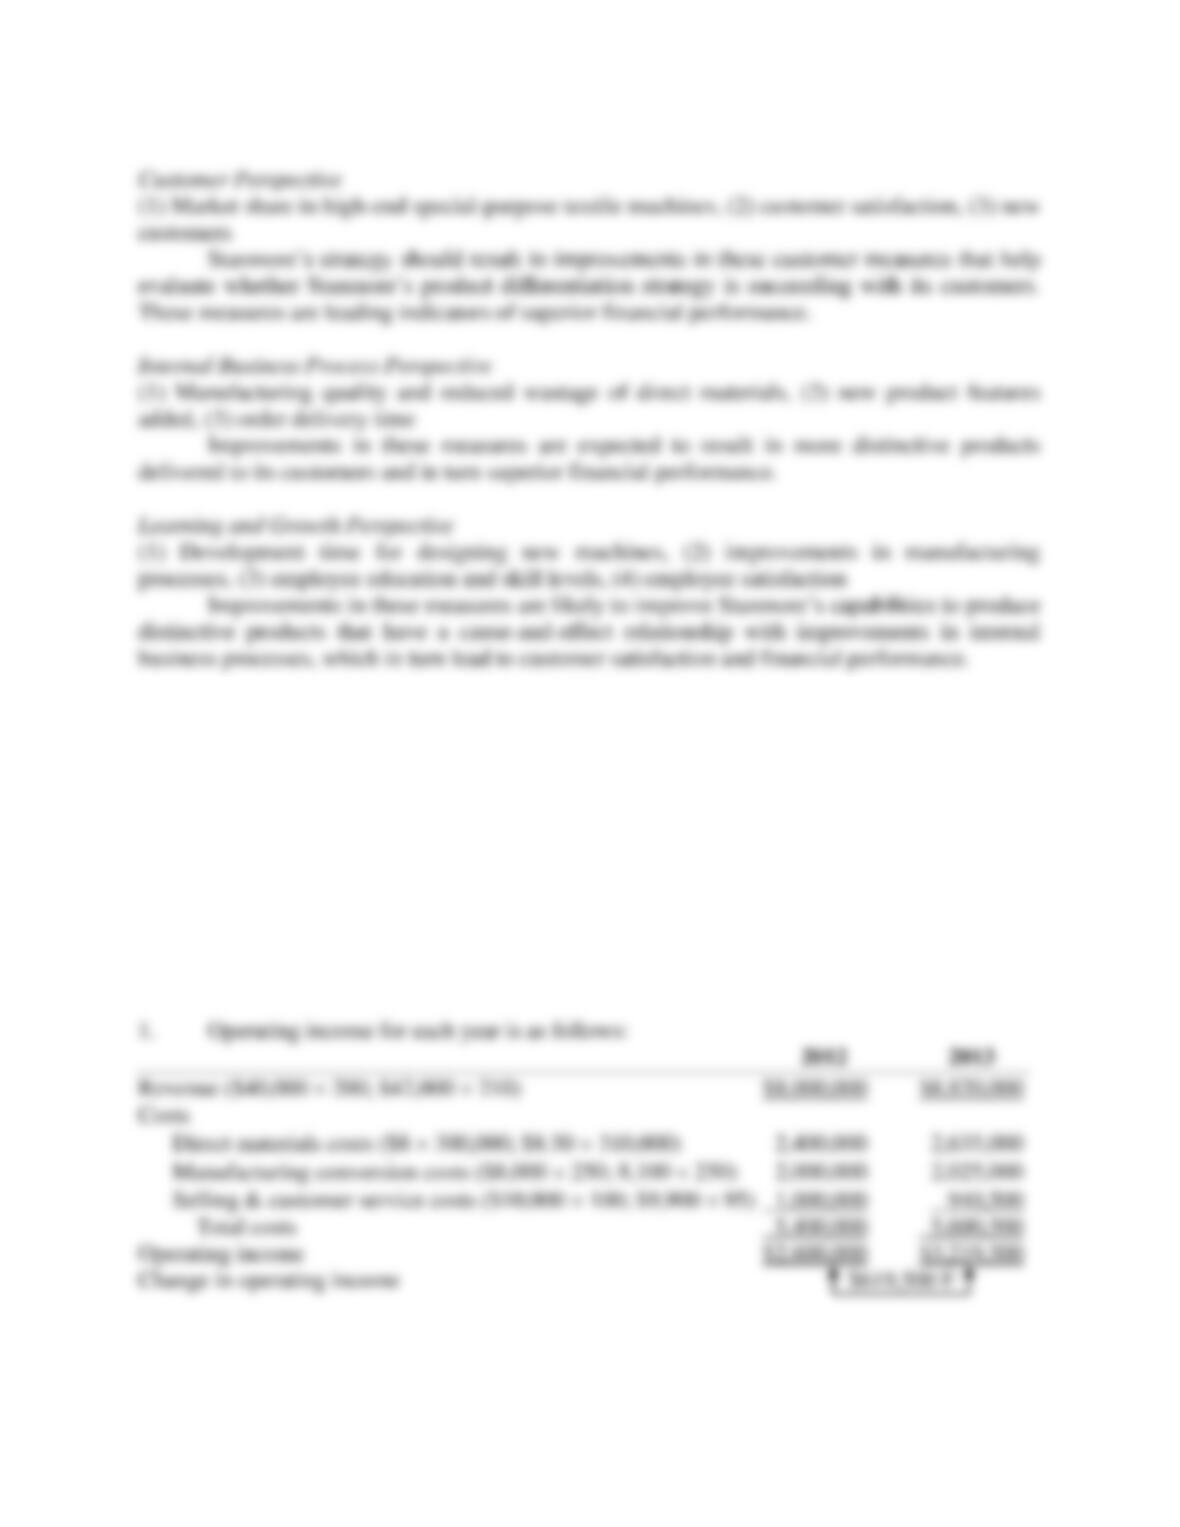
1. Is Stanmore’s strategy one of product differentiation or cost leadership? Explain briefly.
2. Describe briefly key measures that you would include in Stanmore’s balanced scorecard and
the reasons for doing so.
SOLUTION
12-15
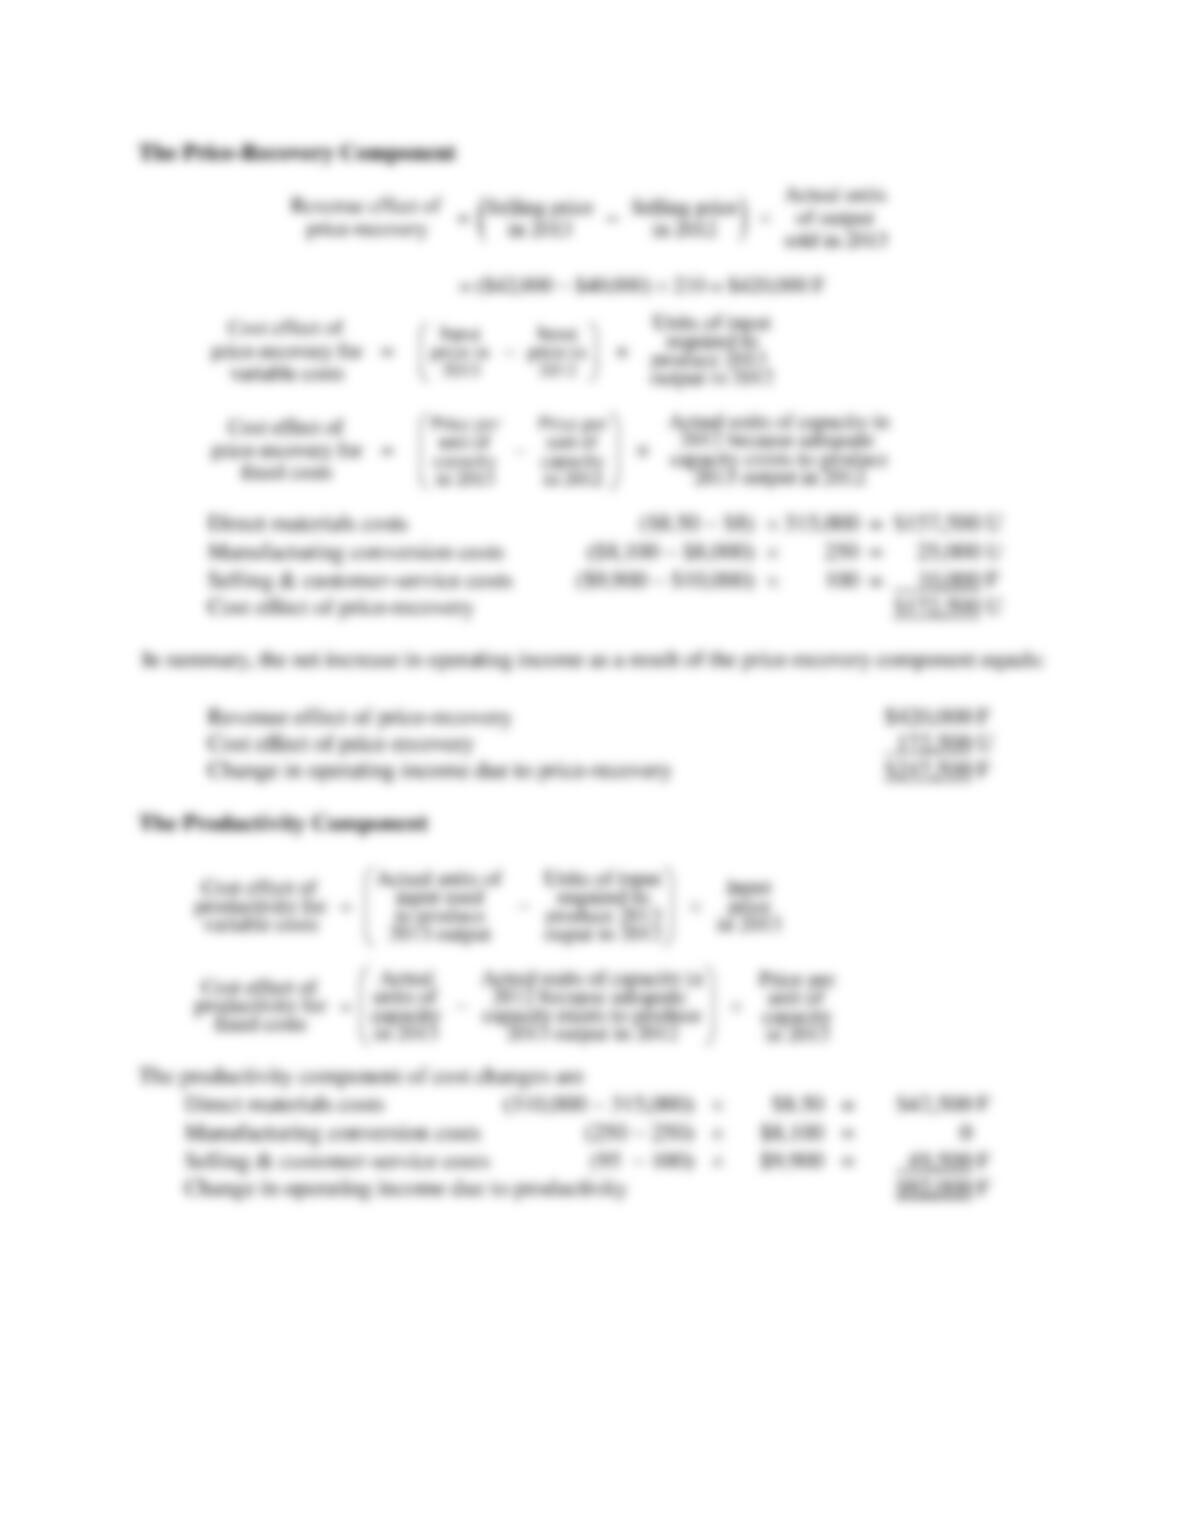
12-23 (30 min.) Strategic analysis of operating income (continuation of 12-22).
Refer to Exercise 12-22.
Required:
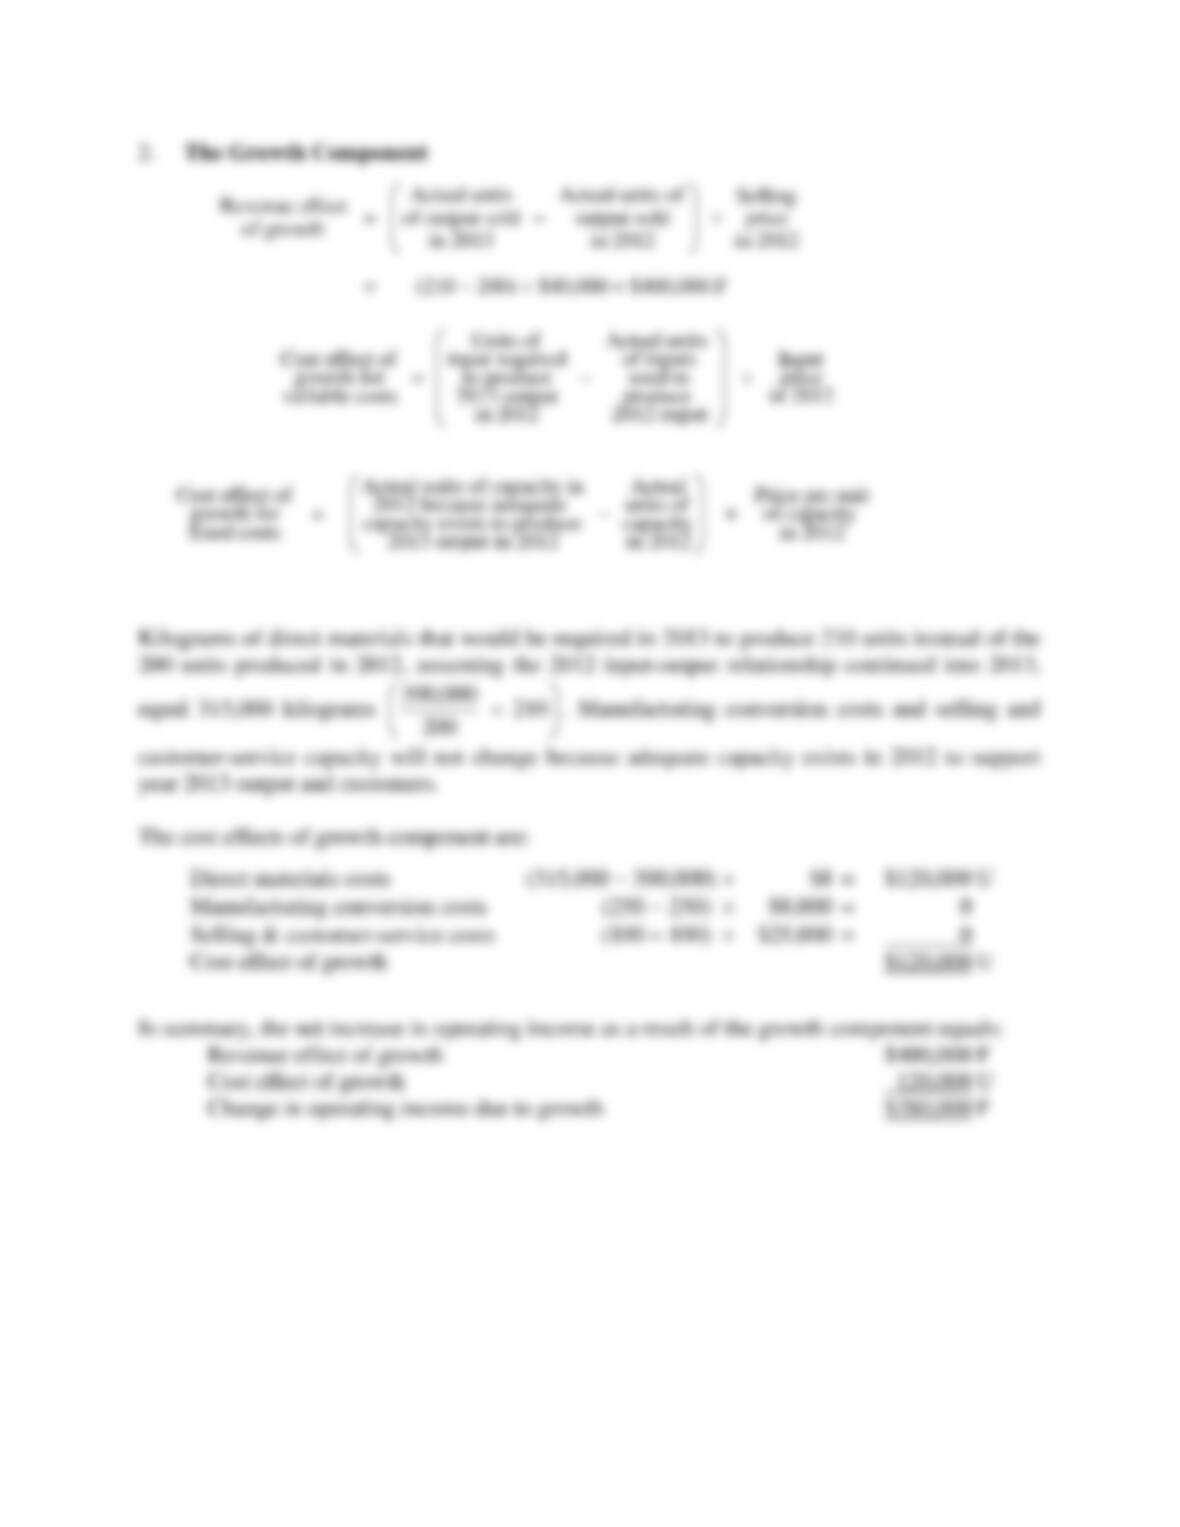
1. Calculate the operating income of Stanmore Corporation in 2012 and 2013.
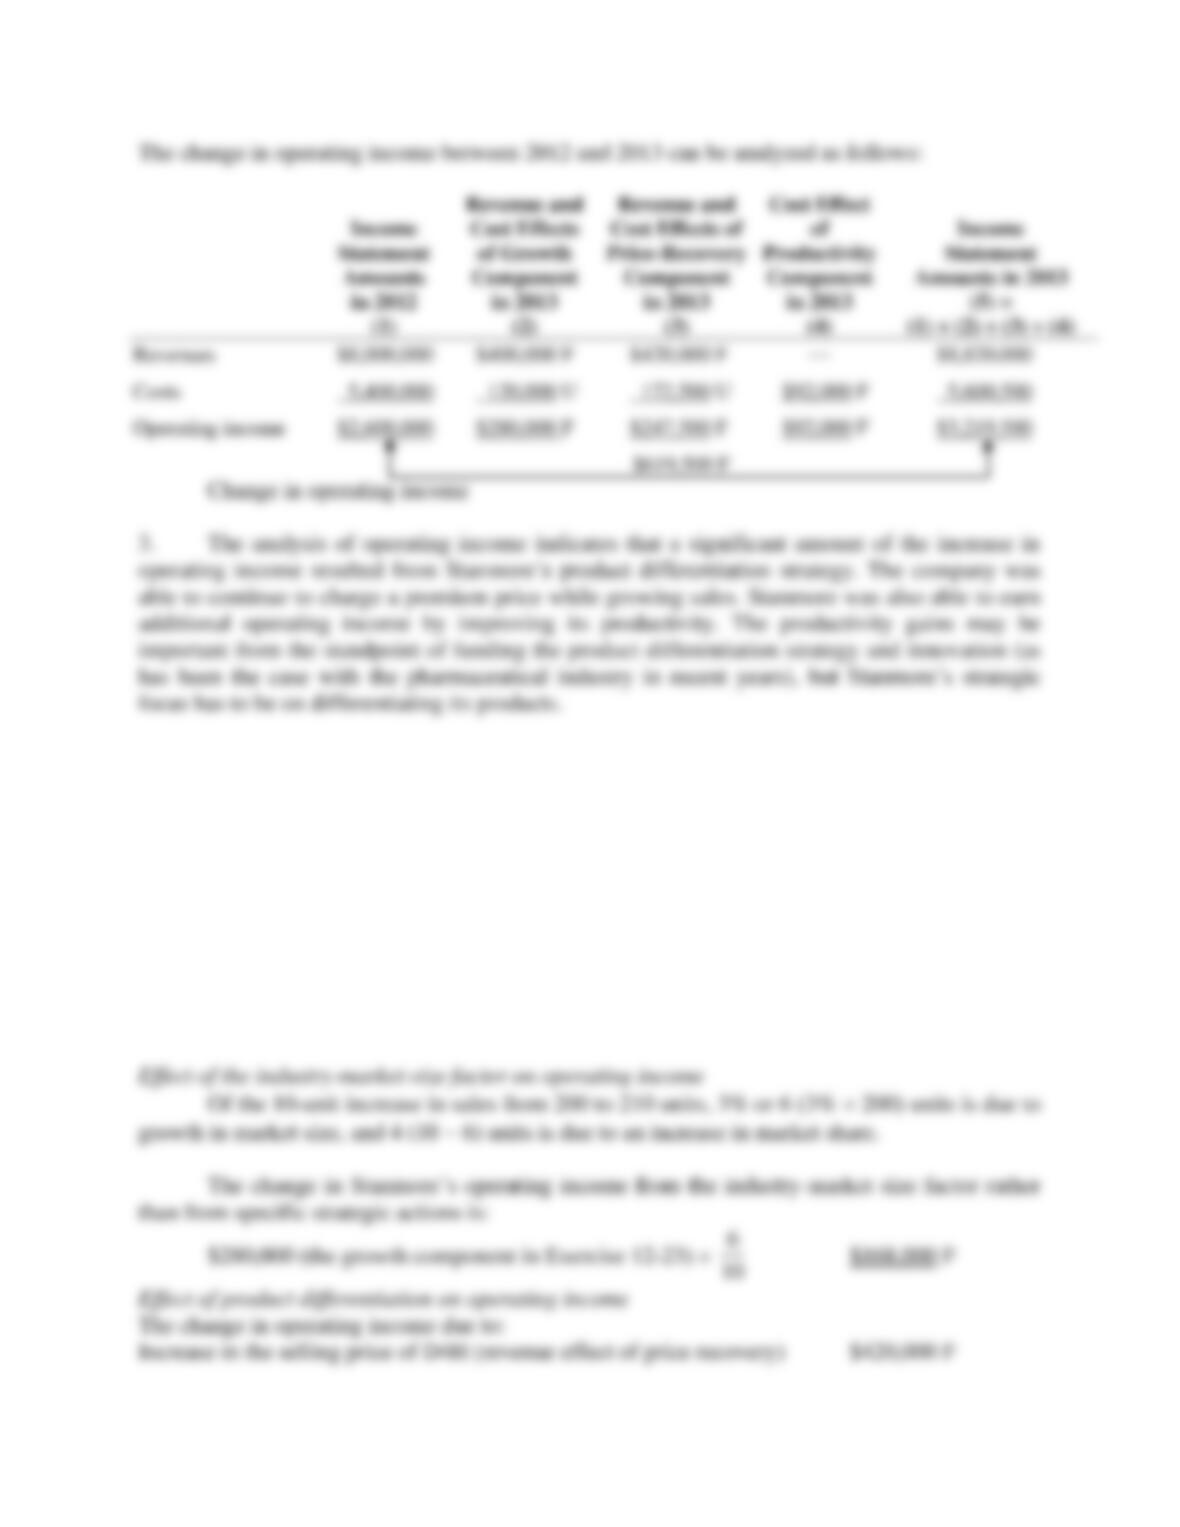
2. Calculate the growth, price-recovery, and productivity components that explain the change in
operating income from 2012 to 2013.
3. Comment on your answer in requirement 2. What do these components indicate?
SOLUTION
12-16
12-17
12-18
12-24 (20 min.)Analysis of growth, price-recovery, and productivity components
(continuation of 12-23).
Suppose that during 2013, the market for Stanmore’s special-purpose machines grew by 3%. All
increases in market share (that is, sales increases greater than 3%) are the result of Stanmore’s
strategic actions.
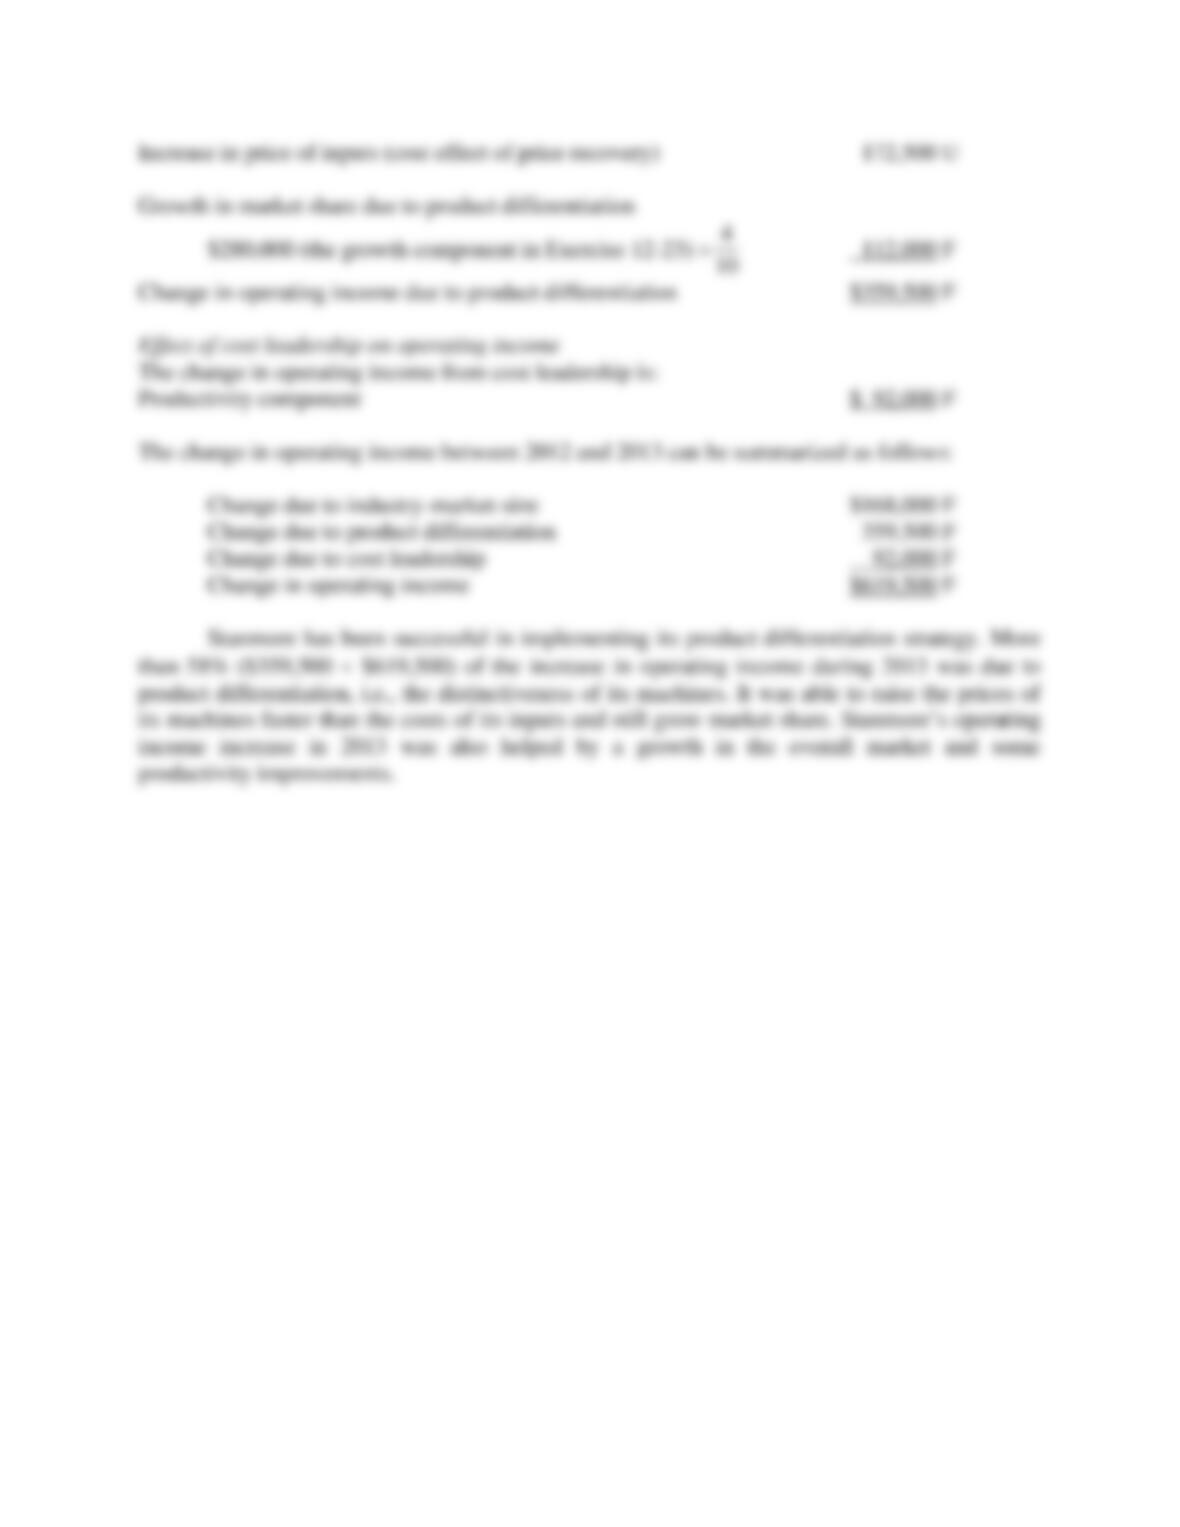
Calculate how much of the change in operating income from 2012 to 2013 is due to the
industry-market-size factor, product differentiation, and cost leadership. How successful has
Stanmore been in implementing its strategy? Explain.
SOLUTION
12-19
12-25 (15 min.) Identifying and managing unused capacity (continuation of 12-22).
Refer to Exercise 12-22.
Required:
1. Calculate the amount and cost of (a) unused manufacturing capacity and (b) unused selling
and customer-service capacity at the beginning of 2013 based on actual production and actual
number of customers served in 2013.
2. Suppose Stanmore can add or reduce its manufacturing capacity in increments of 30 units.
What is the maximum amount of costs that Stanmore could save in 2013 by downsizing
manufacturing capacity?
3. Stanmore, in fact, does not eliminate any of its unused manufacturing capacity. Why might
Stanmore not downsize?
12-20
SOLUTION
12-26 (15 min.) Strategy, balanced scorecard, service company.
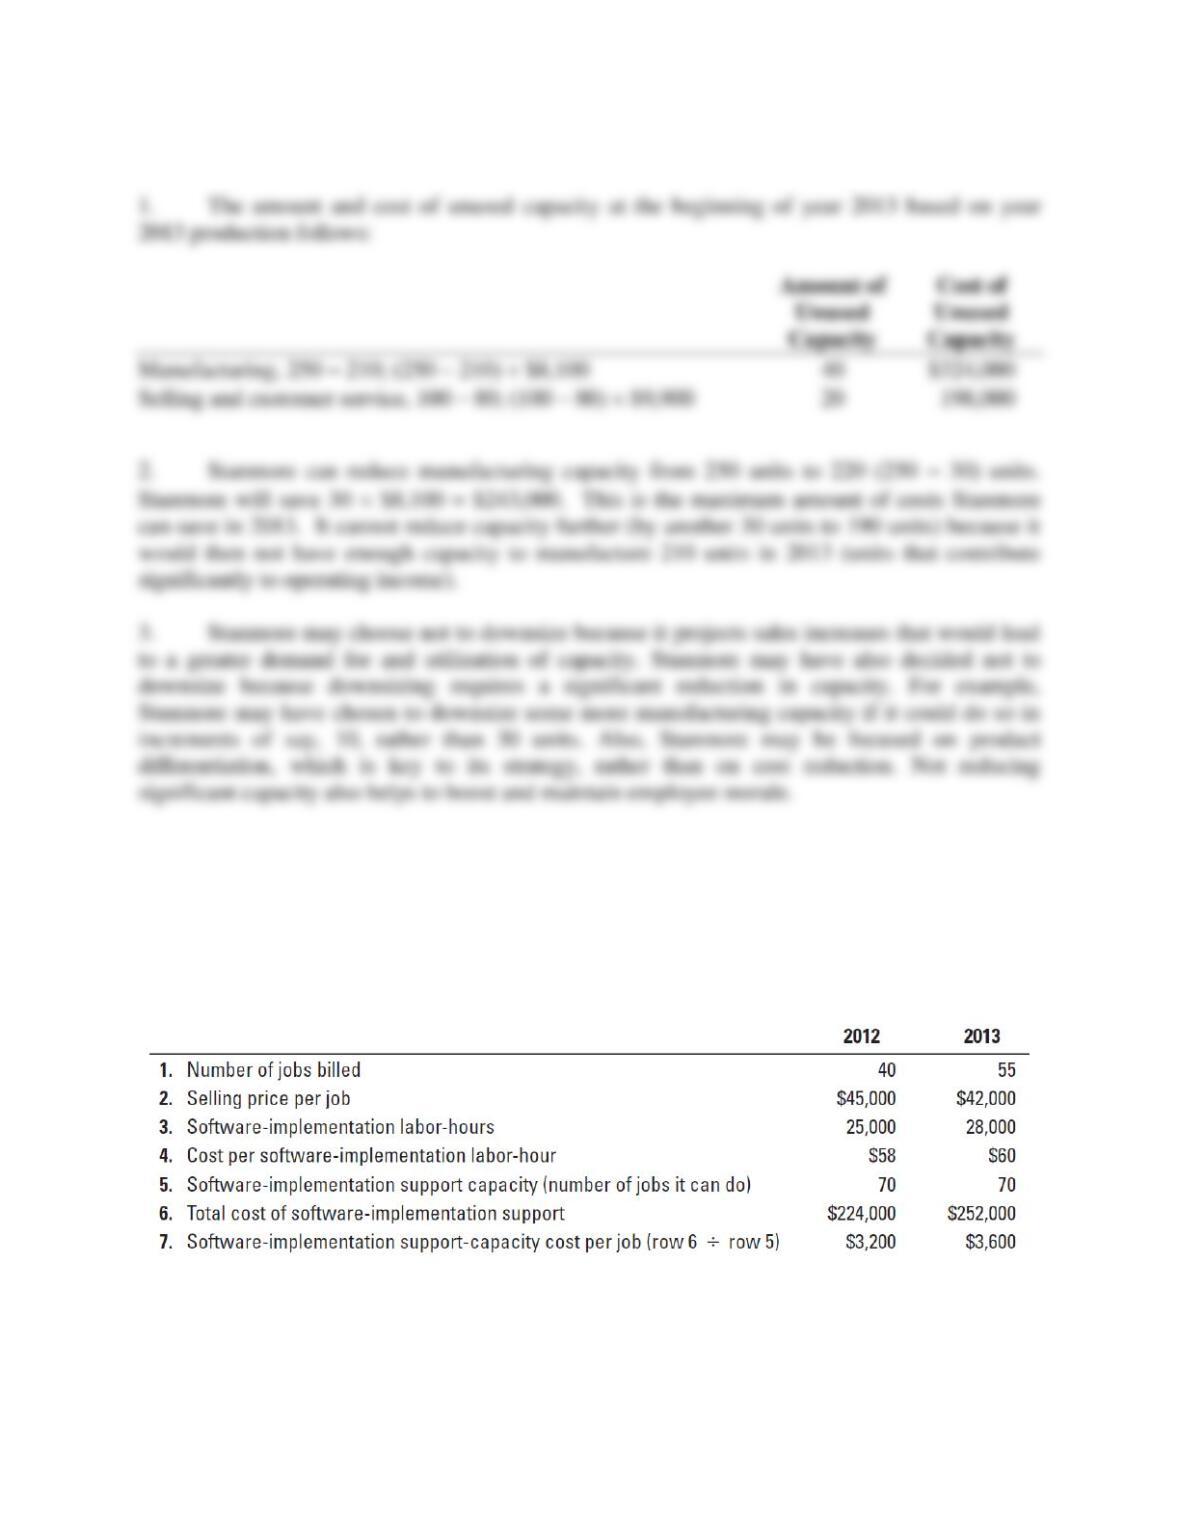
Southland Corporation is a small information- systems consulting firm that specializes in helping
companies implement standard sales-management software. The market for Southland’s services
is very competitive. To compete successfully, Southland must deliver quality service at a low
cost. Southland presents the following data for 2012 and 2013.
Software-implementation labor-hour costs are variable costs. Software-implementation support
costs for each year depend on the software-implementation support capacity Southland chooses