Chapter 12 – Financial Statement Analysis
Chapter 12
Financial Statement Analysis
REVIEW QUESTIONS
Question 12-1 (LO 12.1, 12.2)
The three types of comparisons commonly used in financial statement analysis are comparisons
Question 12-2 (LO 12.1, 12.2)
For vertical analysis, we express each item as a percentage of the same base amount, such as a
Question 12-3 (LO 12.1)
Question 12-4 (LO 12.1)
The company that has most of its equity balance in retained earnings is likely an older and more
Question 12-5 (LO 12.2)
Question 12-6 (LO 12.3)
We measure income statement accounts over a period of time (like a video), while we measure
Question 12-7 (LO 12.3)
Liquidity refers to a company’s ability to pay its current liabilities. The accounts used to
Question 12-8 (LO 12.3)
Question 12-9 (LO 12.3)
(a) Good news.
Question 12-10 (LO 12.3)
Question 12-11 (LO 12.4)
Question 12-12 (LO 12.4)
(a) Good news.
Question 12-13 (LO 12.4)
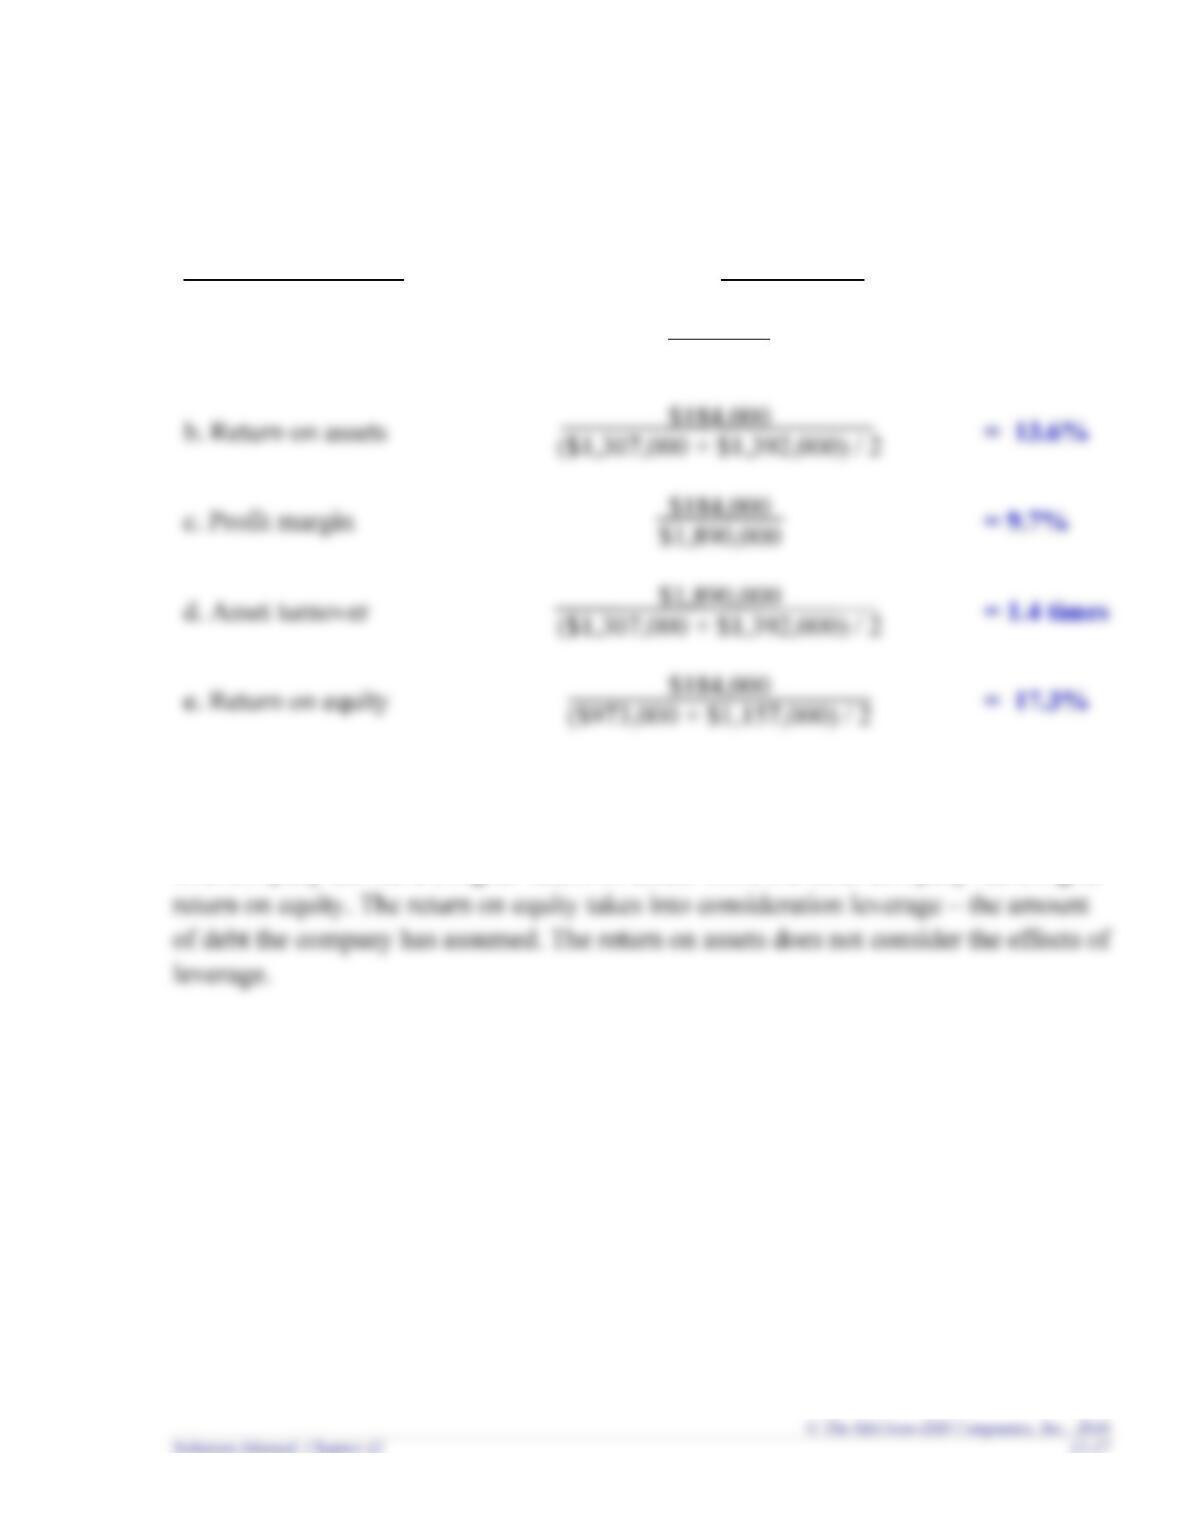
The return on assets and the return on equity differ due to financial leverage – the amount of debt
Question 12-14 (LO 12.5)
Question 12-15 (LO 12.6)
The trend in earnings per share is favorable. Companies report discontinued operations
Question 12–16 (LO 12.6)
Question 12–17 (LO 12.6)
A larger estimation of the allowance for uncollectible accounts, the write-down of overvalued
Question 12-18 (LO 12.6)
A lower estimation of the allowance for uncollectible accounts, waiting to report an inventory
Question 12–20 (LO 12.6)
All of the changes proposed near the end of the chapter improve the income statement and the
Chapter 12 – Financial Statement Analysis
BRIEF EXERCISES
Brief Exercise 12-1 (LO 12.1)
2018
2017
Amount
%
Amount
%
Cash
$ 420,000
7.0
$ 1,050,000
21.0
Inventory
18.5
Long-term assets
3,900,000
65.0
54.5
$6,000,000
Brief Exercise 12-2 (LO 12.2)
Year
Increase (Decrease)
2018
2017
Amount
%
Cash
$ 420,000
$ 1,050,000
$ (630,000)
(60.0)
Accounts receivable
Inventory
$6,000,000
20.0
Brief Exercise 12-3 (LO 12.1)
Athletic World’s income before tax as a percentage of sales increased. Income before
Chapter 12 – Financial Statement Analysis
Brief Exercise 12-4 (LO 12.2)
Brief Exercise 12-5 (LO 12.2)
Brief Exercise 12-6 (LO 12.3)
Brief Exercise 12-7 (LO12.3)
Chapter 12 – Financial Statement Analysis
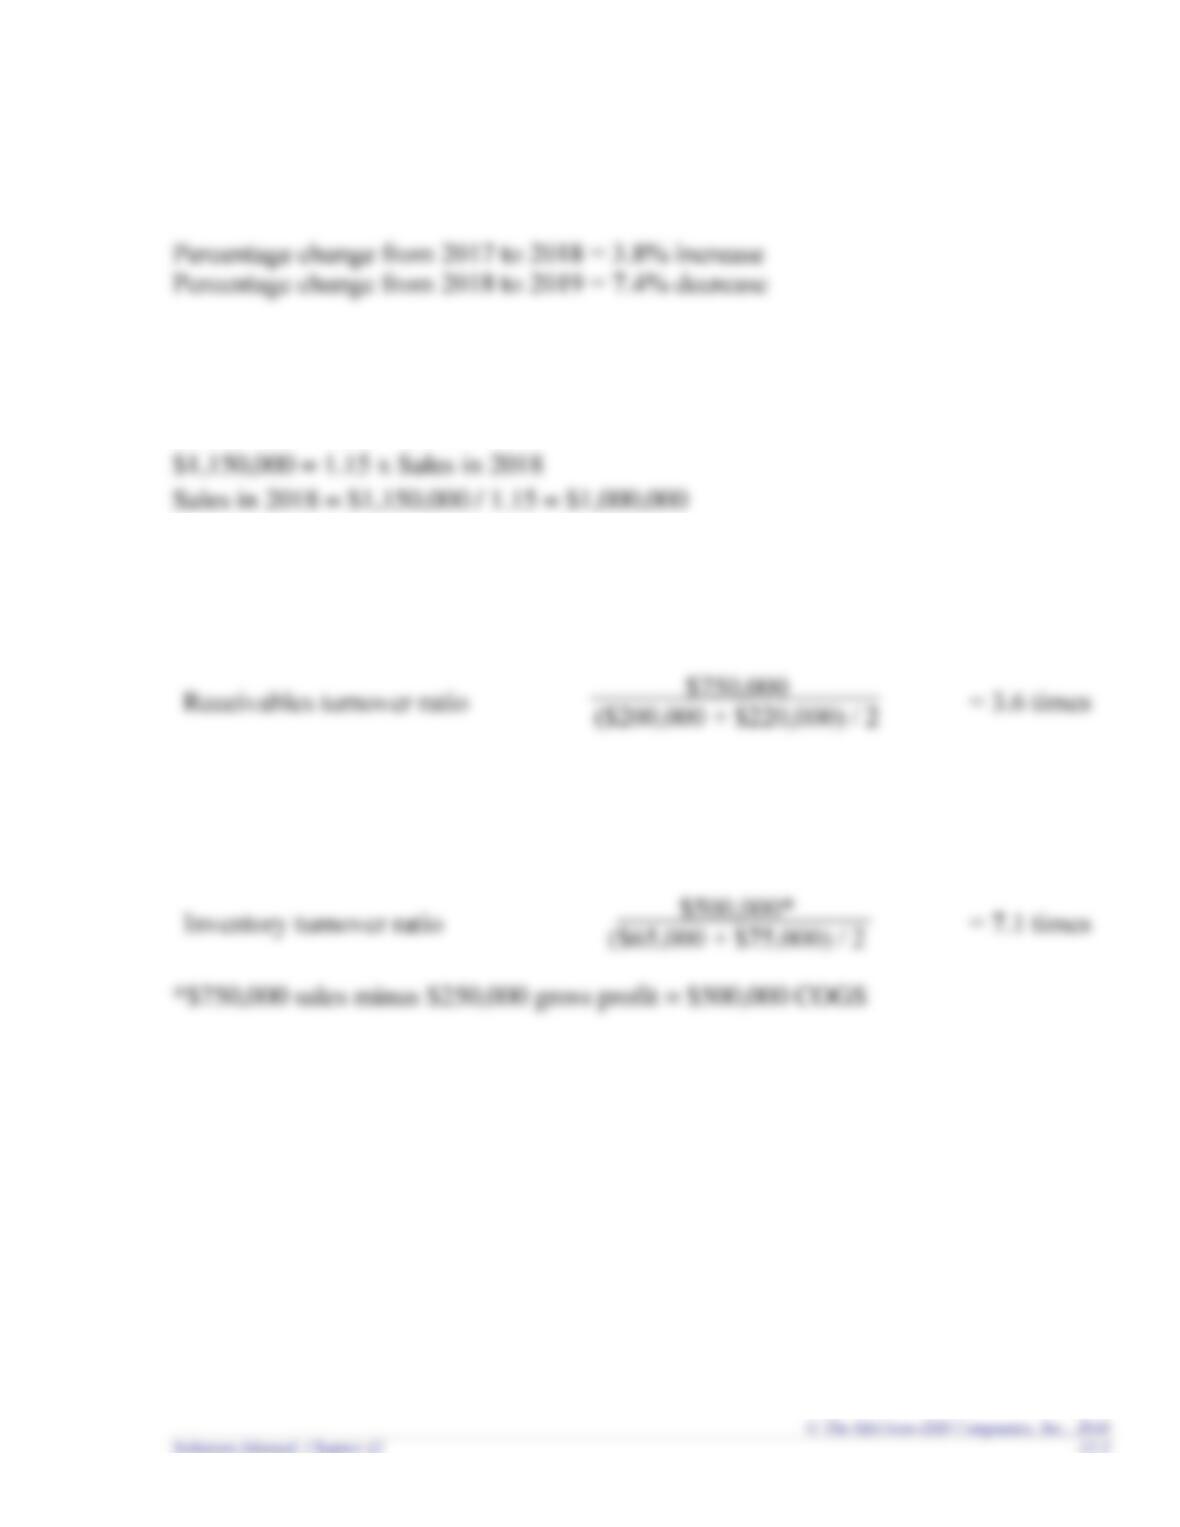
Brief Exercise 12-8 (LO12.3)
COGS must equal $980,000 to complete the inventory turnover ratio.
Inventory turnover ratio
COGS
$200,000
= 4.9 times
Brief Exercise 12-9 (LO12.3)
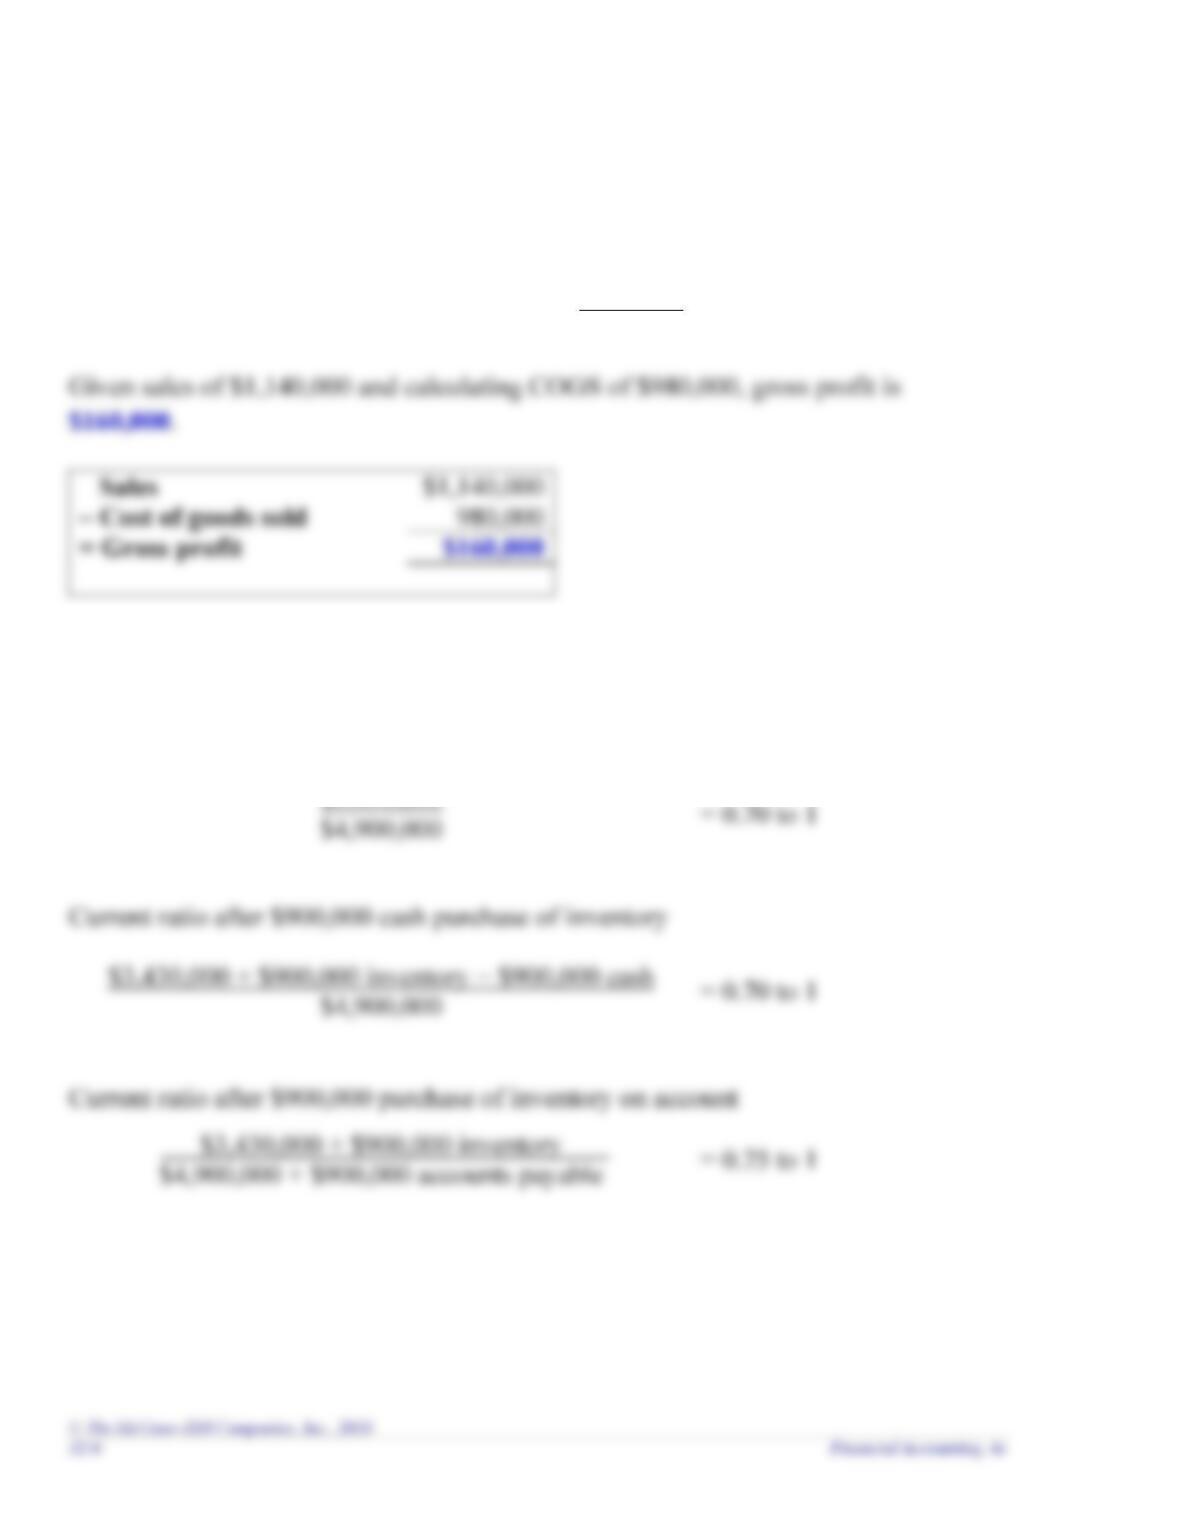
Current ratio before purchase of inventory
= 0.70 to 1
= 0.70 to 1
= 0.75 to 1
Chapter 12 – Financial Statement Analysis
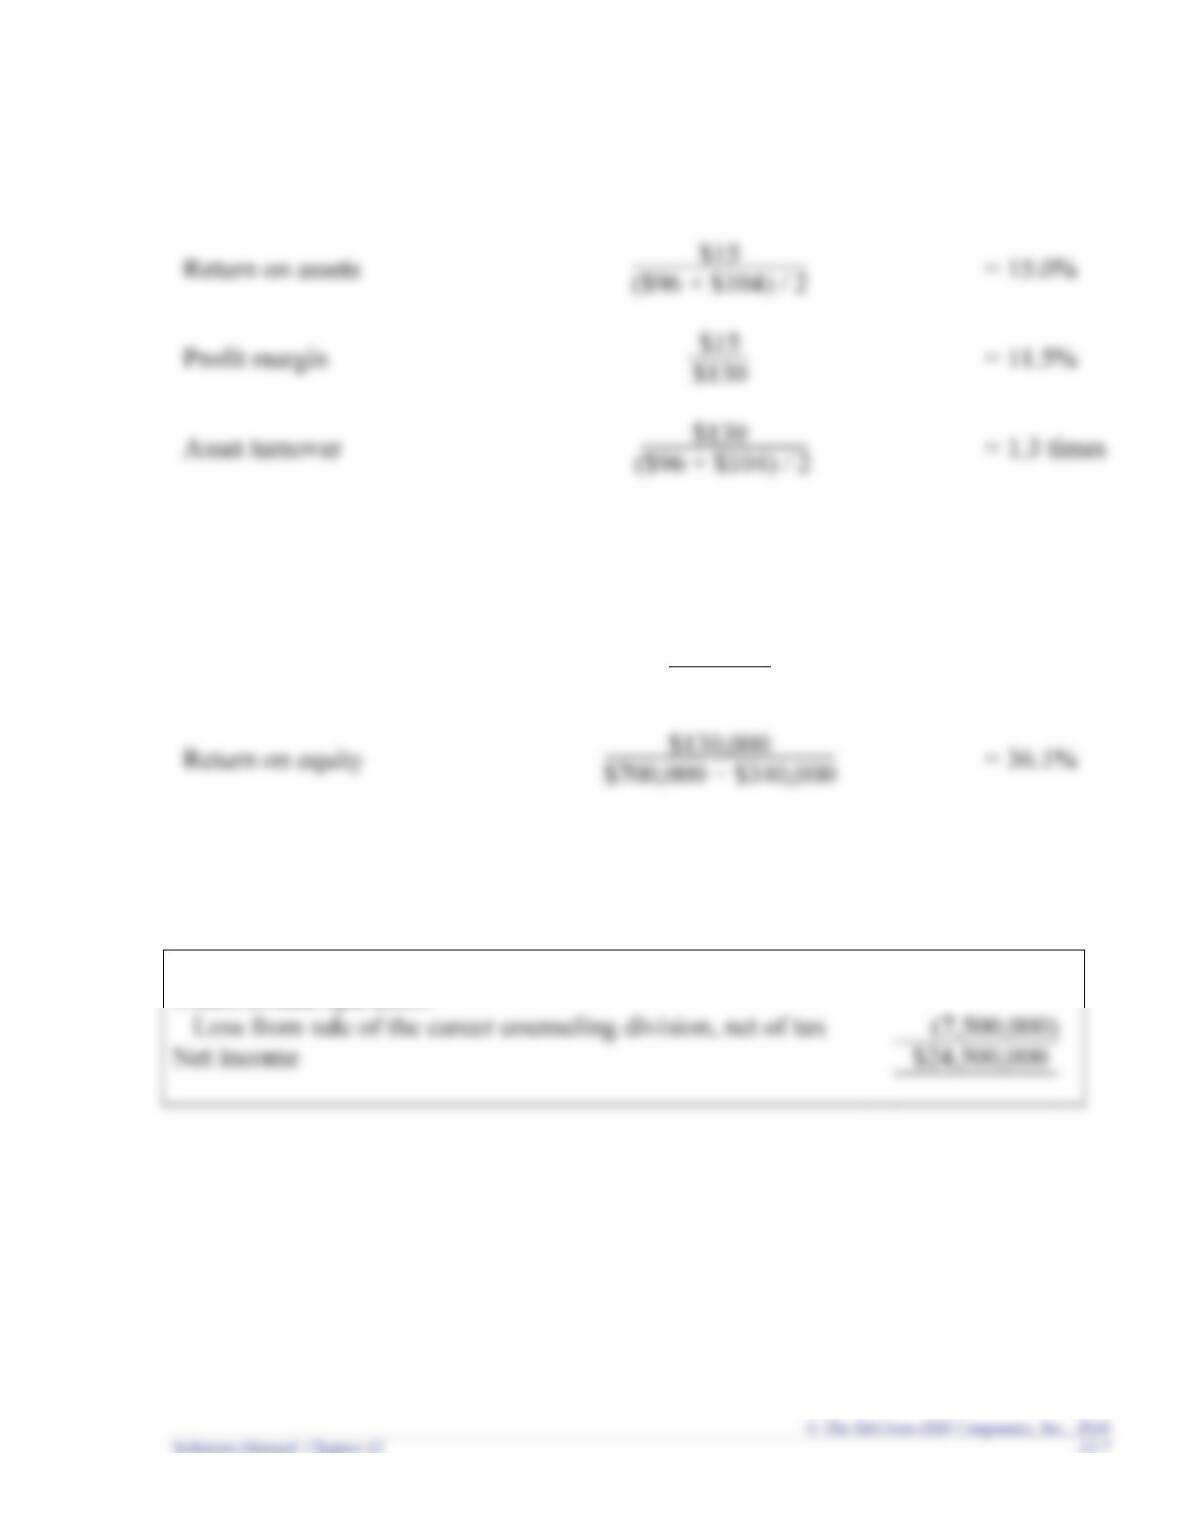
Brief Exercise 12-10 (LO12.4)
Return on assets
= 15.0%
Profit margin
= 11.5%
Asset turnover
= 1.3 times
Brief Exercise 12-11 (LO12.4)
Return on assets
$130,000
$700,000
= 18.6%
Return on equity
= 36.1%
Brief Exercise 12-12 (LO12.5)
Income from continuing operations
$32,000,000
Discontinued operation:
Brief Exercise 12-13 (LO12.5)
12-8 Financial Accounting, 4e
1. Other expenses
2. Other expenses
Brief Exercise 12-14 (LO12.6)
1. Conservative
2. Aggressive
3. Aggressive
Brief Exercise 12-15 (LO12.6)
1. Conservative
2. Conservative
3. Conservative
Chapter 12 – Financial Statement Analysis
EXERCISES
Exercise 12-1 (LO12.1, 12.2, 12.3, 12.4, 12.5, 12.6)
Items
g
1. Vertical analysis
e
2. Horizontal analysis
a
3. Liquidity
h
4. Solvency
5. Discontinued operation
d
6. Quality of earnings
b
7. Conservative accounting practices
Descriptions
a. A company’s ability to pay its current liabilities.
b. Accounting choices that result in reporting lower income, lower assets, and
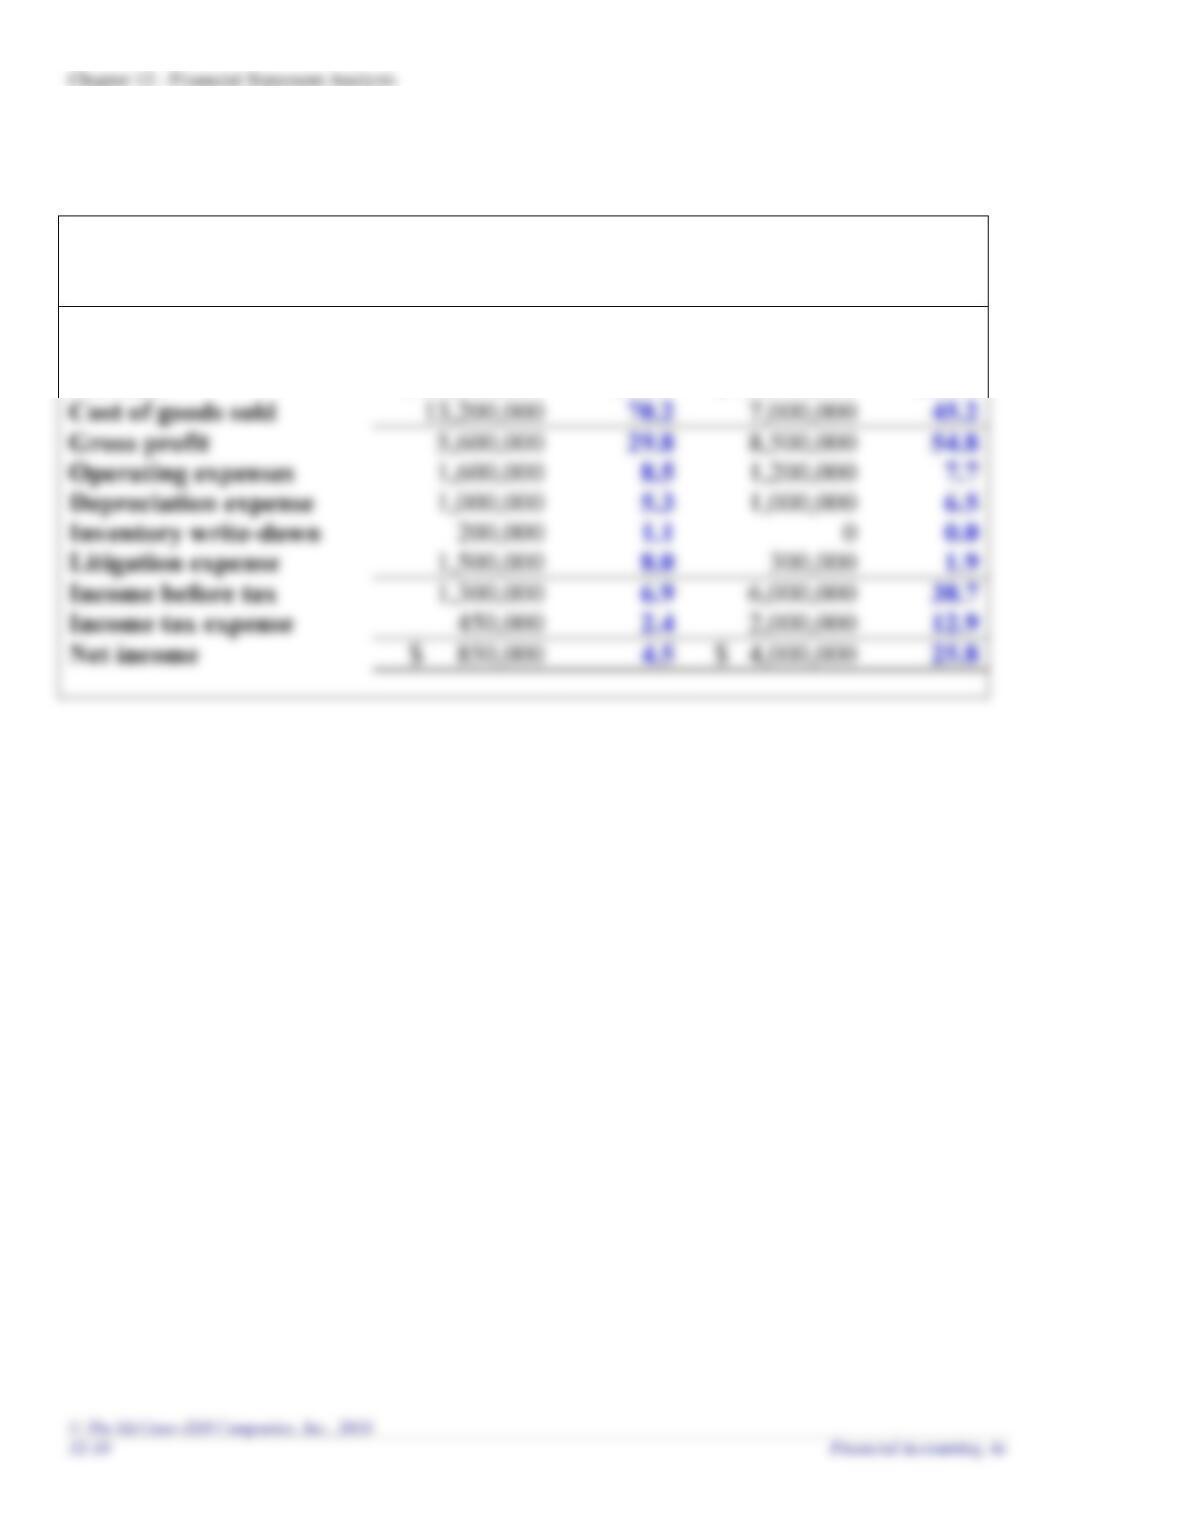
Exercise 12-2 (LO12.1)
Federer Sports Apparel
Income Statement
For the Years Ended December 31
2019
2018
Amount
%
Amount
%
Net sales
$ 18,800,000
100.0
$ 15,500,000
100.0
Cost of goods sold
Gross profit
Depreciation expense
Inventory write-down
Litigation expense
Income before tax
Income tax expense
Net income
$ 4,000,000
Chapter 12 – Financial Statement Analysis
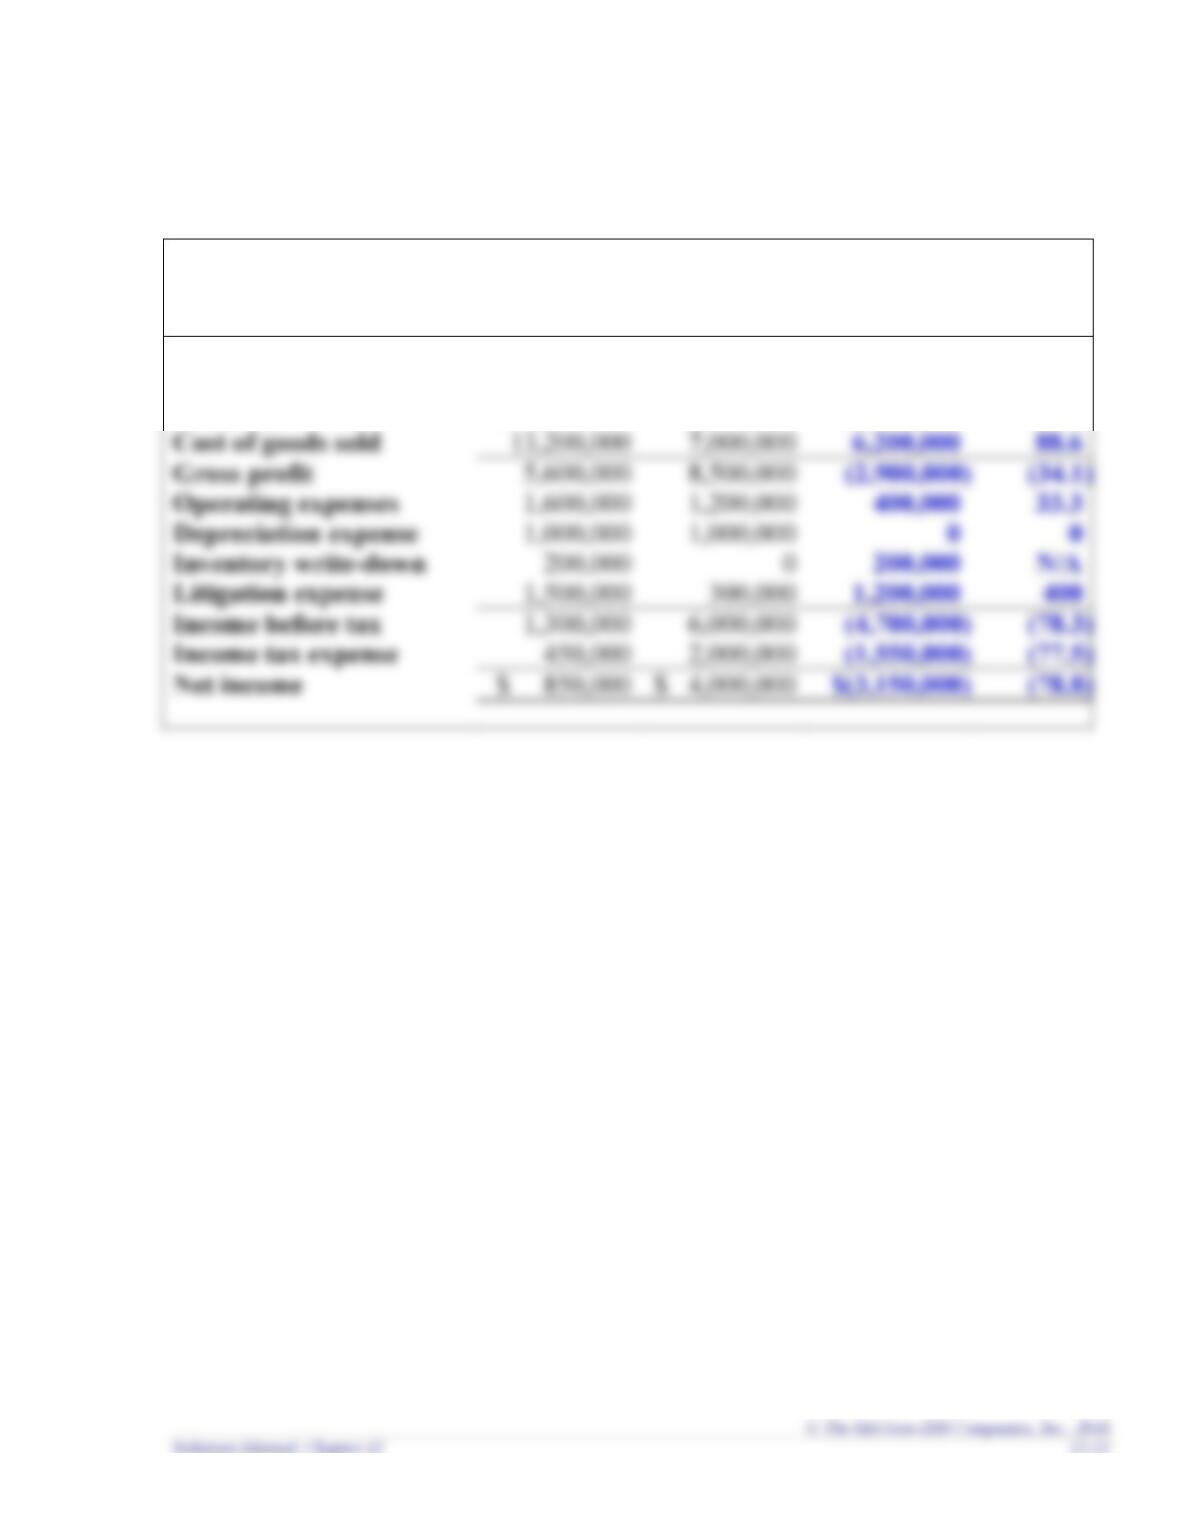
Exercise 12-3 (LO12.2)
Federer Sports Apparel
Income Statement
For the Years Ended December 31
Year
Increase (Decrease)
2019
2018
Amount
%
Revenues
$ 18,800,000
$ 15,500,000
$3,300,000
21.3
Cost of goods sold
88.6
Operating expenses
Depreciation expense
Inventory write-down
N/A
Litigation expense
Income before tax
Income tax expense
Net income
$ 4,000,000
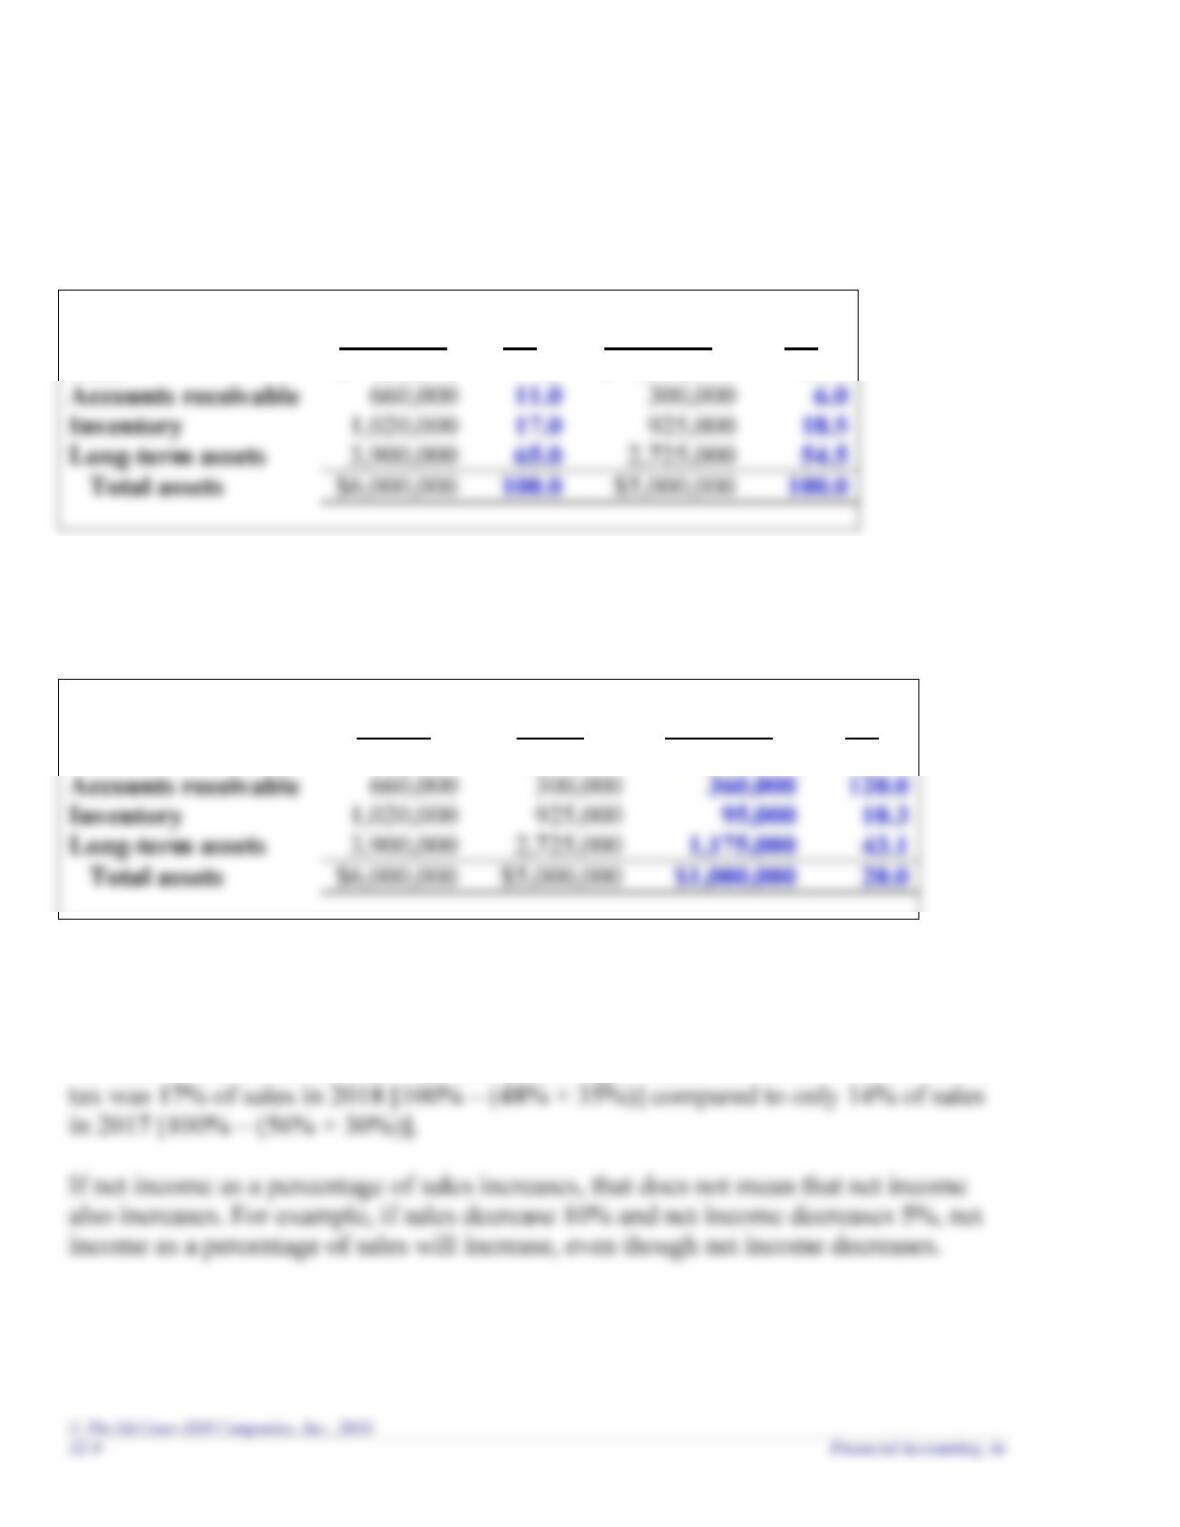
Exercise 12-4 (LO12.1, 12.2)
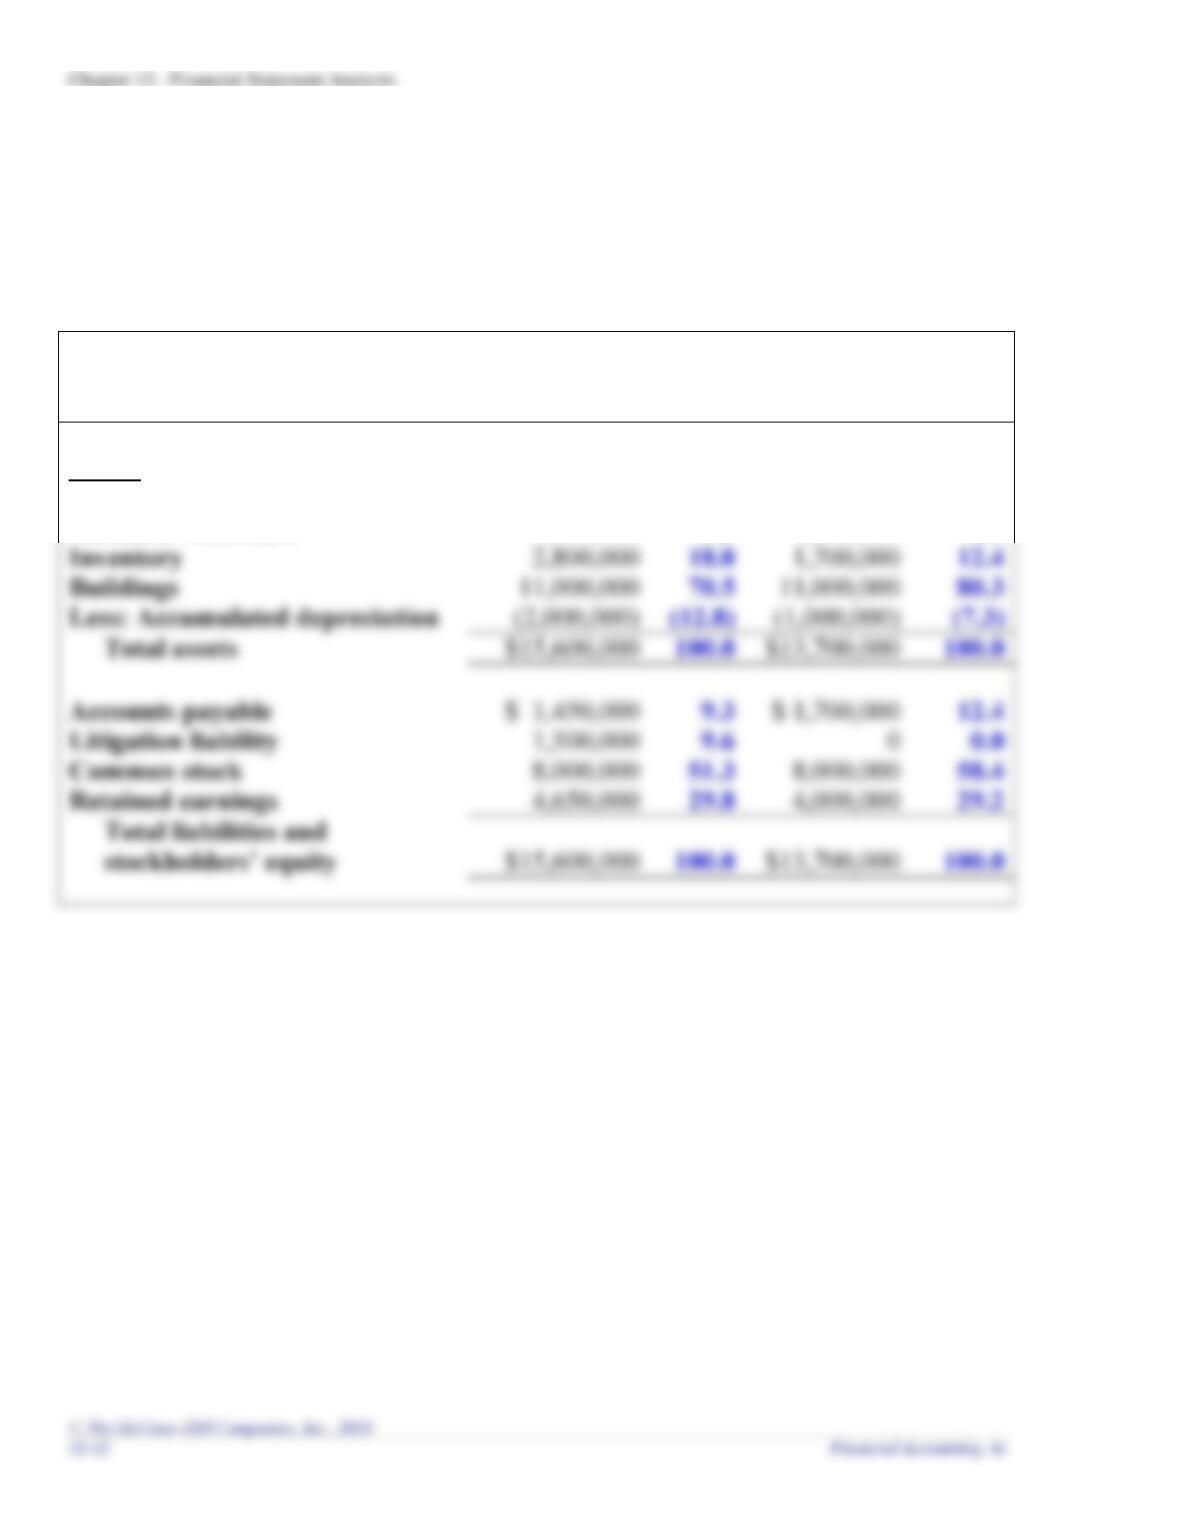
Requirement 1
Federer Sports Apparel
Balance Sheet
December 31
2019
2018
Assets
Amount
%
Amount
%
Cash
$ 2,300,000
14.7
$ 800,000
5.8
Accounts receivable
1,500,000
9.6
1,200,000
8.8
Inventory
2,800,000
18.0
1,700,000
Buildings
70.5
Less: Accumulated depreciation
Accounts payable
9.3
Litigation liability
1,500,000
9.6
0.0
Common stock
8,000,000
51.3
8,000,000
Retained earnings
4,650,000
29.8
4,000,000
Chapter 12 – Financial Statement Analysis
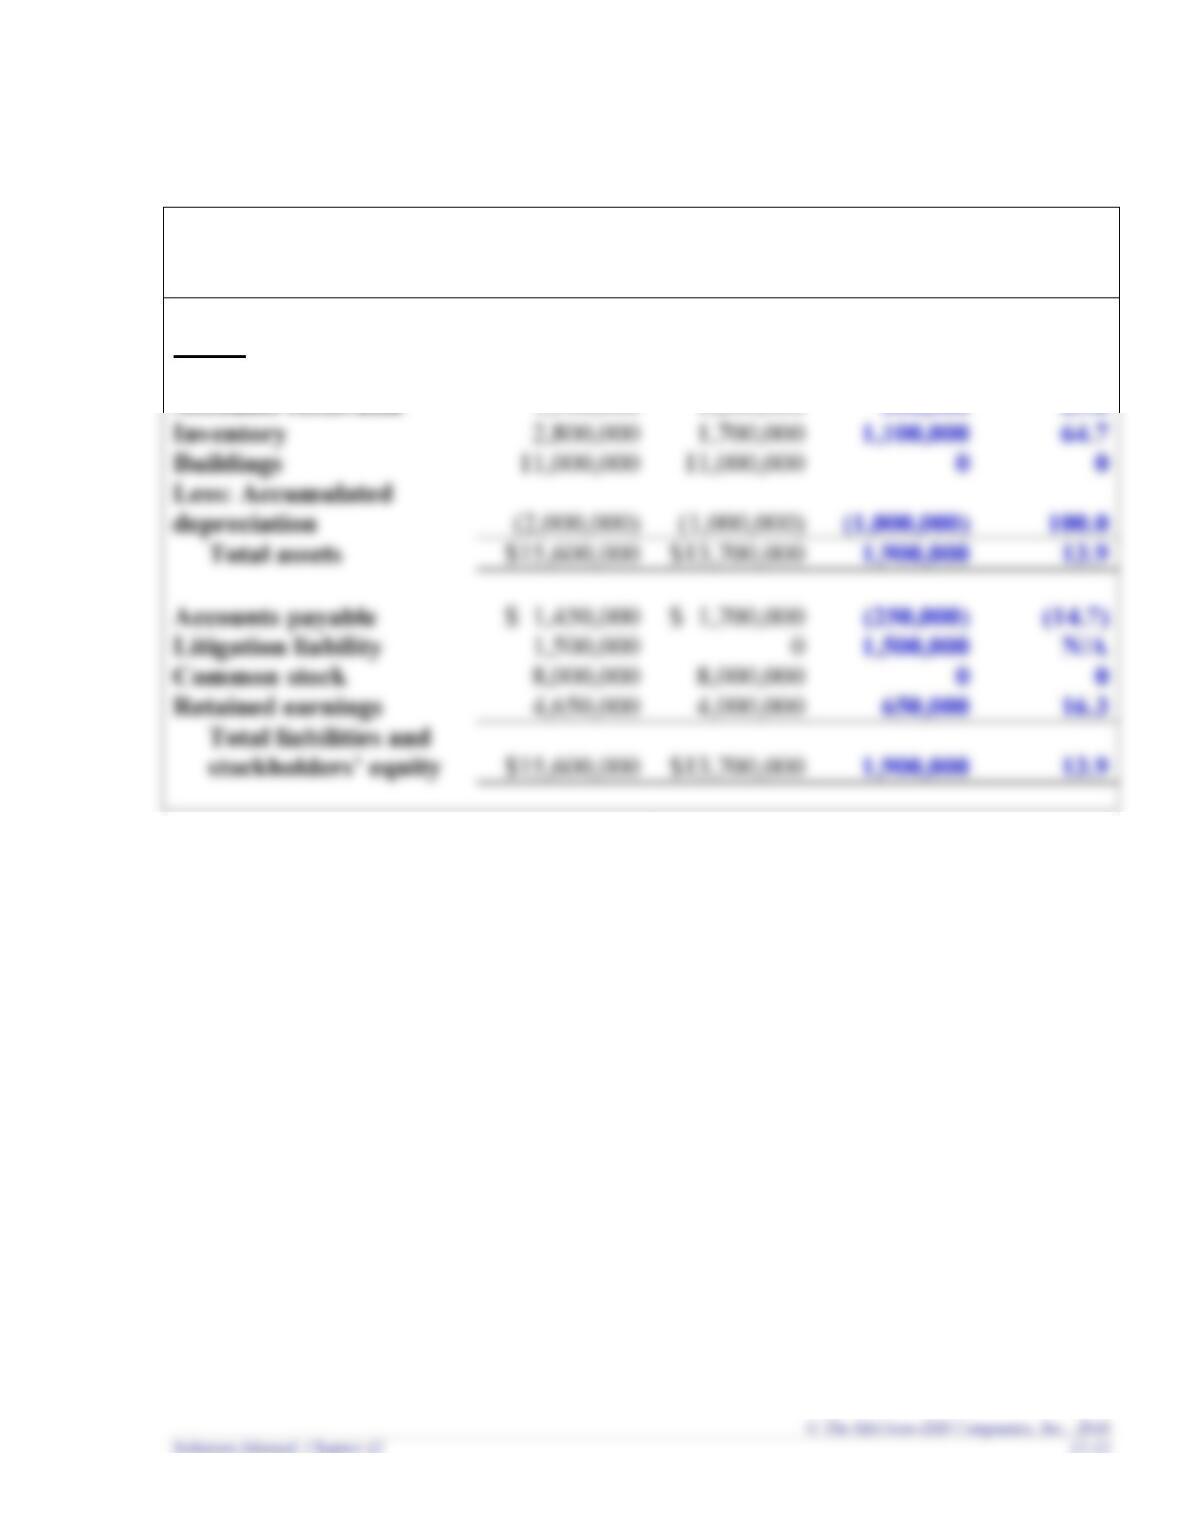
Requirement 2
Federer Sports Apparel
Balance Sheet
December 31
Year
Increase (Decrease)
Assets
2019
2018
Amount
%
Cash
$ 2,300,000
$ 800,000
$1,500,000
187.5
Accounts receivable
Inventory
Buildings
depreciation
100.0
Accounts payable
Litigation liability
Common stock
Retained earnings
650,000
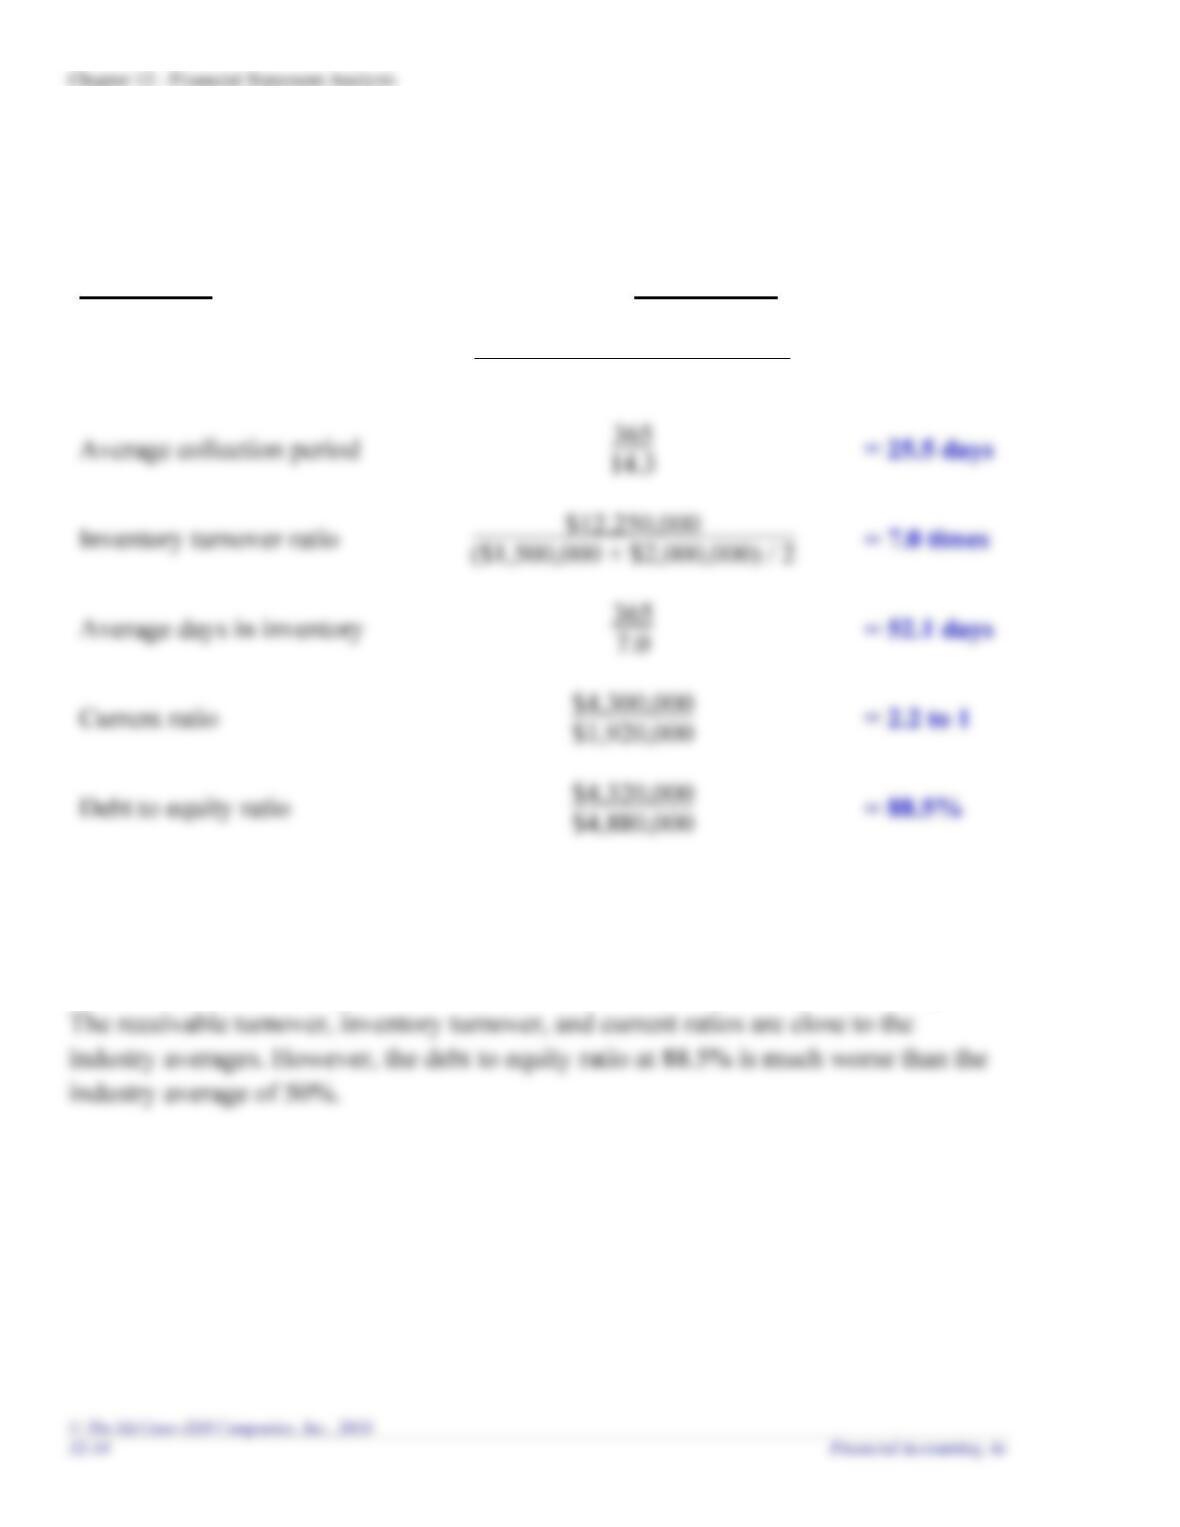
Exercise 12-5 (LO12.3)
Requirement 1
Risk Ratios
Calculations
Receivables turnover ratio
$19,310,000
($1,100,000 + $1,600,000) / 2
= 14.3 times
Average collection period
= 25.5 days
Inventory turnover ratio
($1,500,000 + $2,000,000) / 2
= 7.0 times
Average days in inventory
= 52.1 days
Debt to equity ratio
= 88.5%
Requirement 2
Based on the above ratios, Adrian Express is more risky than the industry average.
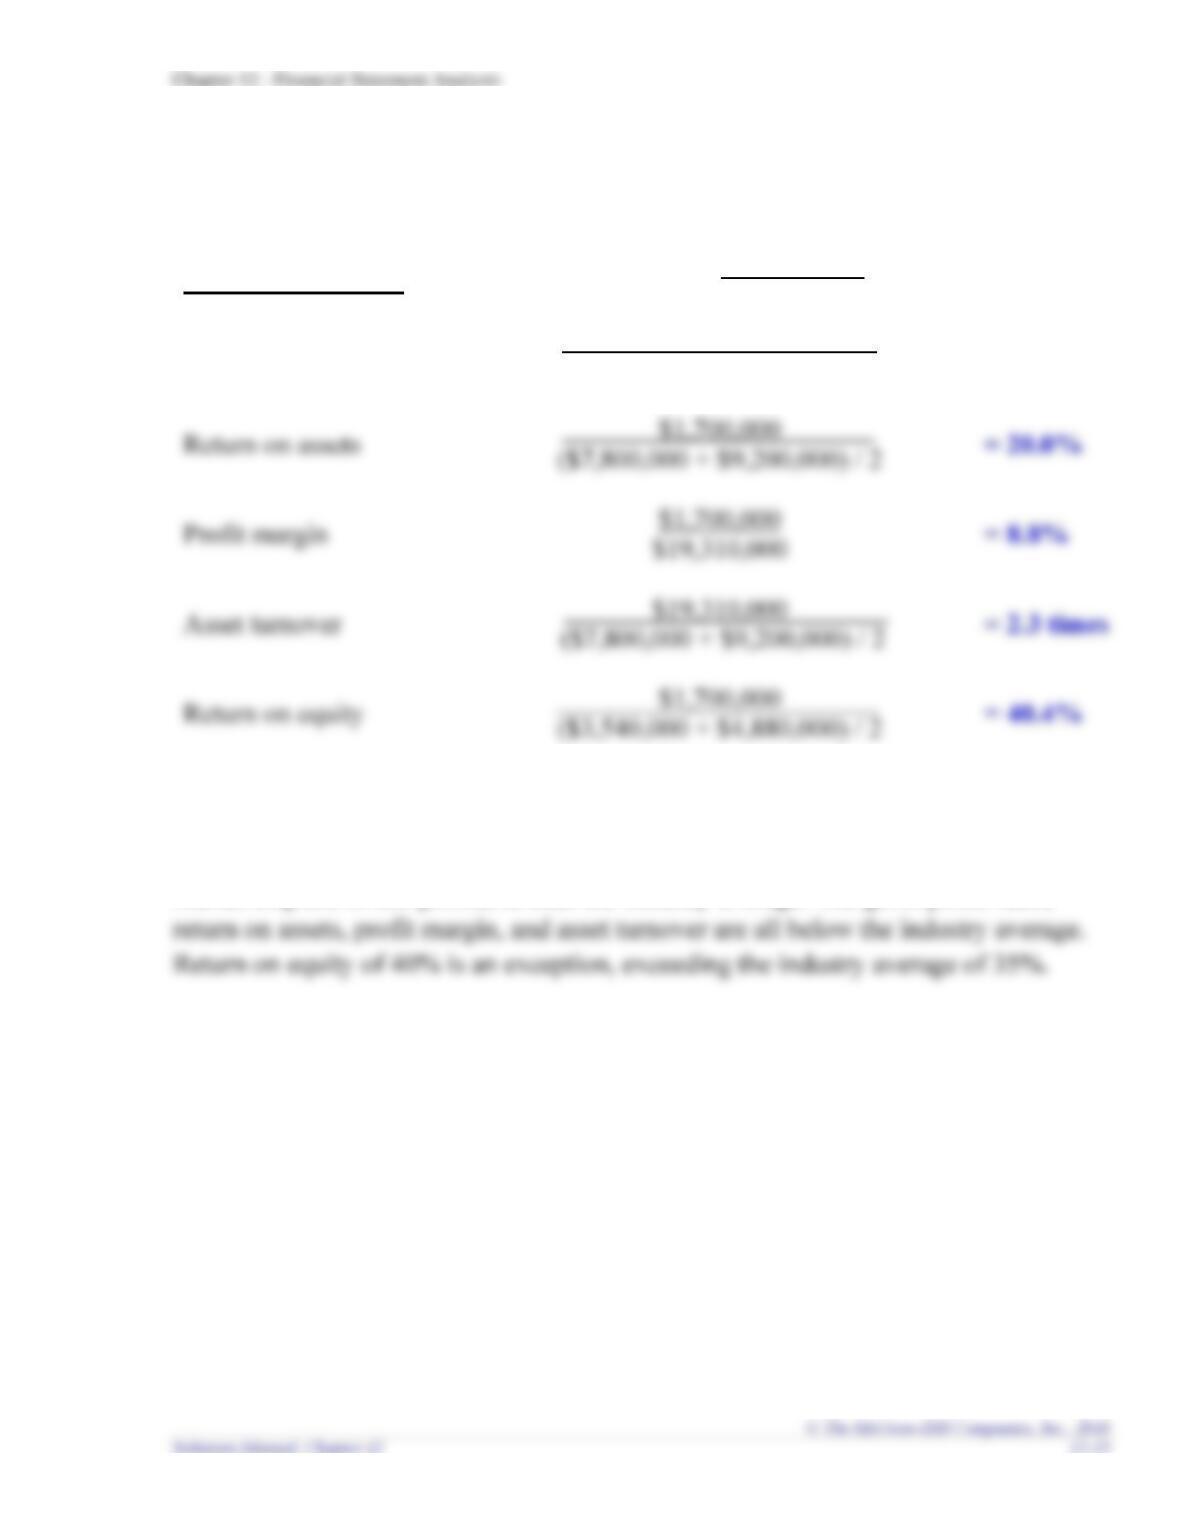
Exercise 12-6 (LO12.4)
Requirement 1
Profitability Ratios
Calculations
Gross profit ratio
($19,310,000 – $12,250,000)
$19,310,000
= 36.6%
Return on assets
= 20.0%
$19,310,000
Asset turnover
= 2.3 times
Return on equity
= 40.4%
Requirement 2
Adrian Express is less profitable than the industry average. The gross profit ratio,
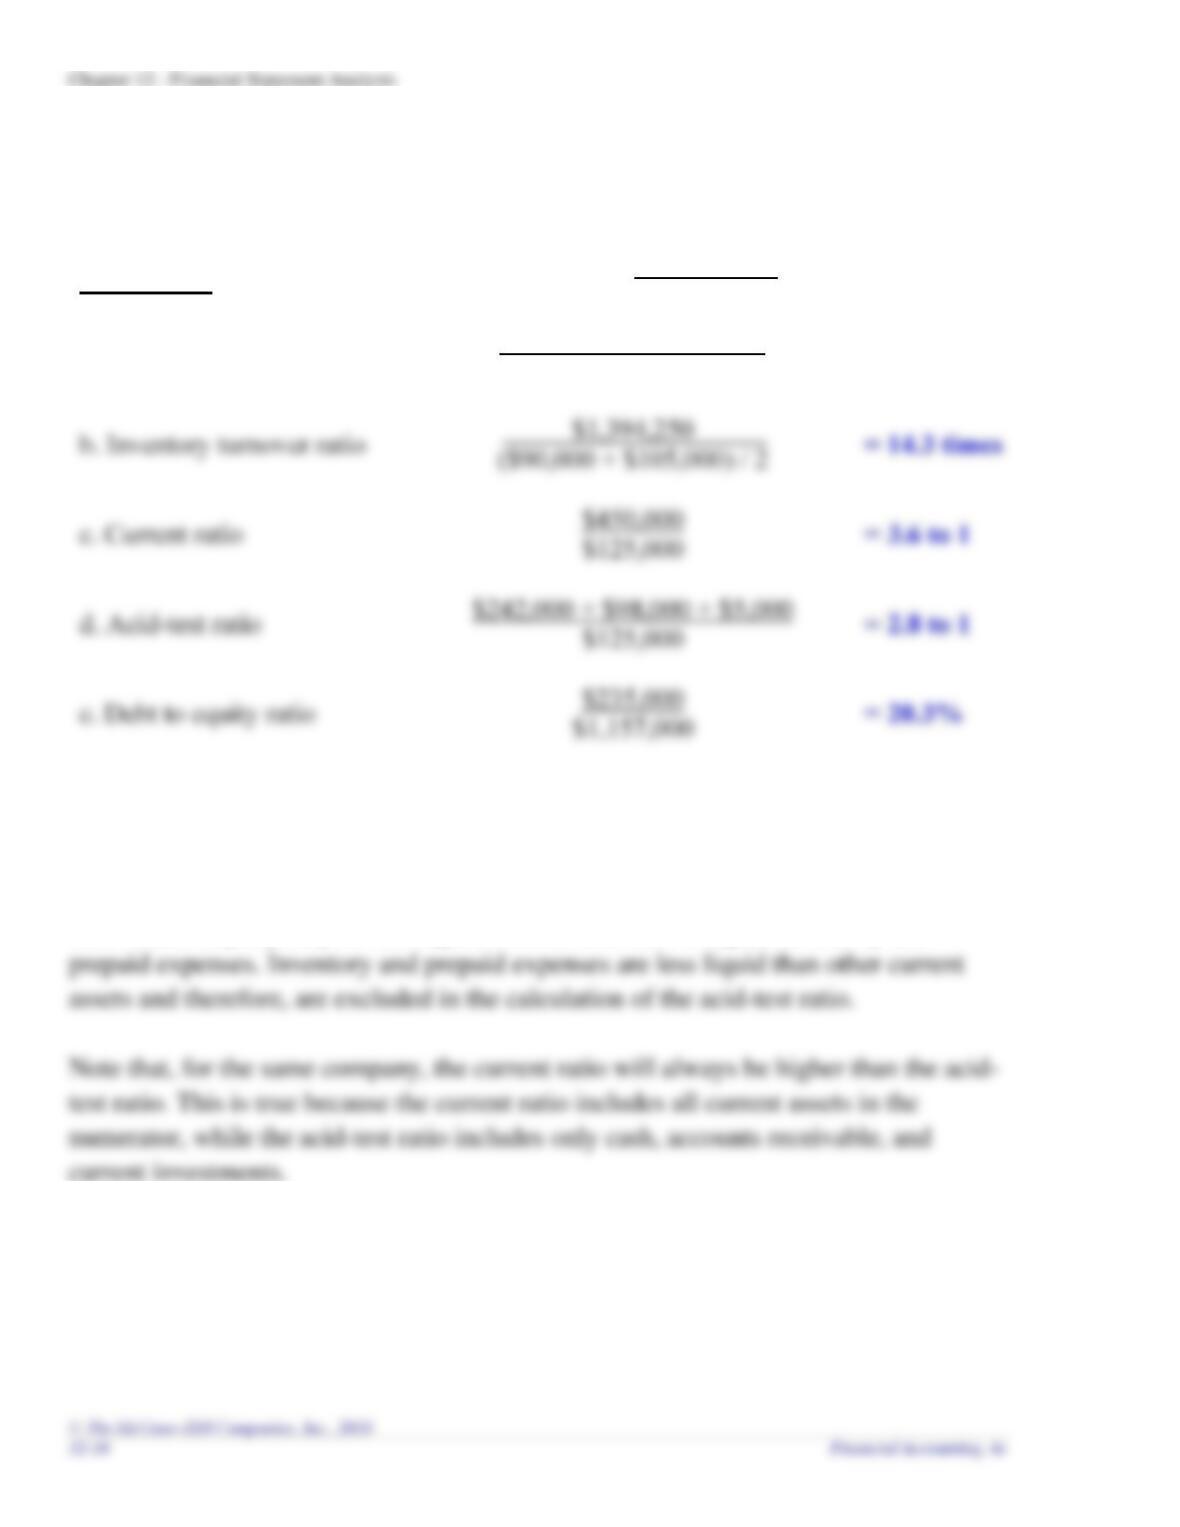
Exercise 12-7 (LO12.3)
Requirement 1
Risk Ratios
Calculations
a. Receivables turnover ratio
$1,890,000
($102,000 + $98,000) / 2
= 18.9 times
b. Inventory turnover ratio
= 14.3 times
d. Acid-test ratio
= 2.8 to 1
e. Debt to equity ratio
= 20.3%
Requirement 2
One company can have a higher current ratio while the other has a higher acid-test
ratio. The company may have a higher current ratio due to higher inventory and
Chapter 12 – Financial Statement Analysis
Exercise 12-8 (LO12.4)
Requirement 1
<
Profitability Ratios
Calculations
a. Gross profit ratio
$495,750
$1,890,000
= 26.2%
c. Profit margin
= 9.7%
d. Asset turnover
= 1.4 times
e. Return on equity
= 17.3%
Requirement 2
One company can have a higher return on assets while the other company has a higher
Exercise 12-9 (LO12.4)
Requirement 1
Profitability Ratios
Calculations
a. Gross profit ratio
$14,820,000 – $9,544,080
$14,820,000
= 35.6%
b. Return on assets
= 11.0%
d. Asset turnover
= 3.9 times
e. Return on equity
= 33.4%
Requirement 2
Dividends paid to shareholders in 2018 were $318,000. This amount can be
determined by analyzing the changes to retained earnings as follows:
Retained earnings, 2017
$300,000
$400,000
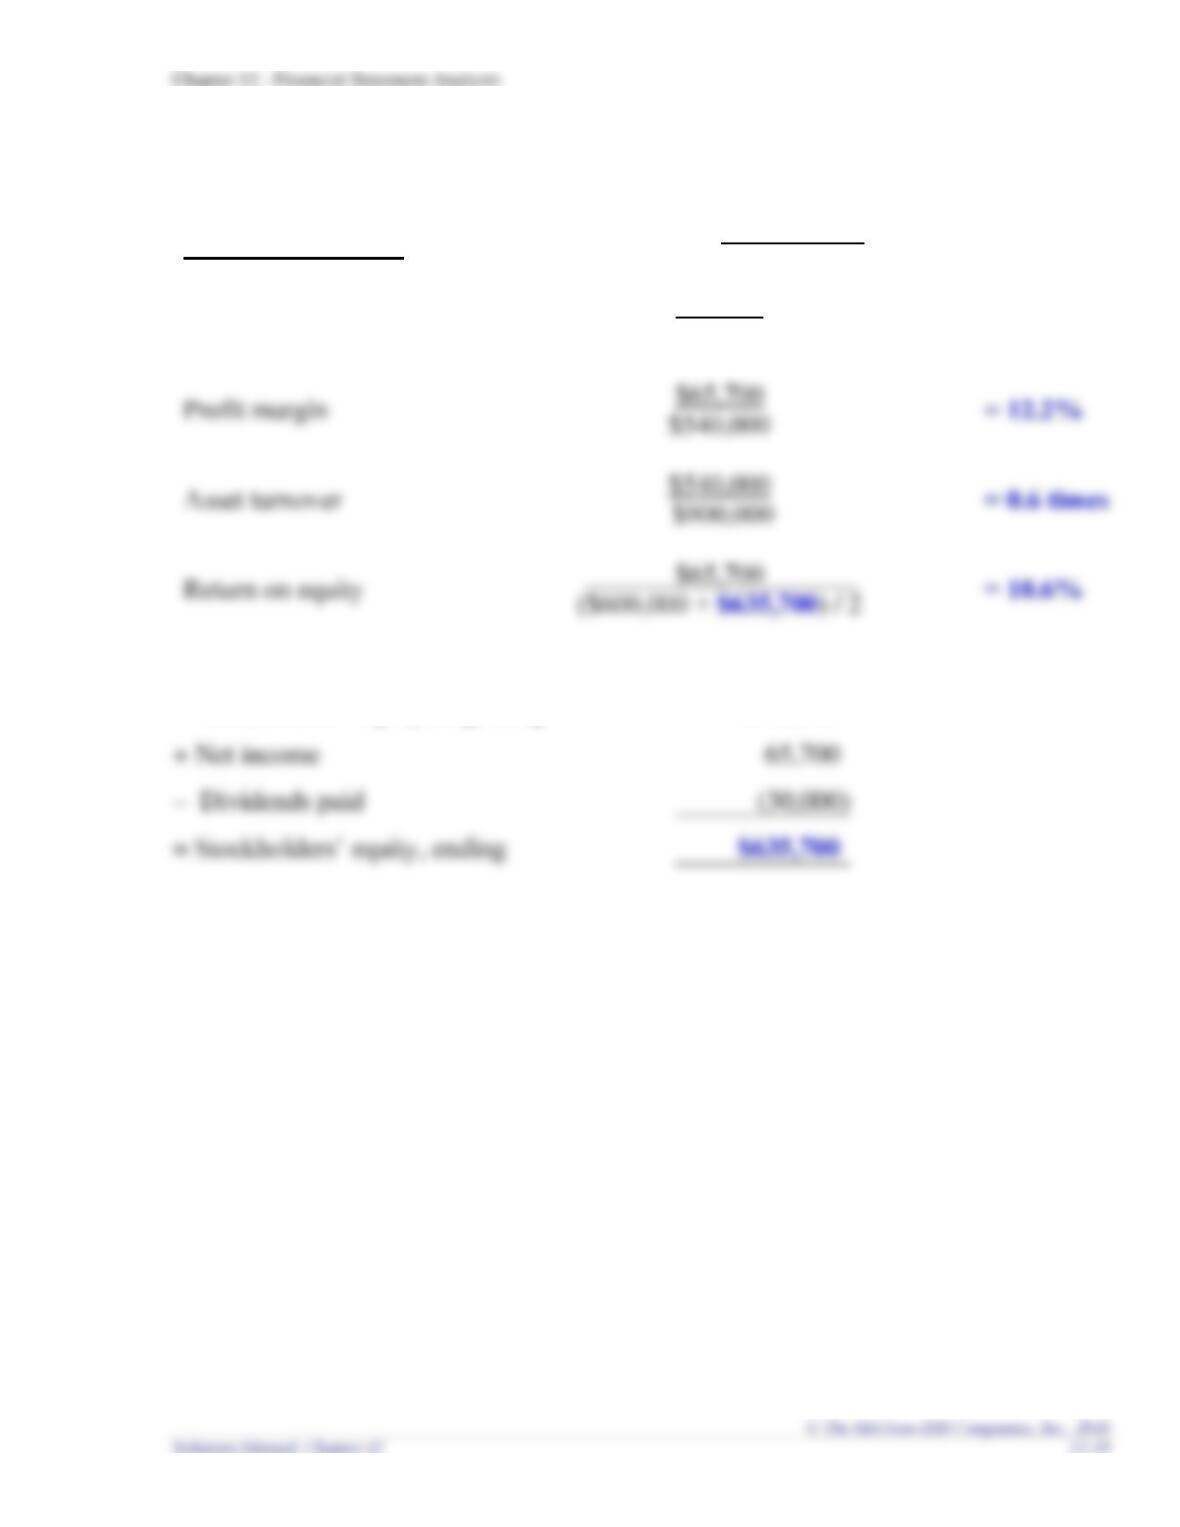
Exercise 12-10 (LO12.4)
Profitability Ratios
Calculations
Return on assets
$65,700
$900,000
= 7.3%
Profit margin
= 12.2%
Return on equity
$65,700
= 10.6%
Stockholders’ equity, beginning
$600,000
Exercise 12-11 (LO12.5)
a. Other expenses
b. Discontinued operations
c. Other expenses
d. Other expenses
e. Other revenues