Chapter 12
Strategic Performance Measurement
Solutions to Questions
12-1 The four categories are learning and
growth, internal business process, customer, and
financial.
12-2 The four types of quality costs are
prevention costs, appraisal costs, internal failure
costs, and external failure costs. The best way
to lower cost of quality is to make additional
investments in prevention and appraisal that are
more than offset by reductions in internal and
external failure costs. Ultimately, the best
approach for reducing the cost of quality is to
prevent defects from occurring rather than
detecting them after they have occurred.
12-3 The difference between delivery cycle
time and throughput time is the waiting period
between when an order is received and when
production on the order is started. Throughput
time is made up of process time, inspection
time, move time, and queue time. Process time
is value-added time and inspection time, move
time, and queue time are non-value-added time.
income) don’t occur. Without this feedback, an
organization may drift on indefinitely with an
ineffective strategy based on faulty
assumptions.
12-7 The balanced scorecard is constructed
to support the company’s strategy, which is a
theory about what actions will further the
company’s goals. Assuming that the company
has financial goals, measures of financial
performance must be included in the balanced
scorecard as a check on the reality of the theory.
If the internal business processes improve, but
the financial outcomes do not improve, the
theory may be flawed and the strategy should
be changed.
12-8 A balanced scorecard defines the
measures that a company must improve to
achieve its strategic goals. However, employees
tend to focus on improving the measures that
increase their rewards. To align employee
efforts with strategic goals, a company should
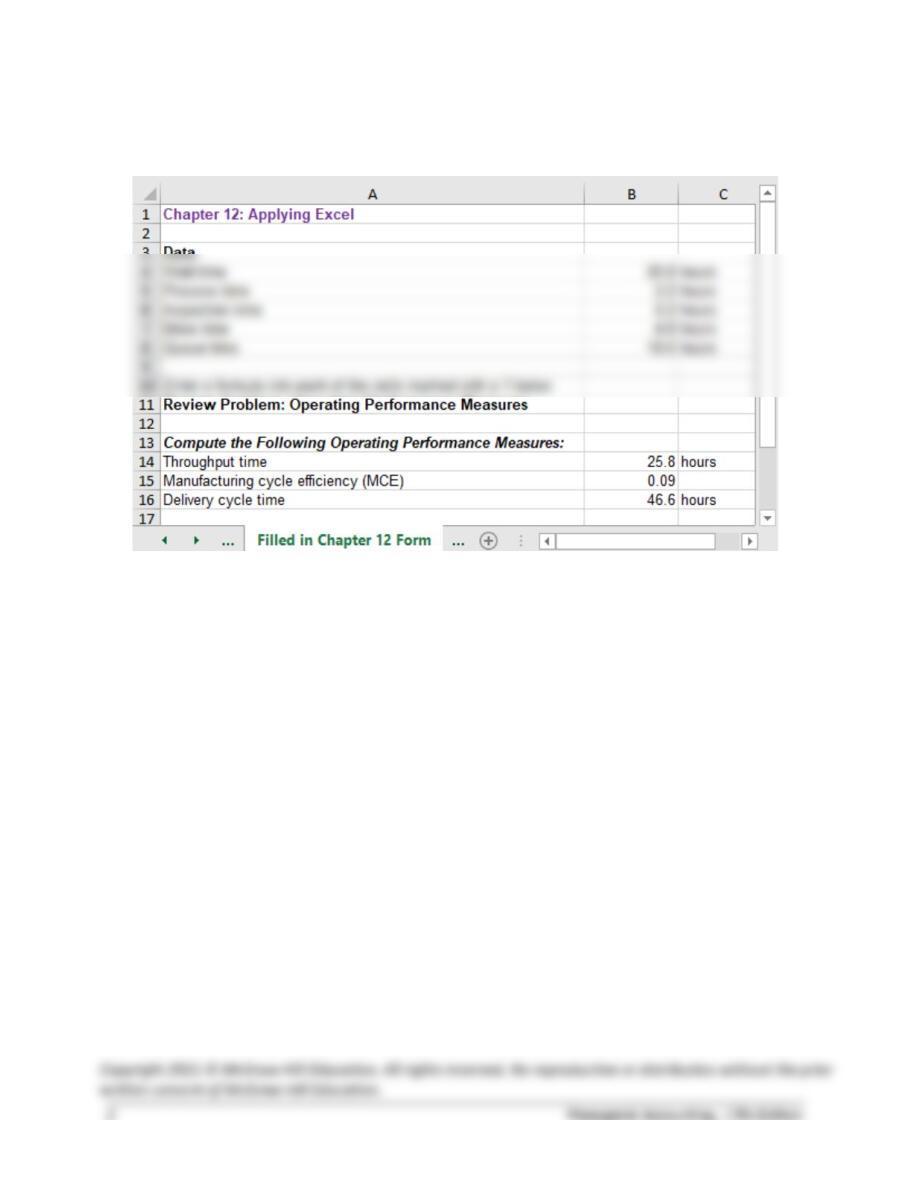
Chapter 12: Applying Excel
The completed worksheet is shown below.
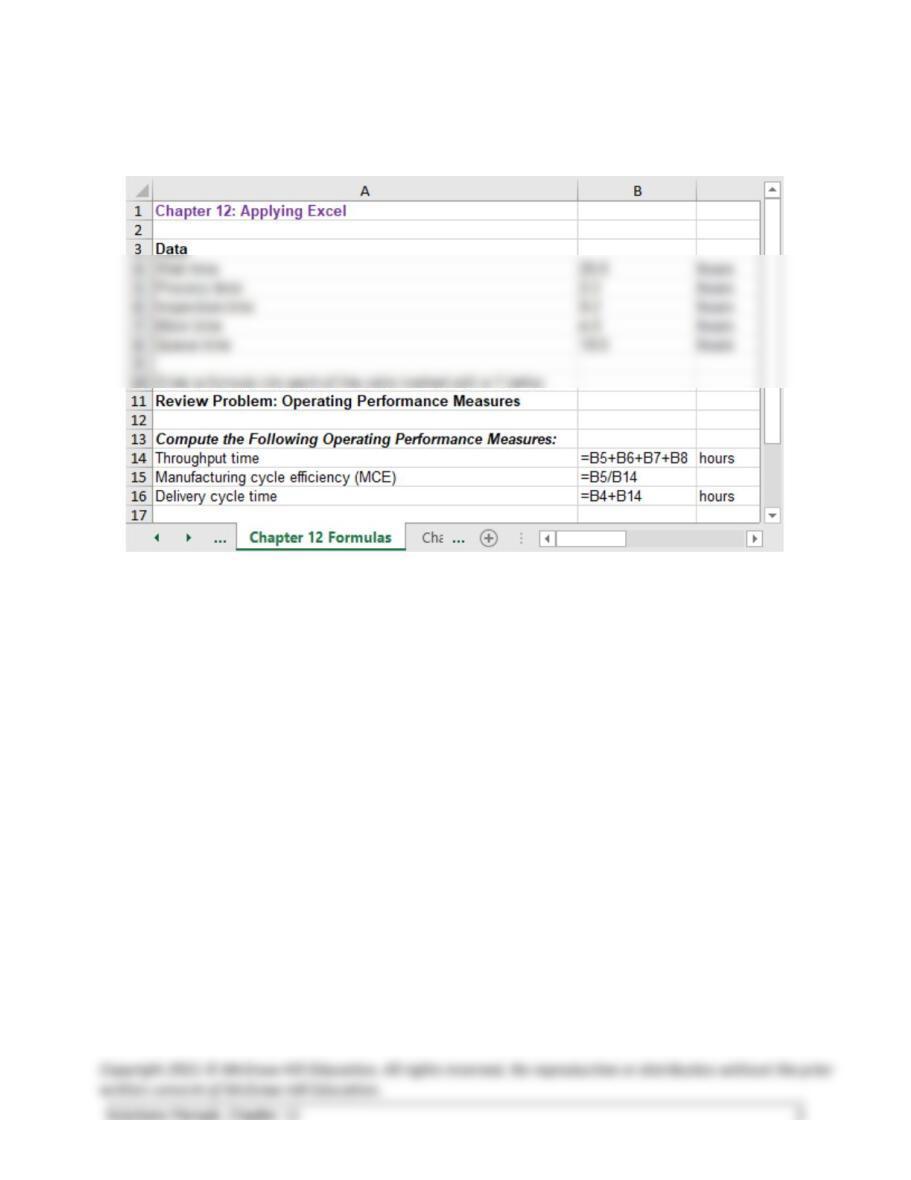
Chapter 12: Applying Excel (continued)
The completed worksheet, with formulas displayed, is shown below.
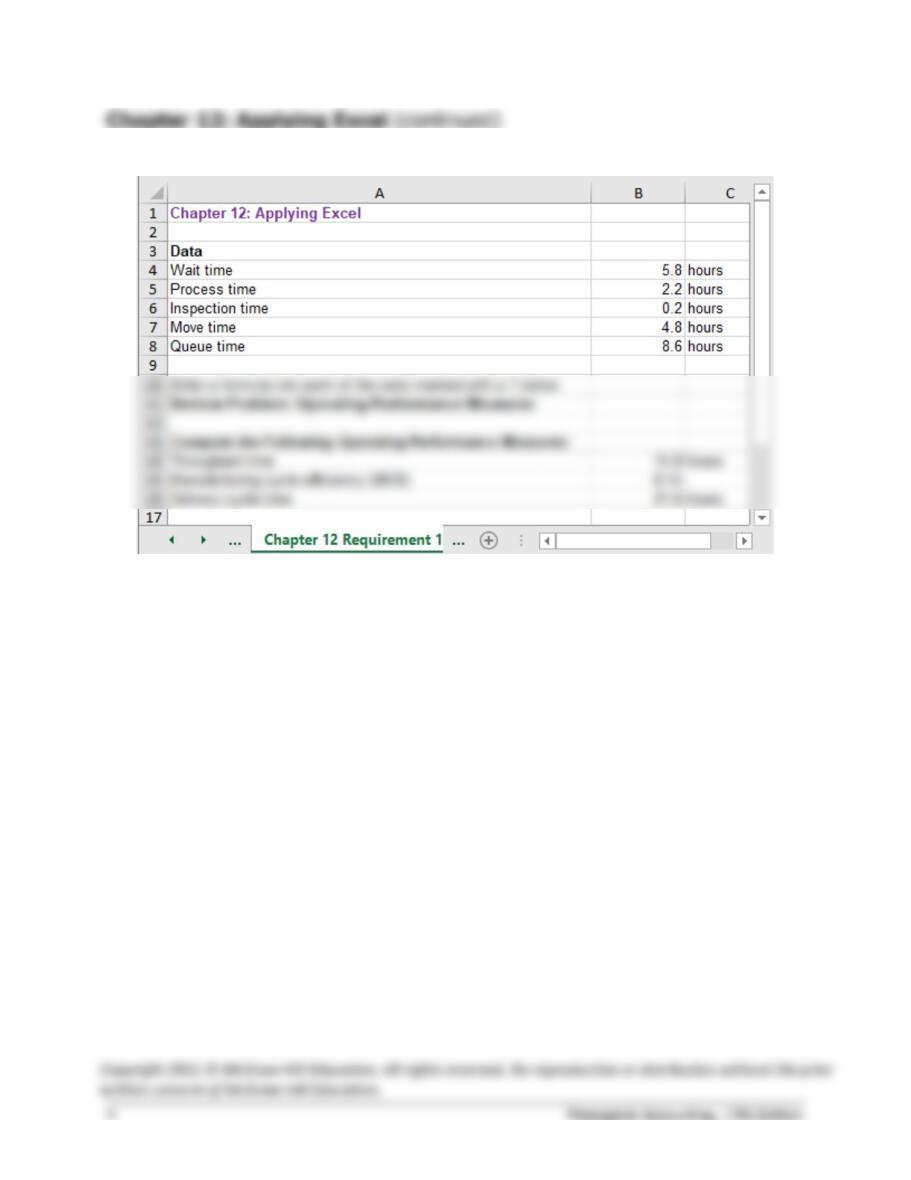
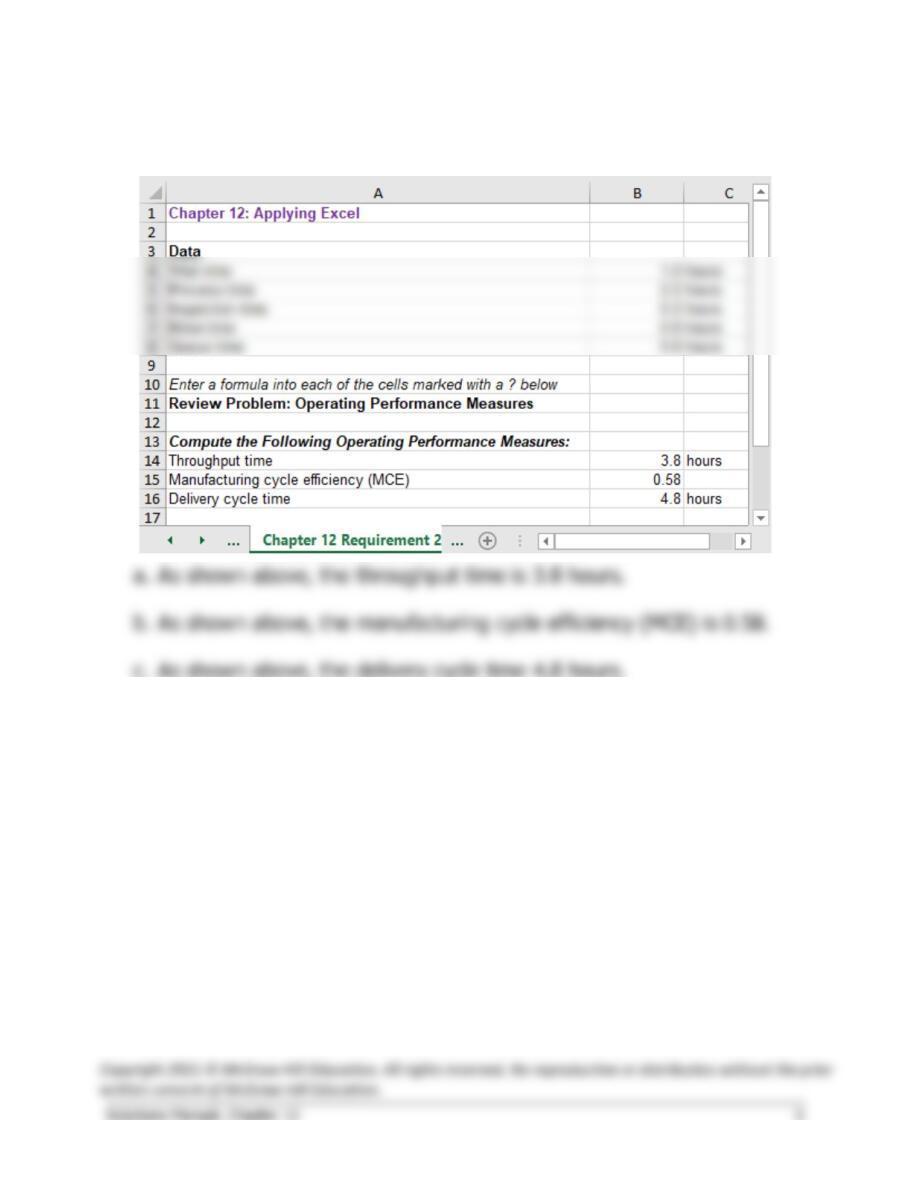
1. After making the changes, the result is:
The throughput time and delivery cycle time both decreased because
the wait time and queue time both decreased.
The manufacturing cycle efficiency (MCE) increased because wait time
and queue time are both non-value-added activities. When a company
decreases the time consumed in non-value-added activities, it will
increase the (MCE).
Chapter 12: Applying Excel (continued)
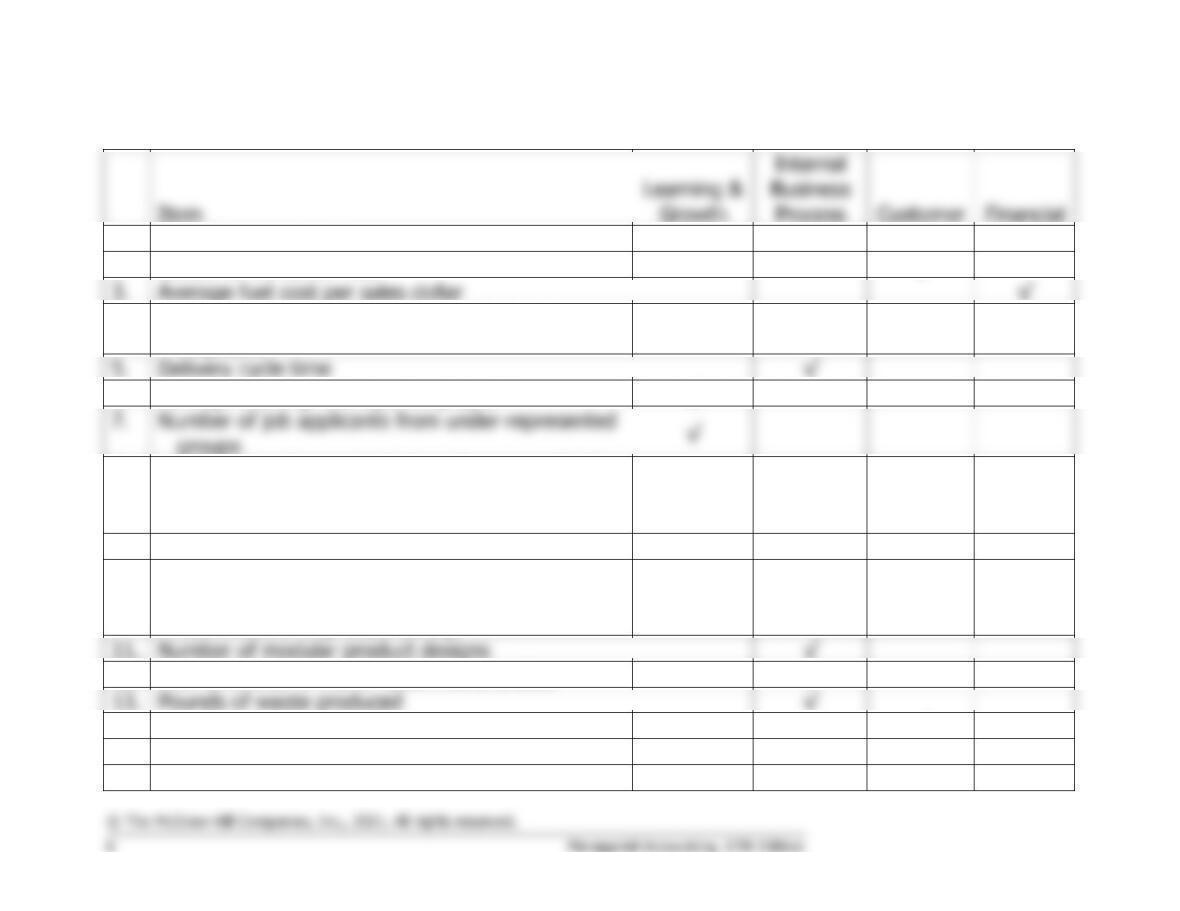
2. With the revised data, the worksheet should look like this:
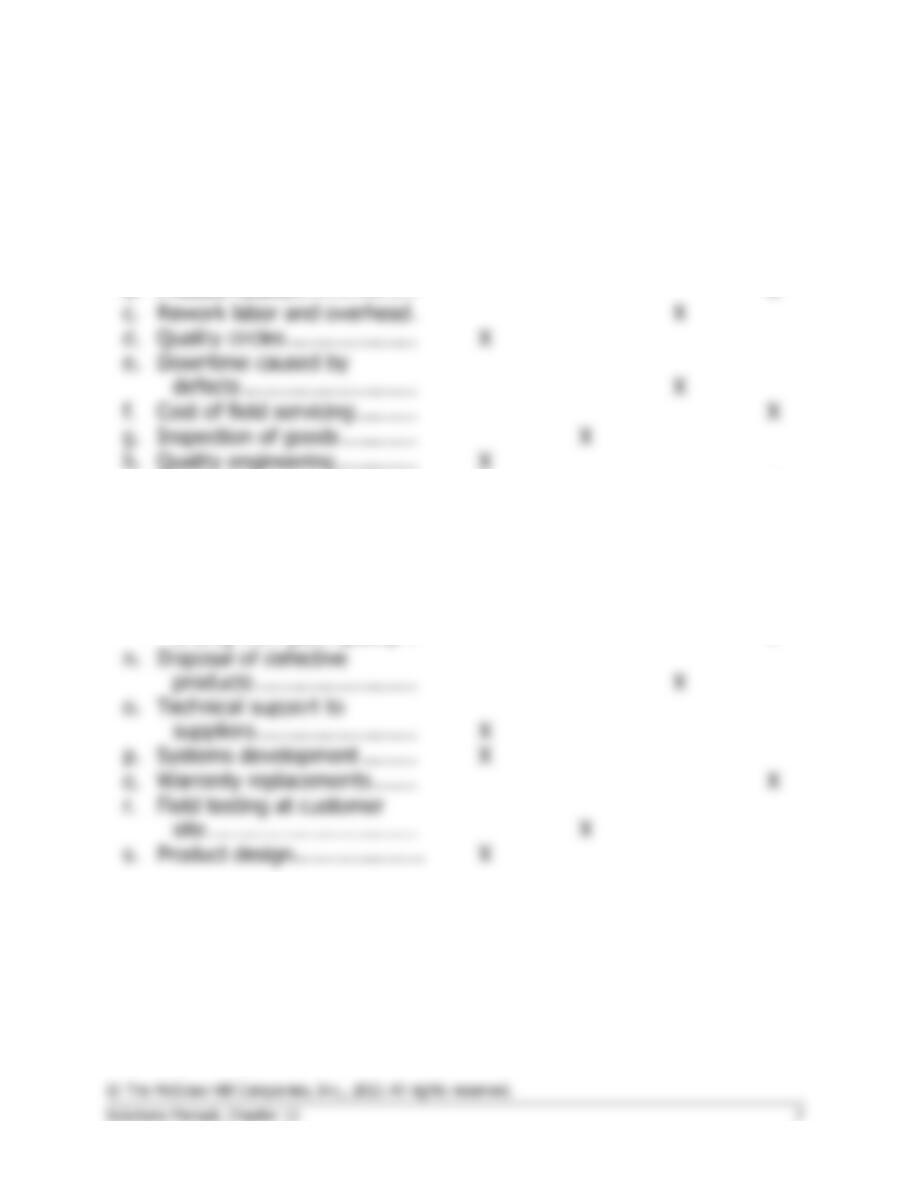
Exercise 12-1 (10 minutes)
Growth
1.
Sales from new customers
√
2.
Customer defection rate
√
3.
Average fuel cost per sales dollar
√
4.
Average number of workplace accidents per
employee
√
5.
Delivery cycle time
√
6.
Average training hours per employee
√
7.
groups
√
8.
Percent of customers that strongly agree with the
statement “Your employees treated me
courteously.”
√
9.
Return on assets
√
10.
Percent of customers that strongly agree with the
statement “Your company has a superior
commitment to product safety.”
√
11.
Number of modular product designs
√
12.
Lost sales due to out-of-stock merchandise
√
13.
Pounds of waste produced
√
14.
Number of customer referrals
√
15.
Residual income
√
16.
Average mentorship hours per employee
√
Exercise 12-2 (15 minutes)
1.
Prevention
Cost
Appraisal
Cost
Internal
Failure
Cost
External
Failure
Cost
a.
Product testing ……………….
X
Product recalls ………………..
X
Rework labor and overhead .
X
Quality circles …………………
X
X
Cost of field servicing ……….
X
Inspection of goods …………
X
Quality engineering ………….
X
i.
Warranty repairs ……………..
X
j.
Statistical process control ….
X
k.
Net cost of scrap …………….
X
l.
Depreciation of test
equipment …………………..
X
m.
Returns and allowances
X
Disposal of defective
products ……………………..
X
Technical support to
Systems development ………
Warranty replacements …….
X
X
Product design…………………
2. Prevention costs and appraisal costs are incurred in an effort to keep
poor quality of conformance from occurring. Internal and external failure
costs are incurred because poor quality of conformance has occurred.
Exercise 12-3 (20 minutes)
1.
Throughput time =
Process time + Inspection time + Move time +
Queue time
=
2.7 days + 0.3 days + 1.0 days + 5.0 days
=
9.0 days
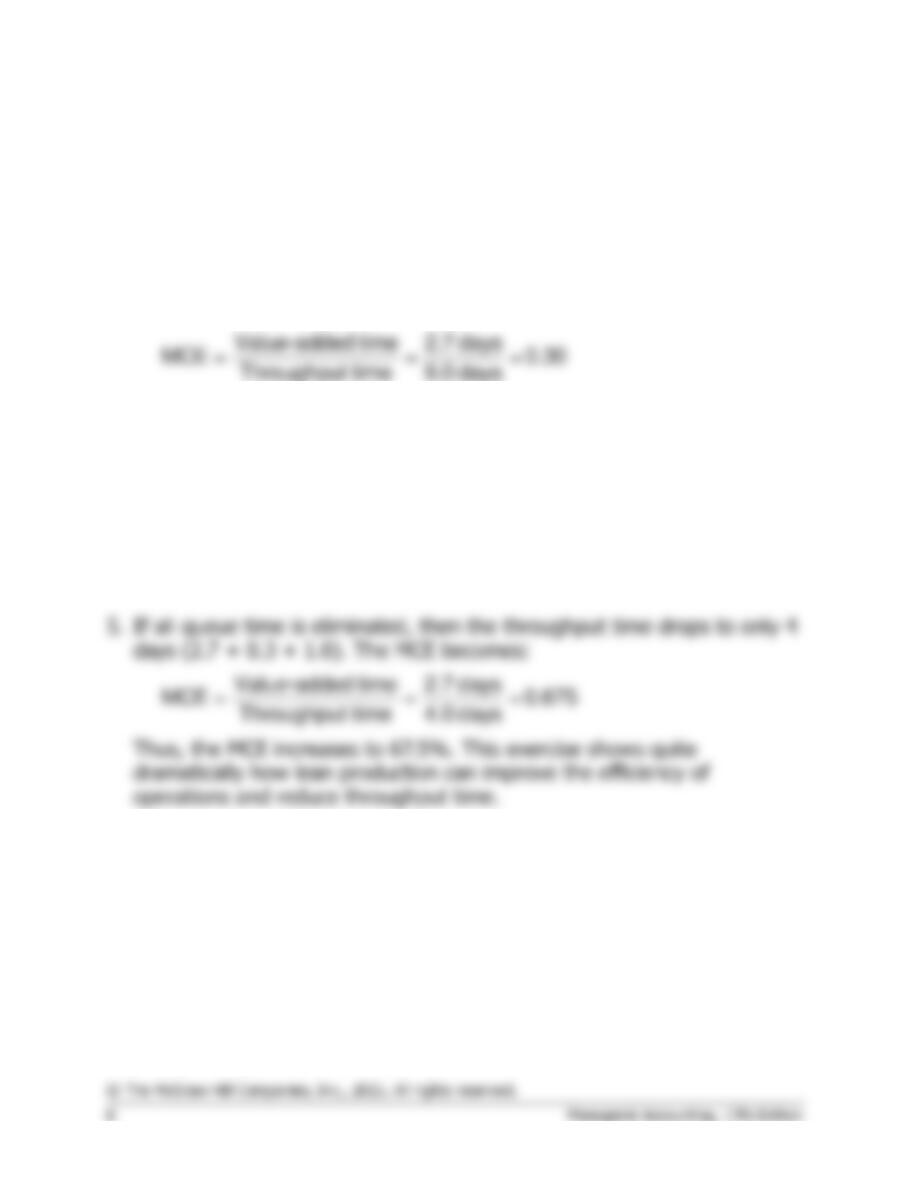
2. Only process time is value-added time; therefore, the manufacturing
cycle efficiency (MCE) is:
3. If the MCE is 30%, then 30% of the throughput time was spent in
value-added activities. Consequently, the other 70% of the throughput
time was spent in non-value-added activities.
4.
Delivery cycle time =
Wait time + Throughput time
=
14.0 days + 9.0 days
=
23.0 days
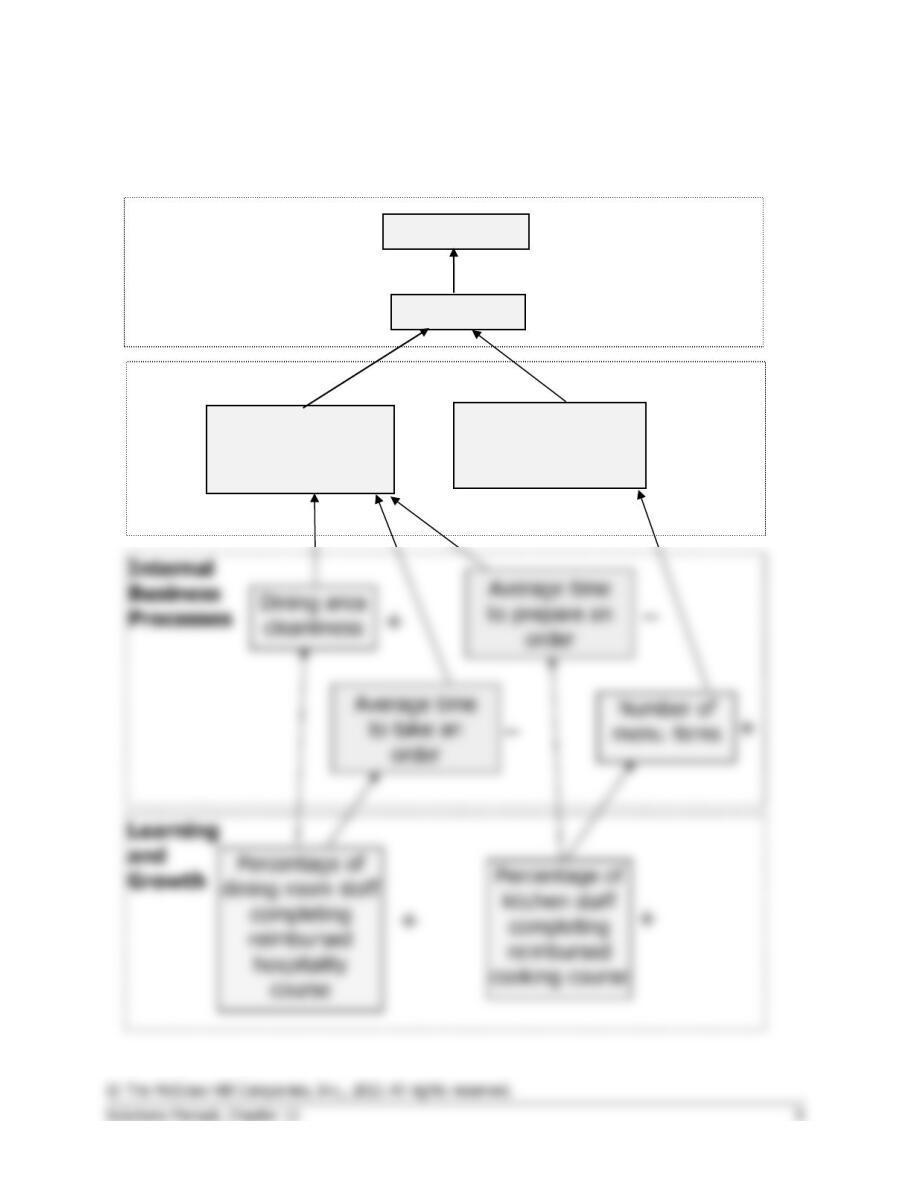
+
+
+
+
Financial
Customer
Exercise 12-4 (45 minutes)
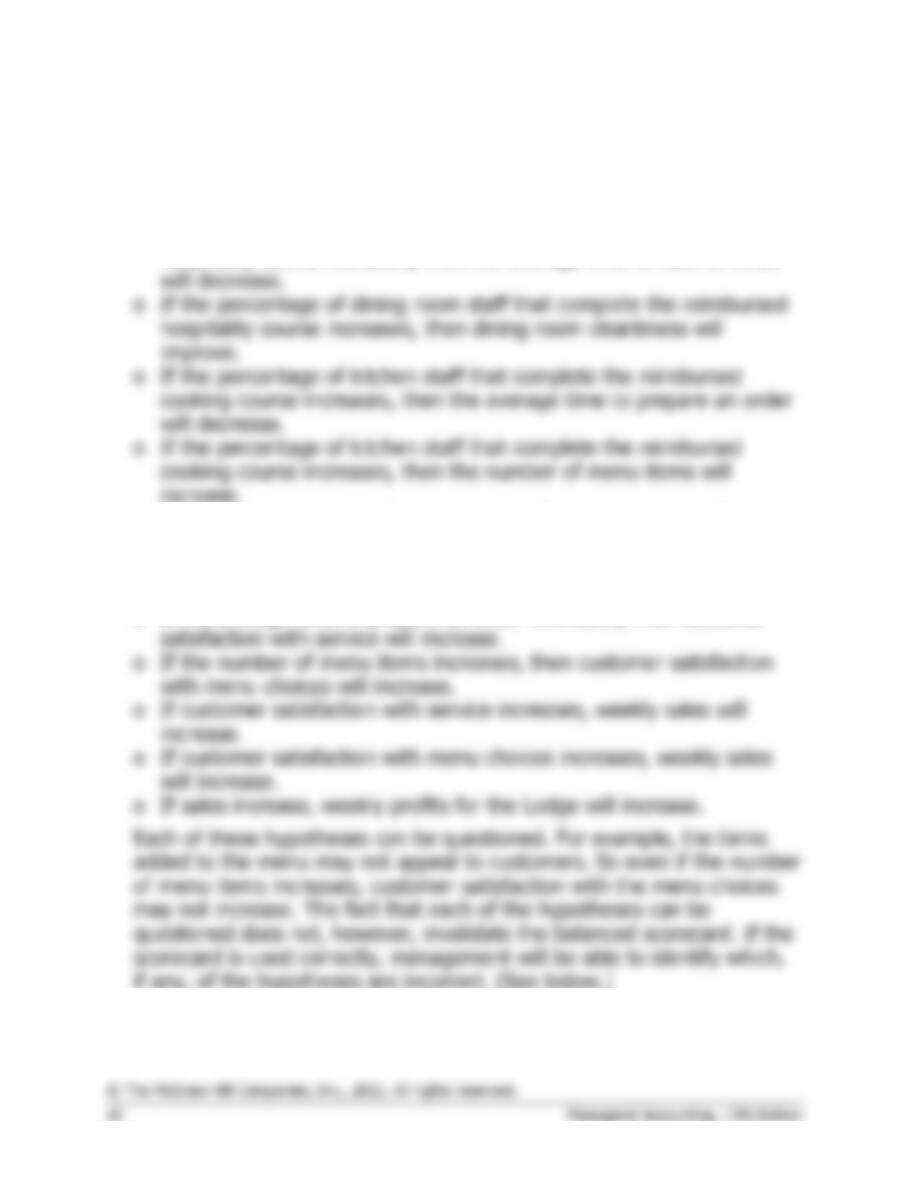
1. Students’ answers may differ in some details from this solution.
Weekly profit
Weekly sales
+
+
Customer
satisfaction with
service
Customer
satisfaction with
menu choices
+
+
Exercise 12-4 (continued)
2. The hypotheses underlying the balanced scorecard are indicated by the
arrows in the diagram. Reading from the bottom of the balanced
scorecard, the hypotheses are:
o If the percentage of dining room staff that complete the reimbursed
o If the dining room cleanliness improves, then customer satisfaction
with service will increase.
o If the average time to take an order decreases, then customer
satisfaction with service will increase.
Exercise 12-4 (continued)
3. Management will be able to tell if a hypothesis is false if an
improvement in a performance measure at the bottom of an arrow does
not, in fact, lead to improvement in the performance measure at the tip
Exercise 12-5 (15 minutes)
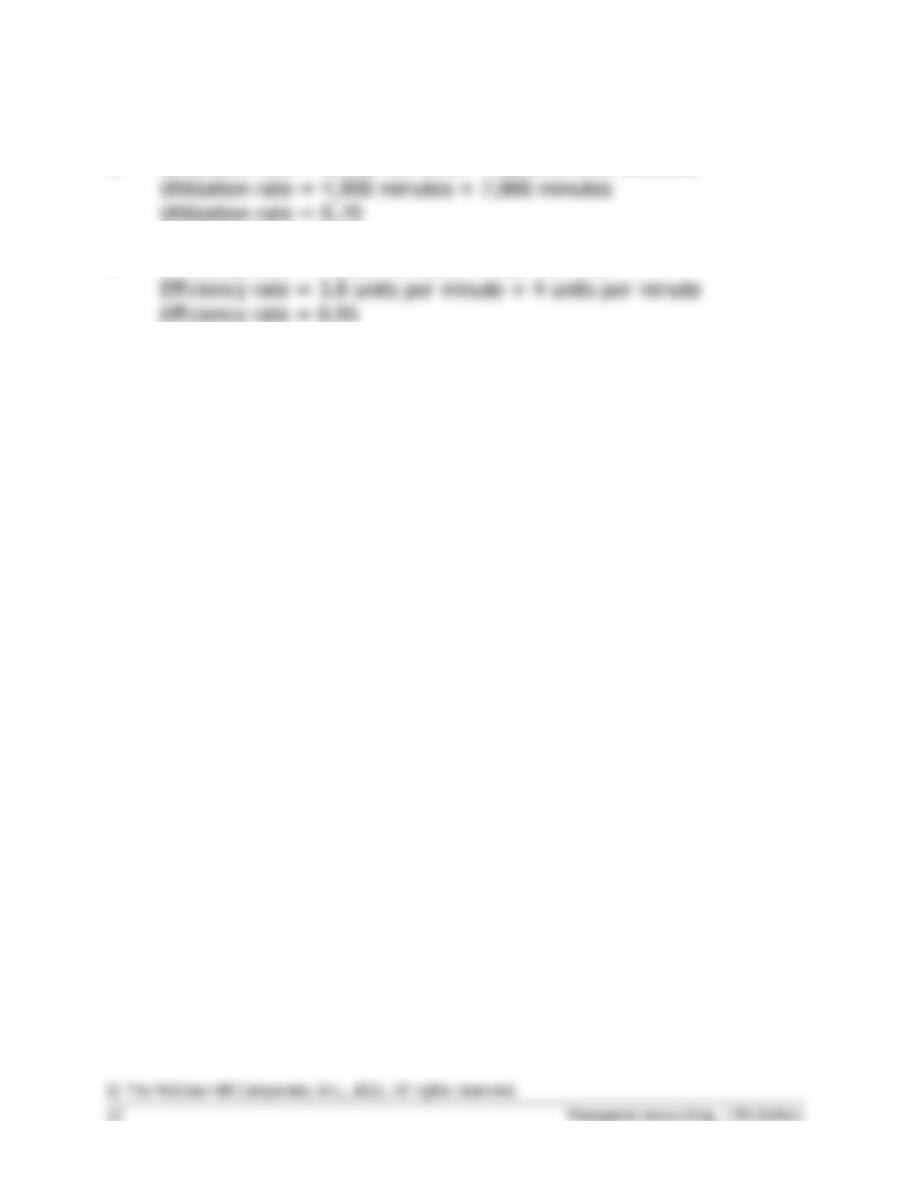
1. Utilization rate = Actual run time ÷ Machine time available
2. Efficiency rate = Actual run rate ÷ Ideal run rate
3. Quality rate = Defect-free output ÷ Total output
Quality rate = 15,827 units ÷ 18,620 units
Quality rate = 0.85
4. OEE = Utilization rate × Efficiency rate × Quality rate
OEE = 0.70 × 0.95 × 0.85
OEE = 0.565 (rounded)
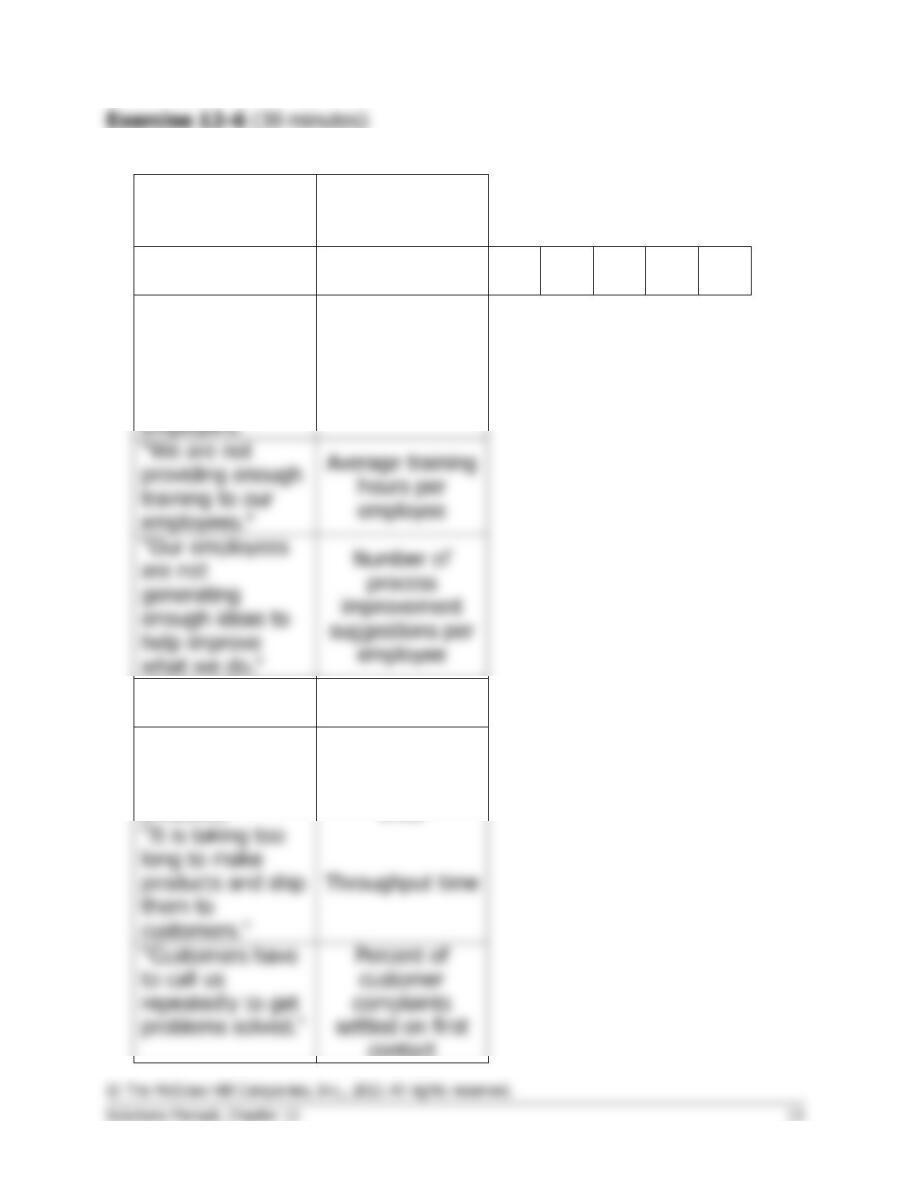
1.
Brainstorming
Comment
Plausible
Performance
Measure
Learning &
Growth
“To many
customer service
employees leave
our company to
work for other
providing enough
Employee
turnover
percentage
Internal Business
Process
“Customers are
returning too
many defective
Defect-free units
as a percentage
of completed
contact
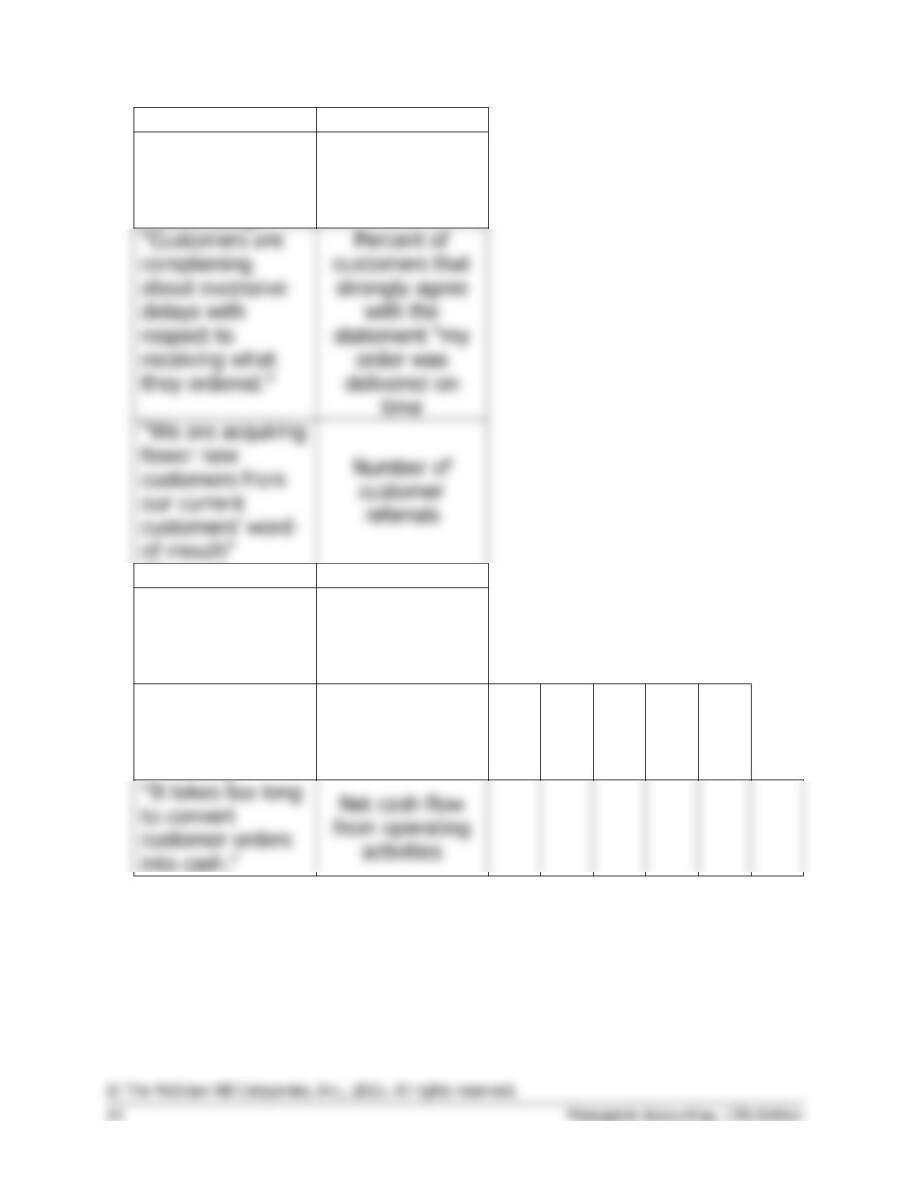
Customer
“The number of
customers we are
serving seems to
be shrinking.”
Customer
defection rate
our current
customers’ word-
Financial
“Wall Street is
becoming very
concerned about
our future.”
Price-earnings
ratio
“Sales are
decreasing
instead of
increasing”
Sales growth
rate
Exercise 12–6 (continued)
2. One approach for defining the company’s strategy is as follows:
The concerns raised during the brainstorming session seem to share a
common theme—the company’s operational performance is faltering. It is
having problems providing customers with defect-free products. It is unable
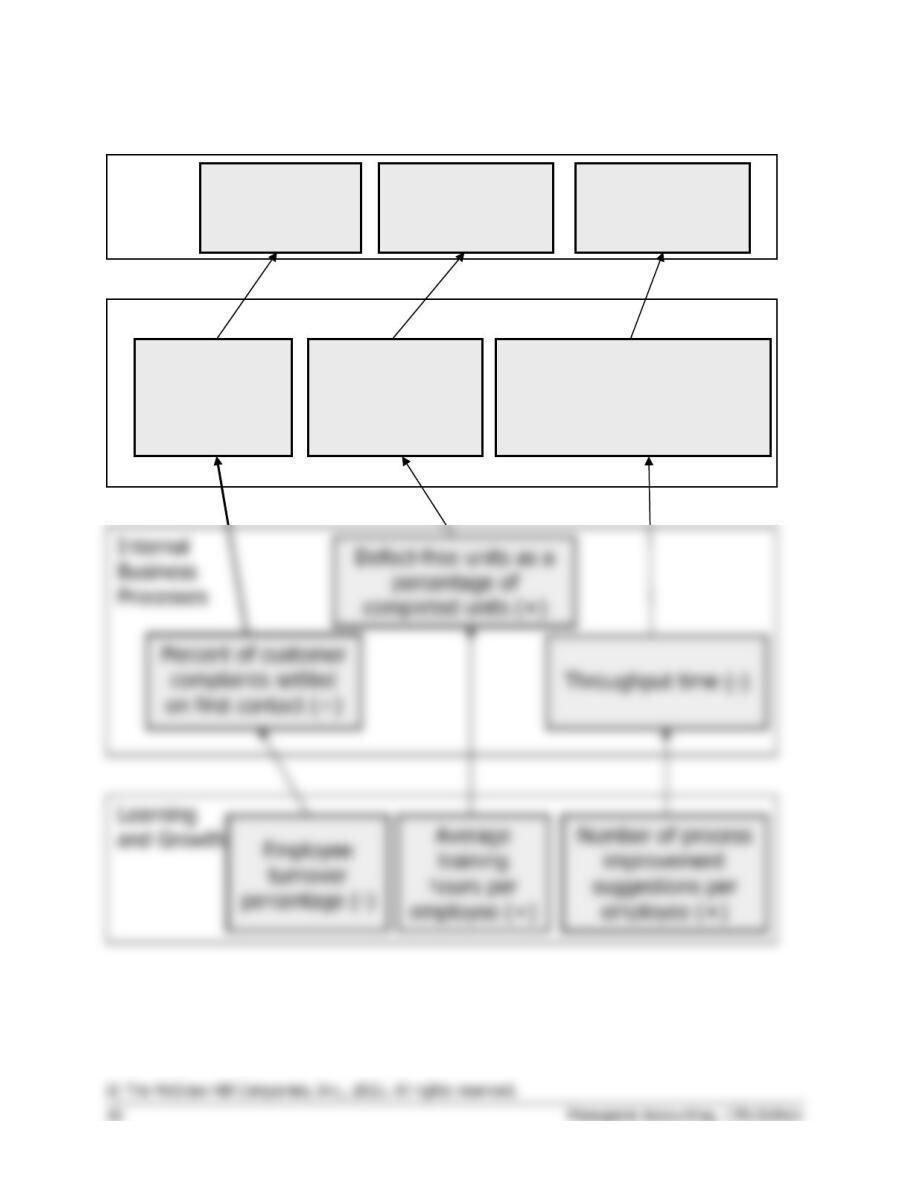
Exercise 12-6 (continued)
Price-earnings
ratio (+)
Sales growth
rate (+)
Financial
Customer
defection rate
(-)
Percent of customers that
strongly agree with the
statement “My order was
delivered on time.” (+)
Number of
customer
referrals (+)
Customer
Net cash flow
from operating
activities (+)
Exercise 12-7 (20 minutes)
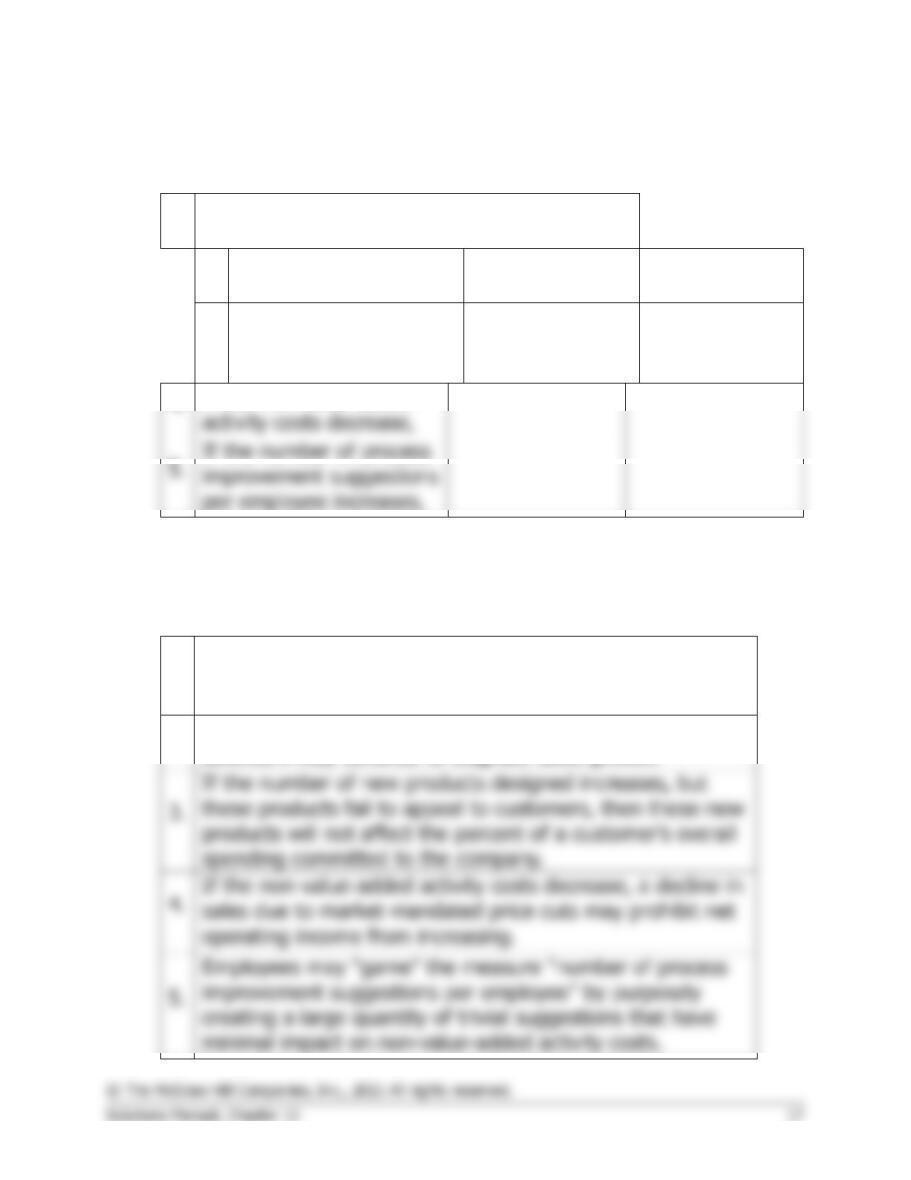
1. The if-then hypothesis statements are as follows:
1.
If the employee turnover percentage
decreases, then the number of warranty
2.
If the customer
defection rate
3.
If the number of new
products designed
increases, then the
percent of a customer’s
activity costs decrease,
If the non-value-added
2. Possible reasons why a company that is able to improve each of the
five “if” measures may not see the expected improvement in its
associated “then” measure are as follows:
1.
If the employee turnover percentage decreases, poor
quality raw material purchases may continue to cause
excessive warranty claims.
2.
If the customer defection rate decreases, an economic
Exercise 12-8 (15 minutes)
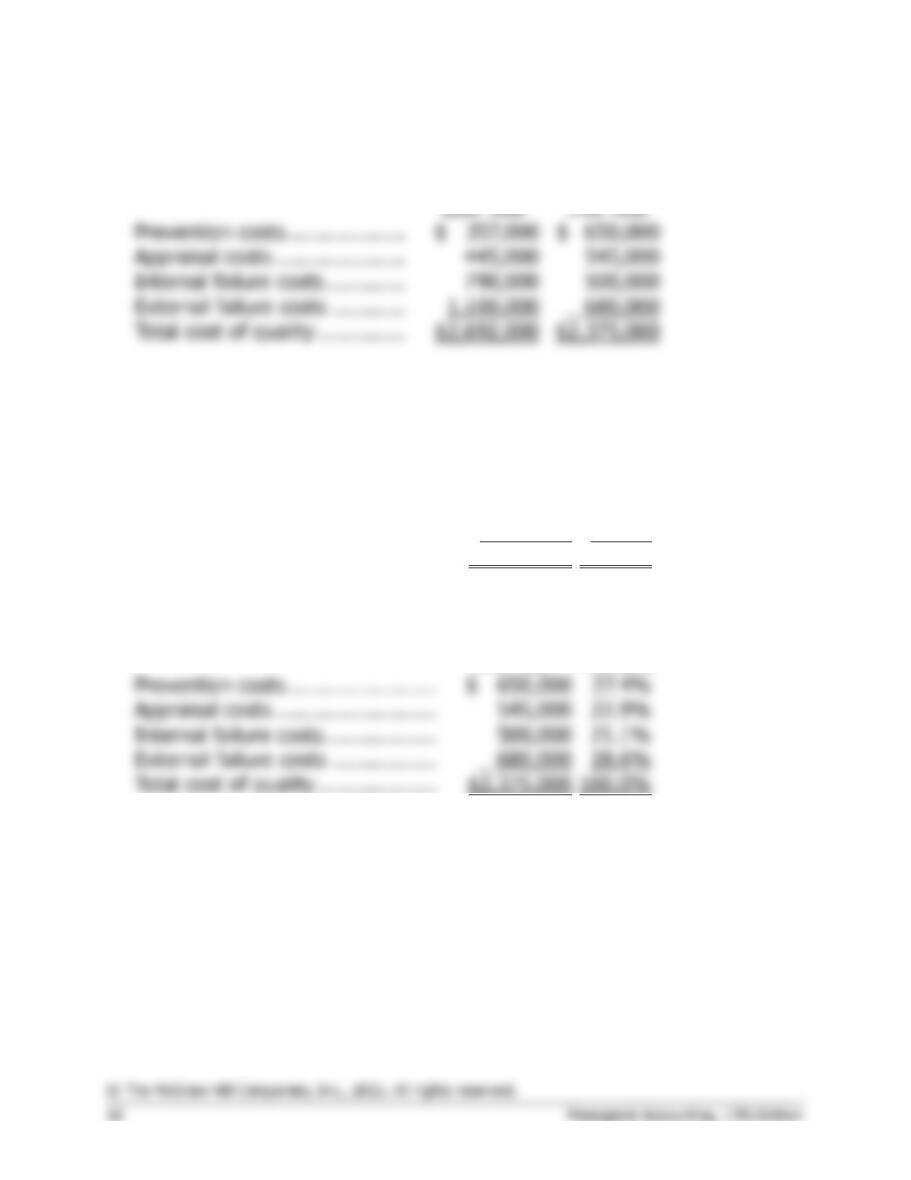
1. The total cost of quality last year and this year is computed as follows:
Prevention costs ……………….
$ 357,000
Appraisal costs …………………
Internal failure costs ………….
External failure costs …………
Total cost of quality …………..
$2,692,000
2. The appropriate percentages (rounded) are computed as follows:
Last Year
Percent
Prevention costs ……………………
$ 357,000
13.3%
Appraisal costs ……………………..
445,000
16.5%
Internal failure costs ………………
790,000
29.3%
External failure costs ……………..
1,100,000
40.9%
Total cost of quality ……………….
$2,692,000
100.0%
3. The appropriate percentages (rounded) are computed as follows:
This Year
Percent
Prevention costs ……………………
Appraisal costs ……………………..
Internal failure costs ………………
500,000
External failure costs ……………..
28.6%
Total cost of quality ……………….
100.0%
4. Performance is trending in a favorable direction. The total cost of quality
has decreased by $317,000. The company invested an additional
$393,000 in prevention and appraisal activities [($650,000 + $545,000)
– ($357,000 + $445,000)]. This enabled a $710,000 reduction in
internal and external failure costs [($790,000 + $1,100,000) –
($500,000 + $680,000)].
Exercise 12-9 (45 minutes)
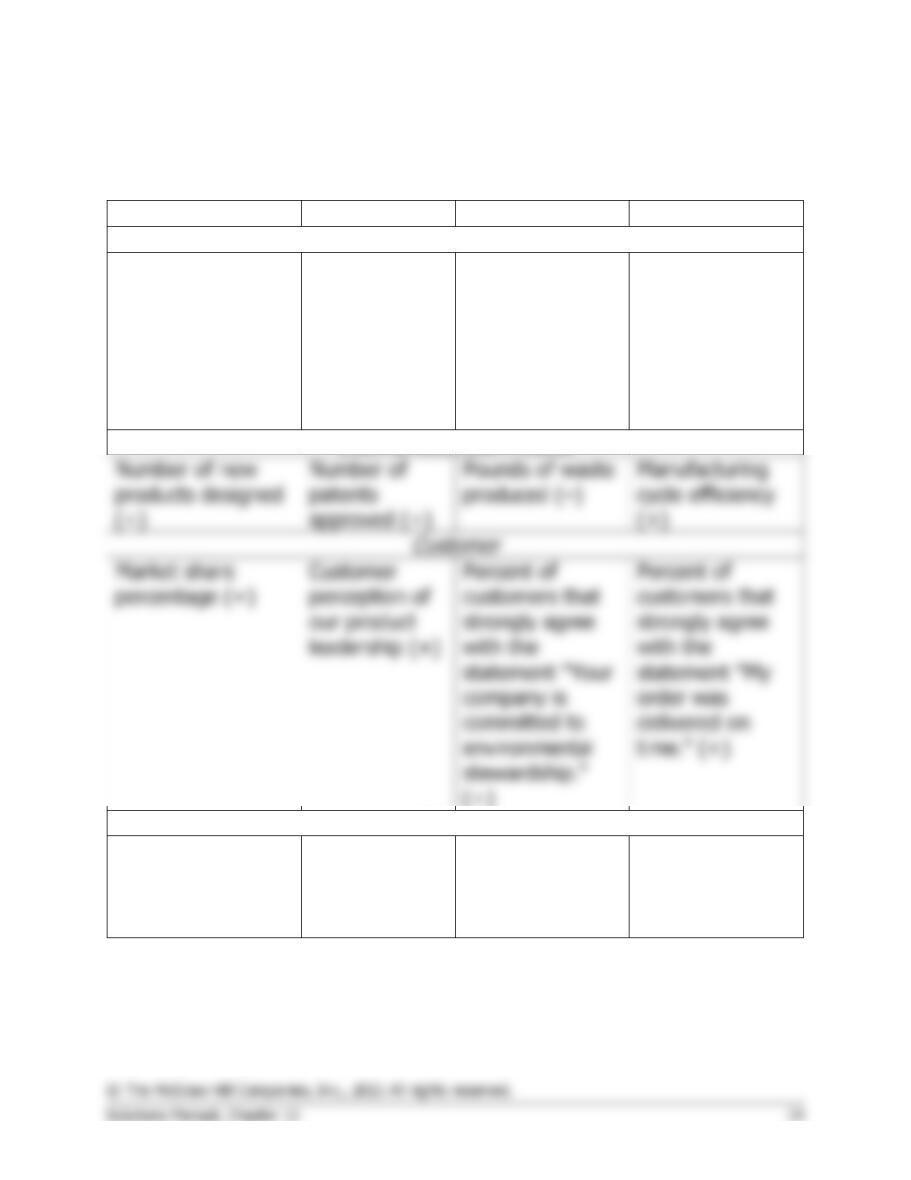
1a. The labels for all four companies are as follows:
Company A
Company B
Company C
Company D
Learning & Growth
Average years of
tenure per
employee (+)
Percent of
“outstanding”
interview
candidates
that accepted
our job offer
(+)
Number of
process
improvement
suggestions per
employee (+)
Average training
hours per
employee (+)
Number of new
products designed
(+)
Number of
patents
approved (+)
Pounds of waste
Manufacturing
cycle efficiency
(+)
environmental
(+)
time.” (+)
Financial
Sales from
products less than
three years old (+)
Patent
protected
sales (+)
Percent of
revenue from
eco-conscious
products (+)
Net operating
income growth
rate (+)
Exercise 12-9 (continued)
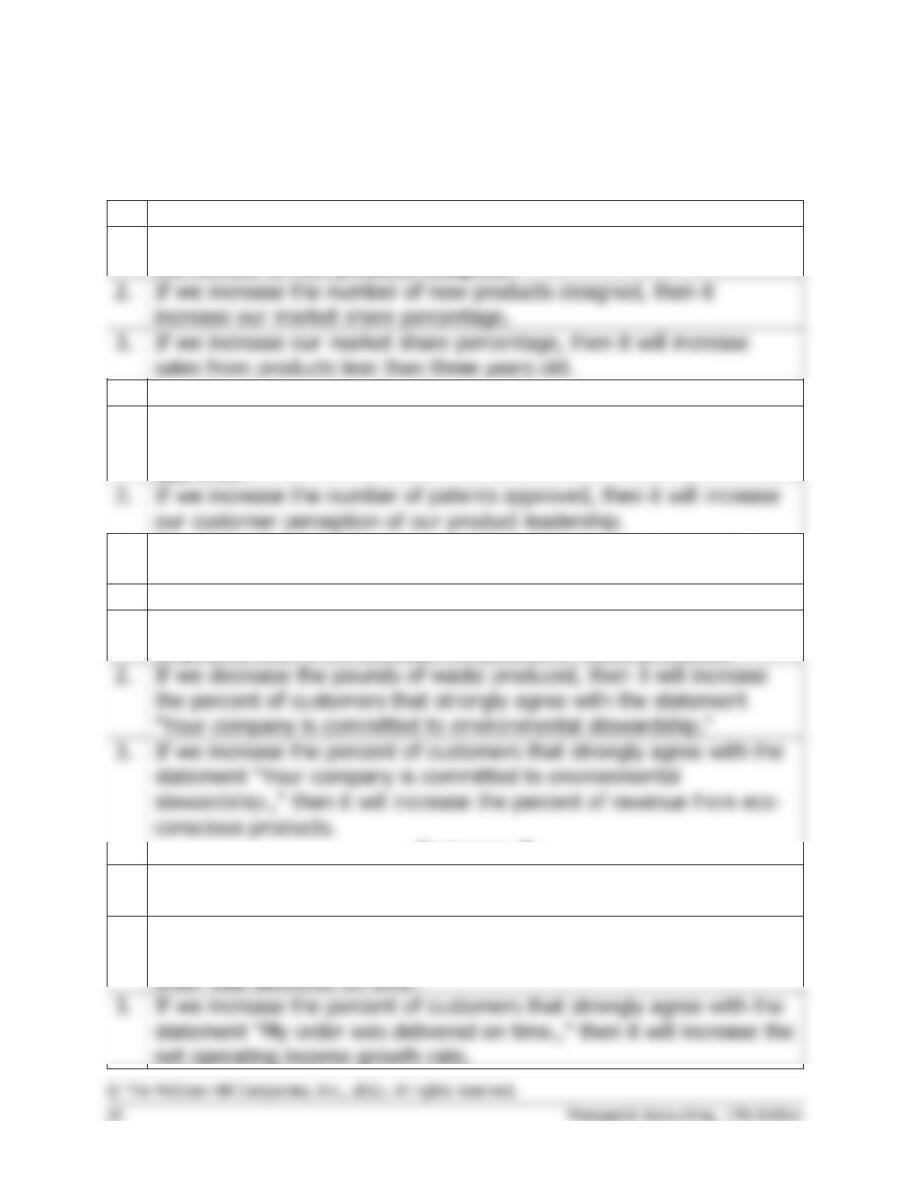
1b. The if-then hypothesis statements are as follows:
Company A
1.
If we increase the average tenure per employee, then it will increase
the number of new products designed.
2.
If we increase the number of new products designed, then it
increase our market share percentage.
sales from products less than three years old.
Company B
1.
If we increase the percent of “outstanding” interview candidates that
accepted our job offer, then it will increase the number of patents
approved.
2.
If we increase the number of patents approved, then it will increase
3.
If we increase the customer perception of our product leadership,
then it will increase patent protected sales.
Company C
1.
If we increase the number of process improvement suggestions per
employee, then it will decrease the pounds of waste produced.
Company D
1.
If we increase the average training hours per employee, it will
increase manufacturing cycle efficiency.
2.
If we increase manufacturing cycle efficiency, then it will increase
the percent of customers that strongly agree with the statement “My
order was delivered on time.”
net operating income growth rate.