Problem 12-5B (LO12.4)
Profitability Ratios
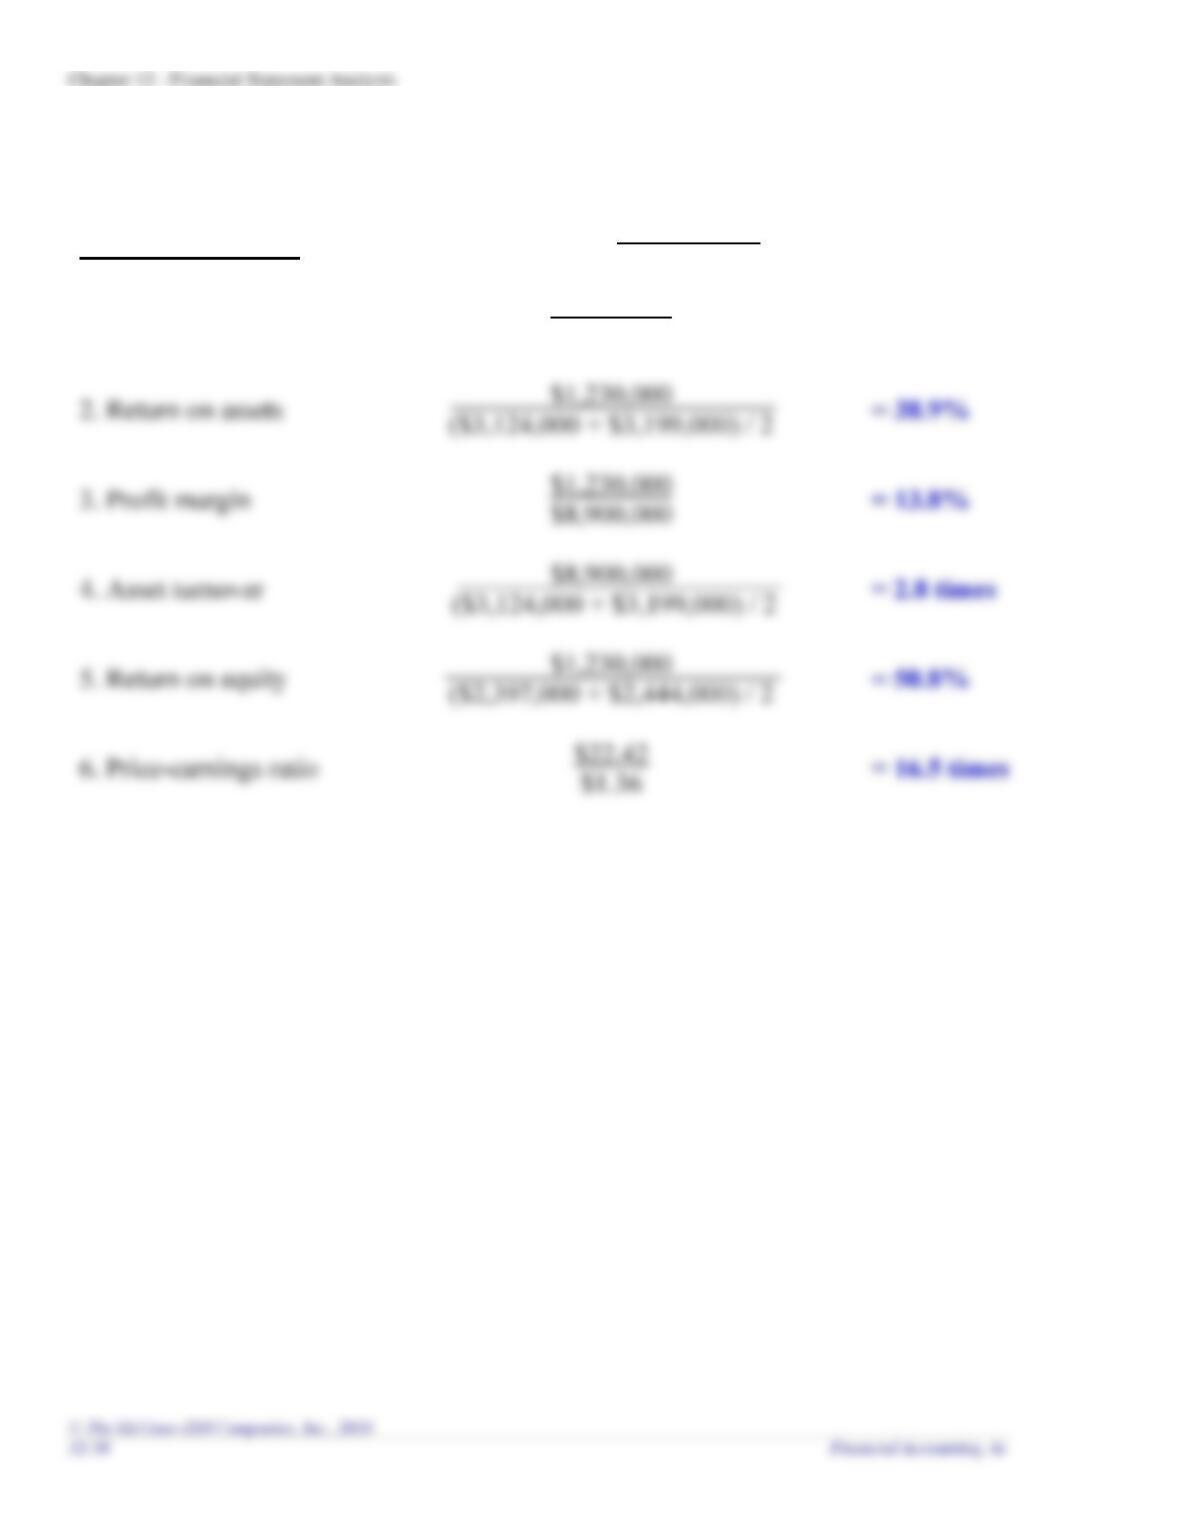
Calculations
1. Gross profit ratio
$3,450,000
$8,900,000
= 38.8%
2. Return on assets
= 38.9%
$1,230,000
$8,900,000
4. Asset turnover
= 2.8 times
5. Return on equity
= 50.8%
6. Price-earnings ratio
= 16.5 times
Chapter 12 – Financial Statement Analysis
Problem 12-6B (LO12.3, 12.4)
Requirement 1
Risk Ratios
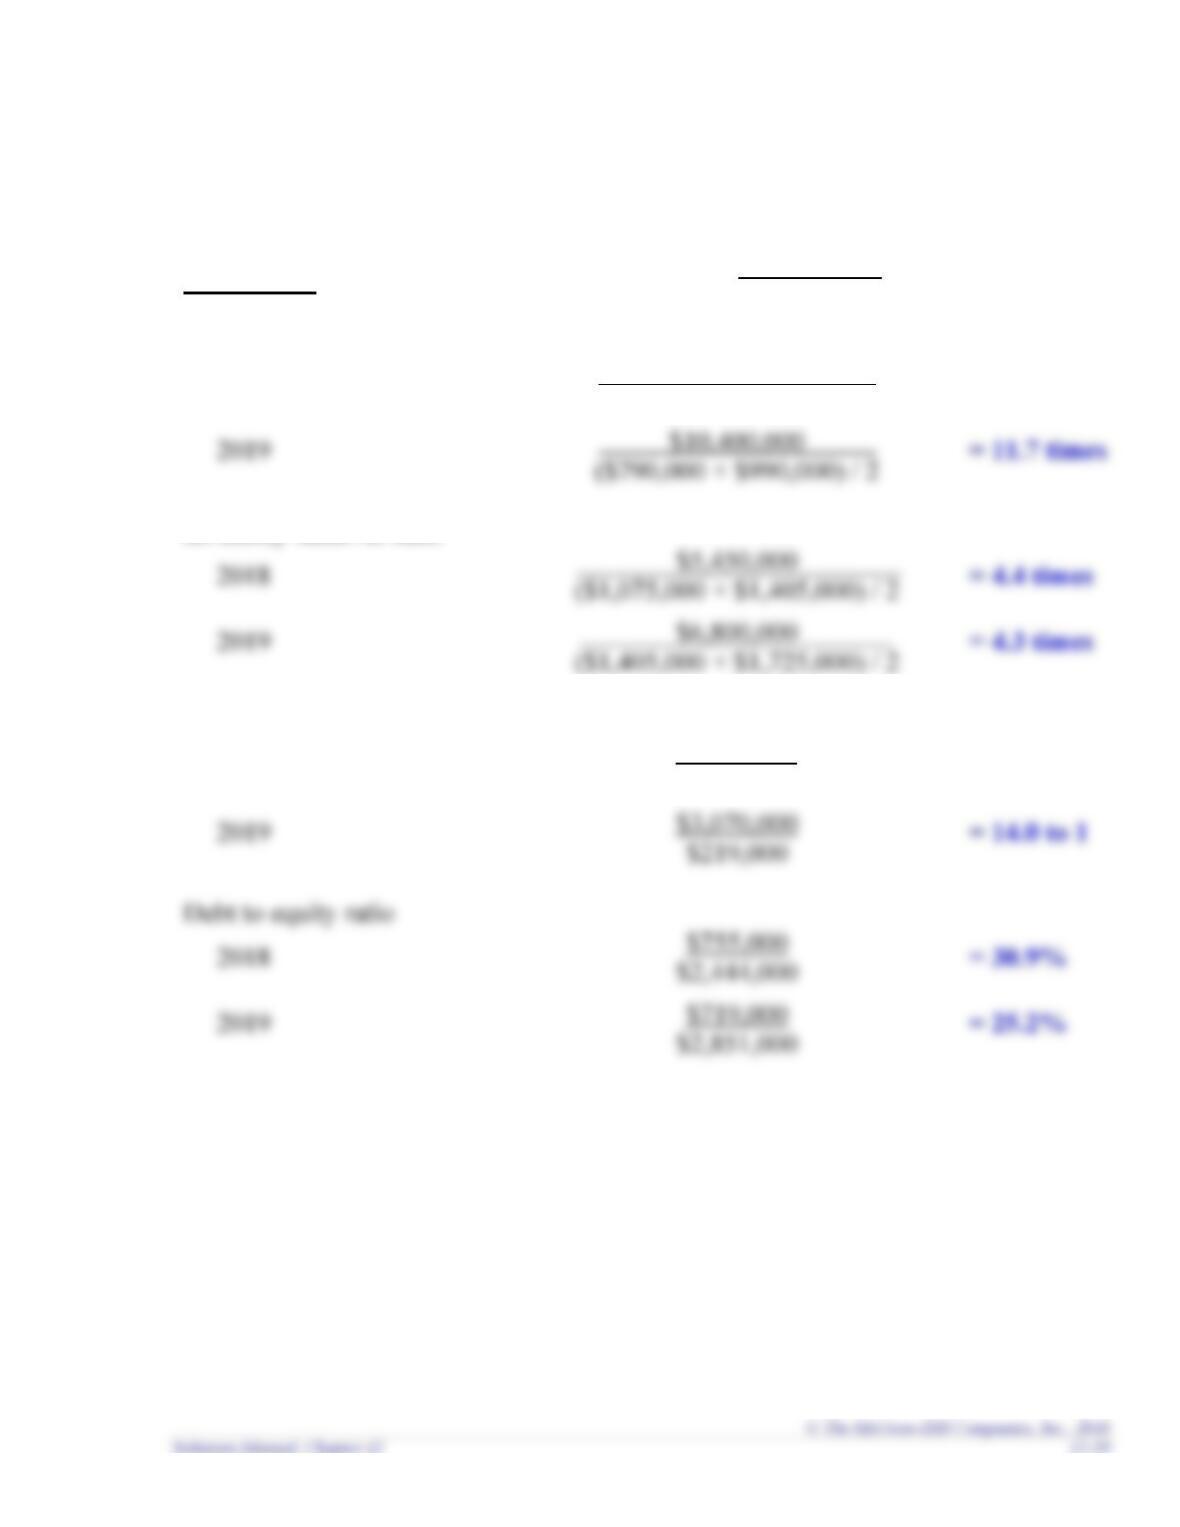
Calculations
Receivables turnover ratio
2018
$8,900,000
($810,000 + $790,000) / 2
= 11.1 times
Inventory turnover ratio
2018
= 4.4 times
$6,800,000
Current ratio
2018
$2,469,000
$155,000
= 15.9 to 1
$3,070,000
Debt to equity ratio
2018
= 30.9%
Chapter 12 – Financial Statement Analysis
Requirement 2
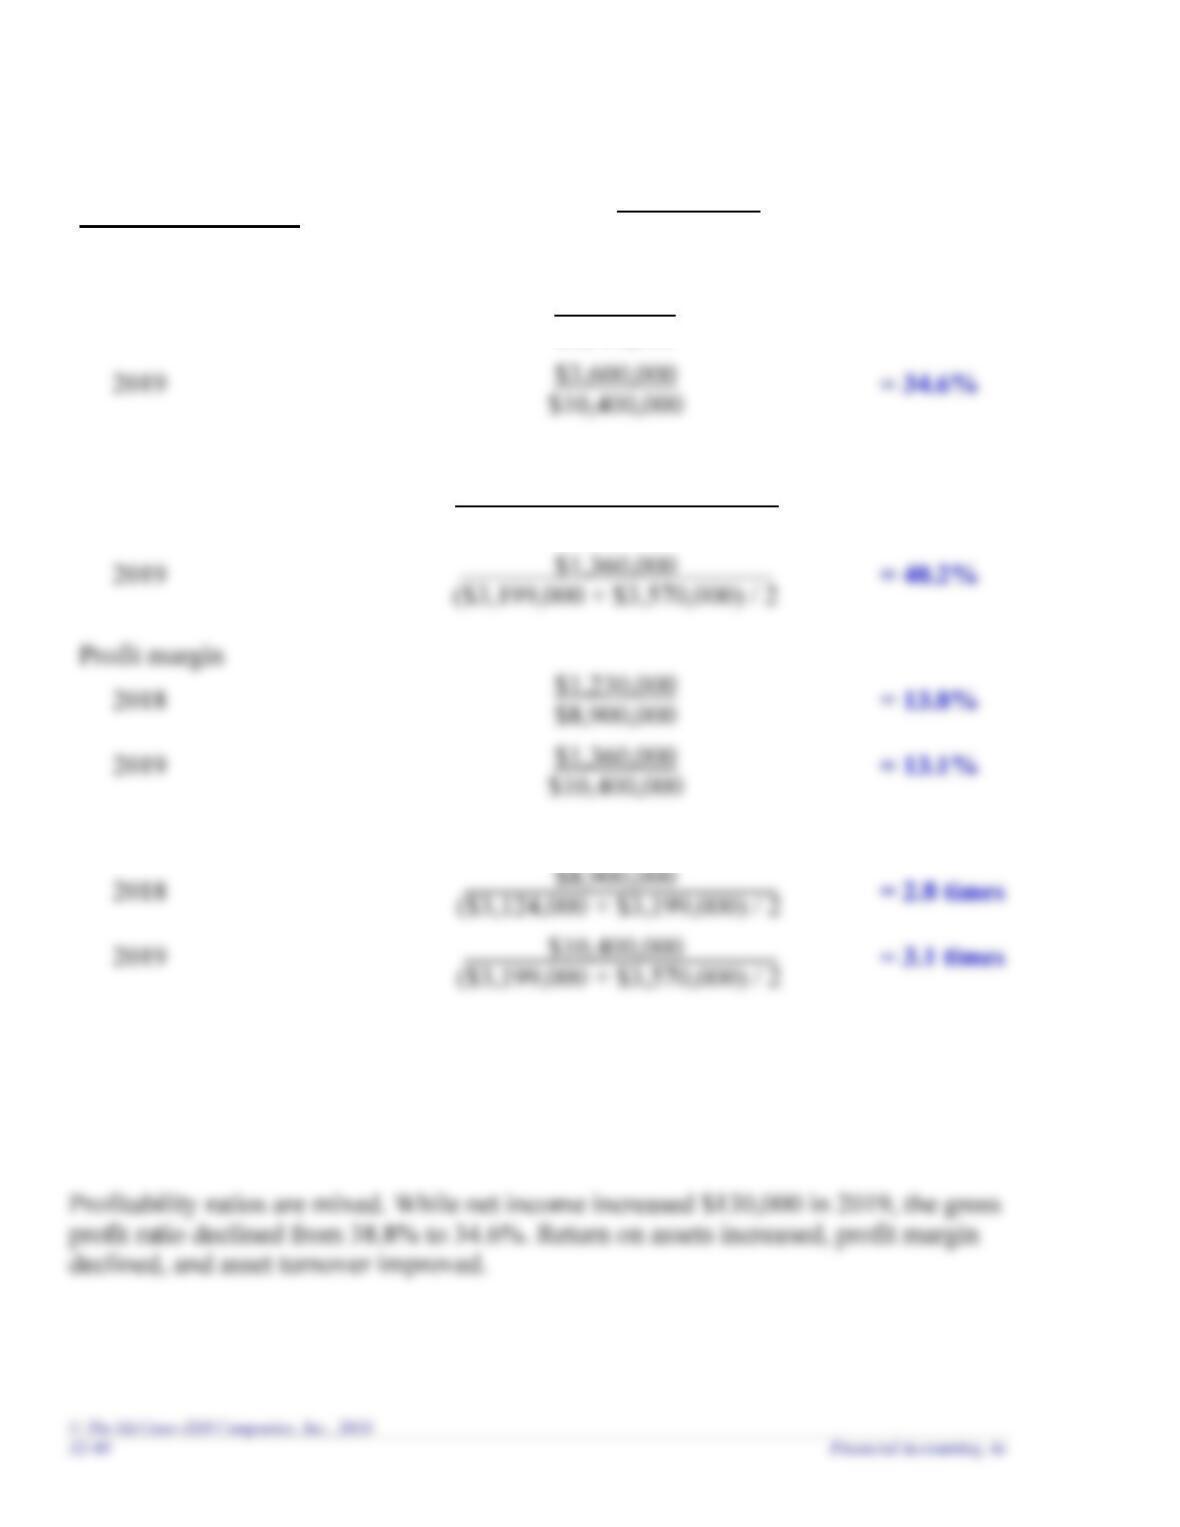
Profitability Ratios
Calculations
Gross profit ratio
2018
$3,450,000
$8,900,000
= 38.8%
Return on assets
2018
$1,230,000
($3,124,000 + $3,199,000) / 2
= 38.9%
Profit margin
2018
$1,230,000
$8,900,000
= 13.8%
Asset turnover
2018
$8,900,000
= 2.8 times
Requirement 3
Regarding risk, the receivables turnover slightly improved and the debt to equity ratio
declined, which are both positive signs. However, the inventory turnover ratio and
current ratio both declined in 2019.
Chapter 12 – Financial Statement Analysis
ADDITIONAL PERSPECTIVES
Continuing Problem: Great Adventures
AP12-1
Requirement 1
Note: Assume all sales and services are on credit.
Risk Ratios
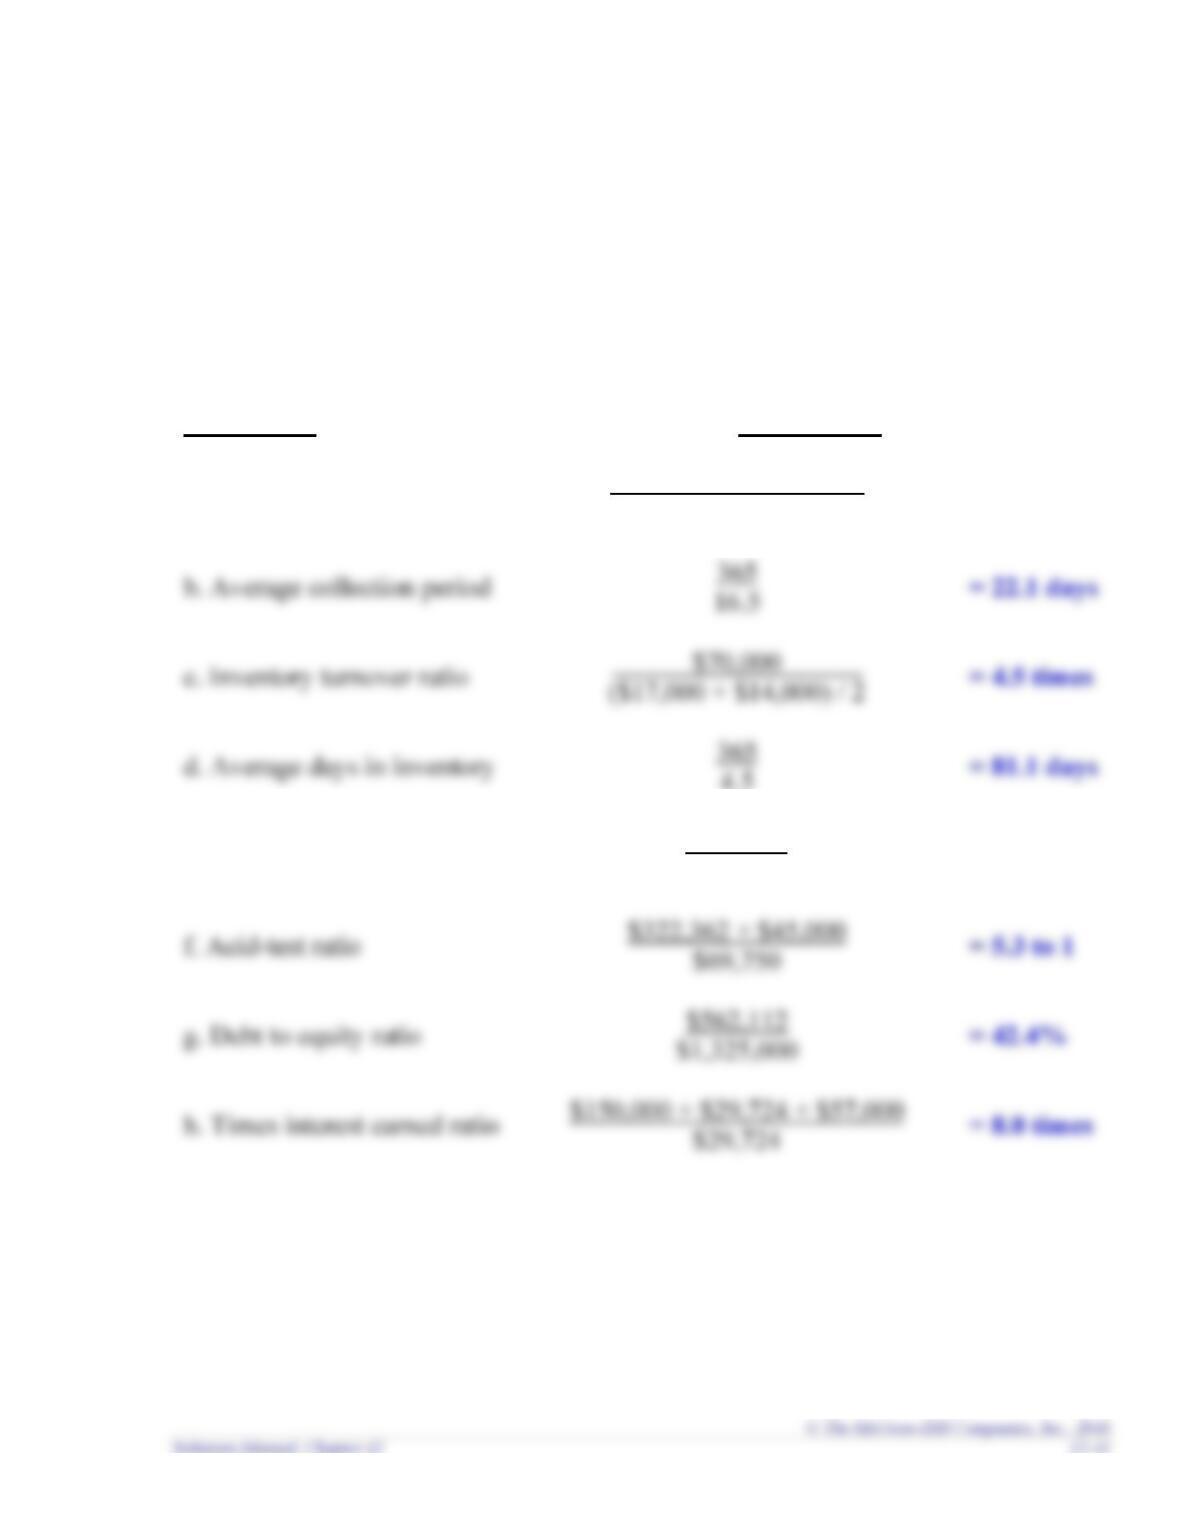
Calculations
a. Receivables turnover ratio
$661,000
($45,000 + $35,000) / 2
= 16.5 times
b. Average collection period
= 22.1 days
c. Inventory turnover ratio
($17,000 + $14,000) / 2
= 4.5 times
d. Average days in inventory
= 81.1 days
4.5
e. Current ratio
$397,362
$69,750
= 5.7 to 1
f. Acid-test ratio
$69,750
= 5.3 to 1
$562,112
h. Times interest earned ratio
$29,724
= 8.0 times
Chapter 12 – Financial Statement Analysis
Requirement 2
Profitability Ratios
Calculations
a. Gross profit ratio
$118,000 − $70,000
$118,000
= 40.7%
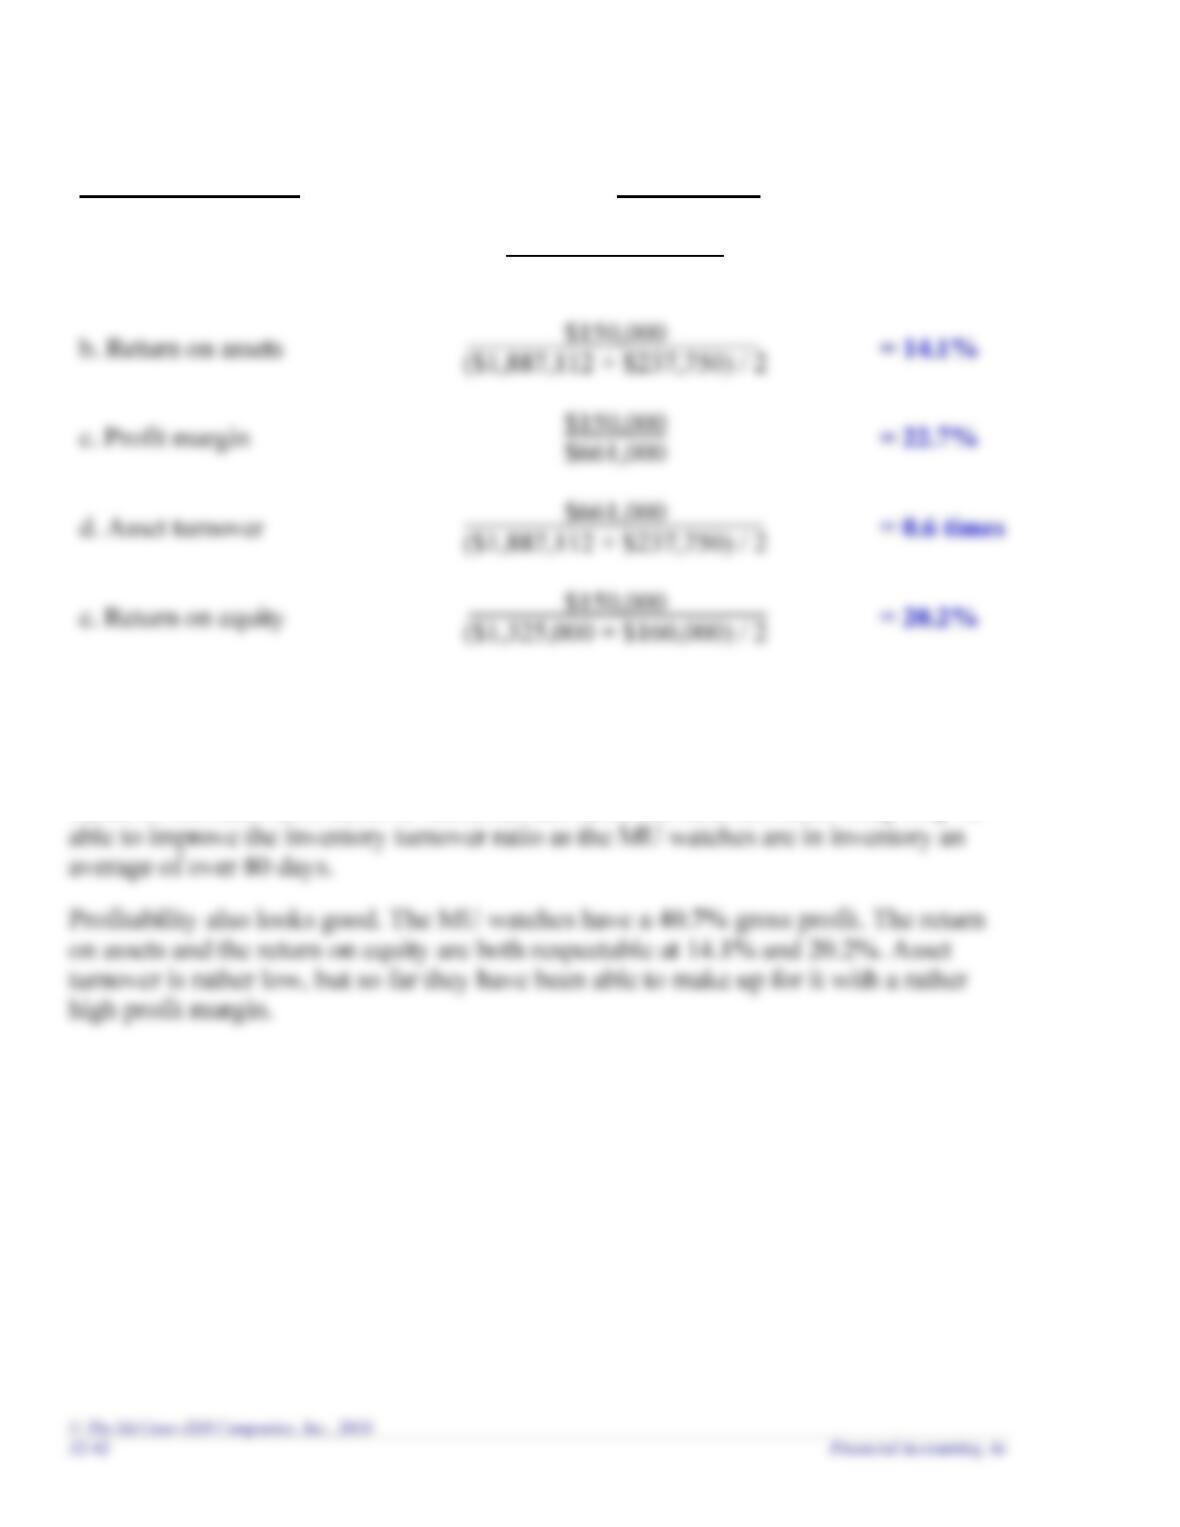
b. Return on assets
= 14.1%
c. Profit margin
= 22.7%
d. Asset turnover
= 0.6 times
Requirement 3
Regarding risk, Great Adventures appears to be in great shape. Liquidity is strong
based on the receivable turnover ratio, current ratio, and acid-test ratio. They may be
Chapter 12 – Financial Statement Analysis
Financial Analysis: American Eagle
AP12-2
Requirement 1
Risk Ratios
Calculations
a. Receivable turnover ratio
$3,282,867
($73,882 + $67,894) / 2
= 46.3 times
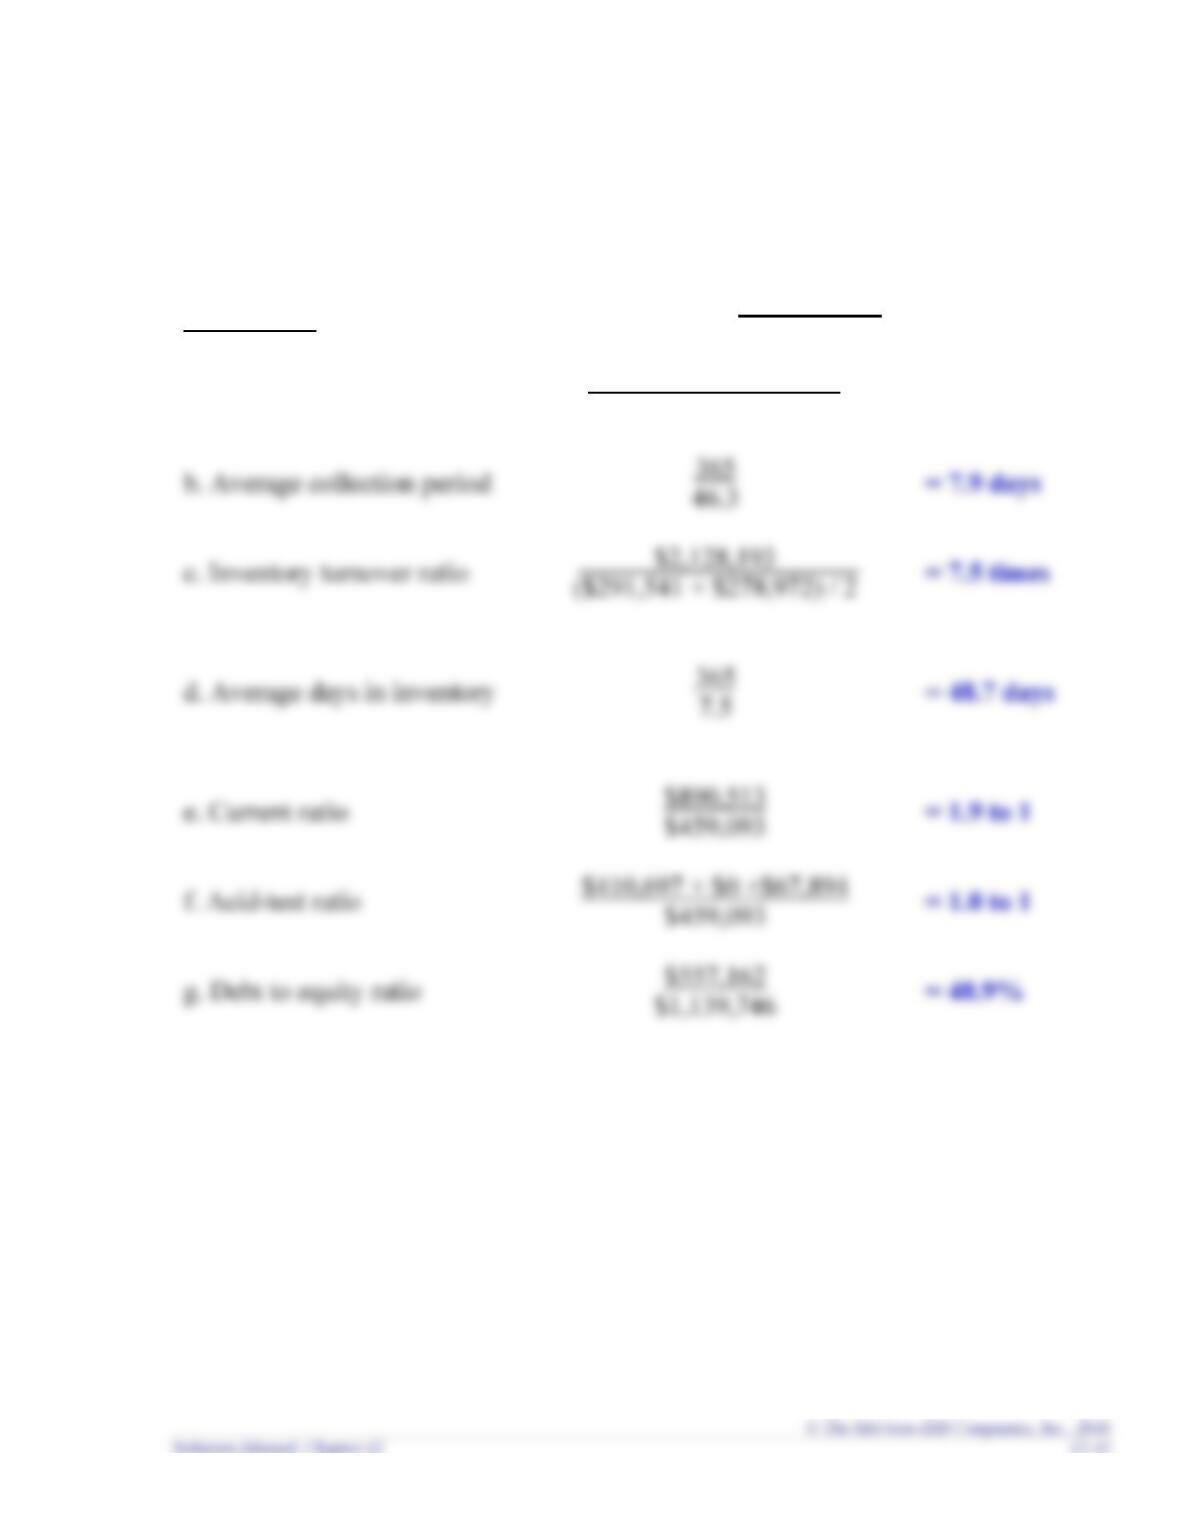
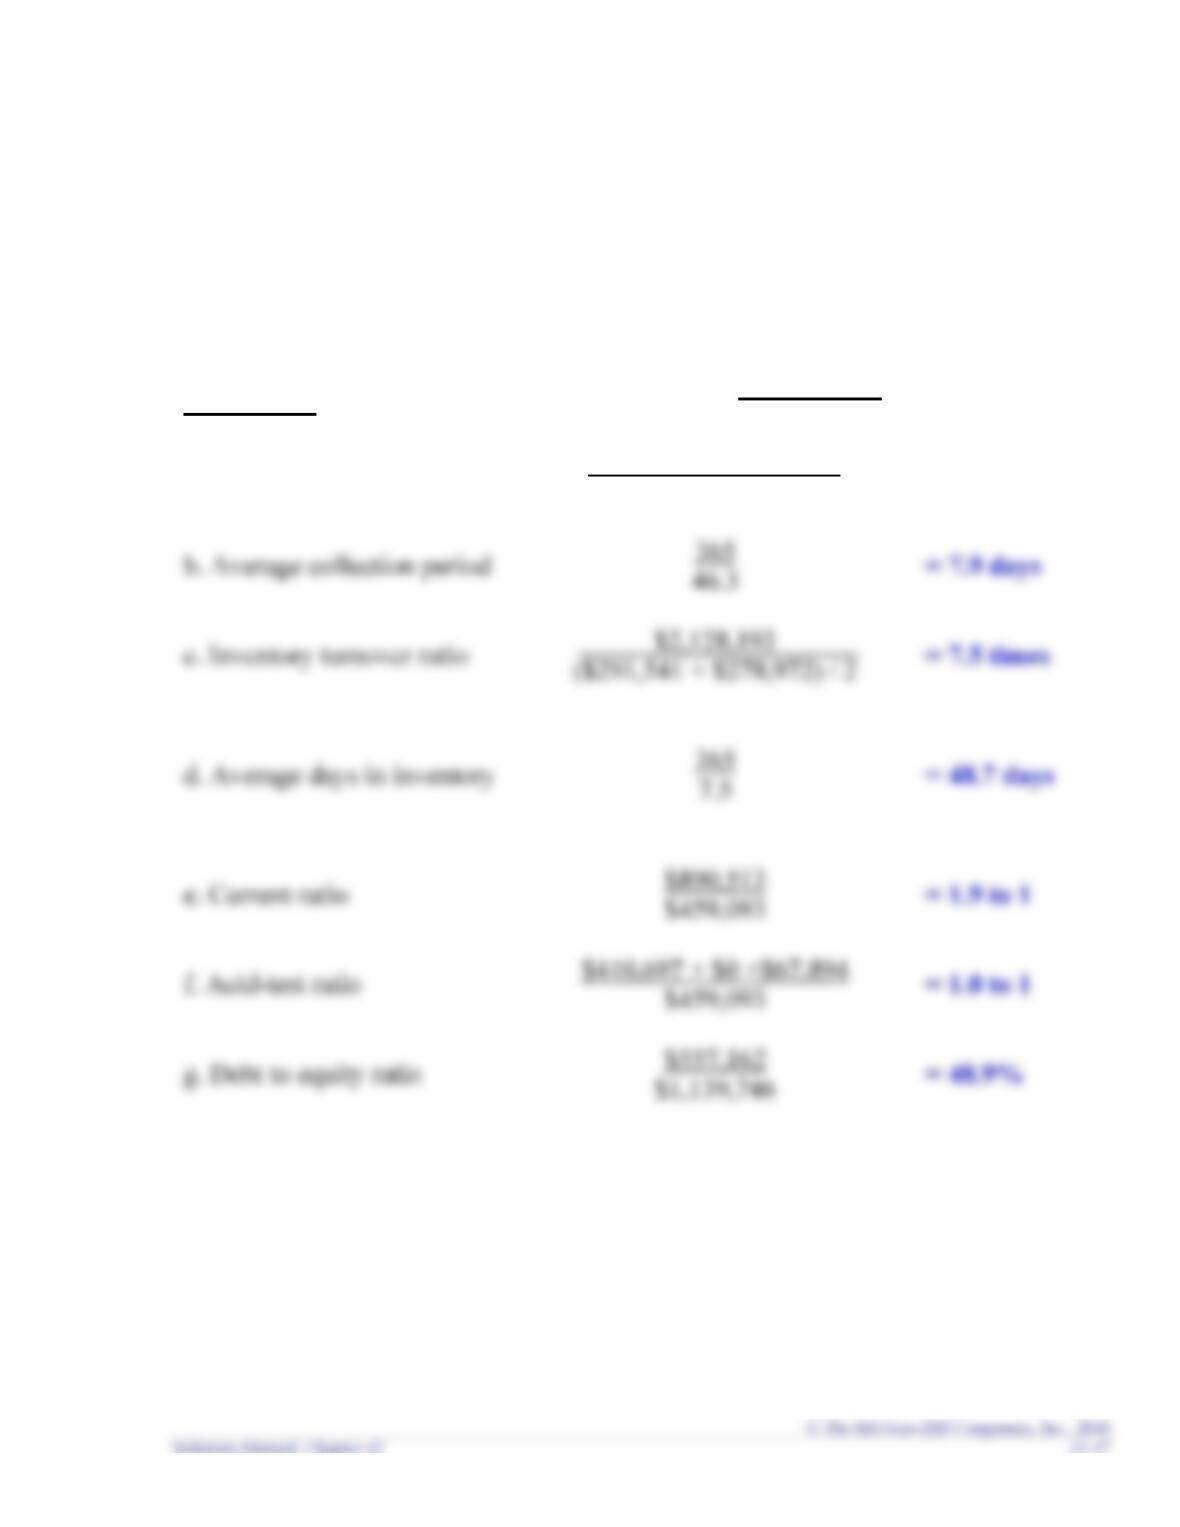
b. Average collection period
= 7.9 days
$2,128,193
d. Average days in inventory
= 48.7 days
e. Current ratio
= 1.9 to 1
f. Acid-test ratio
= 1.0 to 1
g. Debt to equity ratio
= 48.9%
Chapter 12 – Financial Statement Analysis
12–44 Financial Accounting, 4e
Requirement 2
Profitability Ratios
Calculations
a. Gross profit ratio
$1,154,674
$3,282,867
= 35.2%
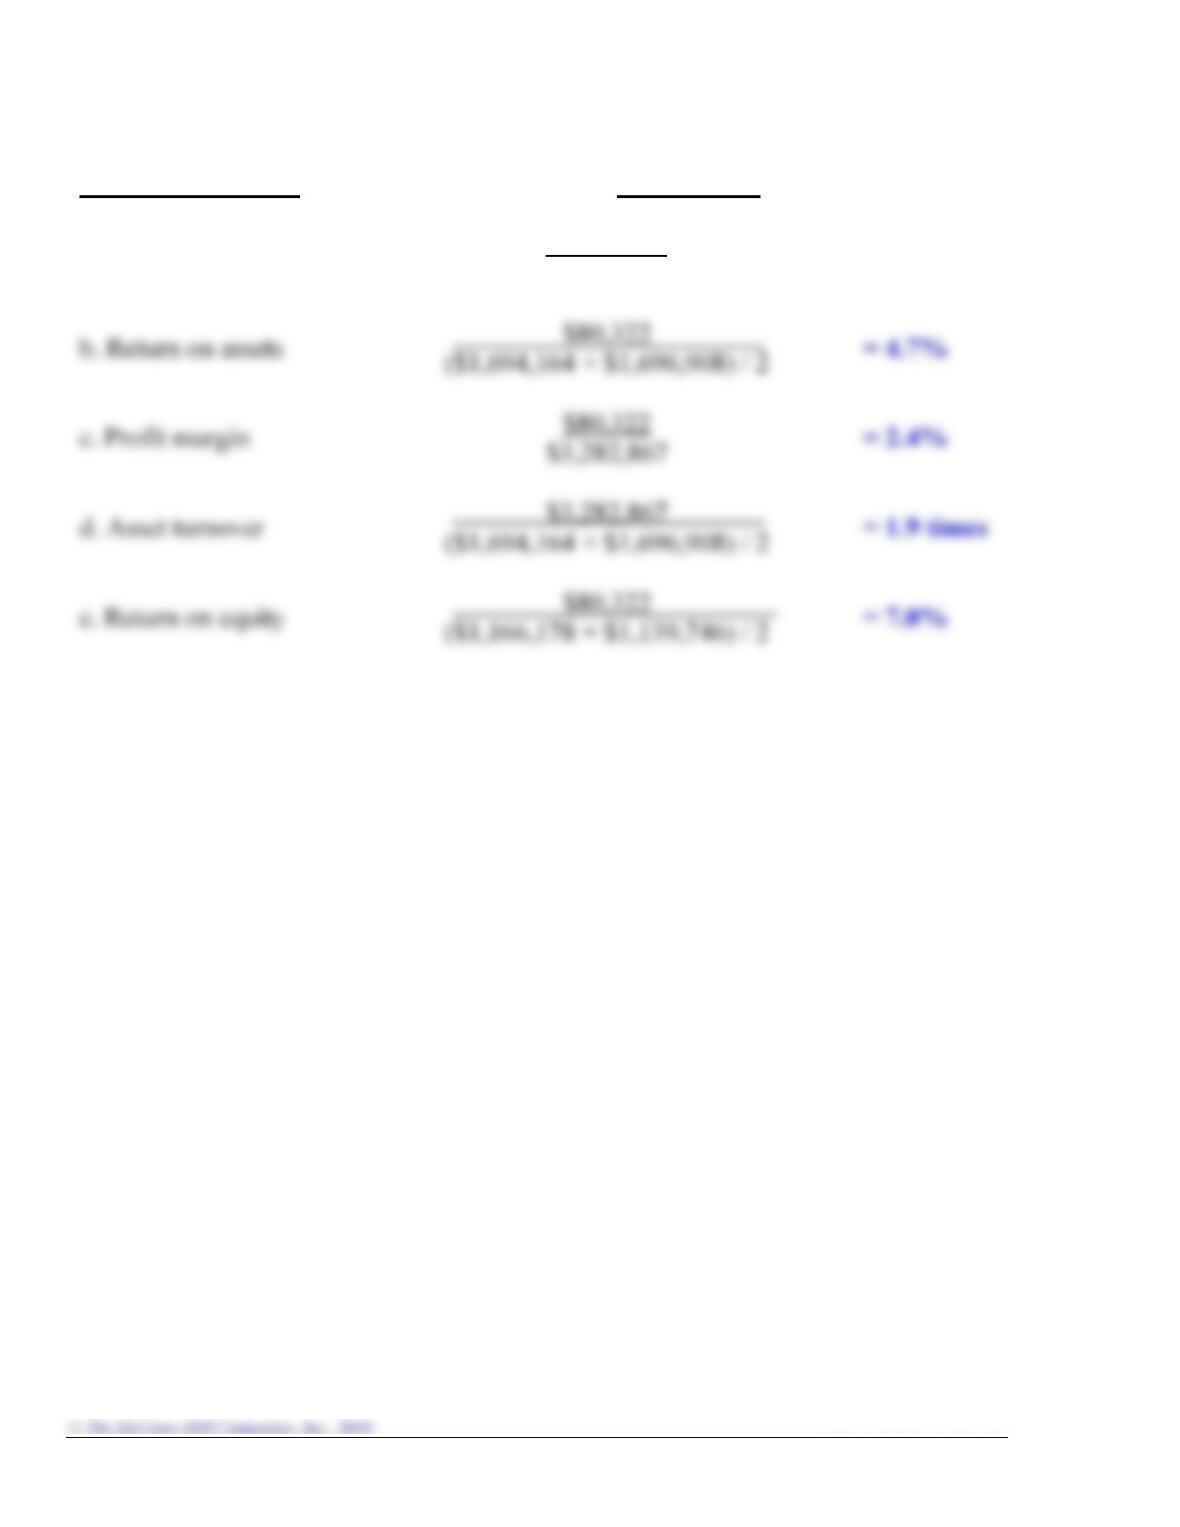
b. Return on assets
= 4.7%
c. Profit margin
= 2.4%
d. Asset turnover
= 1.9 times
Chapter 12 – Financial Statement Analysis
Financial Analysis: The Buckle
AP12-3
Requirement 1
Risk Ratios
Calculations
a. Receivable turnover ratio
$1,153,142
($4,318 + $8,567) / 2
= 179.0 times
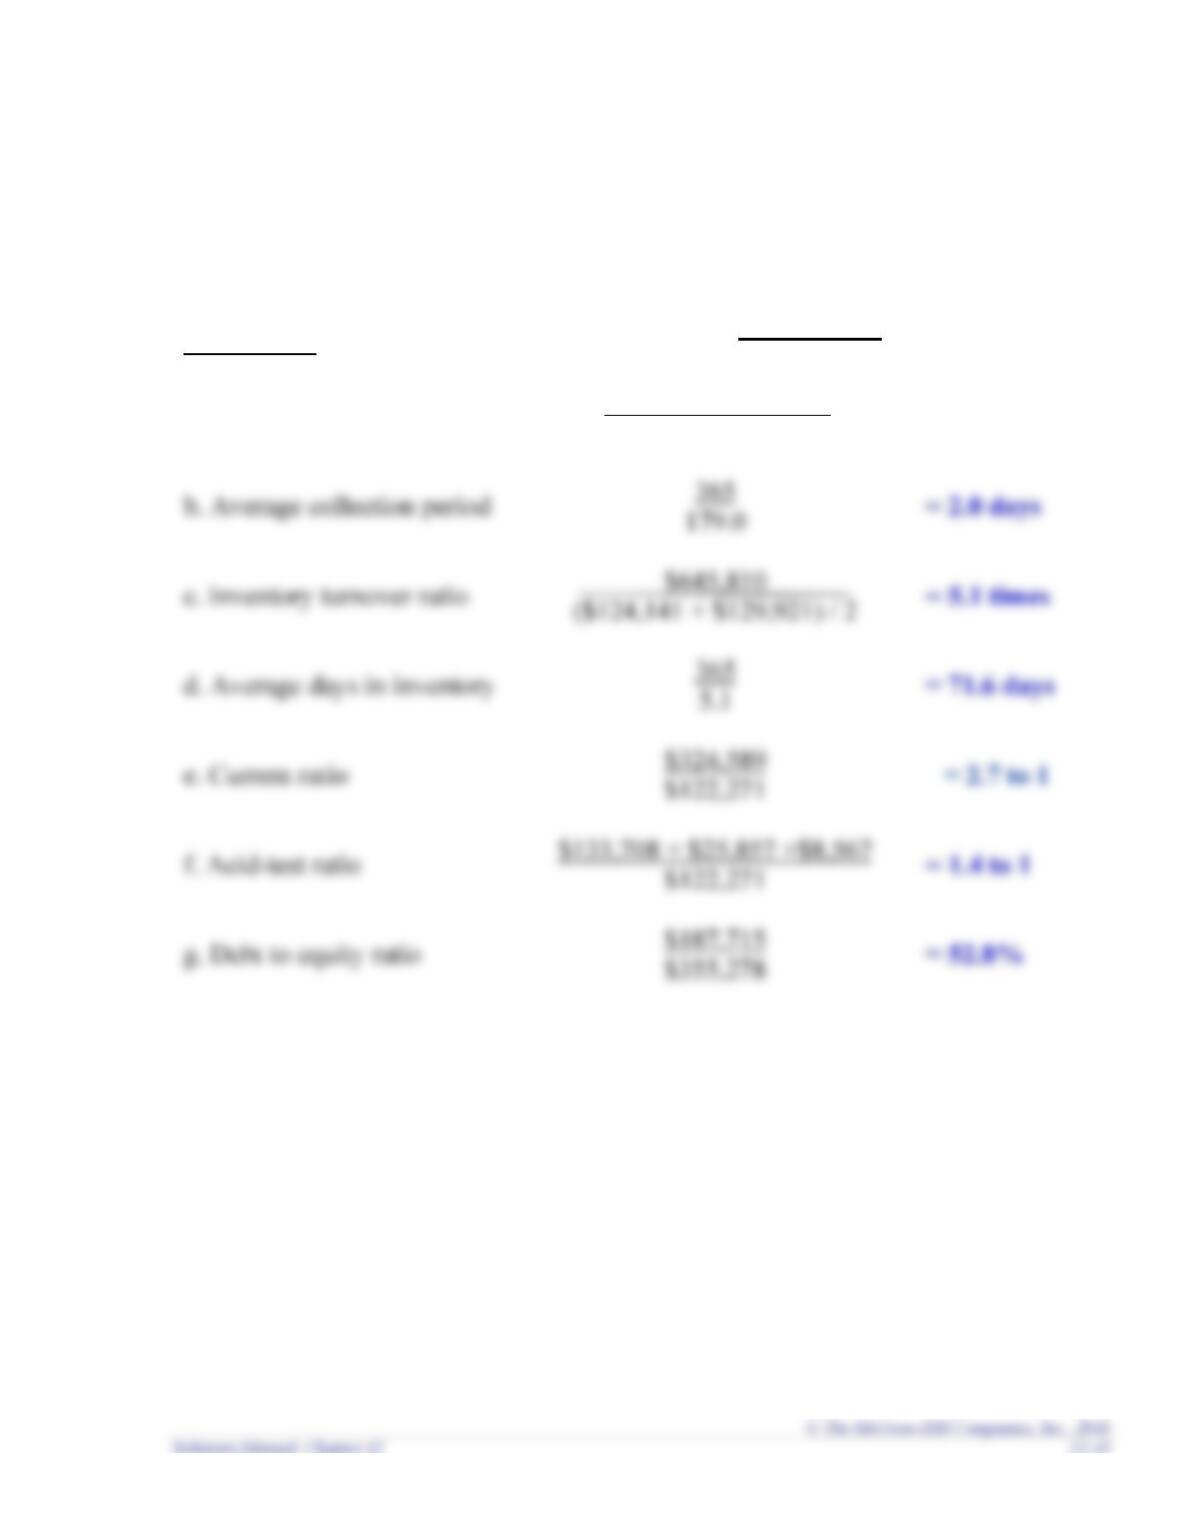
b. Average collection period
= 2.0 days
d. Average days in inventory
= 71.6 days
e. Current ratio
f. Acid-test ratio
= 1.4 to 1
g. Debt to equity ratio
= 52.8%
Chapter 12 – Financial Statement Analysis
Requirement 2
Profitability Ratios
Calculations
a. Gross profit ratio
$507,332
$1,153,142
= 44.0%
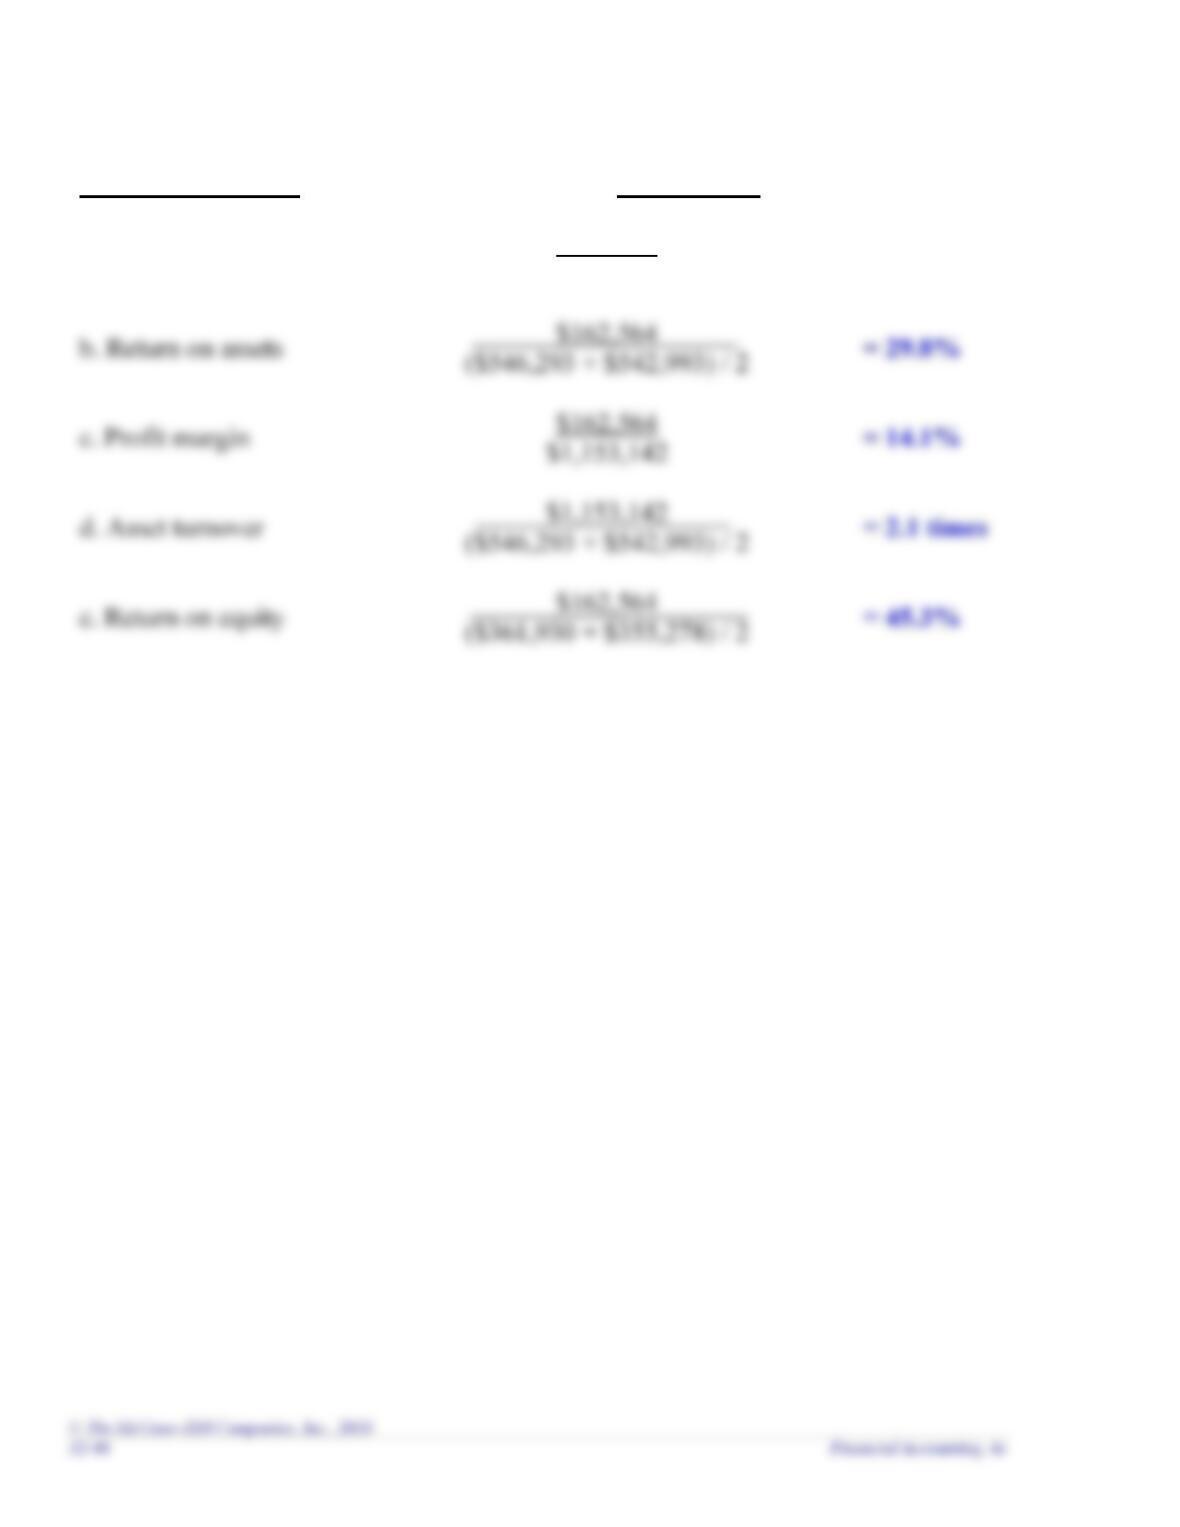
b. Return on assets
= 29.8%
c. Profit margin
$162,564
$1,153,142
= 14.1%
d. Asset turnover
= 2.1 times
$162,564
Chapter 12 – Financial Statement Analysis
Comparative Analysis: American Eagle vs. The Buckle
AP12-4
Requirement 1
American Eagle
Risk Ratios
Calculations
a. Receivable turnover ratio
$3,282,867
($73,882 + $67,894) / 2
= 46.3 times
b. Average collection period
= 7.9 days
c. Inventory turnover ratio
= 7.5 times
d. Average days in inventory
= 48.7 days
f. Acid-test ratio
= 1.0 to 1
g. Debt to equity ratio
= 48.9%
Chapter 12 – Financial Statement Analysis
The Buckle
Risk Ratios
Calculations
a. Receivable turnover ratio
$1,153,142
($4,318 + $8,567) / 2
= 179.0 times
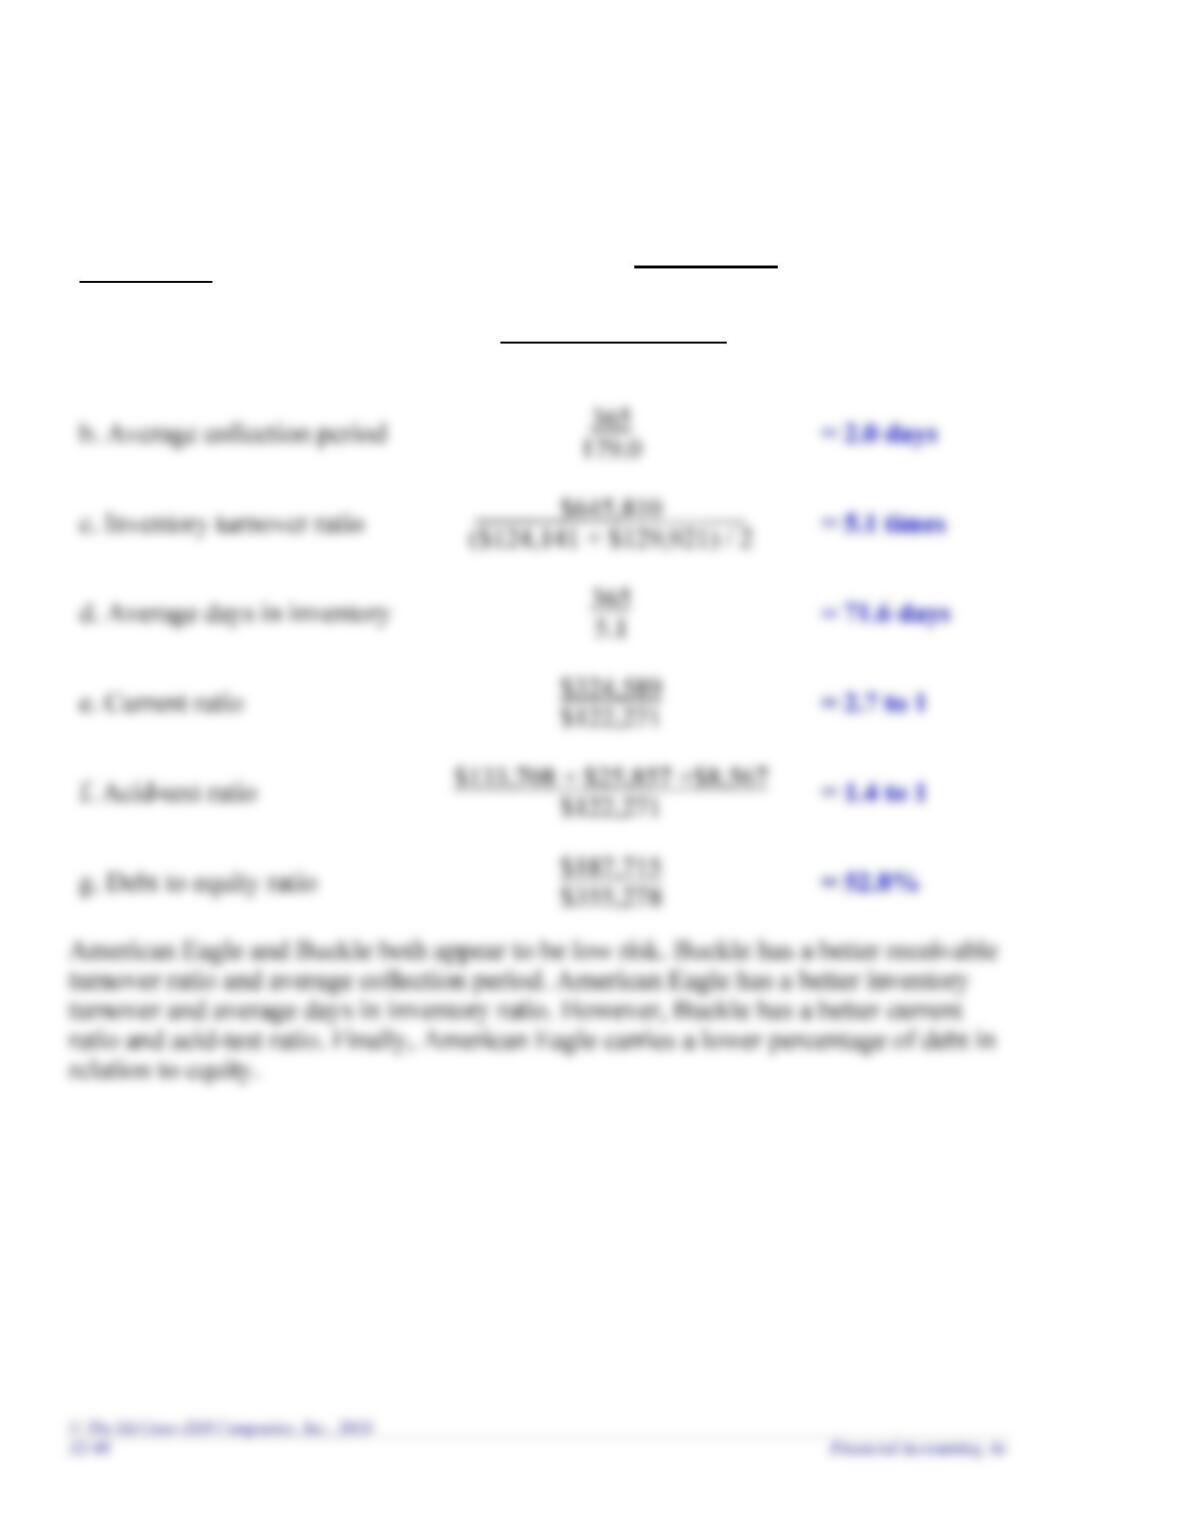
b. Average collection period
= 2.0 days
d. Average days in inventory
= 71.6 days
e. Current ratio
= 2.7 to 1
g. Debt to equity ratio
= 52.8%
Chapter 12 – Financial Statement Analysis
Requirement 2
American Eagle
Profitability Ratios
Calculations
a. Gross profit ratio
$1,154,674
$3,282,867
= 35.2%
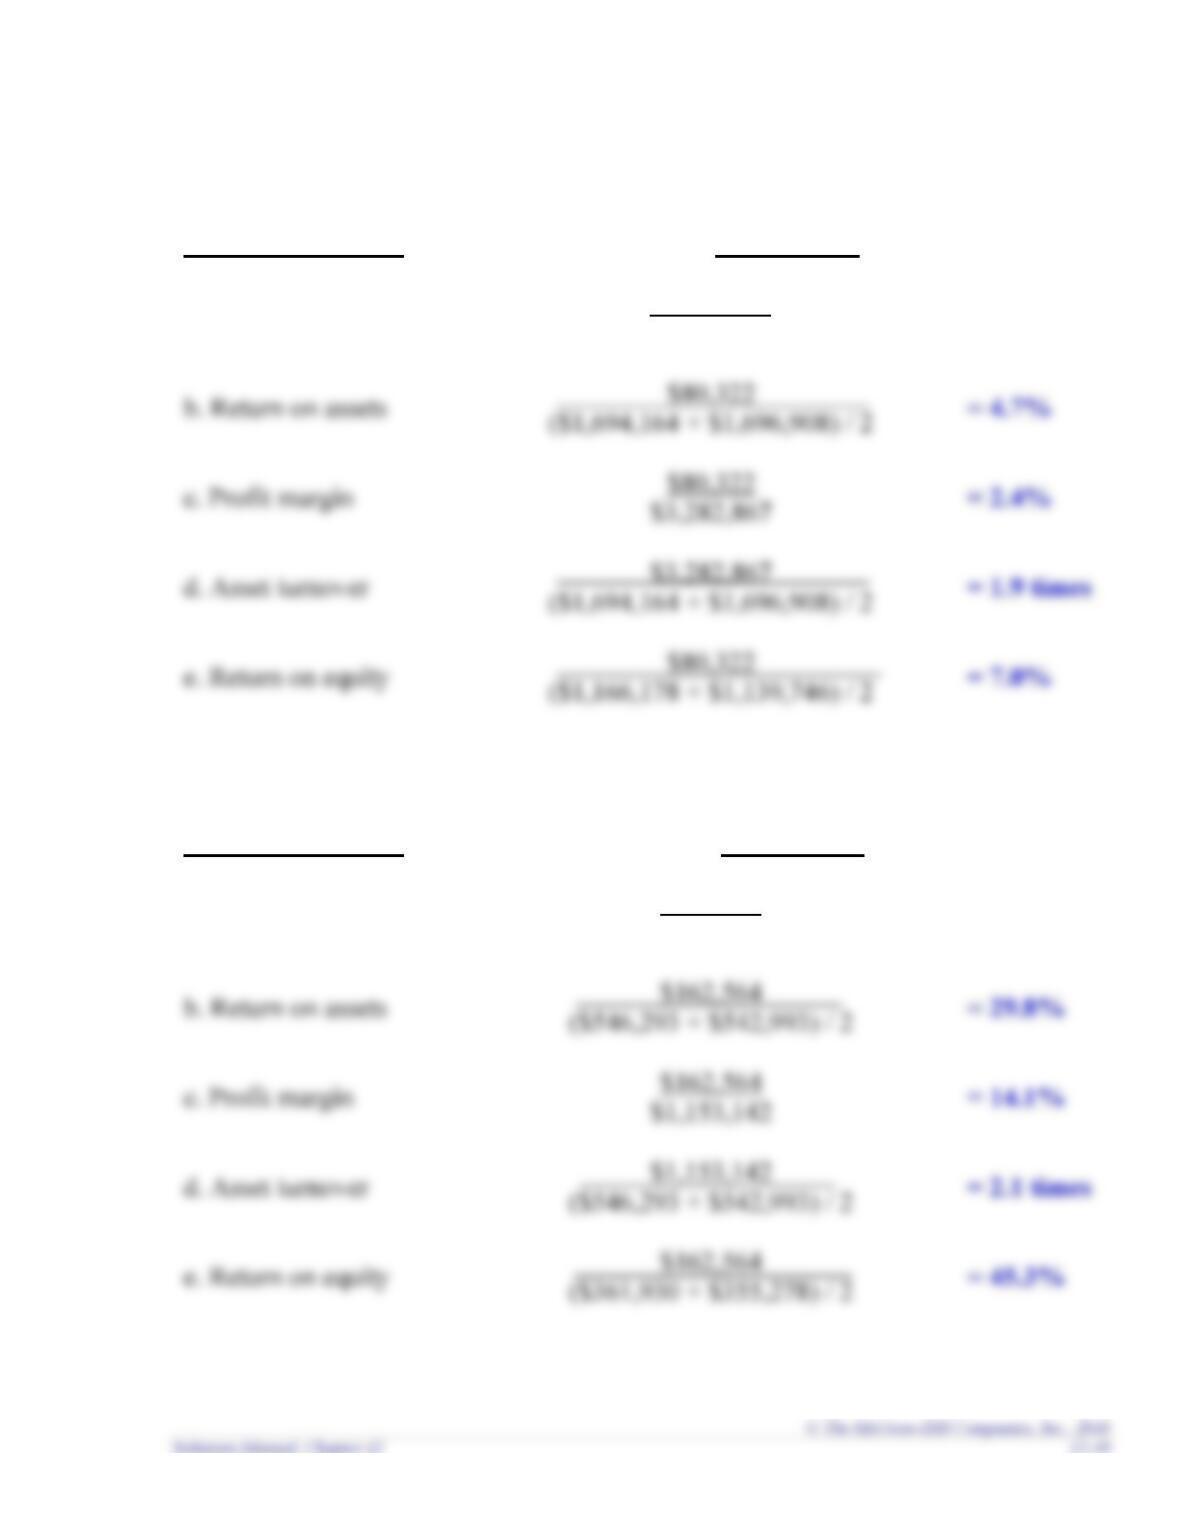
b. Return on assets
= 4.7%
c. Profit margin
= 2.4%
d. Asset turnover
= 1.9 times
e. Return on equity
($1,166,178 + $1,139,746) / 2
= 7.0%
The Buckle
Profitability Ratios
Calculations
a. Gross profit ratio
$507,332
$1,153,142
= 44.0%
b. Return on assets
= 29.8%
c. Profit margin
$162,564
$1,153,142
= 14.1%
d. Asset turnover
= 2.1 times
e. Return on equity
$162,564
= 45.3%
Chapter 12 – Financial Statement Analysis
Chapter 12 – Financial Statement Analysis
Ethics
AP12-5
The CFO and the CEO must decide whether to report a $2 million dollar write-down
in inventory at the end of 2018 or wait and record the write-down early in 2019. If
Chapter 12 – Financial Statement Analysis
Internet Research
AP12-6
This case provides an opportunity for students to examine ratios calculated for a
Chapter 12 – Financial Statement Analysis
Written Communication
AP12-7
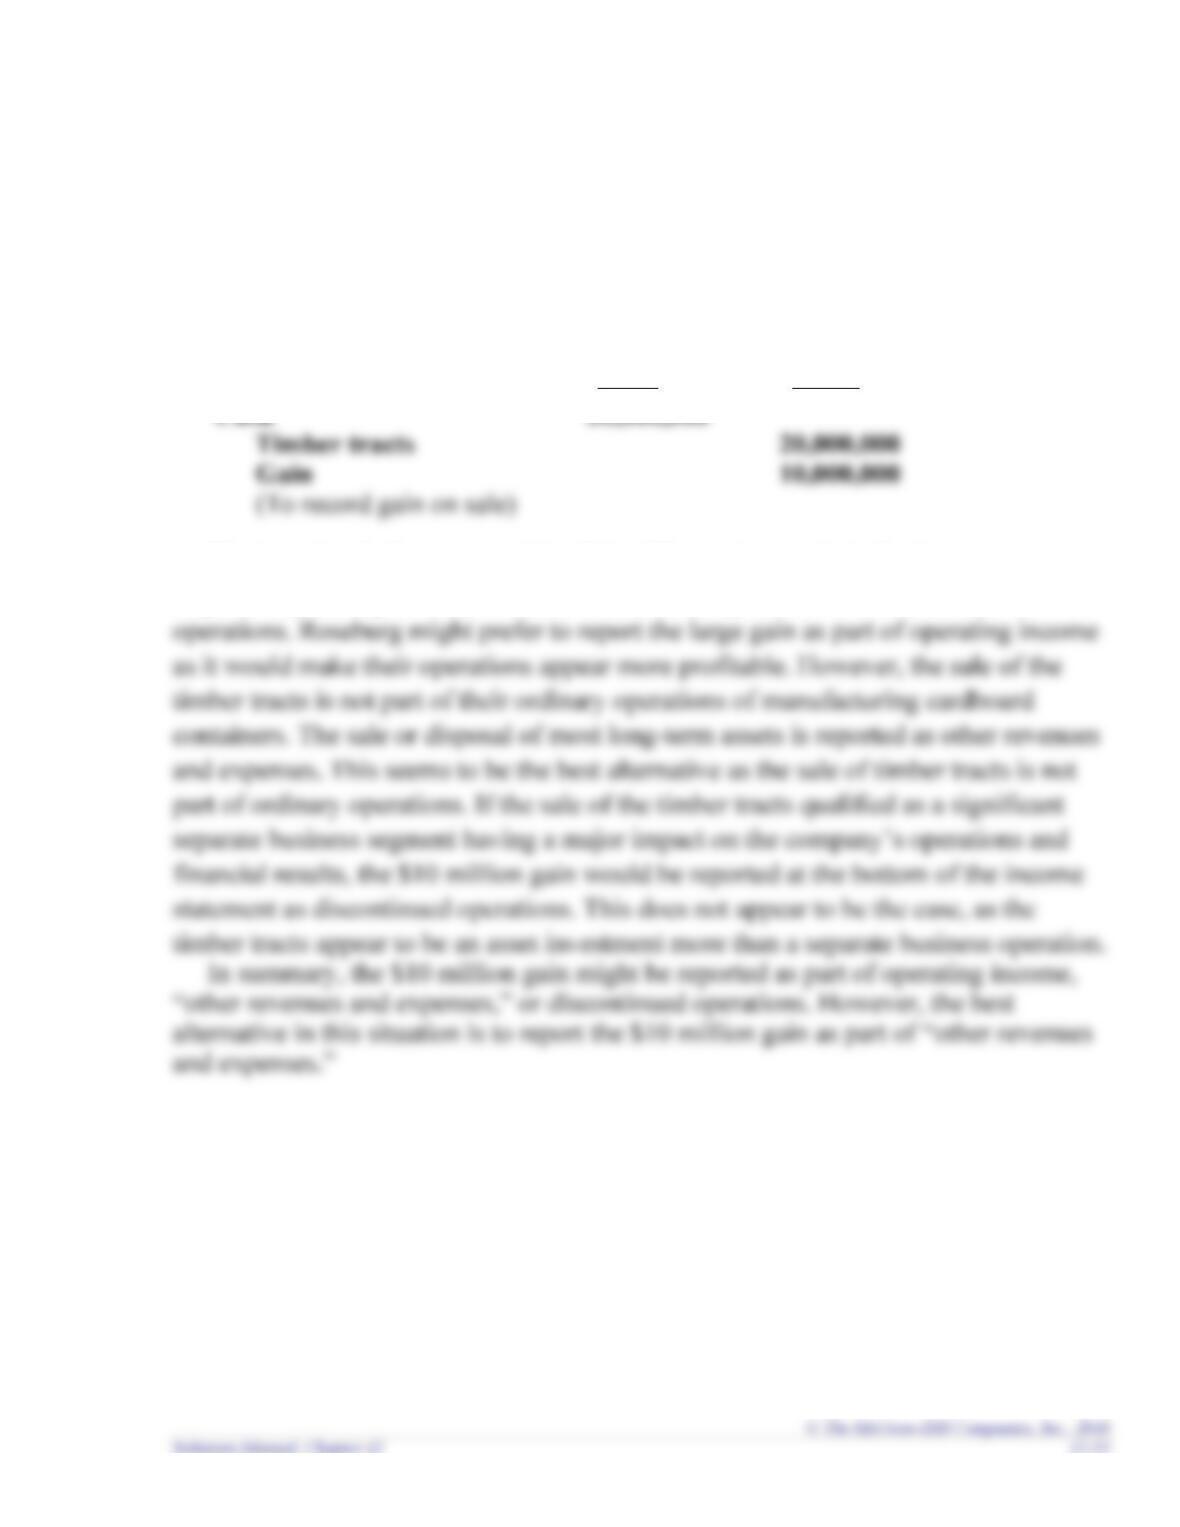
Roseburg Corporation sells timber tracts for $30 million in 2018 that were purchased
for $20 million in 2014. The $10 million gain on sale is recorded as:
Debit
Credit
The issue is whether to record the $10 million gain on sale in the income statement
as part of operating income, “other revenues and expenses,” or discontinued
Chapter 12 – Financial Statement Analysis
Earnings Management
AP 12-8
Requirement 1
(a) Aggressive
(b) Aggressive
(c) Aggressive
(d) Aggressive
Requirement 2
Requirement 3
Requirement 4