12–19 Ch. 12—Problems
PROBLEM 12-3
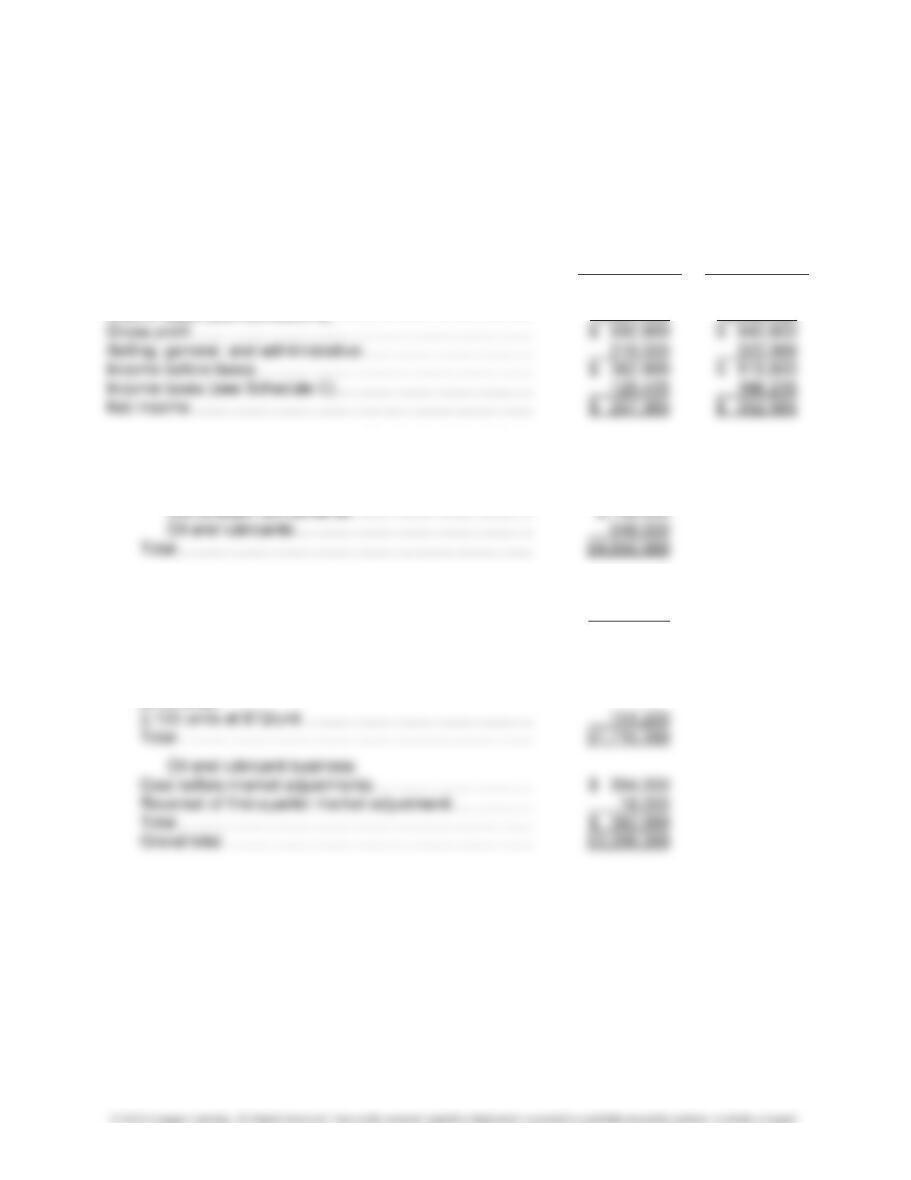
Radix, Inc.
Interim Income Statements
For the
For the Second Year-To-Date
Quarter Ended Ended
June 30, 2011 June 30, 2011
Net sales (see Schedule A) …………………………………………. $2,690,000 $4,050,000
Cost of sales (see Schedule B) …………………………………….. 2,097,200 3,209,200
Schedule A—Net Sales
First quarter of 2011 …………………………………………….. $1,360,000
Second quarter of 2011:
Schedule B—Cost of Sales
First quarter of 2011 …………………………………………….. $1,112,000
Second quarter of 2011:
Compressor business
Current-year costs ……………………………………………….. $1,564,000
2010 units:
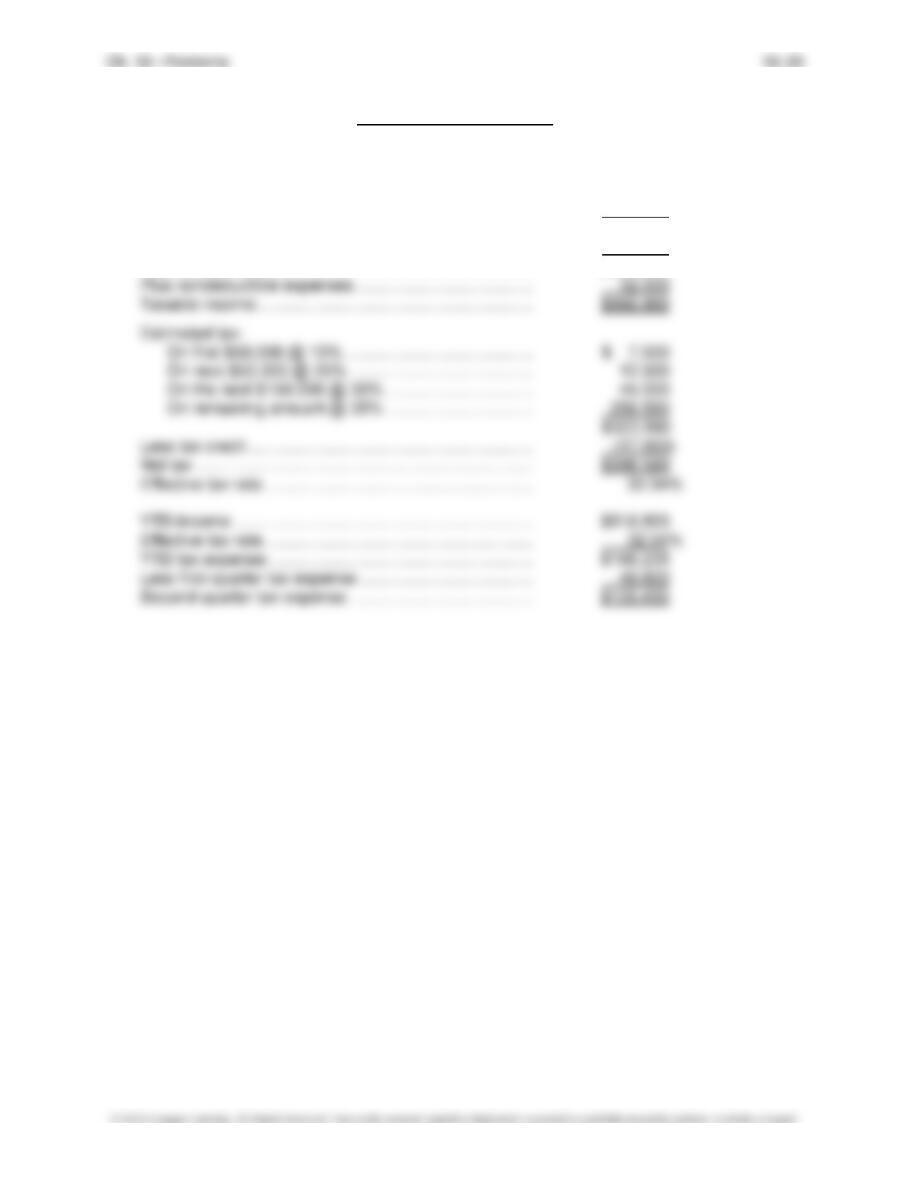
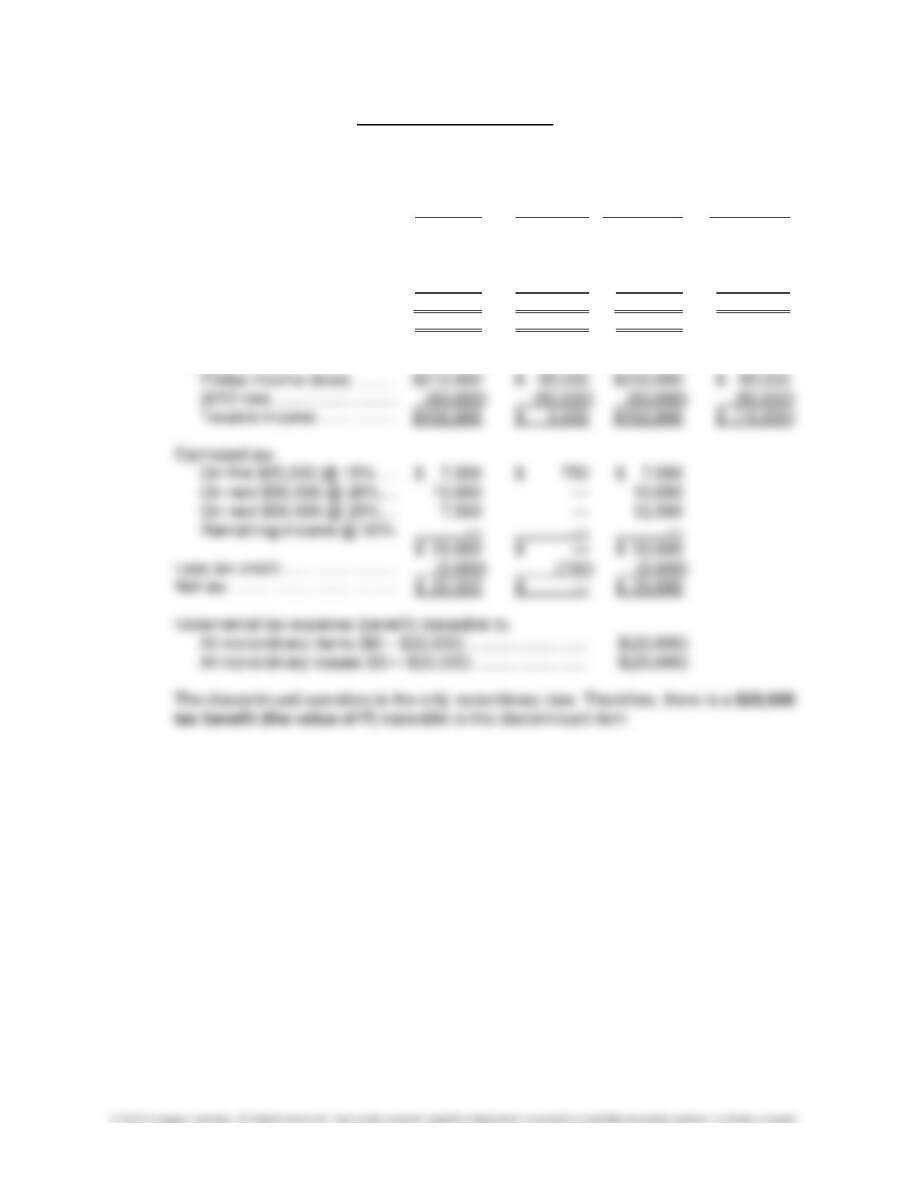
Problem 12-3, Concluded
Schedule C—Income Taxes
YTD income:
First quarter …………………………………………………… $136,000
Second quarter ………………………………………………. 382,800
Subtotal …………………………………………………………. $518,800
Projected income …………………………………………………. 438,000
Total annual income …………………………………………….. $956,800
PROBLEM 12-4
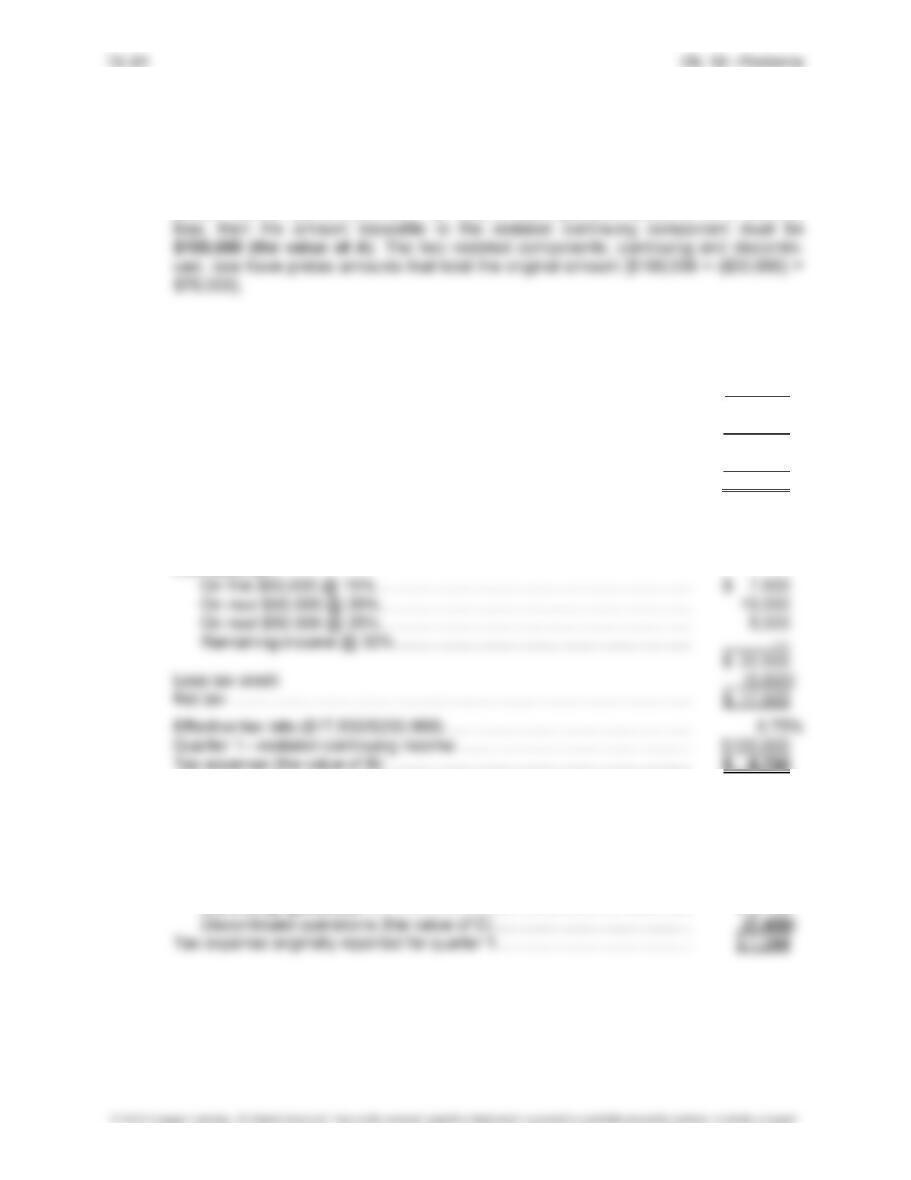
Item A The first quarter is being restated due to a decision to discontinue an operation in the
second quarter. Therefore, the original pretax income (loss) reported for the first quar-
ter must be allocated between continuing and discontinued operations. If the original
pretax income was $70,000 and the discontinued operation accounts for a $30,000
Item B Effective tax rate for quarter 1—restated income from continuing operations:
Quarter 1
Restated
YTD income (loss)—see item A above ……………………………………………. $100,000
Projected income (loss) ($60,000 + $40,000) …………………………………… 100,000*
Total annual income (loss) …………………………………………………………….. $200,000
Carryforward of 2013 loss ……………………………………………………………… (80,000)
Estimated annual taxable income …………………………………………………… $120,000
*The original amount included a $40,000 loss that is now part of discontinued
operations.
Estimated tax:
Item C The tax expense (benefit) traceable to the continuing and discontinued components of
restated quarter 1 must total the tax expense originally reported for quarter 1 as fol-
lows:
Tax expense (benefit) traceable to restated:
Continuing operations ……………………………………………………………… $ 8,750
Problem 12-4, Continued
Item D Tax expense for quarter 2 income from continuing operations:
Quarter 2
Quarter 1—restated income (loss) ………………………………………………….. $100,000
Quarter 2 income (loss) …………………………………………………………………. 50,000
YTD income (loss) ………………………………………………………………………… $150,000
Estimated tax:
On first $50,000 @ 15% …………………………………………………………… $ 7,500
On next $50,000 @ 20% ………………………………………………………….. 10,000
On next $50,000 @ 25% ………………………………………………………….. 7,500
Remaining income @ 30% ……………………………………………………….. —
$ 25,000
Less tax credit ……………………………………………………………………………… (5,000)
Item E YTD income (loss) from discontinued operations consists of:
Quarter 1—restated………………………………………………………………………. $ (30,000)
Quarter 2:
Operating loss ………………………………………………………………………… (60,000)
12–23 Ch. 12—Problems
Problem 12-4, Concluded
Item F Total Total
Excluding Excluding
Ordinary Total Nonordinary Nonordinary
Income
Income Loss Gain
Pretax income (loss):
Continuing …………………….. $210,000 $ 210,000 $210,000 $ 210,000
Discontinued ………………….. — (145,000) — (145,000)
Extraordinary …………………. — 20,000 20,000 —
Pretax income (loss) ……….. $210,000 $ 85,000 $230,000 $ 65,000
Tax expense (benefit) ……… $ 20,000 $ — $ 25,000
Taxable income:
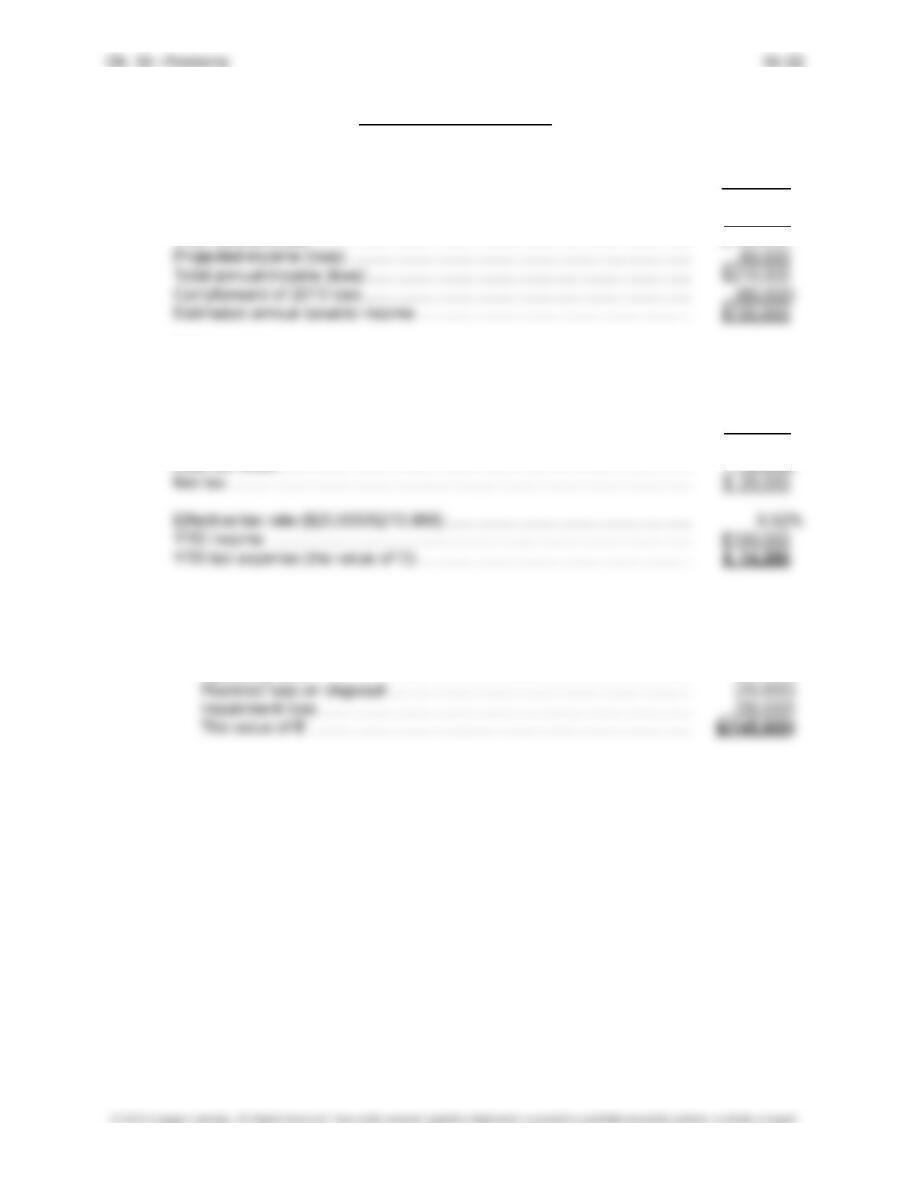
PROBLEM 12-5
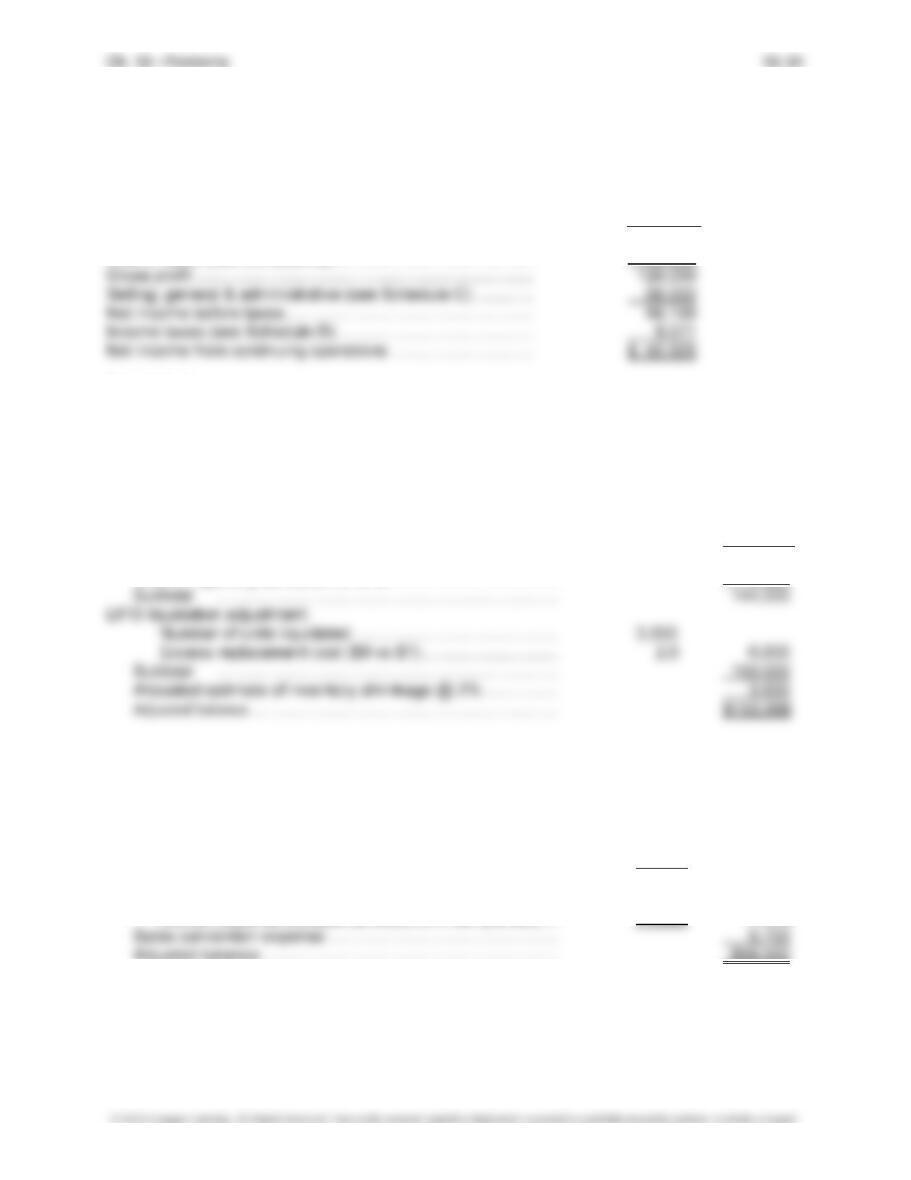
Corrected Income Statement
For the second Quarter of 2015
Sale revenue (see Schedule A) ……………………………………. $295,000
Less: Sales returns & allowances …………………………………. (14,000)
Net sales …………………………………………………………………… $281,100
Cost of sales (see Schedule B) …………………………………….. 153,000
Schedule A
This represents the $280,000 plus the $15,000 that should have been recorded as a correction
of error in the first quarter 2015 and 2014 income.
Schedule B
Cost of sales as reported …………………………………………….. $145,000
Less: Annual inventory shrinkage …………………………………. (10,000)
Subtotal ………………………………………………………………… 135,000
Error in reporting correction of error ………………………………. 9,000
Schedule C
Selling, general & administrative as reported ………………….. $41,000
Health care insurance expense:
Number of units liquidated ……………………………………… 12,600
Correct expense included (allocate of two quarters) …… (6,300) 6,300
Contract research costs:
Incorrect expense included …………………………………….. 21,000
Correct expense included (allocate of three quarters) … (7,000) 14,000
12–25 Ch. 12—Problems
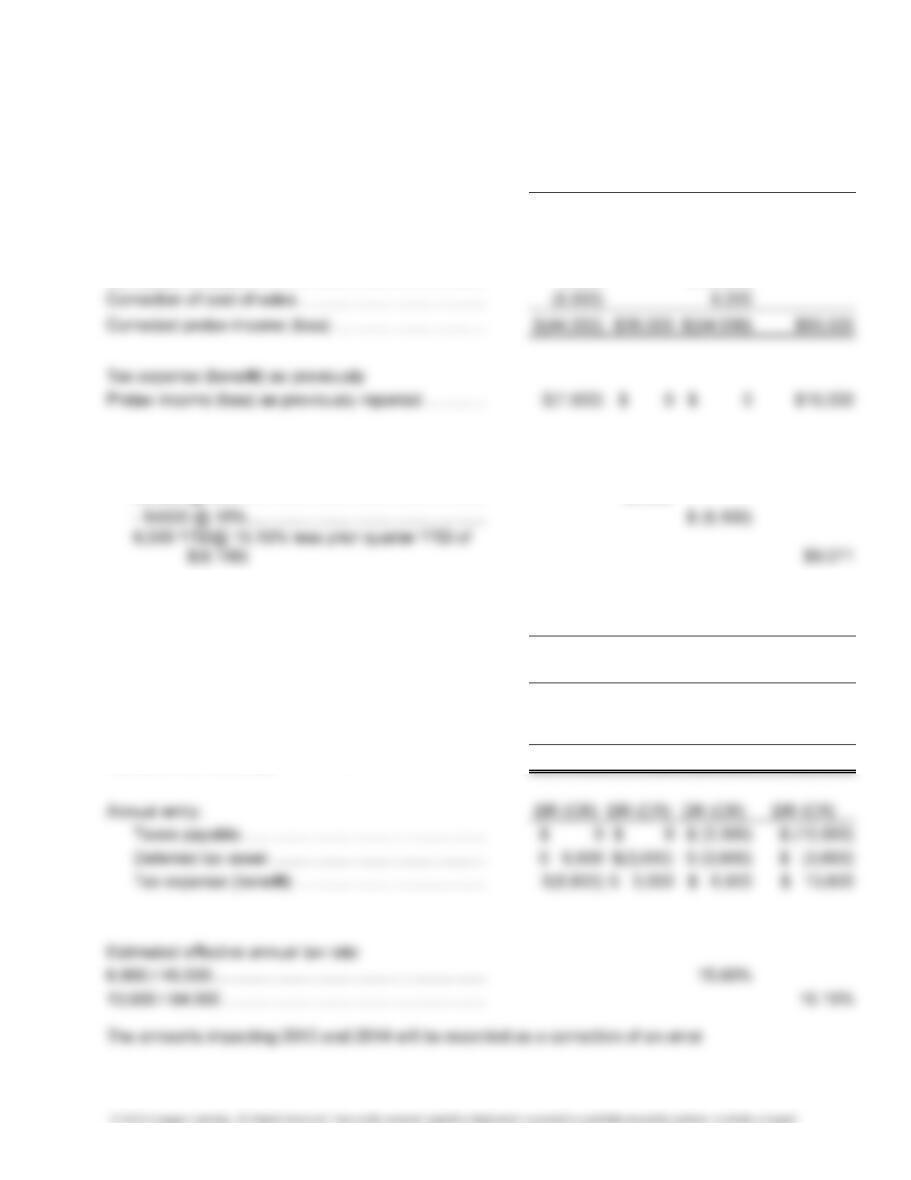
Schedule D
Quarter 1 Quarter 2
2013 2014 2015 2015
Pretax income (loss) as previously reported ………….. $(50,000) $20,000 $(48,000) $70,000
Corrections per schedule A through C ………………….. (10,000)
Correction of sales …………………………………………….. 15,000 (15,000)
Corrected tax expense (benefit):
44,000 @ 15% …………………………………………….. $(6,600)
20,000 @15% ……………………………………………… $3,000
Quarter 1 Quarter 2
2013 2014 2015 2015
YTD income (loss) ……………………………………………. $(44,000) $20,000 $(54,000) $6,000
Projected income (loss) …………………………………….. 100,000 78,000
Total annual income (loss) …………………………………. $(44,000) $ 20,000 46,000 84,000
Less net operating loss carryforward from 2013 ……..
(20,000) (24,000) (24,000)
Taxable income (Loss) ………………………………………. $(44,000) $0 $22,000 $60,000

PROBLEM 12-6
1. The identification of a segment is based on a “management approach,” which focuses on
how management organizes information about business components for purposes of mak-
2. Revenues traceable to segments generally do not agree with consolidated amounts for
several reasons. First, segmental revenues include intersegment sales or revenues that are
3. Public companies are required to disclose segmental data; therefore, such information is
publicly available to a wide variety of parties including one’s competitors. Obviously, the
more information that is publicly available allows competitors to have increased insight into
4. The determination as to whether or not a segment is considered reportable is based on
5. Interest expense on corporate bonds payable may be allocated to segments if such infor-
mation is considered by the chief operating decision maker of an entity for purposes of de-
6. Once again, it is important to remember that segmental net sales would include inter-

12–27 Ch. 12—Problems
Problem 12-6, Concluded
7. The statement of cash flows reports cash flows from operations, investing, and financing.
Certainly some, but not all, of the key information necessary to determine cash flows can
be derived from segmental reports. For example, depreciation expense for a segment could
be added back to the segment’s net profit or loss to give a rough measure of cash flows
PROBLEM 12-7
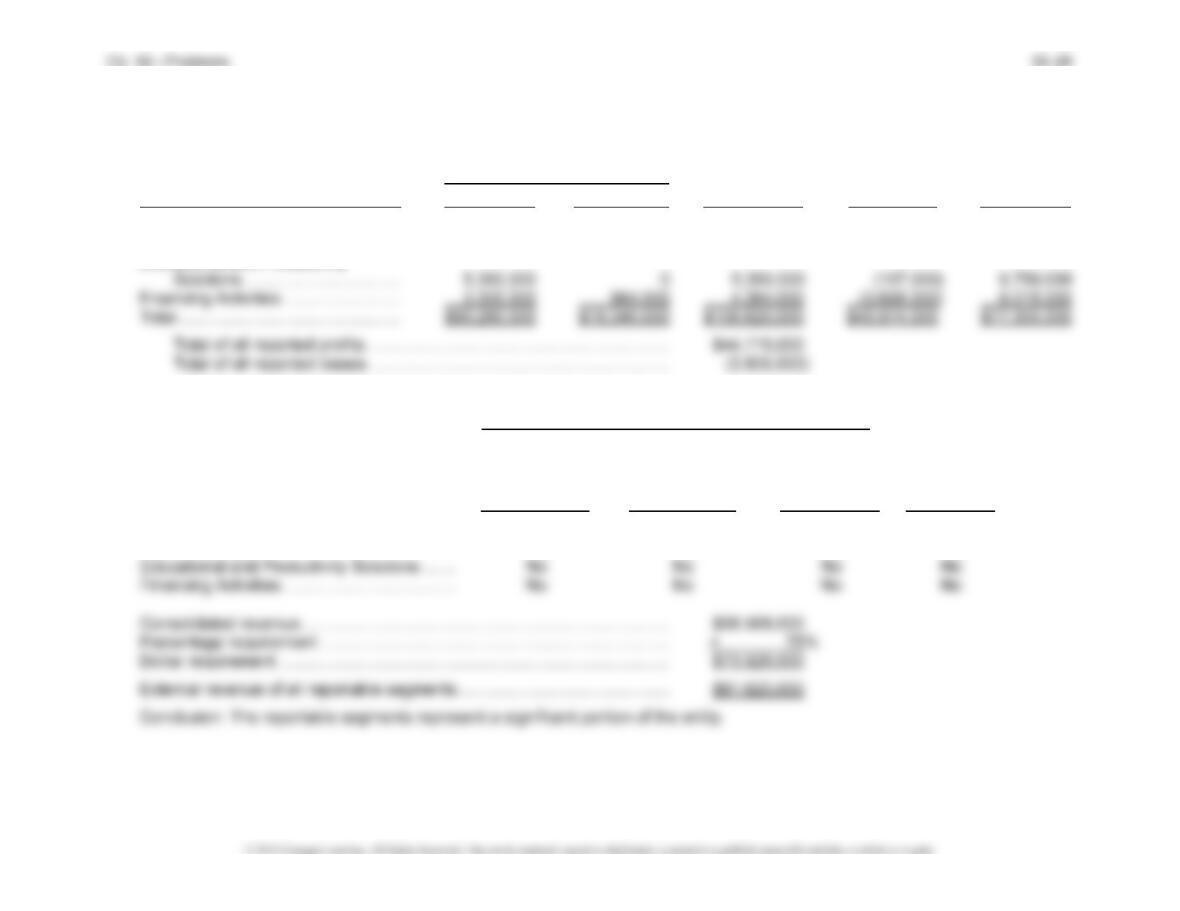
(1) Determination of whether segments are reportable:
Revenues Reported
Segment External Intersegment Total Profit (Loss) Assets
Semiconductors …………………………. $19,920,000 $ 3,970,000 $ 23,890,000 $ 90,000 $28,220,000
Control Devices …………………………. 61,700,000 11,411,000 73,111,000 44,689,000 36,320,000
Educational and Productivity
Is Segment’s
Absolute Value
Revenue 10% of Profit or Loss Assets 10%
or More of 10% or More of or More of Is Segment
$106,625,000? $44,779,000? $77,305,000? Reportable?
Semiconductors ……………………………………. Yes No Yes Yes
Control Devices ……………………………………. Yes Yes Yes Yes
Problem 12-7, Continued
(2) Presentation of segmental values:
Reportable Segments
Semiconductors Control Devices
Revenues from:
External customers ………………………………………….. $19,920,000 $61,700,000
Intersegment sales …………………………………………… 3,970,000 11,411,000
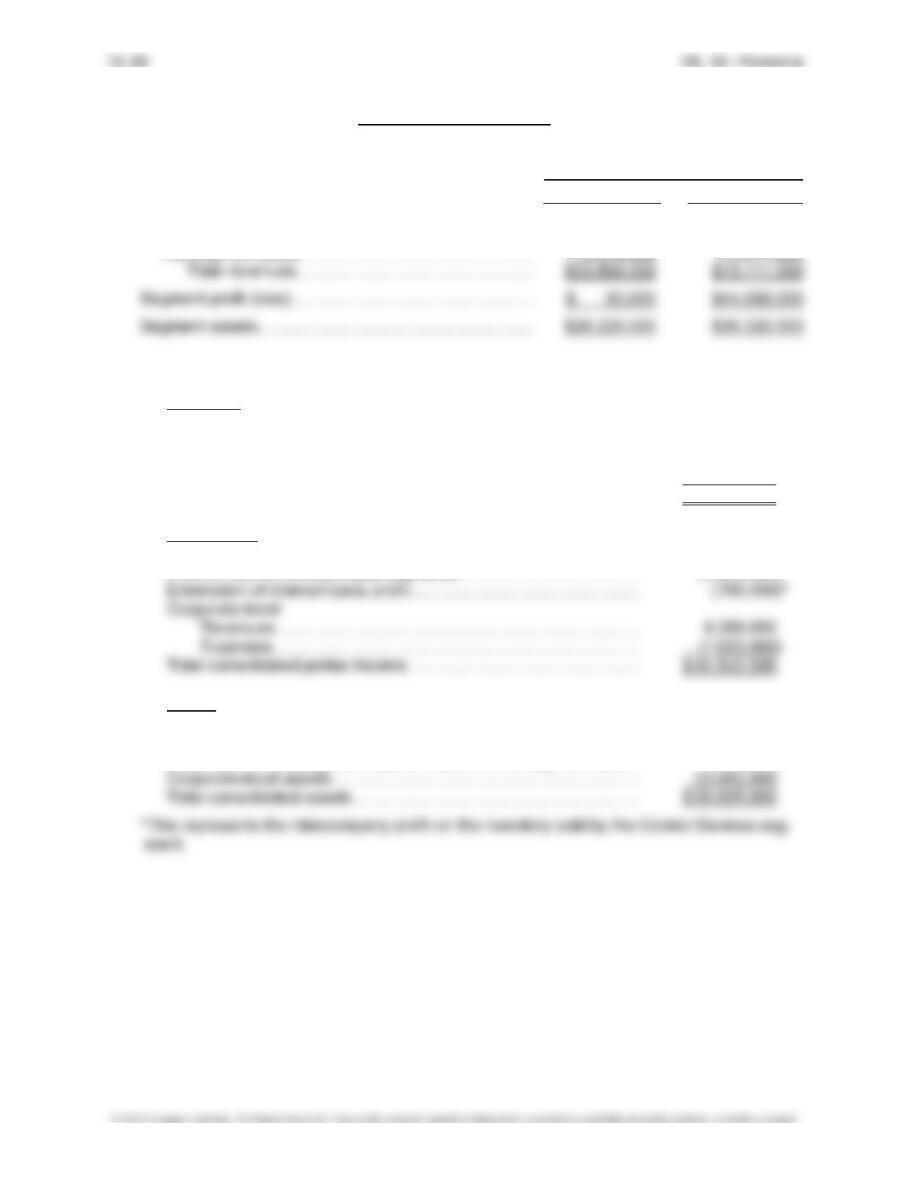
Reconciliation to Consolidated Revenue and Profit:
Revenues
Total revenues for reportable segments ………………………………….. $ 97,001,000
Revenues for nonreportable segments ……………………………………. 9,624,000
Elimination of intersegment revenue ………………………………………. (16,345,000)
Corporate-level revenues ……………………………………………………… 8,288,000
Total consolidated revenues ………………………………………………….. $ 98,568,000
Profit or loss
Total profit or loss for reportable segments ……………………………… $ 44,779,000
Profit or loss of nonreportable segments …………………………………. (3,805,000)
Assets
Total assets for reportable segments ……………………………………… $ 64,540,000
Assets of nonreportable segments …………………………………………. 12,765,000
Elimination of intersegment assets related to intersegment sales .. (700,000)*
Problem 12-7, Continued
Business Segment and Geographical Area Data
The company presented manufactures, develops, and sells a diverse range of electronic
equipment and parts. Its primary targets are consumer and industrial markets. The compa-
ny’s control device manufacturing is the company’s strongest line and together with its
Educational and Productivity Solutions produce educational and time-efficient devices. The
products are sold primarily through retailers and over the Internet.
The company’s Financing Activities segment holds a diversified portfolio of investments. It
also holds several royalty and licensing agreements with operating segments in several dif-
ferent countries.
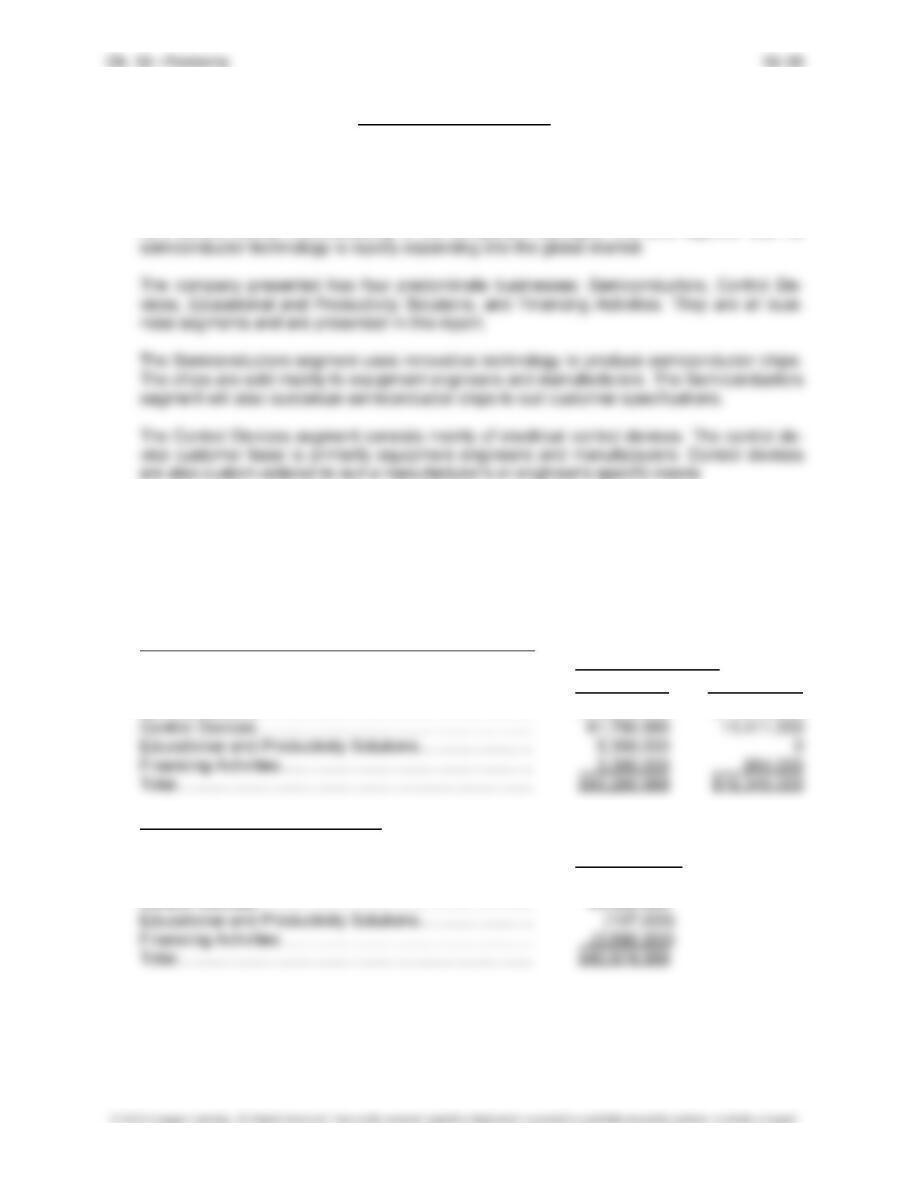
Business Segment Revenues (Including Intersegment)**
Revenues
External
Intersegment
Semiconductors …………………………………………………… $19,920,000 $ 3,970,000
Business Segment Profit (Loss)**
Reported Profit
(Loss)
Semiconductors …………………………………………………… $ 90,000
Problem 12-7, Continued
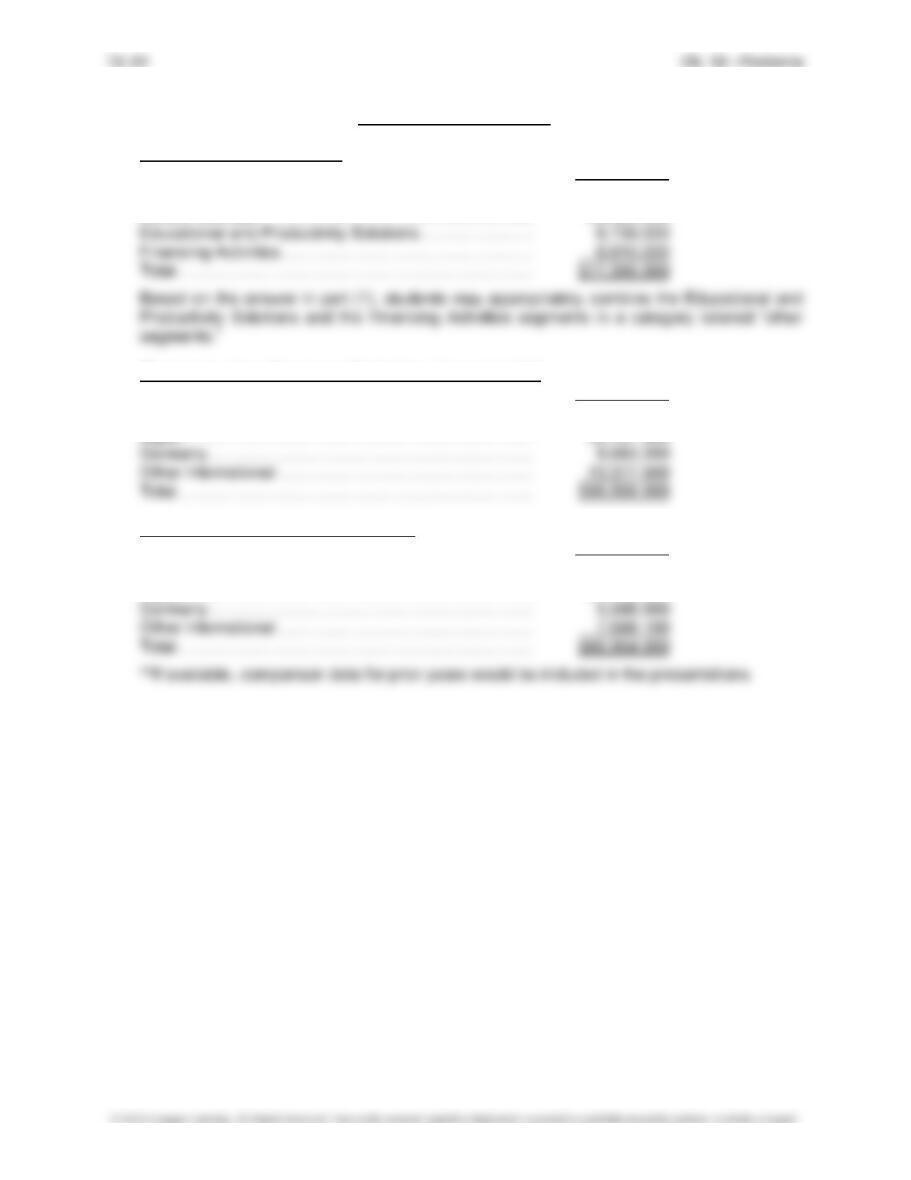
Business Segment Assets**
Assets
Semiconductors …………………………………………………… $28,220,000
Control Devices …………………………………………………… 36,320,000
Geographic Area Revenues (Excluding Intersegment)**
Revenues
United States ………………………………………………………. $40,950,000
Japan …………………………………………………………………. 36,157,300
Geographic Area Long-Lived Assets**
Assets
United States ………………………………………………………. $33,377,000
Japan …………………………………………………………………. 20,332,900
Problem 12-7, Concluded
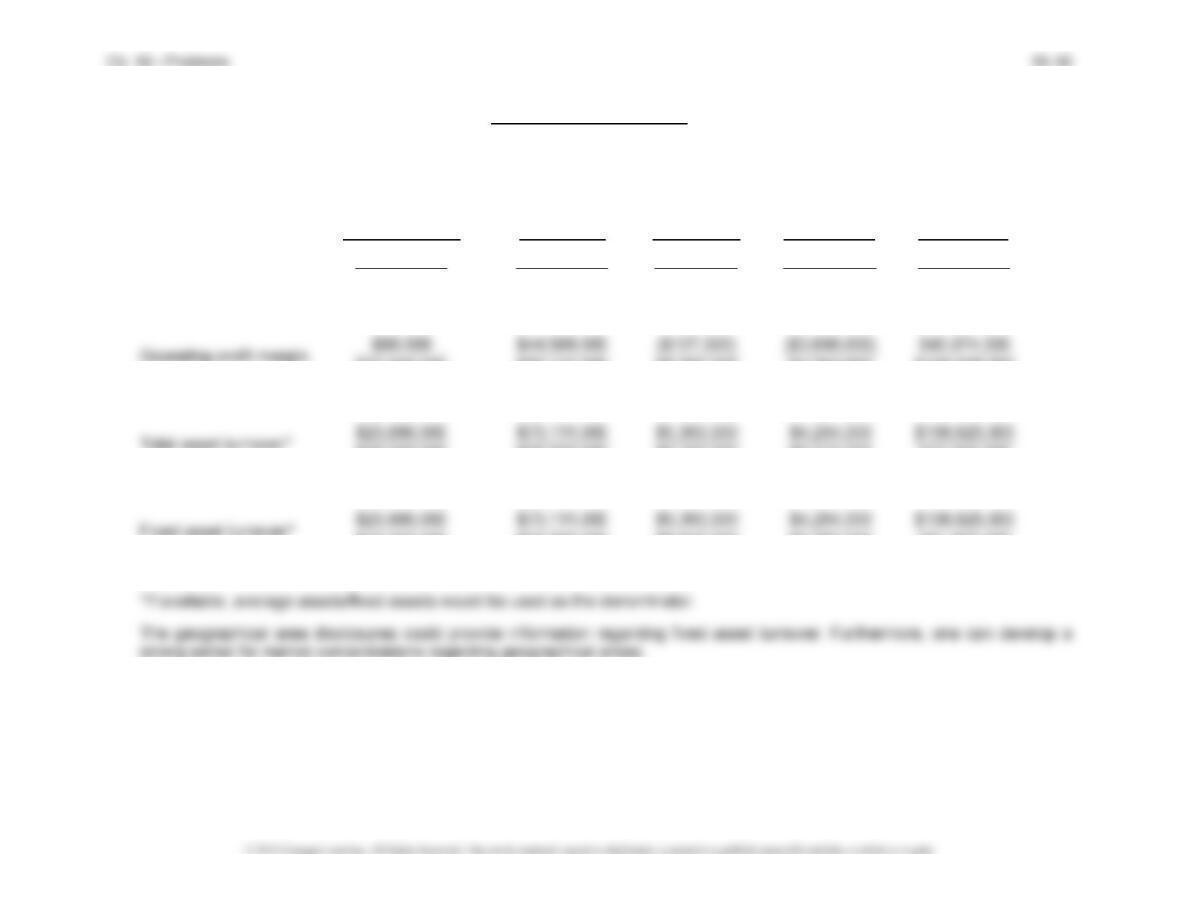
(3) Several ratios that may be helpful in analyzing segmental information are as follows:
Educational
and
Control Productivity Financing
Semiconductors Devices Solutions Activities Total
Return on assets* 0$28,220,00
$90,000 0$36,320,00
0$44,689,00 $6,750,000
($107,000) $6,015,000
0)($3,698,00 0$77,305,00
0$40,974,00
0.32% 123.04% –1.59% –61.48% 53.00%
0.38% 61.12% –2.00% –86.73% 38.43%
0.85 2.01 0.79 0.71 1.38
1.31 3.05 0.97 1.13 2.07
PROBLEM 12-8
(1) Presentation of segmental values:
Reportable Segments All Other
A B D Segments Total
Revenues from:
External customers …………… $ 4,023,500 $ 2,556,570 $ 5,566,725 $ 1,374,500 $13,521,295
Intersegment sales ……………. 192,430 618,525 810,955
Interest revenue ……………………. 48,000 10,000 60,000 12,000 130,000
Gain on intersegment sale of
(2) Reconciliation of Significant Items to Consolidated Amounts
Revenues
Total revenues for reportable segments …………………………………………………. $13,175,750
Problem 12-8, Concluded
Profit or Loss
Total profit or loss for reportable segments …………………………………………….. $ 6,043,745
Profit or loss on nonreportable segments
($1,386,500 – $1,220,600 – $123,395) …………………………………………….. 42,505
Elimination of intersegment profits:
Assets
Total assets for reportable segments …………………………………………………….. $17,862,000
Assets of nonreportable segments ………………………………………………………… 3,717,000
Elimination of intersegment assets related to intersegment sales ………………. (102,107)d
Corporate-level assets ($115,000 + $1,737,000) …………………………………….. 1,852,000
Total consolidated assets …………………………………………………………………….. $23,328,893
a
Segment B should depreciate the original net book value of $200,000 over 10 years rather
than the new selling price of $300,000 over 10 years. Therefore, depreciation expense
should be $20,000 per year versus $30,000. The gain on the sale of $100,000 ($300,000 –
$200,000) is included in Segment A’s total revenue.
c
Segment B recorded a cost of $144,000 on the sale to Segment C. Segment C in turn rec-
orded 75% of B’s selling price, or $144,323 (75% × $192,430), as cost of sales. The total
cost recorded was $288,323 ($144,000 + $144,323). However, the actual cost of goods
sold was 75% of B’s cost of $144,000, or $108,000. Therefore, $180,323 ($288,323 –
$108,000) of cost should be eliminated along with the $618,525 cost of the goods pur-

PROBLEM 12-9
Date
To: Bank Lending Officer
From: Student Accountant
Re: Raymack Manufacturing – Questions related to segmental reporting
In regards to the above referenced item, please accept the following responses to your ques-
tions.
1. The decision to report these areas as two segments may be due to a number of factors.
Although both segments earn revenues and generate expenses, their operating results
may be reviewed by separate chief operating decision makers for organizational
2. Often the total of segmental net sales exceed consolidated net sales because segmental
3. A likely explanation as to why consolidated pretax income is greater than segmental
pretax income is due to the fact that there are certain corporate sources of income that
are not allocated to segments. For example, corporate level gains and losses on cash
4. Tax expense or benefit is normally viewed as a consolidated component of income and
is not allocated to segments. However, the effective tax rate reported in consolidated
5. On an entity wide basis, the total of all long-lived assets must be reported by
geographical location whether or not they have been allocated to segments. The assets

6. In addition to reporting pretax operating income (loss), segments are required to report
segmental assets. This allows for a calculation of return on assets. However, segments
7. Both Germany and Spain are considered to be “European Countries”. The allocation of
sales to geographic segments is generally based on where the customer is or where the
8. Obviously a number of variables can be measured in terms of growth. It would seem that
growth in revenues, operating profit (loss), and identifiable assets would all be important
variables for purposes of measuring growth. Perhaps even as important would be to re-