Problem 12–16 (continued)
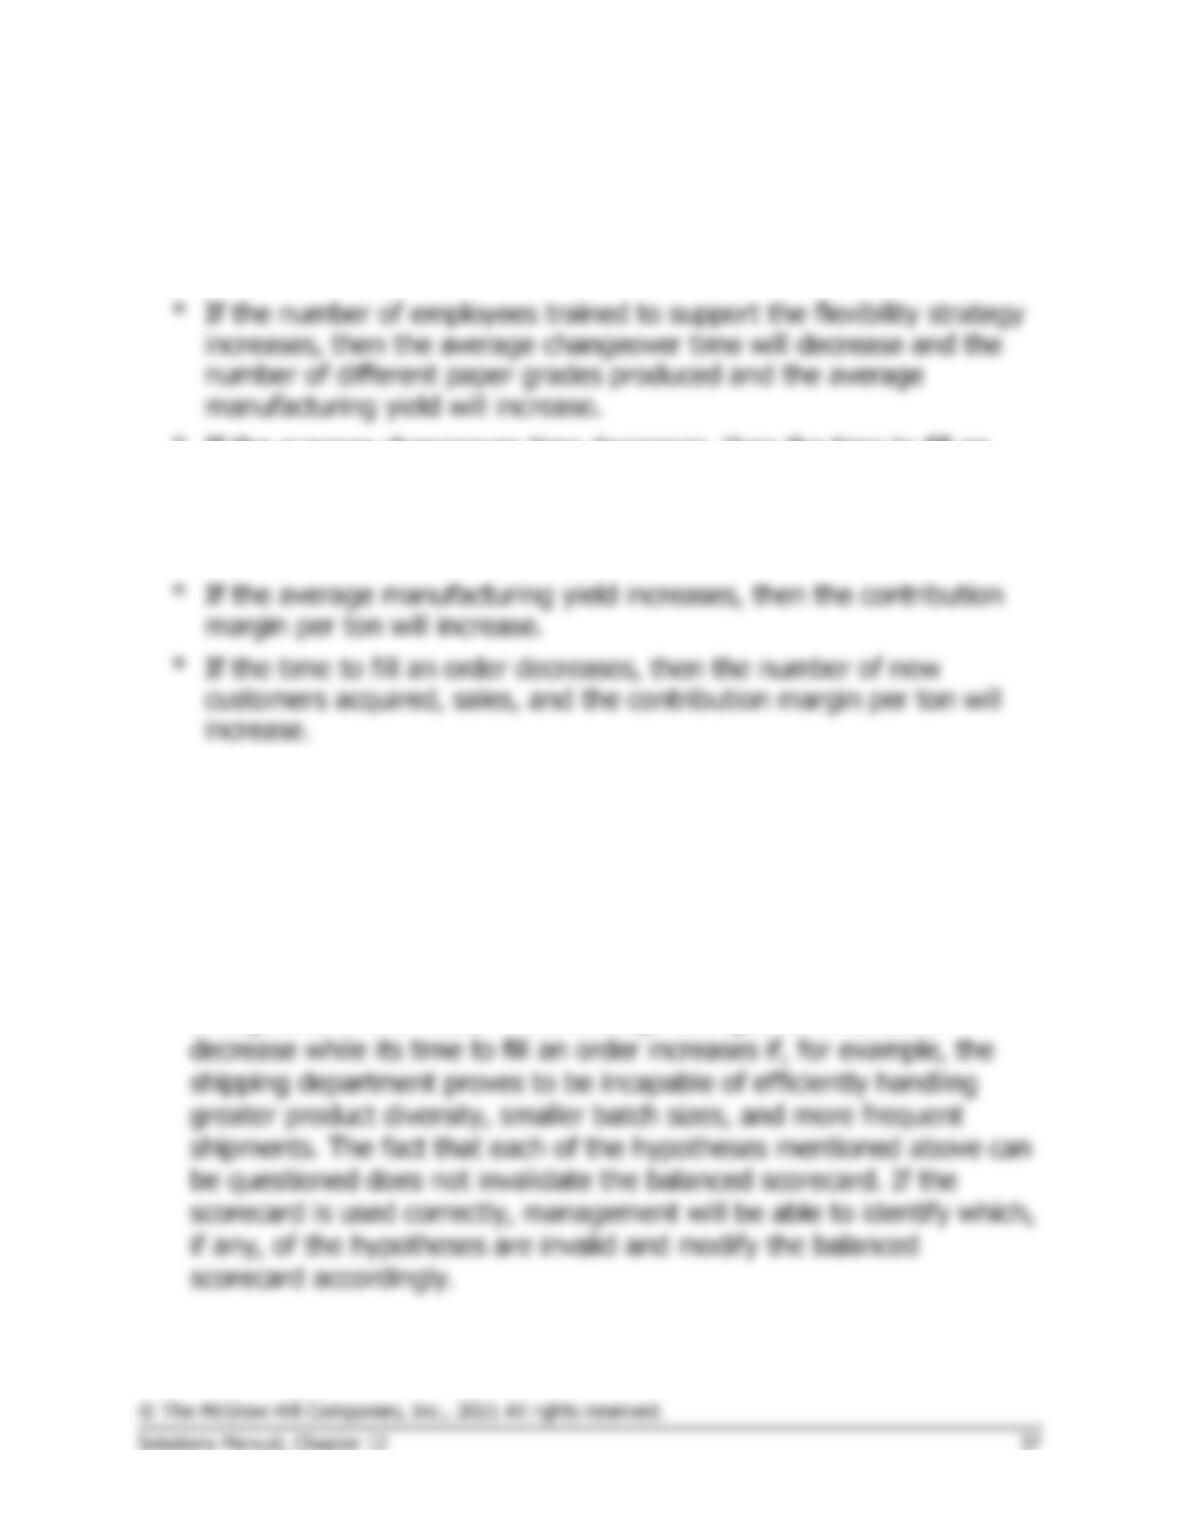
4. The hypotheses underlying the balanced scorecard are indicated by the
arrows in the diagram. Reading from the bottom of the balanced
scorecard, the hypotheses are:
° If the average changeover time decreases, then the time to fill an
order will decrease.
° If the number of different paper grades produced increases, then the
customer satisfaction with breadth of product offerings will increase.
° If the customer satisfaction with breadth of product offerings
increases, then the number of new customers acquired, sales, and
the contribution margin per ton will increase.
° If the number of new customers acquired increases, then sales will
increase.
Each of these hypotheses can be questioned. For example, the time to
fill an order is a function of additional factors above and beyond
changeover times. Thus, MPC’s average changeover time could
Problem 12-17 (60 minutes)
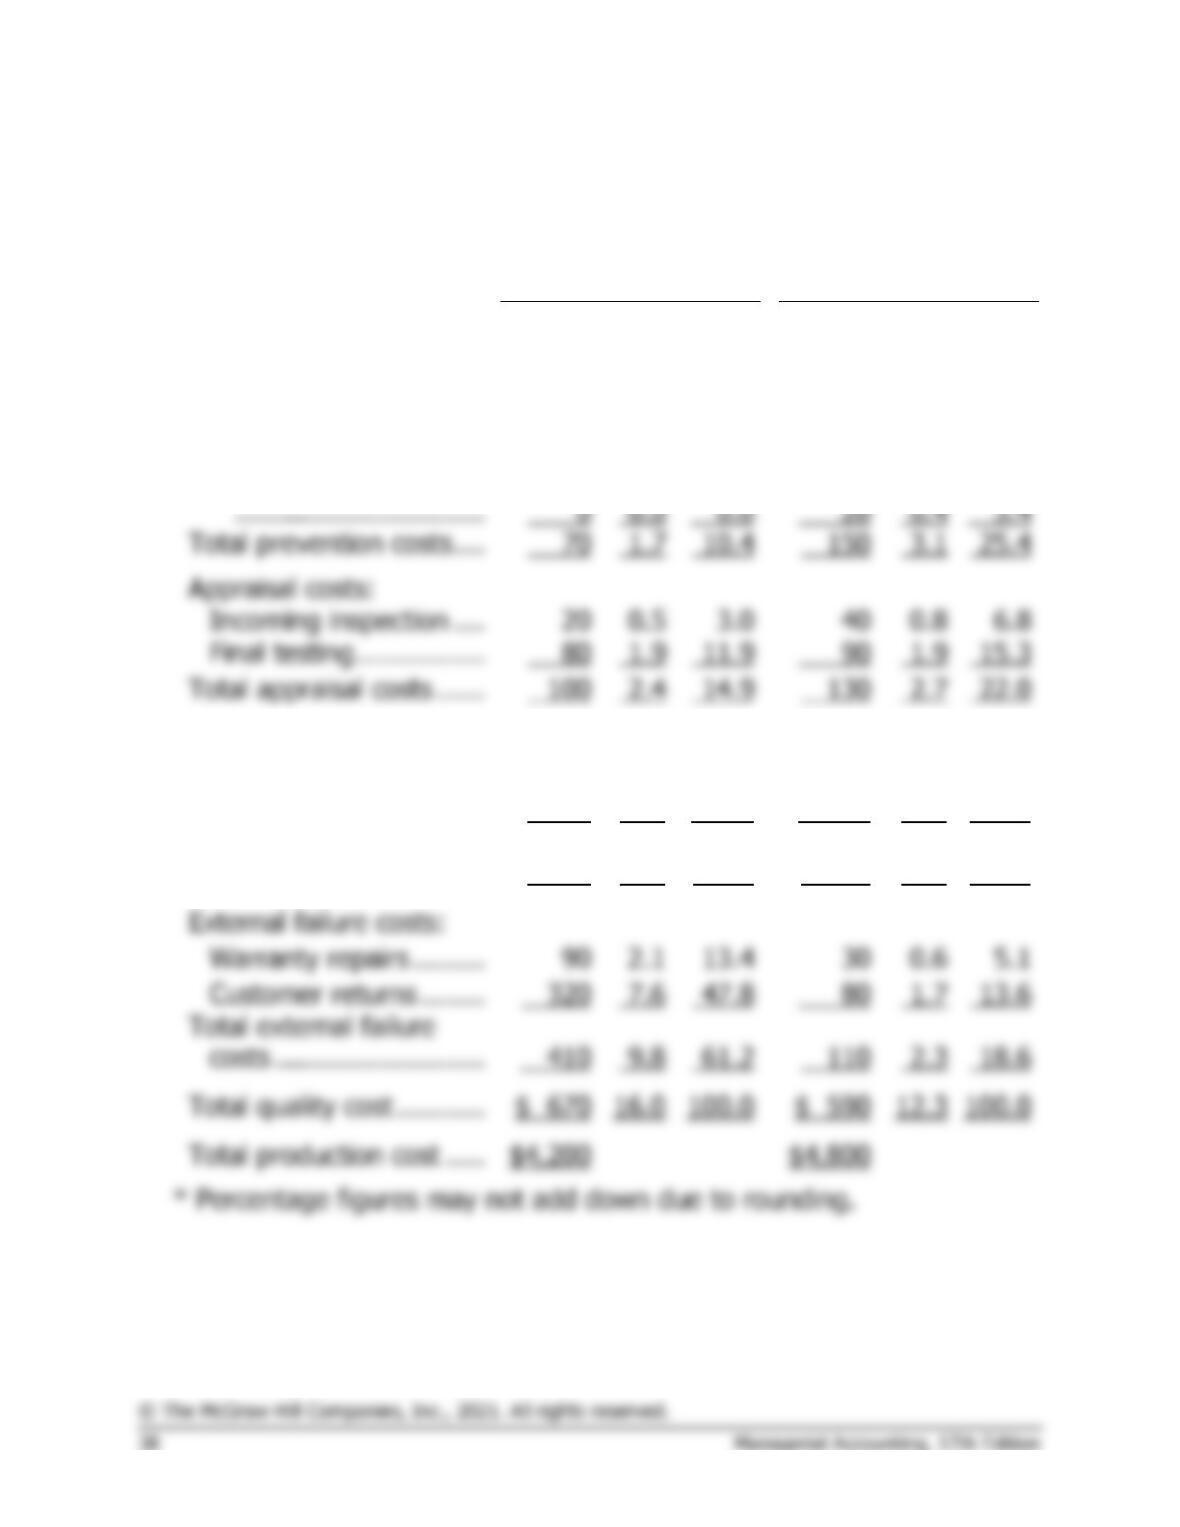
1. An analysis of the company’s quality cost report is presented below
(dollar amounts are in thousands):
Last Year
This Year
Amount
Percent*
Amount
Percent*
Prevention costs:
Machine maintenance ..
$ 70
1.7
10.4
$ 120
2.5
20.3
Training suppliers ……..
0
0.0
0.0
10
0.2
1.7
Quality
circles ………………….
0.0
0.0
20
0.4
Total prevention costs ….
70
1.7
10.4
150
3.1
25.4
Appraisal costs:
Internal failure costs:
Rework …………………..
50
1.2
7.5
130
2.7
22.0
Scrap …………………….
40
1.0
6.0
70
1.5
11.9
Total internal failure
costs ……………………..
90
2.1
13.4
200
4.2
33.9
External failure costs:
Warranty repairs ………
90
2.1
13.4
30
0.6
5.1
Total external failure
61.2
110
2.3
18.6
Total quality cost ………..
$ 590
Problem 12–17 (continued)
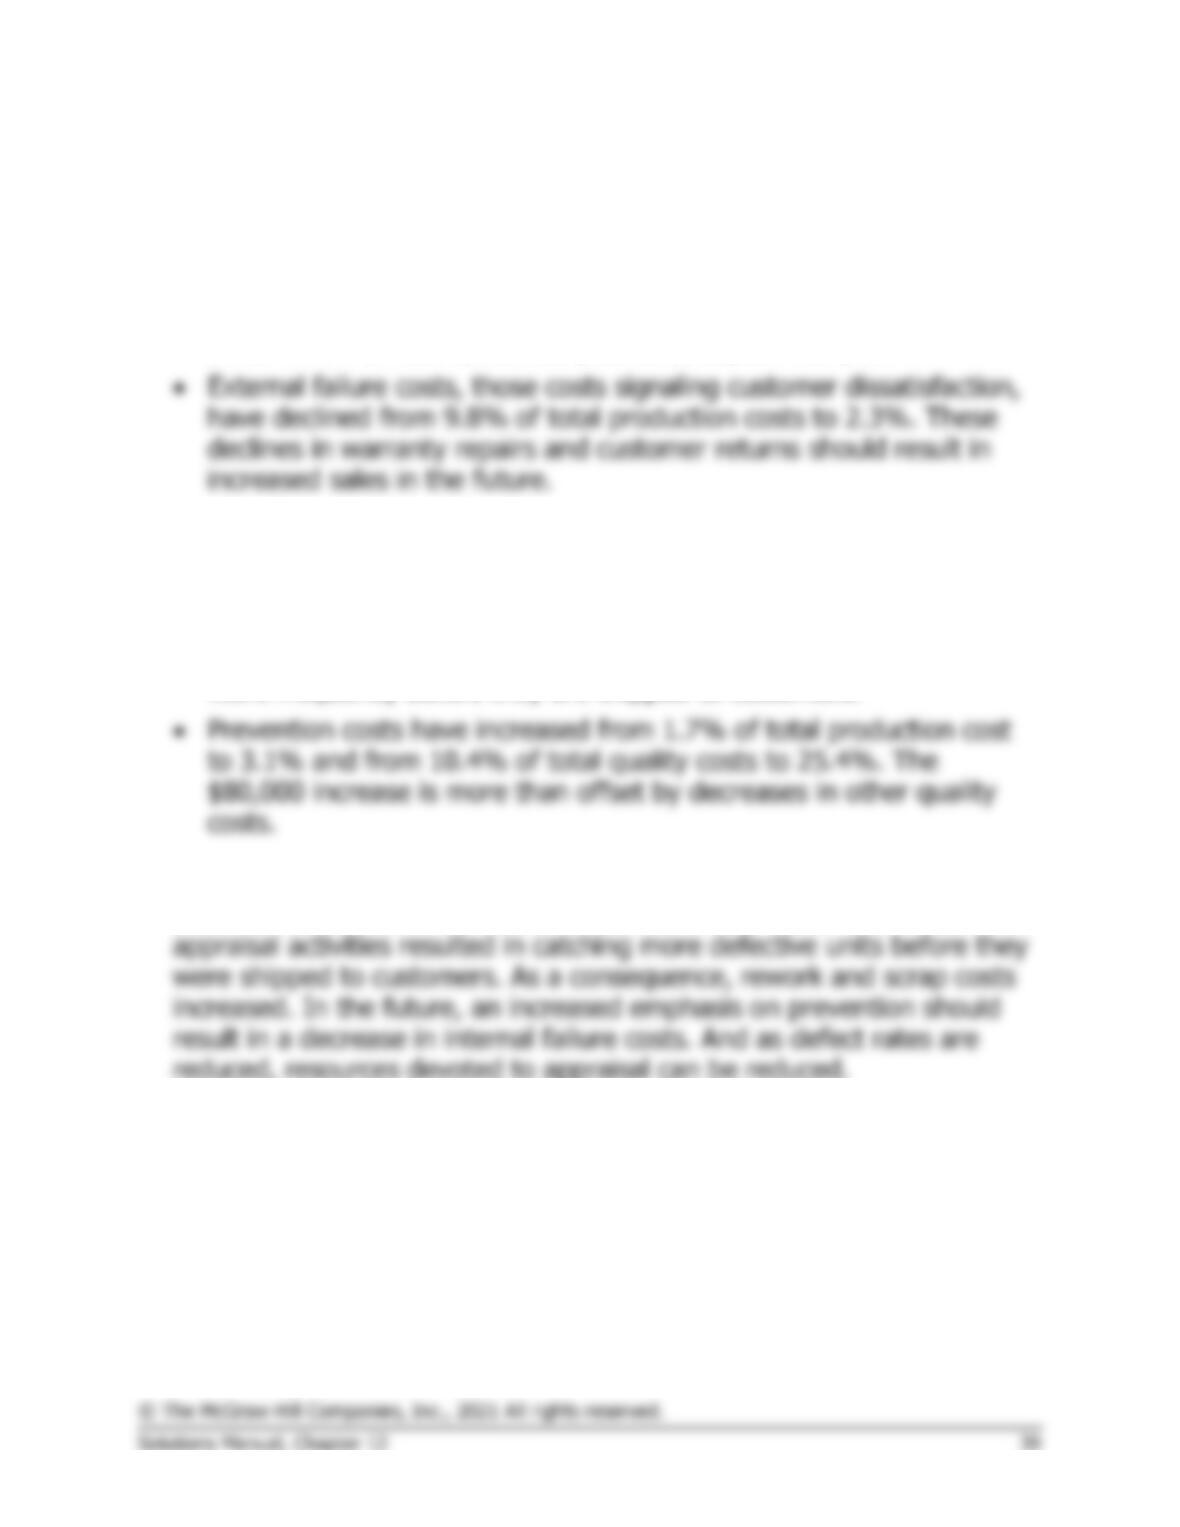
From the above analysis it would appear that Mercury, Inc.’s program has
been successful.
• Total quality costs have declined from 16.0% to 12.3% as a
percentage of total production cost. In dollar amount, total quality
costs went from $670,000 last year to $590,000 this year.
• Appraisal costs have increased from 2.4% to 2.7% of total
production cost.
• Internal failure costs have increased from 2.1% to 4.2% of
production costs. This increase has probably resulted from the
increase in appraisal activities. Defective units are now being spotted
2. The initial effect of emphasizing prevention and appraisal was to reduce
external failure costs and increase internal failure costs. The increase in
3. To measure the cost of not implementing the quality program,
management could assume that sales and market share would continue
to decline and then calculate the lost profit. Or, management might
assume that the company will have to cut its prices to hang on to its
market share. The impact on profits of lowering prices could be
estimated.
Problem 12-18 (45 minutes)
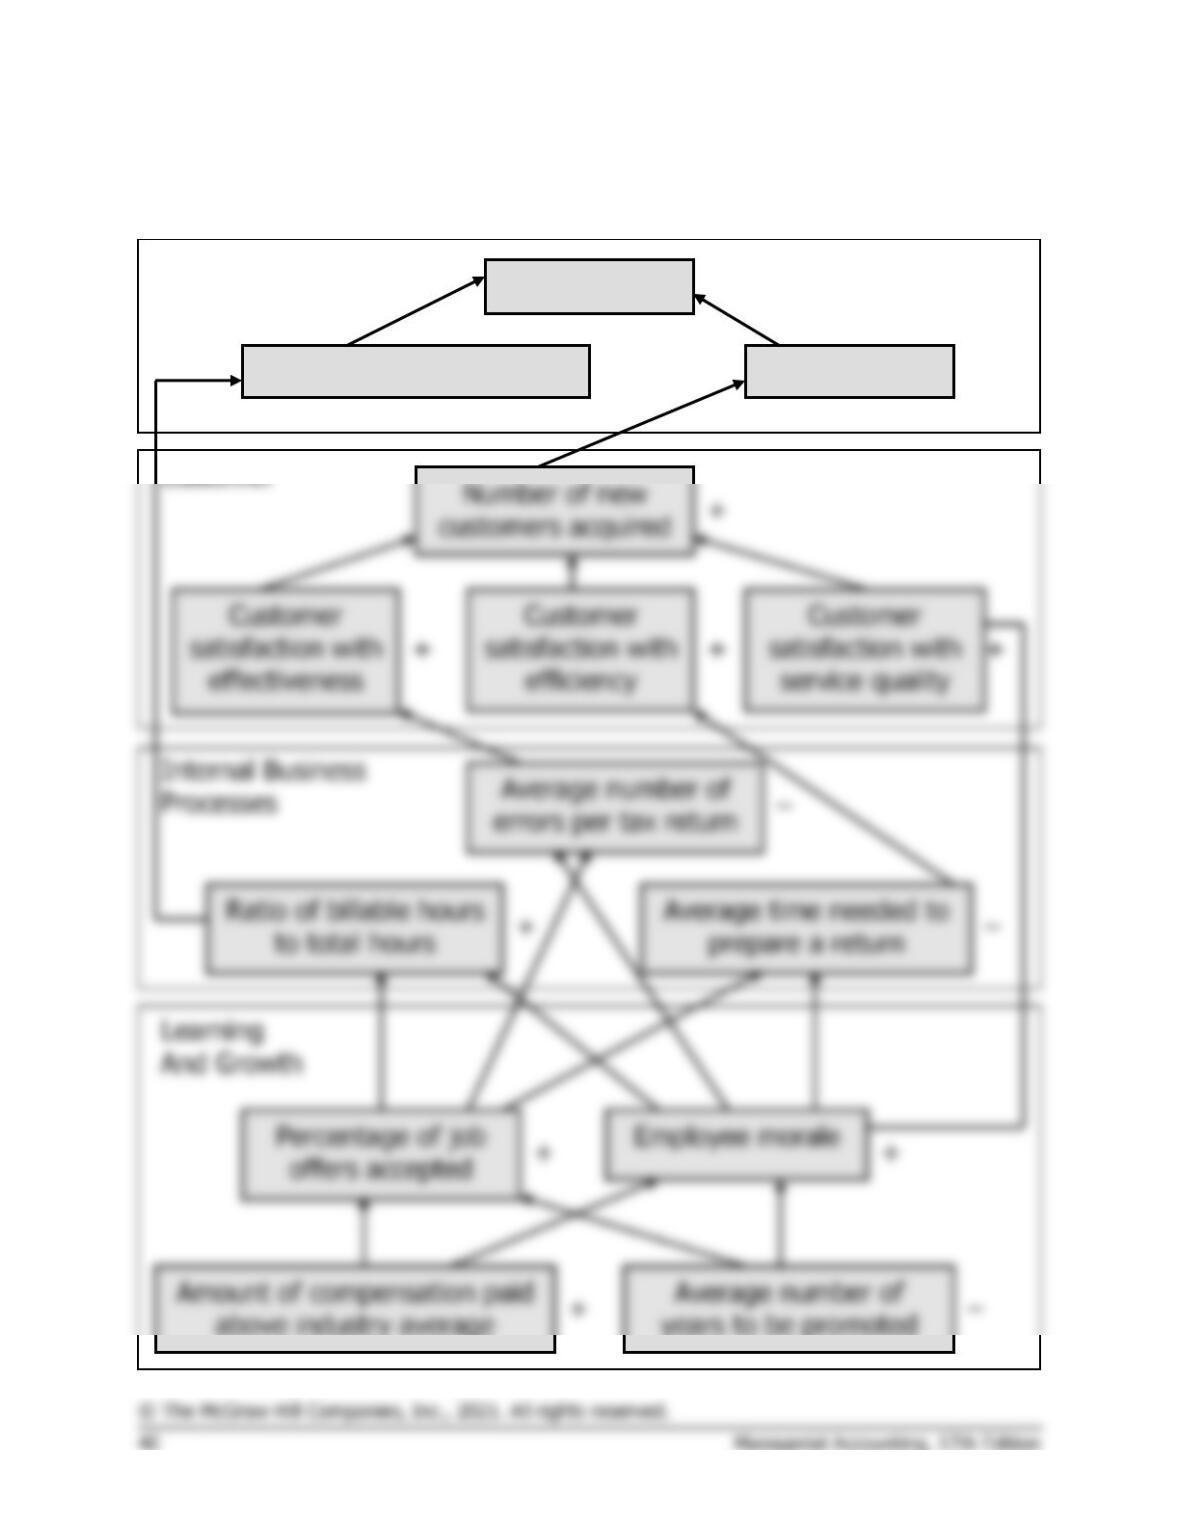
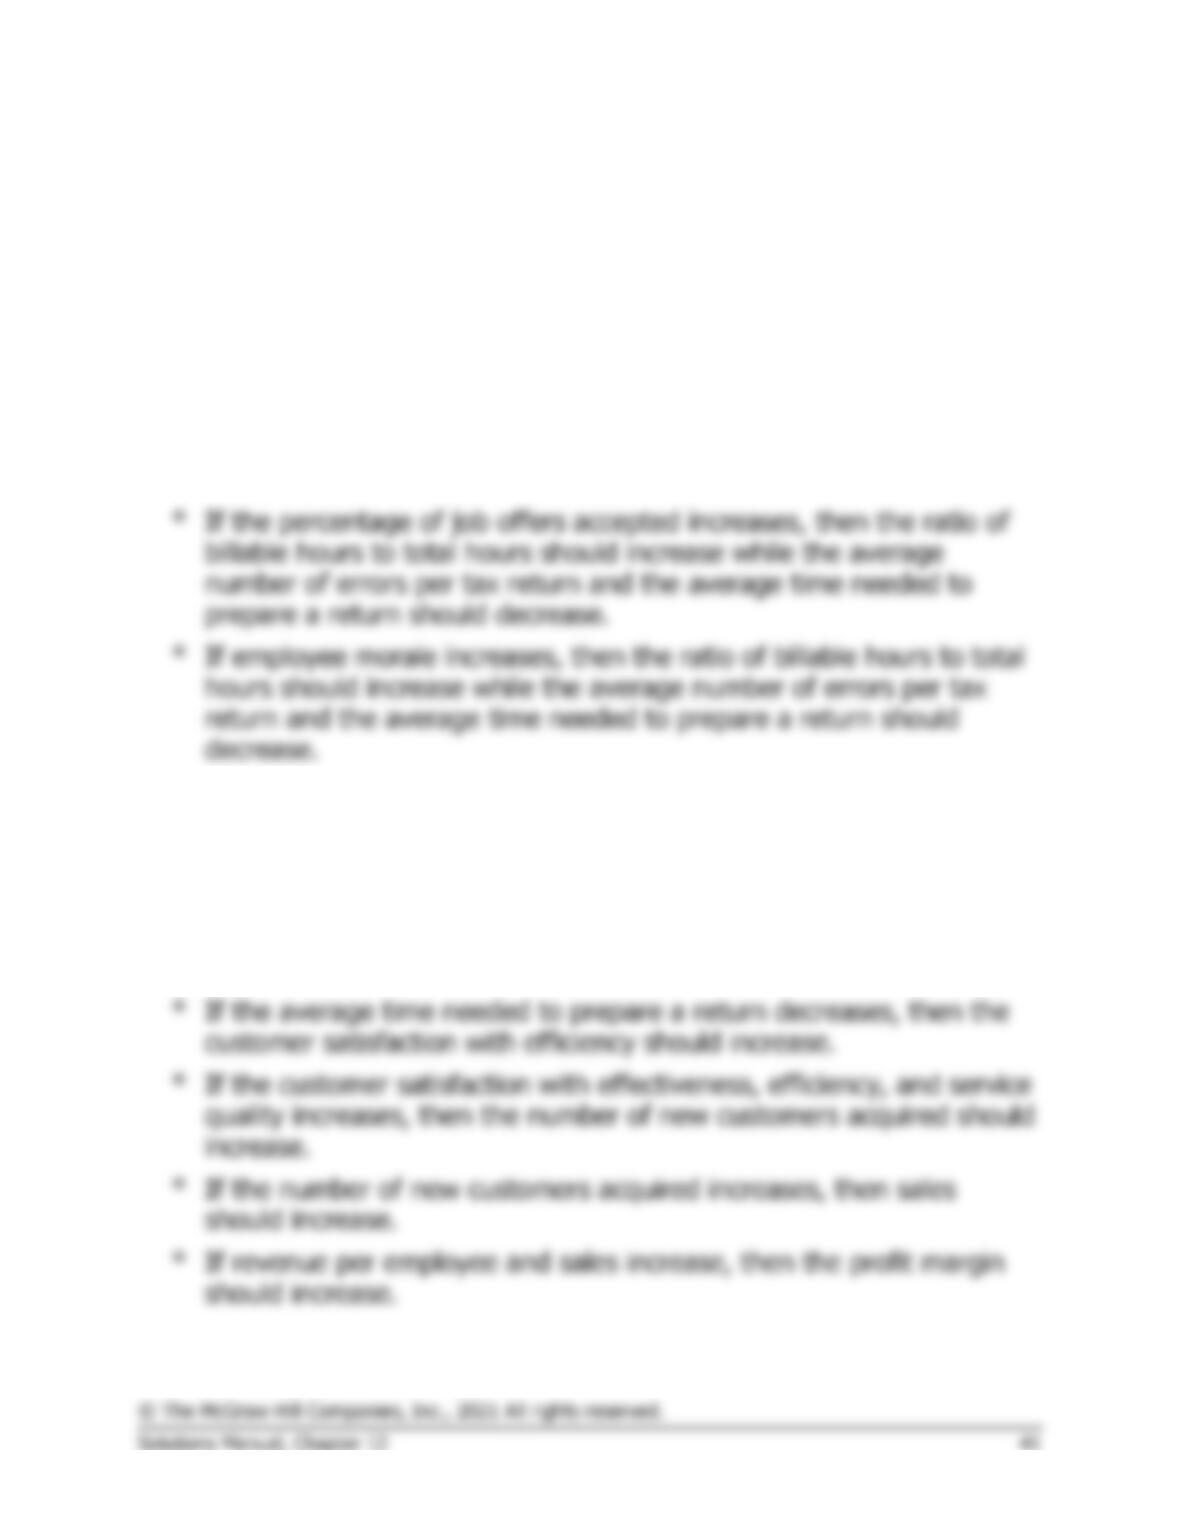
1. Students’ answers may differ in some details from this solution.
Customer
+
+
Revenue per employee
Sales
Profit margin
Financial
+
+
+
Problem 12-18 (continued)
2. The hypotheses underlying the balanced scorecard are indicated by the
arrows in the diagram. Reading from the bottom of the balanced
scorecard, the hypotheses are:
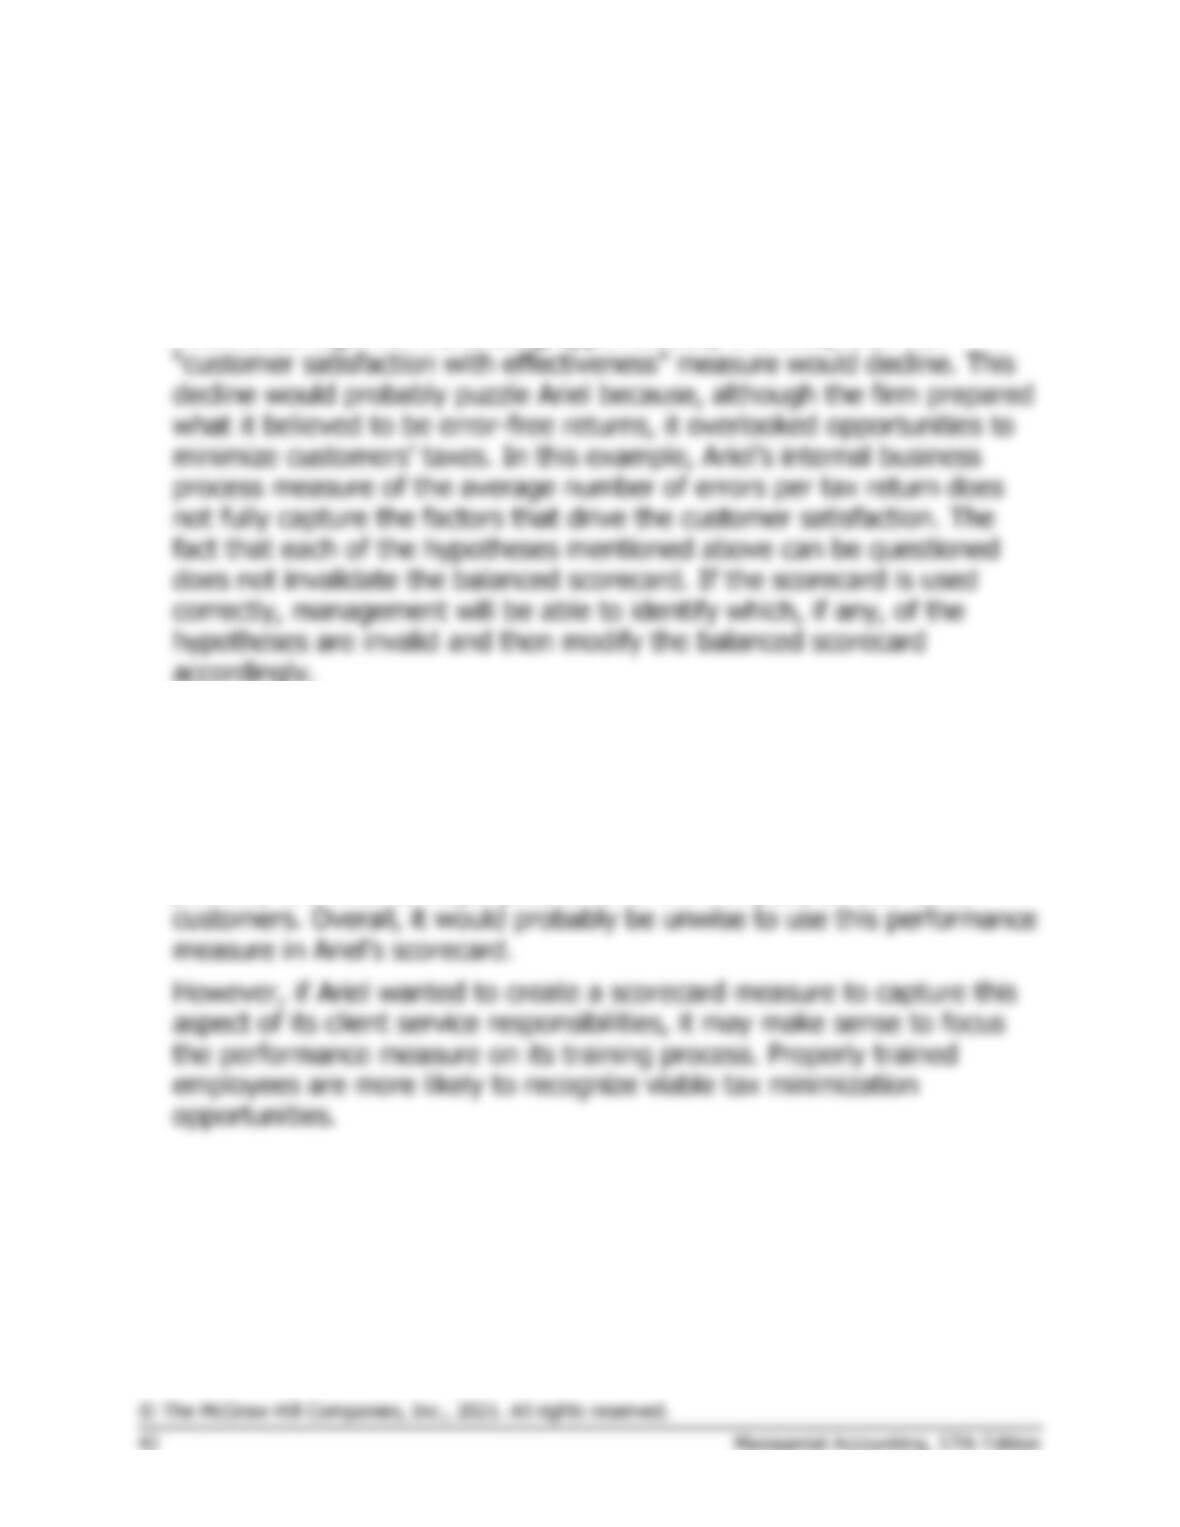
° If the amount of compensation paid above the industry average
increases, then the percentage of job offers accepted and the level of
employee morale will increase.
° If the average number of years to be promoted decreases, then the
percentage of job offers accepted and the level of employee morale
will increase.
° If employee morale increases, then the customer satisfaction with
service quality should increase.
° If the ratio of billable hours to total hours increases, then the revenue
per employee should increase.
° If the average number of errors per tax return decreases, then the
customer satisfaction with effectiveness should increase.
Problem 12-18 (continued)
Each of these hypotheses can be questioned. For example, Ariel’s
customers may define effectiveness as minimizing their tax liability
which is not necessarily the same as minimizing the number of errors in
a tax return. If some of Ariel’s customers became aware that Ariel
overlooked legal tax minimizing opportunities, it is likely that the
accordingly.
3. The performance measure “total dollar amount of tax refunds
generated” would motivate Ariel’s employees to aggressively search for
tax minimization opportunities for its clients. However, employees may
be too aggressive and recommend questionable or illegal tax practices
to clients. This undesirable behavior could generate unfavorable
publicity and lead to major problems for the company as well as its
Problem 12-18 (continued)
4. Each office’s individual performance should be based on the scorecard
measures only if the measures are controllable by those employed at
the branch offices. In other words, it would not make sense to attempt
to hold branch office managers responsible for measures such as the
percent of job offers accepted or the amount of compensation paid
above industry average. Recruiting and compensation decisions are not
Problem 12-19 (45 minutes)
1.
Florex Company
Quality Cost Report
Last Year
This Year
Amount
(in
thousands)
Percent
of Sales
Amount
(in
thousands)
Percent
of Sales
Quality engineering ……….
0.56
0.76
Systems development ……
480
0.64
1.00
Statistical process control .
0.00
180
0.24
Total prevention costs ……..
900
1.20
1,500
2.00
Appraisal costs
Inspection …………………..
750
1.00
1.20
Product testing …………….
810
1.08
1,200
1.60
Supplies used in testing …
30
0.04
60
0.08
Depreciation of testing
equipment ………………..
210
0.28
240
0.32
Total appraisal costs ……..
1,800
2.40
2,400
3.20
Internal failure costs:
Net cost of scrap ………….
630
0.84
1,125
1.50
Rework labor ……………….
1,050
1.40
1,500
2.00
Disposal of defective
products …………………..
720
0.96
975
1.30
Total internal failure costs …
2,400
3.20
3,600
4.80
Cost of field servicing …….
1,200
1.60
1.20
Product recalls ……………..
2,100
2.80
750
1.00
Total external failure costs ..
6,900
9.20
2,700
3.60
Problem 12-19 (continued)
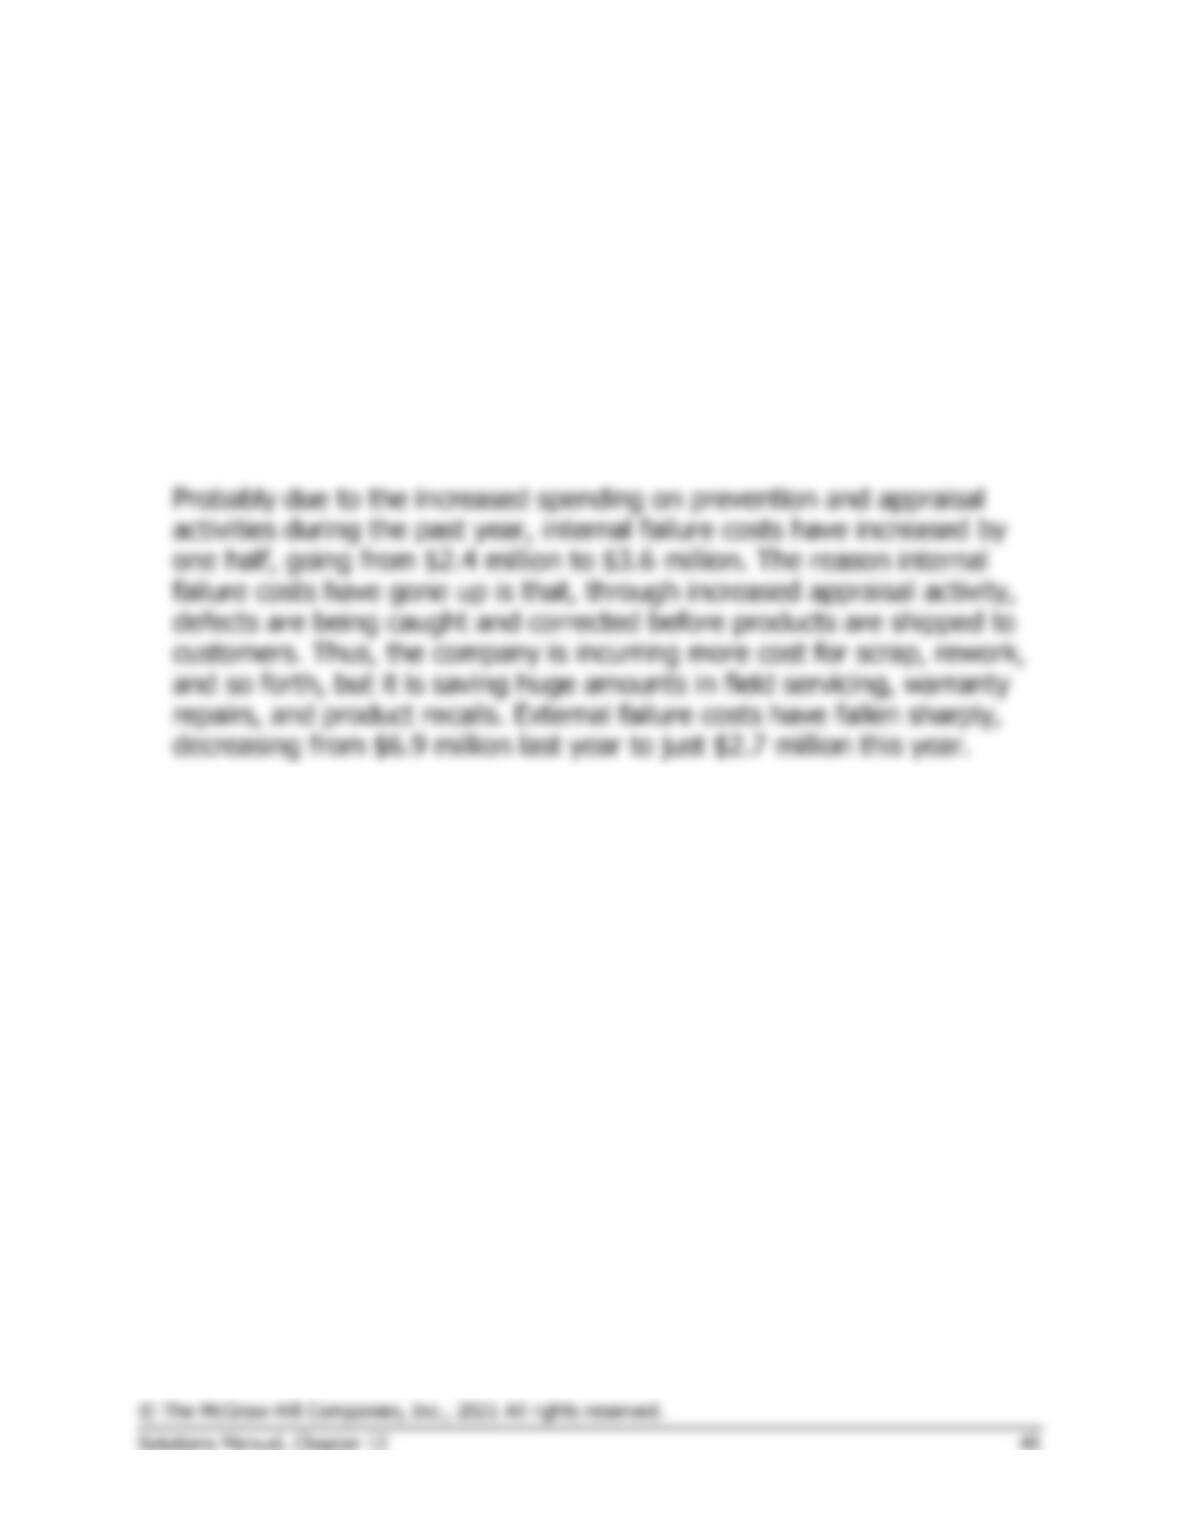
2. The overall impact of the company’s increased emphasis on quality over
the past year has been positive in that total quality costs have
decreased from 16% of sales to 13.6% of sales. Despite this
improvement, the company still has a poor distribution of quality costs.
The bulk of the quality costs in both years is traceable to internal and
external failure, rather than to prevention and appraisal. Although the
distribution of these costs is poor, the trend this year is toward more
prevention and appraisal as the company has given more emphasis on
quality.
If the company continues its emphasis on prevention and appraisal—
and particularly on prevention—its total quality costs should continue to
decrease in future years. Although internal failure costs are increasing
for the moment, these costs should decrease in time as better quality is
designed into products. Appraisal costs should also decrease as the
need for inspection, testing, and so forth decreases as a result of better
engineering and tighter process control.
Problem 12-20 (30 minutes)
1. a., b., and c.
Month
1
2
3
4
Throughput time—days:
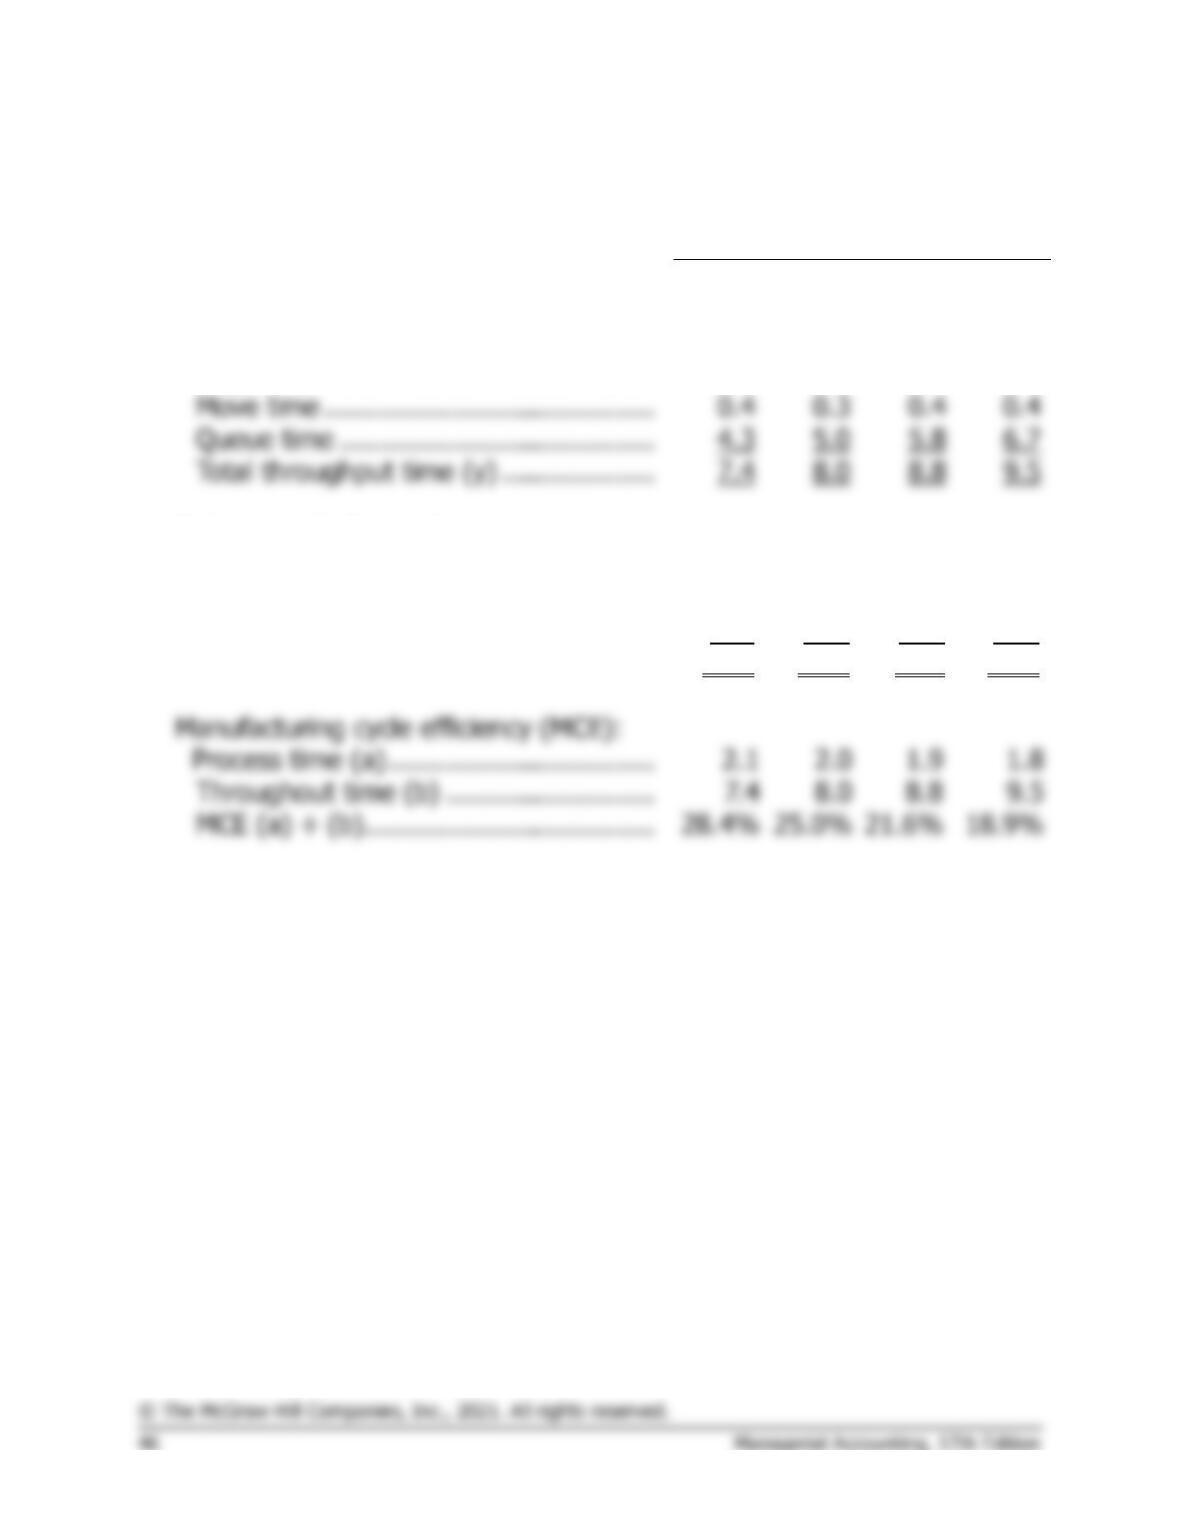
Process time (x) …………………………..
2.1
2.0
1.9
1.8
Inspection time …………………………….
0.6
0.7
0.7
0.6
Move time …………………………………..
0.4
0.3
0.4
0.4
Queue time …………………………………
4.3
5.0
5.8
6.7
Delivery cycle time—days:
Wait time from order to start of
production ………………………………..
16.0
17.5
19.0
20.5
Throughput time …………………………..
7.4
8.0
8.8
9.5
Total delivery cycle time …………………
23.4
25.5
27.8
30.0
Manufacturing cycle efficiency (MCE):
MCE (a) ÷ (b) ………………………………
18.9%
2. All of the performance measures display unfavorable trends. Throughput
time per unit is increasing—largely because of an increase in queue
time. Manufacturing cycle efficiency is declining and delivery cycle time
is increasing. In addition, the percentage of on-time deliveries has
dropped.
Problem 12-20 (continued)
3. a. and b.
Month
5
6
Throughput time—days:
Process time (x) ………………………………………
1.8
1.8
Inspection time ………………………………………..
0.6
0.0
Move time ………………………………………………
0.4
0.4
Queue time …………………………………………….
0.0
0.0
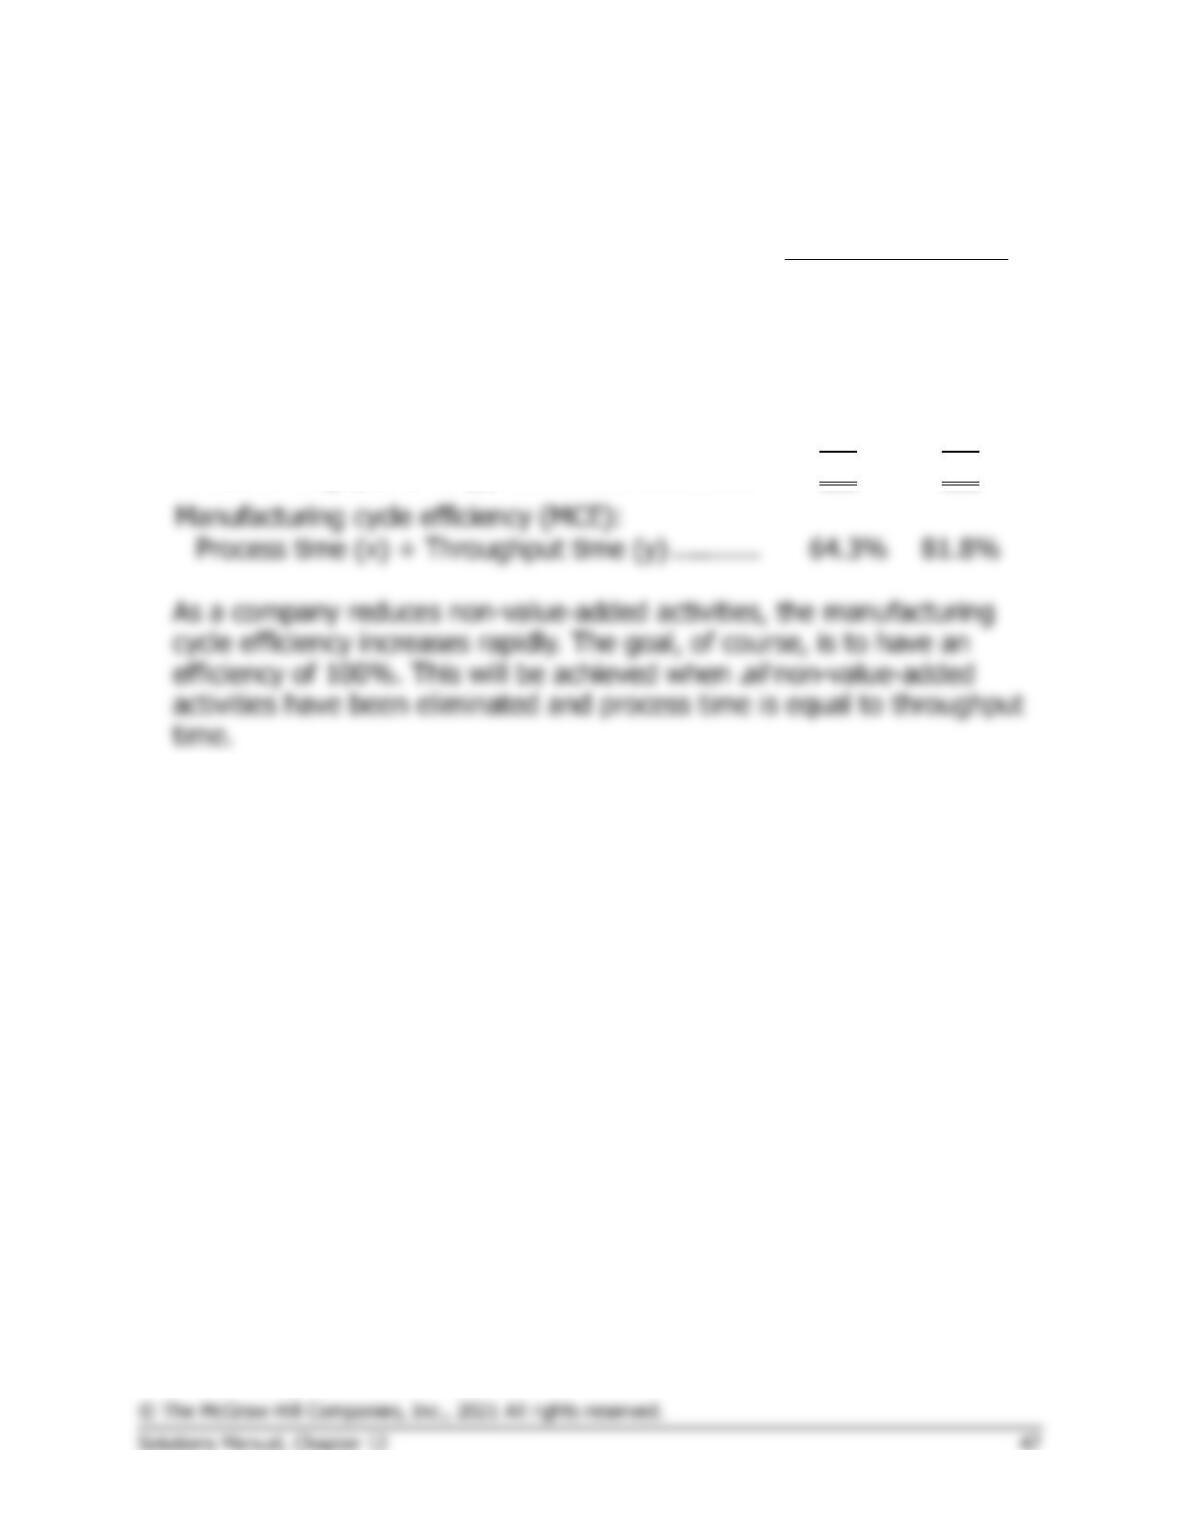
Total throughput time (y) …………………………..
2.8
2.2
Manufacturing cycle efficiency (MCE):
Financial
Case 12-21 (60 minutes)
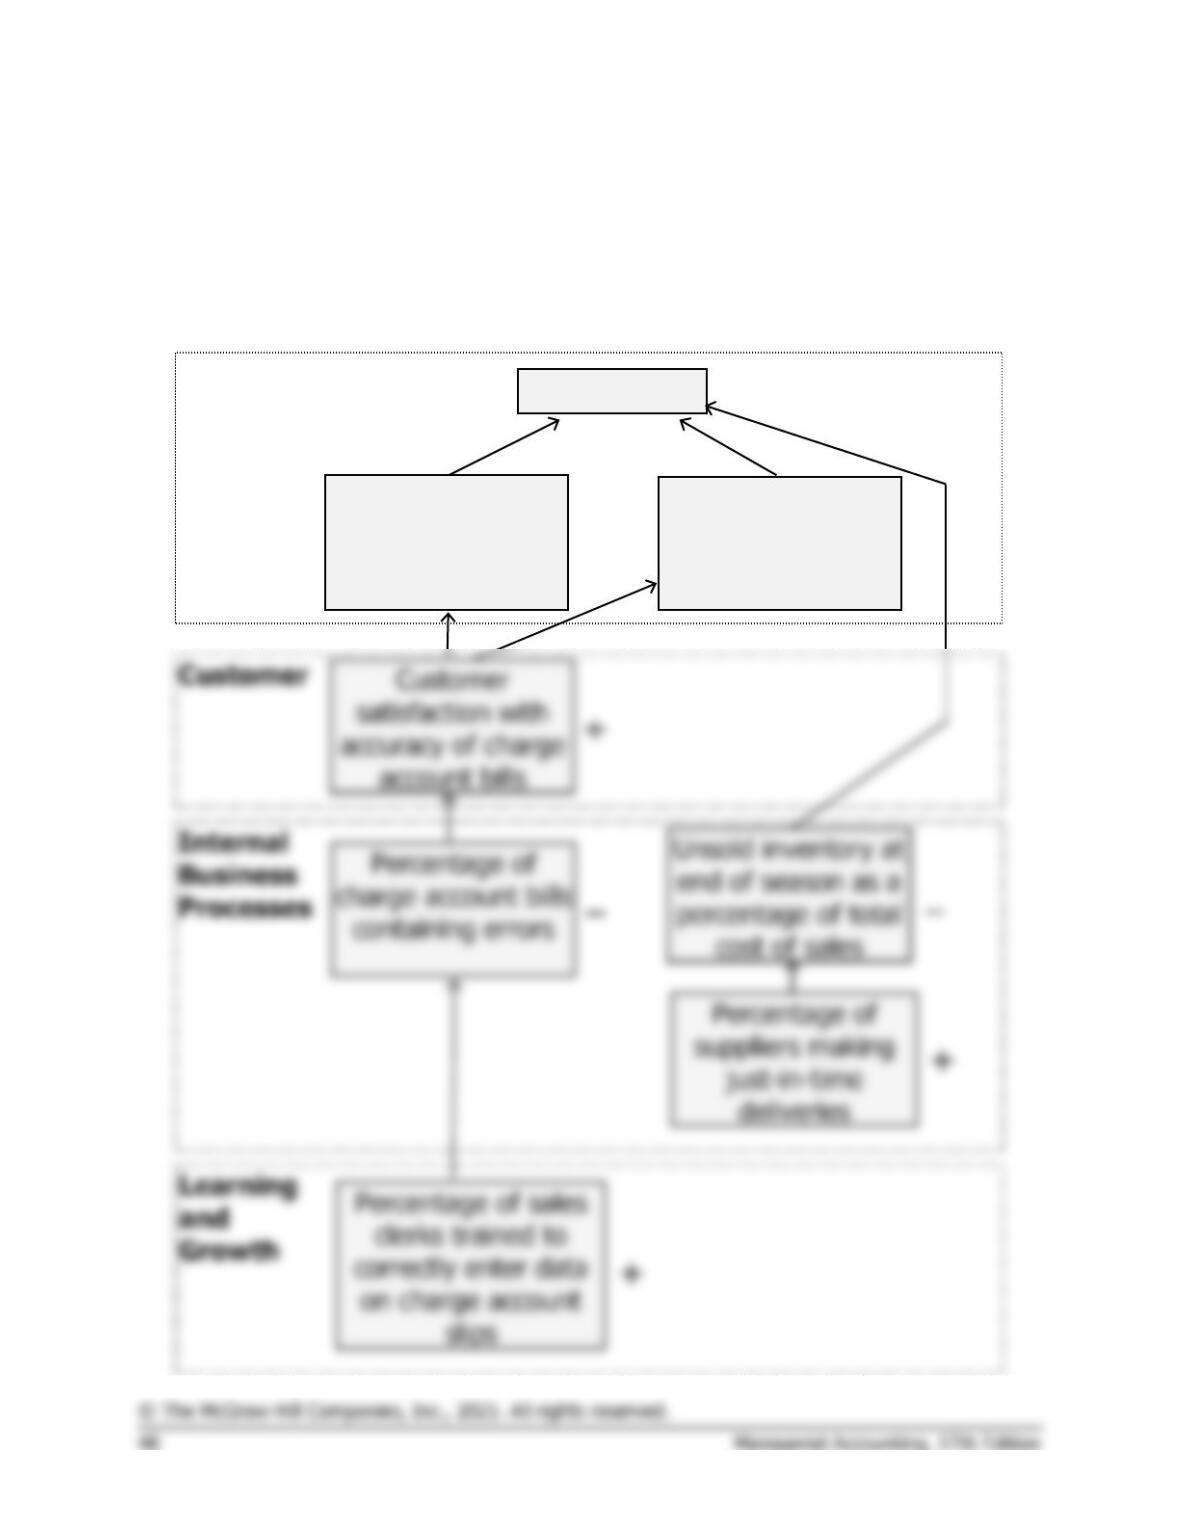
1. Student answers may differ concerning which category—learning and
growth, internal business processes, customers, or financial—a
particular performance measure belongs to.
Total profit
Average age of
accounts receivable
Written-off
accounts receivable
as a percentage of
sales
+
−
−
Case 12-21 (continued)
A number of the performance measures suggested by managers have
not been included in the above balanced scorecard. The excluded
2. The results of operations can be exploited for information about the
company’s strategy. Each link in the balanced scorecard should be
regarded as a hypothesis of the form “If …, then …”. For example, the
balanced scorecard on the previous page contains the hypothesis “If
customers express greater satisfaction with the accuracy of their charge
account bills, then the average age of accounts receivable will improve.”
If customers in fact do express greater satisfaction with the accuracy of
Case 12-21 (continued)
3. a. This evidence is inconsistent with two of the hypotheses underlying
the balanced scorecard. The first of these hypotheses is “If customers
express greater satisfaction with the accuracy of their charge account
bills, then the average age of accounts receivable will improve.” The
second of these hypotheses is “If customers express greater
satisfaction with the accuracy of their charge account bills, then there
will be improvement in bad debts.” There are a number of possible
b. This evidence is inconsistent with three hypotheses. The first of these
is “If the average age of receivables declines, then profits will
increase.” The second hypothesis is “If the written-off accounts
receivable decrease as a percentage of sales, then profits will
increase.” The third hypothesis is “If unsold inventory at the end of
the season as a percentage of cost of sales declines, then profits will
increase.”
Case 12-21 (continued)
The reduction in unsold inventories at the end of the season as a
percentage of cost of sales could have occurred for a number of
reasons that are not necessarily good for profits. For example,
managers may have been too cautious about ordering goods to