Exercise 12-12 (LO12.5)
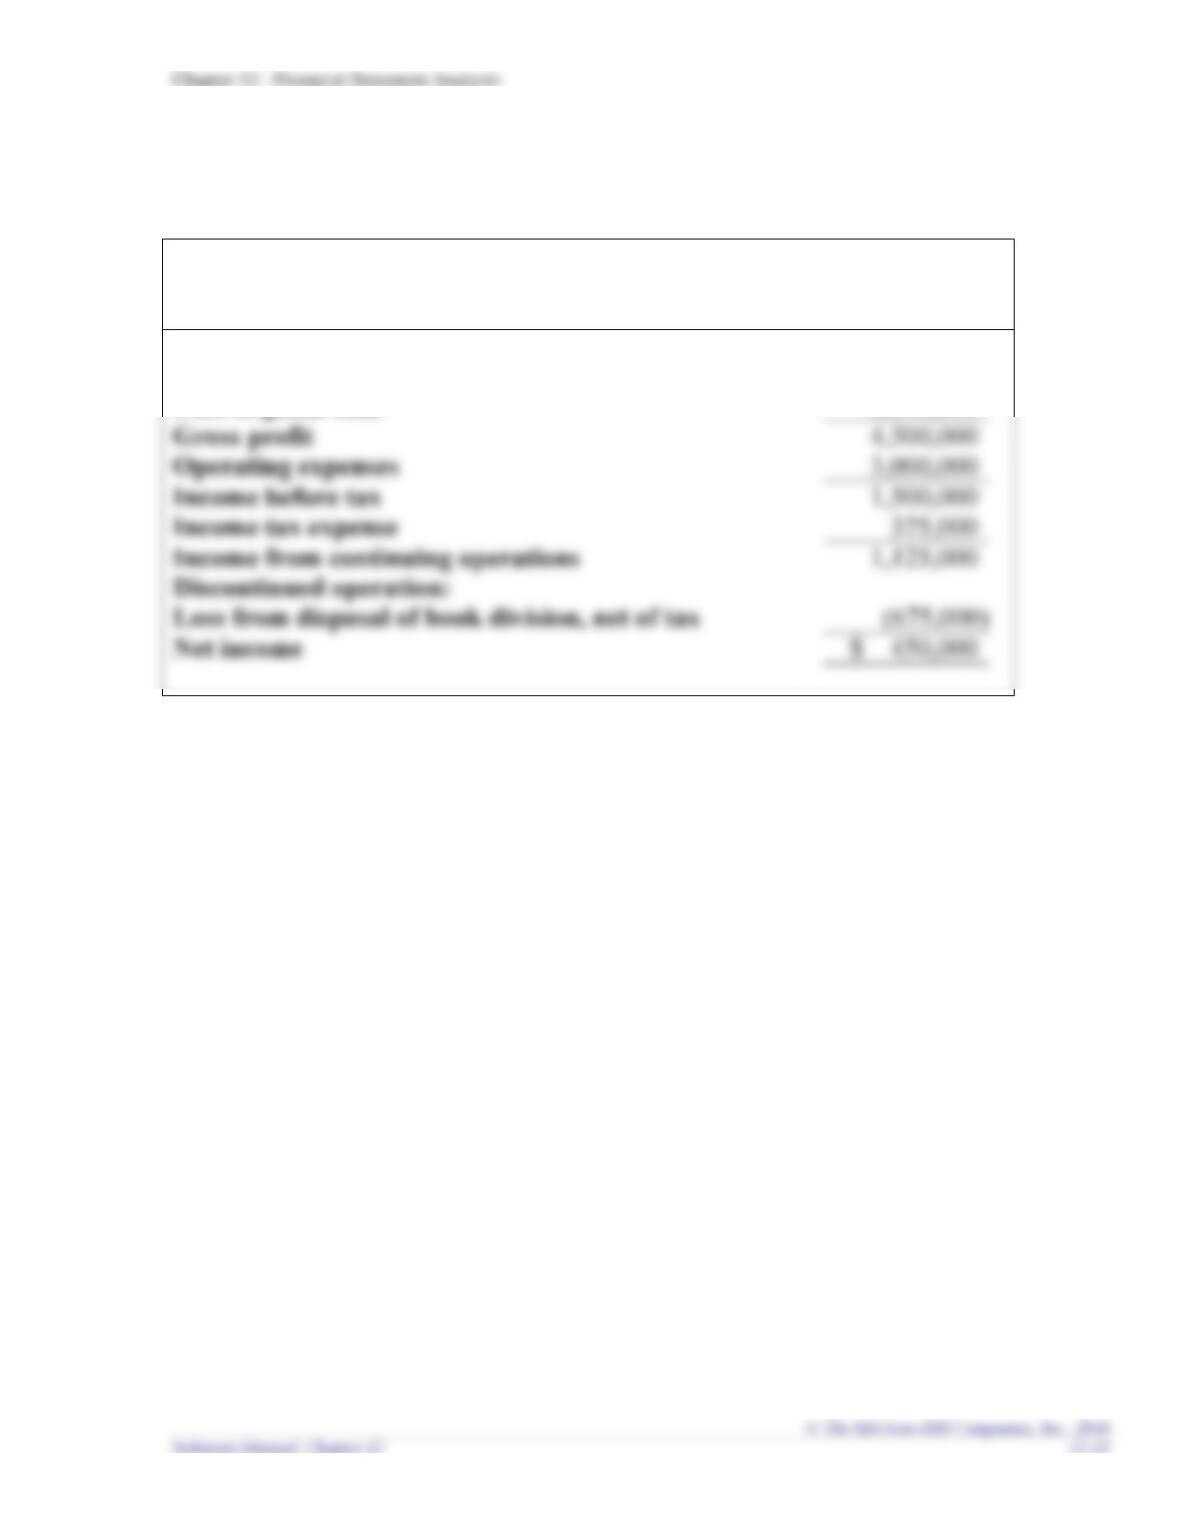
LeBron’s Bookstores
Income Statement
For the Year Ended December 31, 2018
Net sales
$ 11,000,000
Cost of goods sold
6,500,000
Gross profit
Operating expenses
Income before tax
Income tax expense
Income from continuing operations
Net income
Exercise 12-13 (LO12.5)
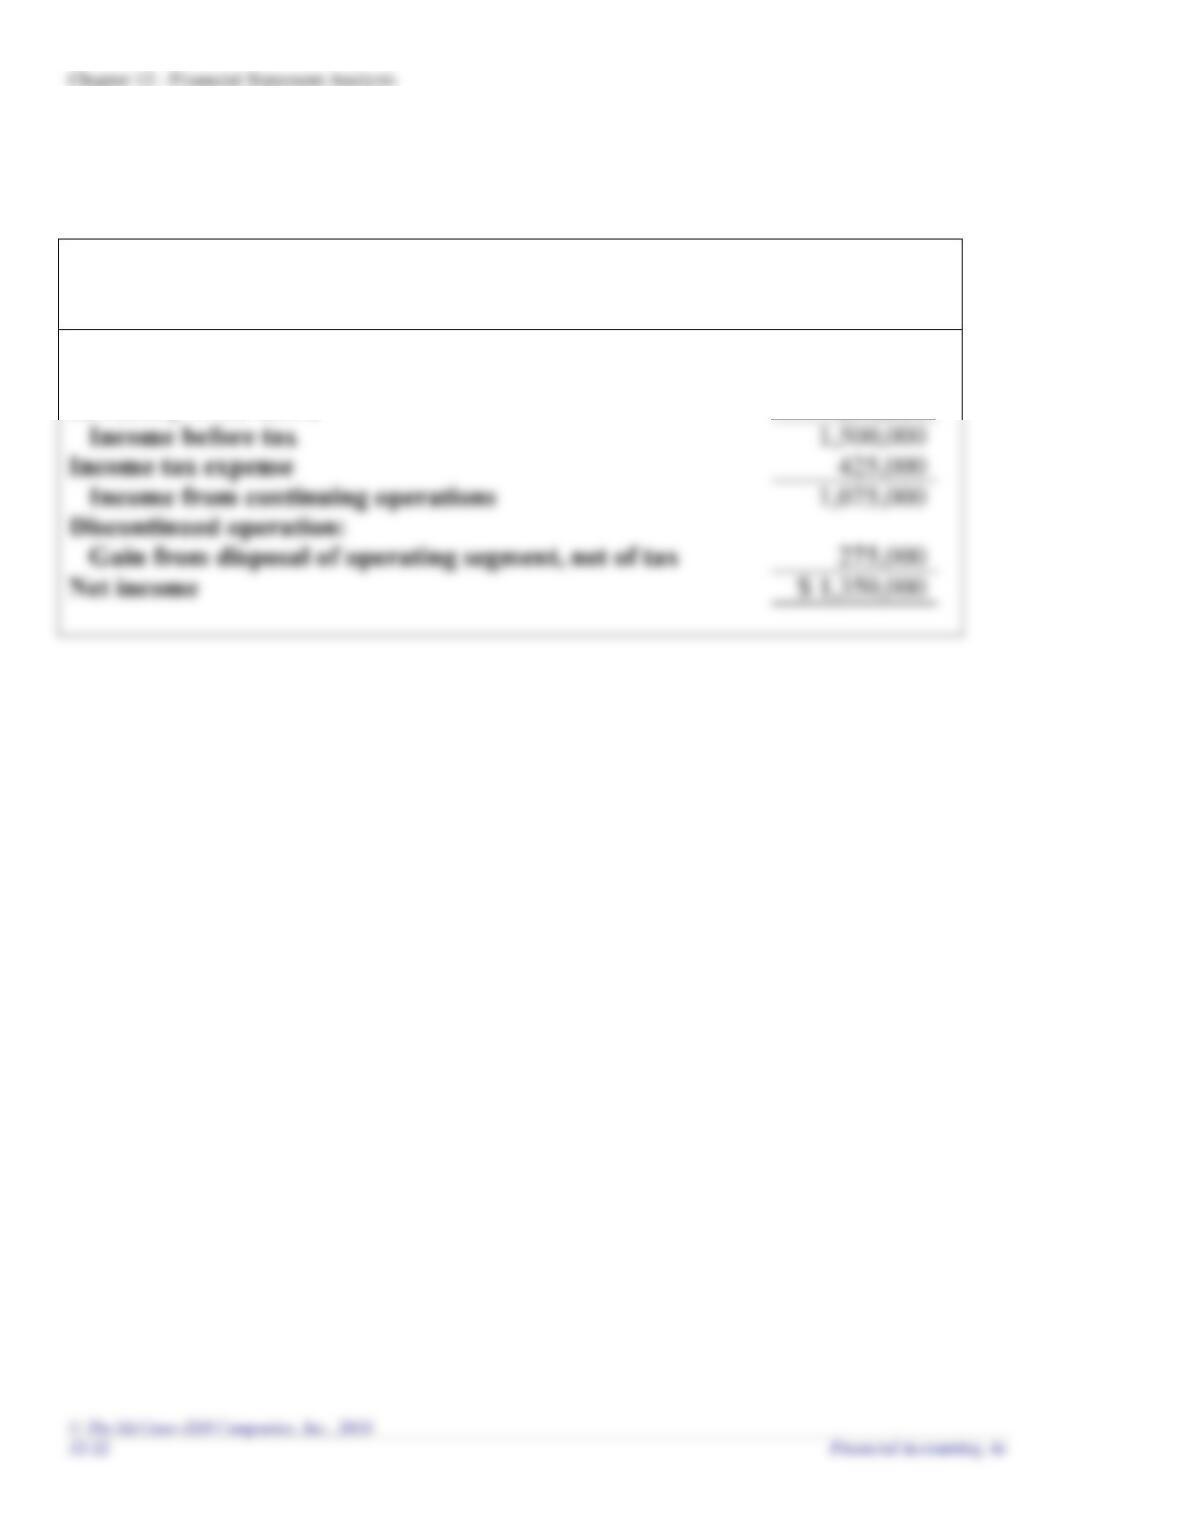
Shaquille Corporation
Income Statement
For the Year Ended December 31, 2018
Operating income
$ 1,700,000
Inventory write-down
200,000
425,000
Net income
Chapter 12 – Financial Statement Analysis
Exercise 12-14 (LO12.6)
a. Conservative (lower income, lower assets)
b. Aggressive (higher income, higher assets)
c. Conservative (lower income, lower assets)
d. Aggressive (higher income, lower liabilities)
Exercise 12-15 (LO12.6)
Requirement 1
(a) Aggressive
(b) Conservative
(c) Aggressive
(d) Aggressive
(e) Aggressive
Requirement 2
Chapter 12 – Financial Statement Analysis
PROBLEMS: SET A
Problem 12-1A (LO12.1)
Requirement 1
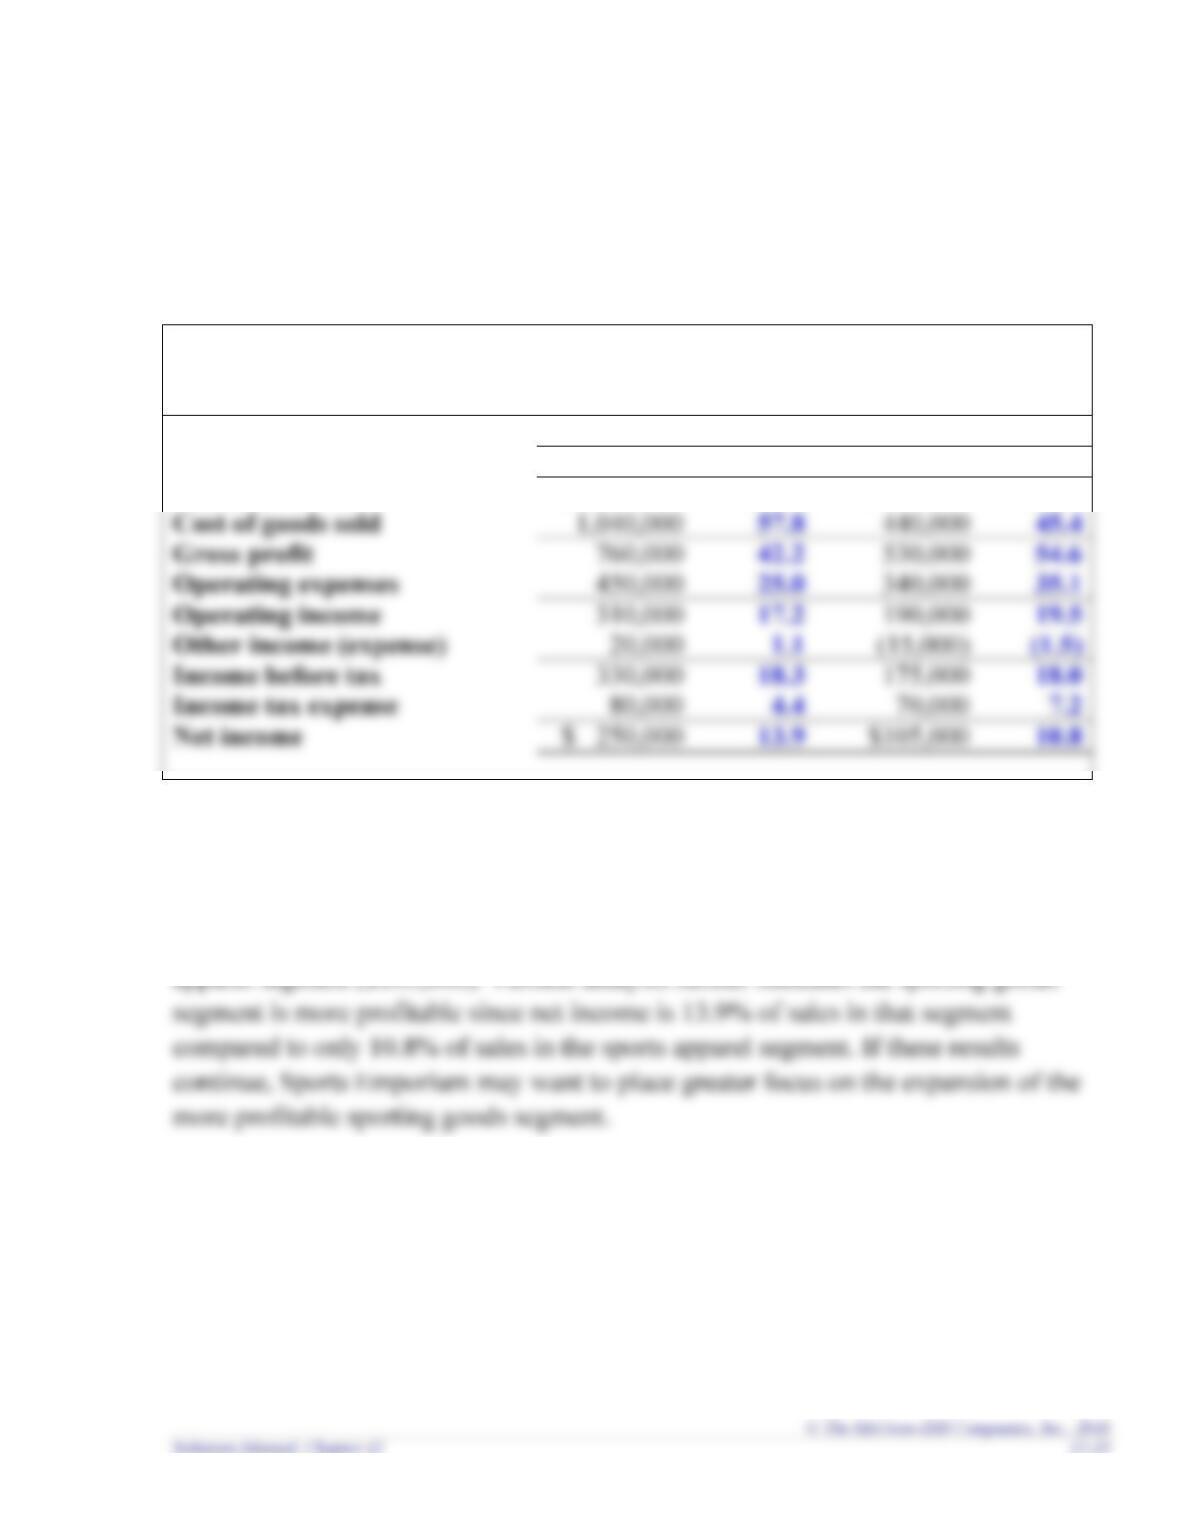
Sports Emporium
Income Statements
For the Year Ended December 31, 2018
Sporting Goods
Sports Apparel
Amount
%
Amount
%
Net sales
$1,800,000
100.0
$970,000
100.0
Requirement 2
The sporting goods segment has a higher net income ($250,000) than the sports
Problem 12-2A (LO12.2)
Requirement 1
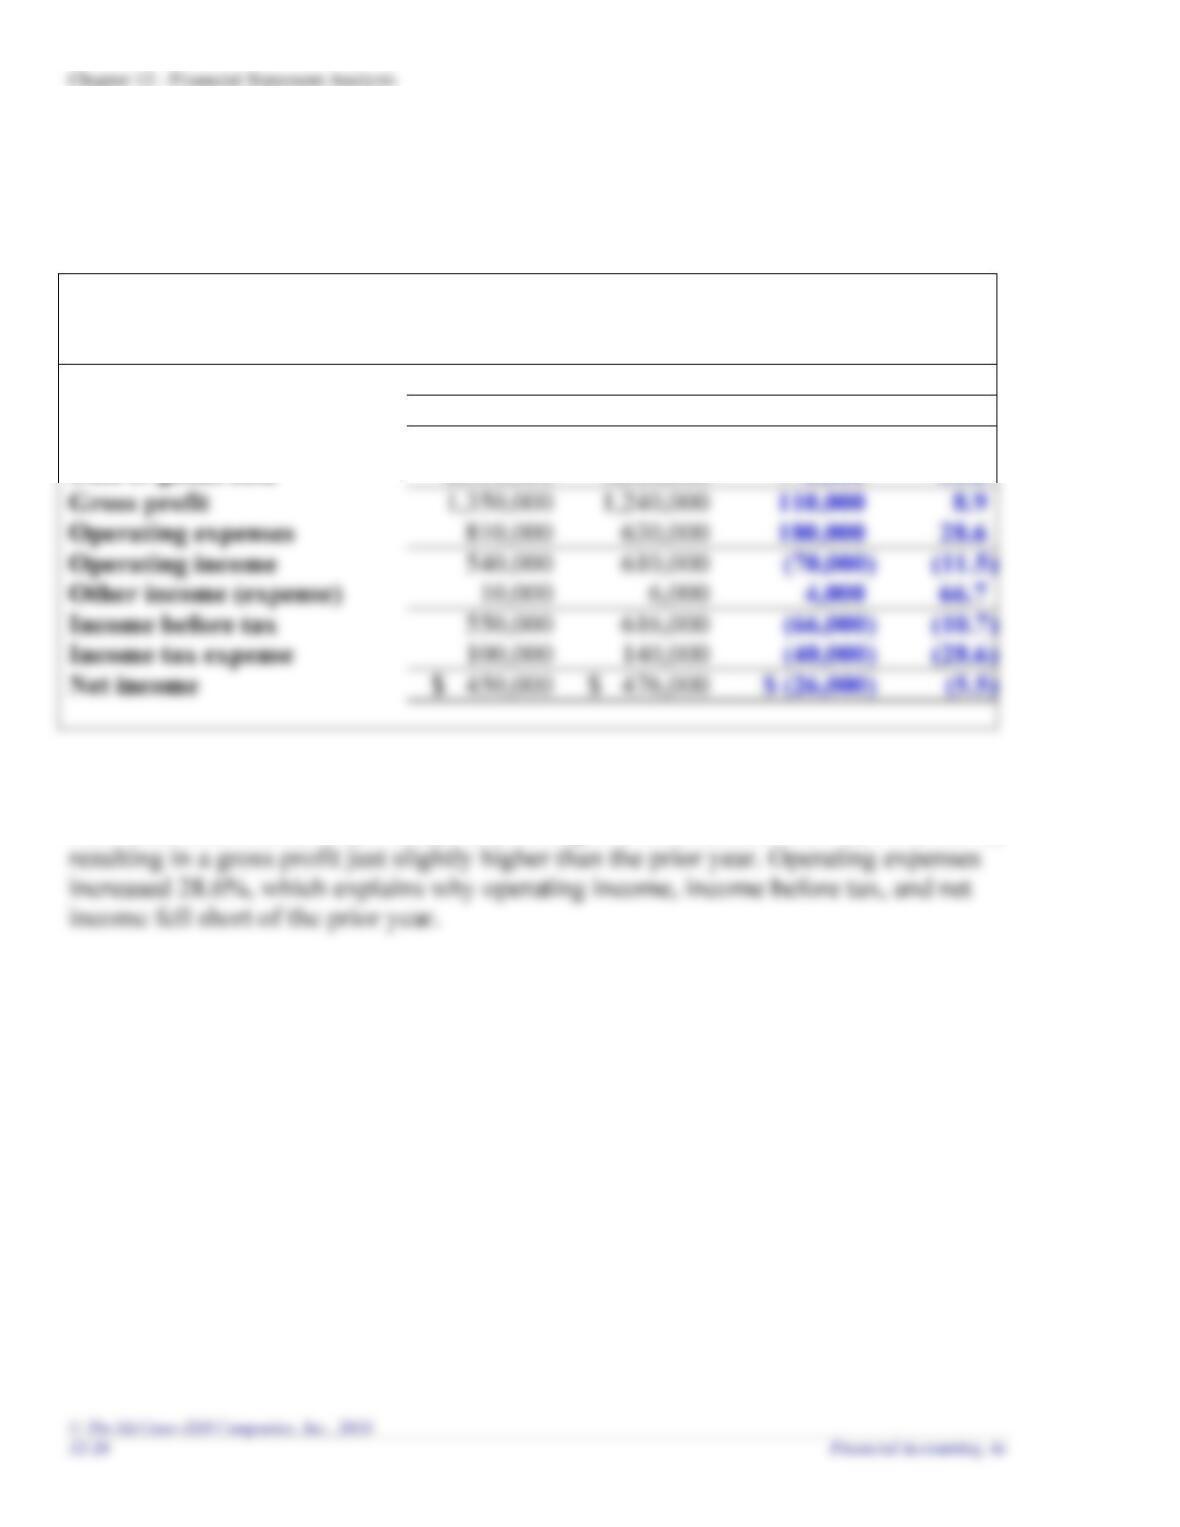
Anything Tennis
Income Statements
For the Years Ended December 31
Increase (Decrease)
2018
2017
Amount
%
Net sales
$ 3,500,000
$ 2,620,000
$ 880,000
33.6
Cost of goods sold
2,150,000
1,380,000
770,000
55.8
Operating expenses
Operating income
(70,000)
66.7
Income before tax
Income tax expense
Requirement 2
Sales increased $880,000 (33.6%), but cost of goods sold increased $770,000 (55.8%),
Problem 12-3A (LO12.1, 12.2)
Requirement 1
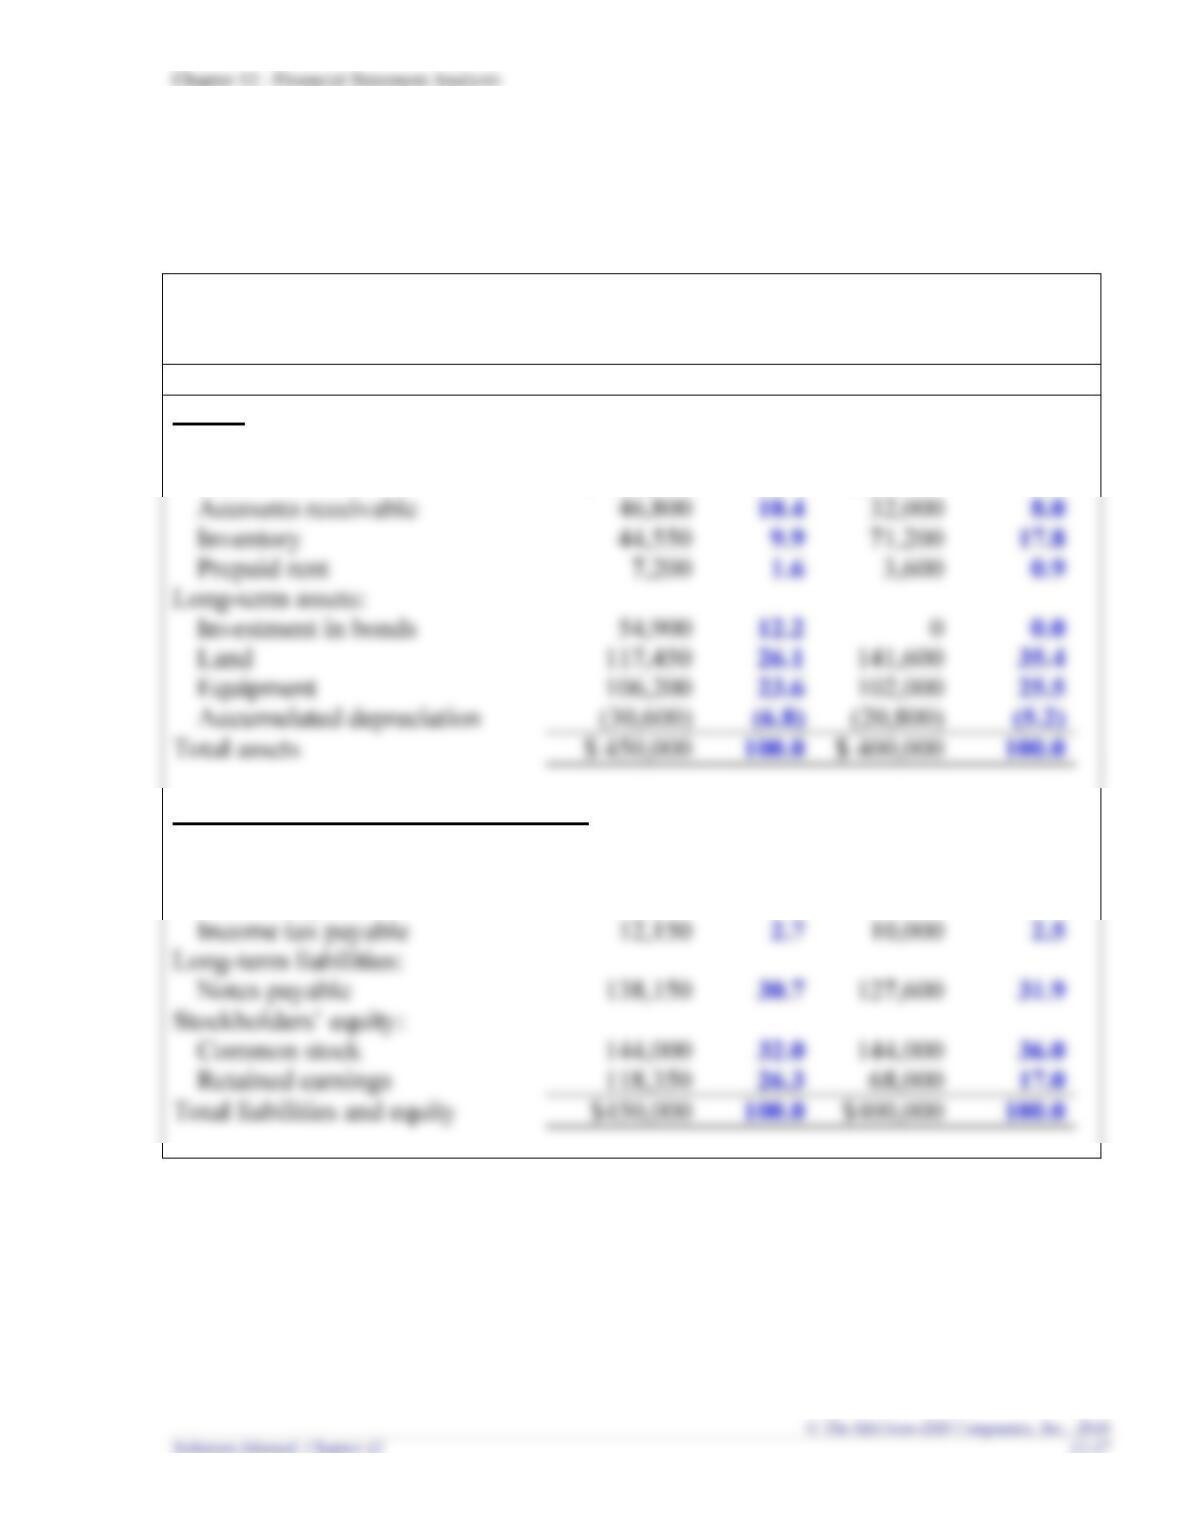
Sports Unlimited
Balance Sheet
December 31, 2018
2018
2017
Assets
Amount
%
Amount
%
Current assets:
Cash
$ 103,500
23.0
$ 70,400
17.6
Inventory
9.9
Prepaid rent
7,200
1.6
0.9
Investment in bonds
12.2
Equipment
23.6
25.5
Accumulated depreciation
Total assets
Liabilities and Stockholders’ Equity
Current liabilities:
Accounts payable
$ 30,150
6.7
$ 46,800
11.7
Interest payable
7,200
1.6
3,600
0.9
Income tax payable
2.7
Common stock
32.0
36.0
Retained earnings
26.3
Total liabilities and equity
Requirement 2
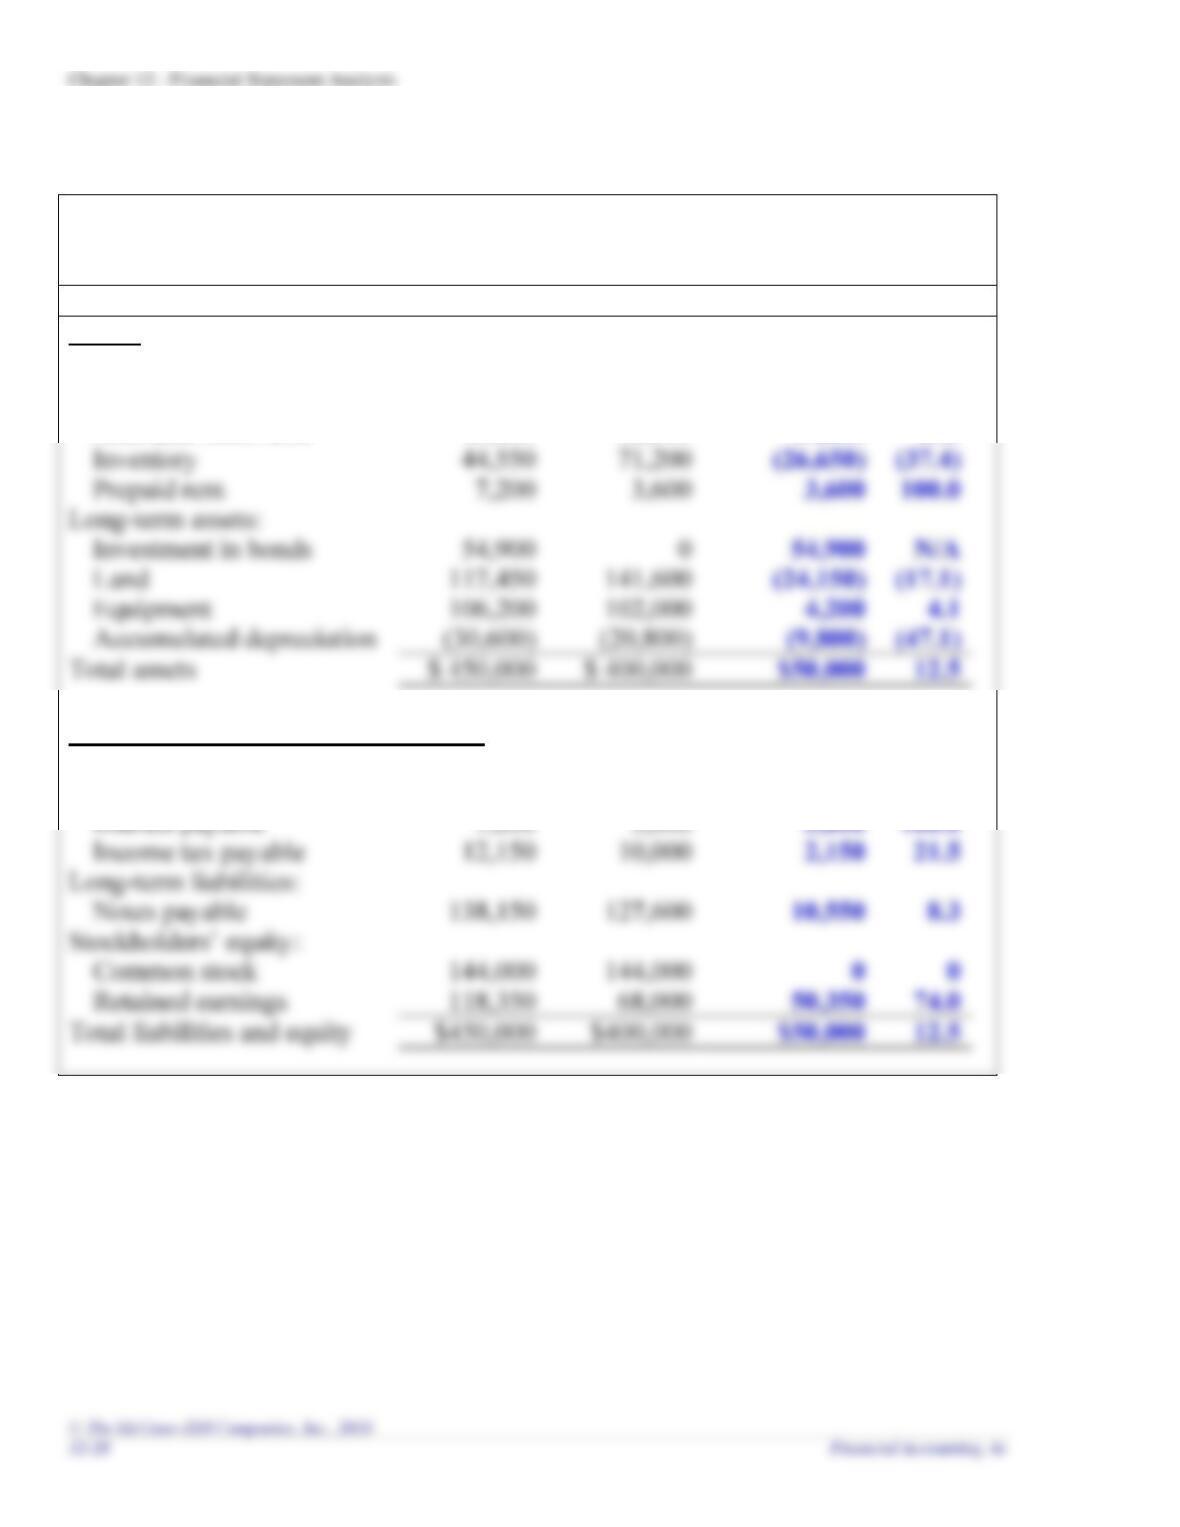
Sports Unlimited
Balance Sheet
December 31, 2018
Year
Increase (Decrease)
Assets
2018
2017
Amount
%
Current assets:
Cash
$ 103,500
$ 70,400
$ 33,100
47.0
Accounts receivable
46,800
32,000
14,800
46.3
Prepaid rent
Long-term assets:
Investment in bonds
54,900
54,900
Land
Accumulated depreciation
(47.1)
Total assets
Liabilities and Stockholders’ Equity
Current liabilities:
Accounts payable
$ 30,150
$ 46,800
$(16,650)
(35.6)
Income tax payable
21.5
Long-term liabilities:
Notes payable
Retained earnings
68,000
74.0
Total liabilities and equity
Chapter 12 – Financial Statement Analysis
Problem 12-4A (LO12.3)
Risk Ratios
Calculations
1. Receivables turnover ratio
$3,086,000
($70,000 + $91,000) / 2
= 38.3 times
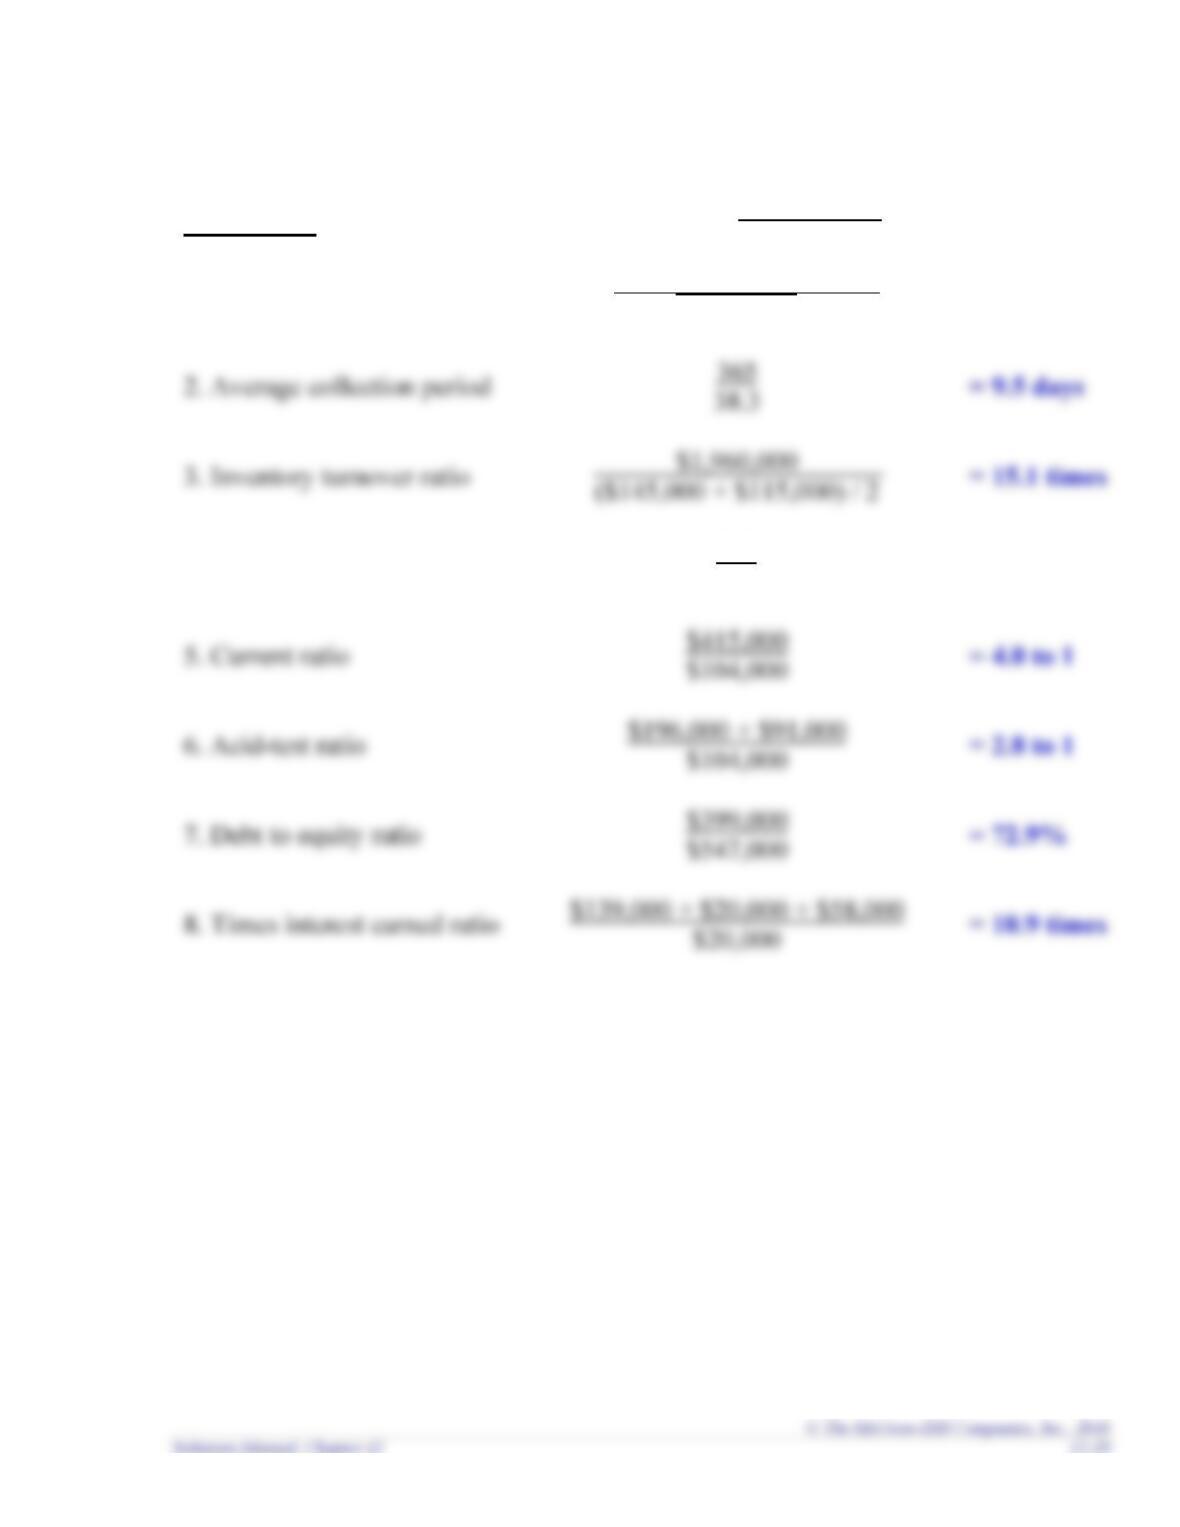
2. Average collection period
38.3
= 9.5 days
4. Average days in inventory
365
15.1
= 24.2 days
5. Current ratio
= 4.0 to 1
6. Acid-test ratio
= 2.8 to 1
7. Debt to equity ratio
= 72.9%
8. Times interest earned ratio
= 10.9 times
Problem 12-5A (LO12.4)
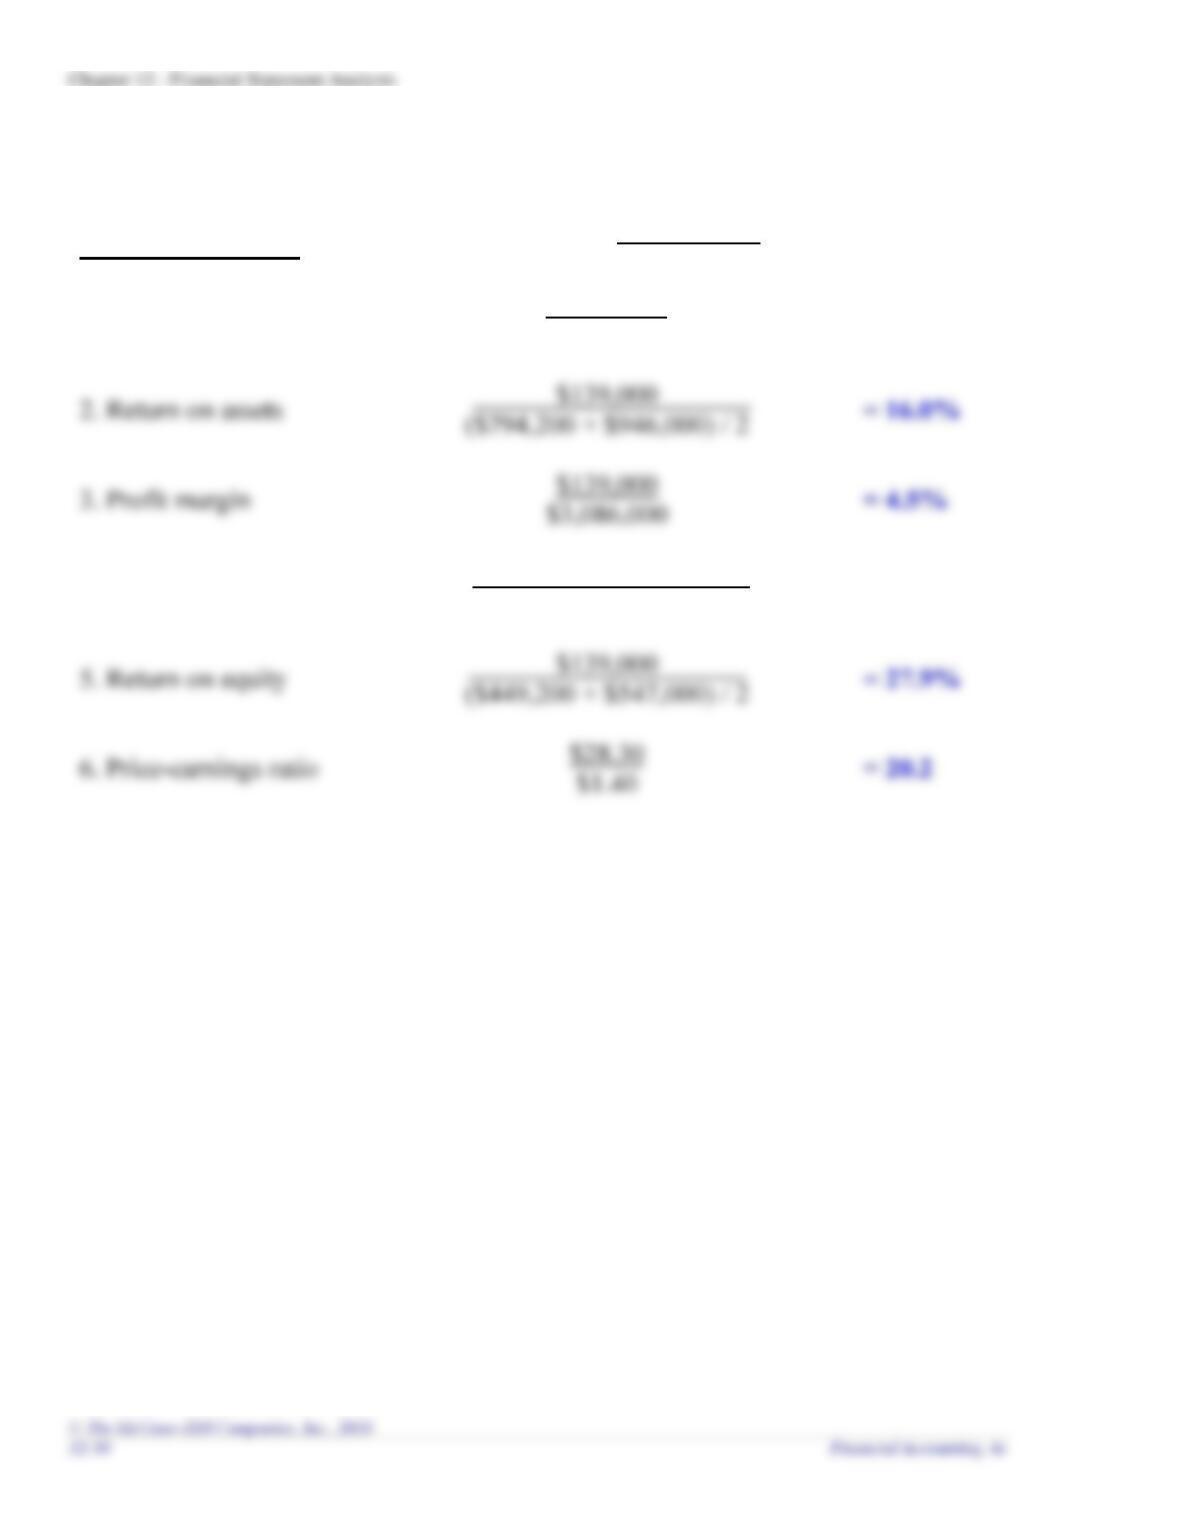
Profitability Ratios
Calculations
1. Gross profit ratio
$1,126,000
$3,086,000
= 36.5%
2. Return on assets
= 16.0%
$3,086,000
4. Asset turnover
$3,086,000
($794,200 + $946,000) / 2
= 3.5 times
5. Return on equity
= 27.9%
= 20.2
Problem 12-6A (LO12.3, 12.4)
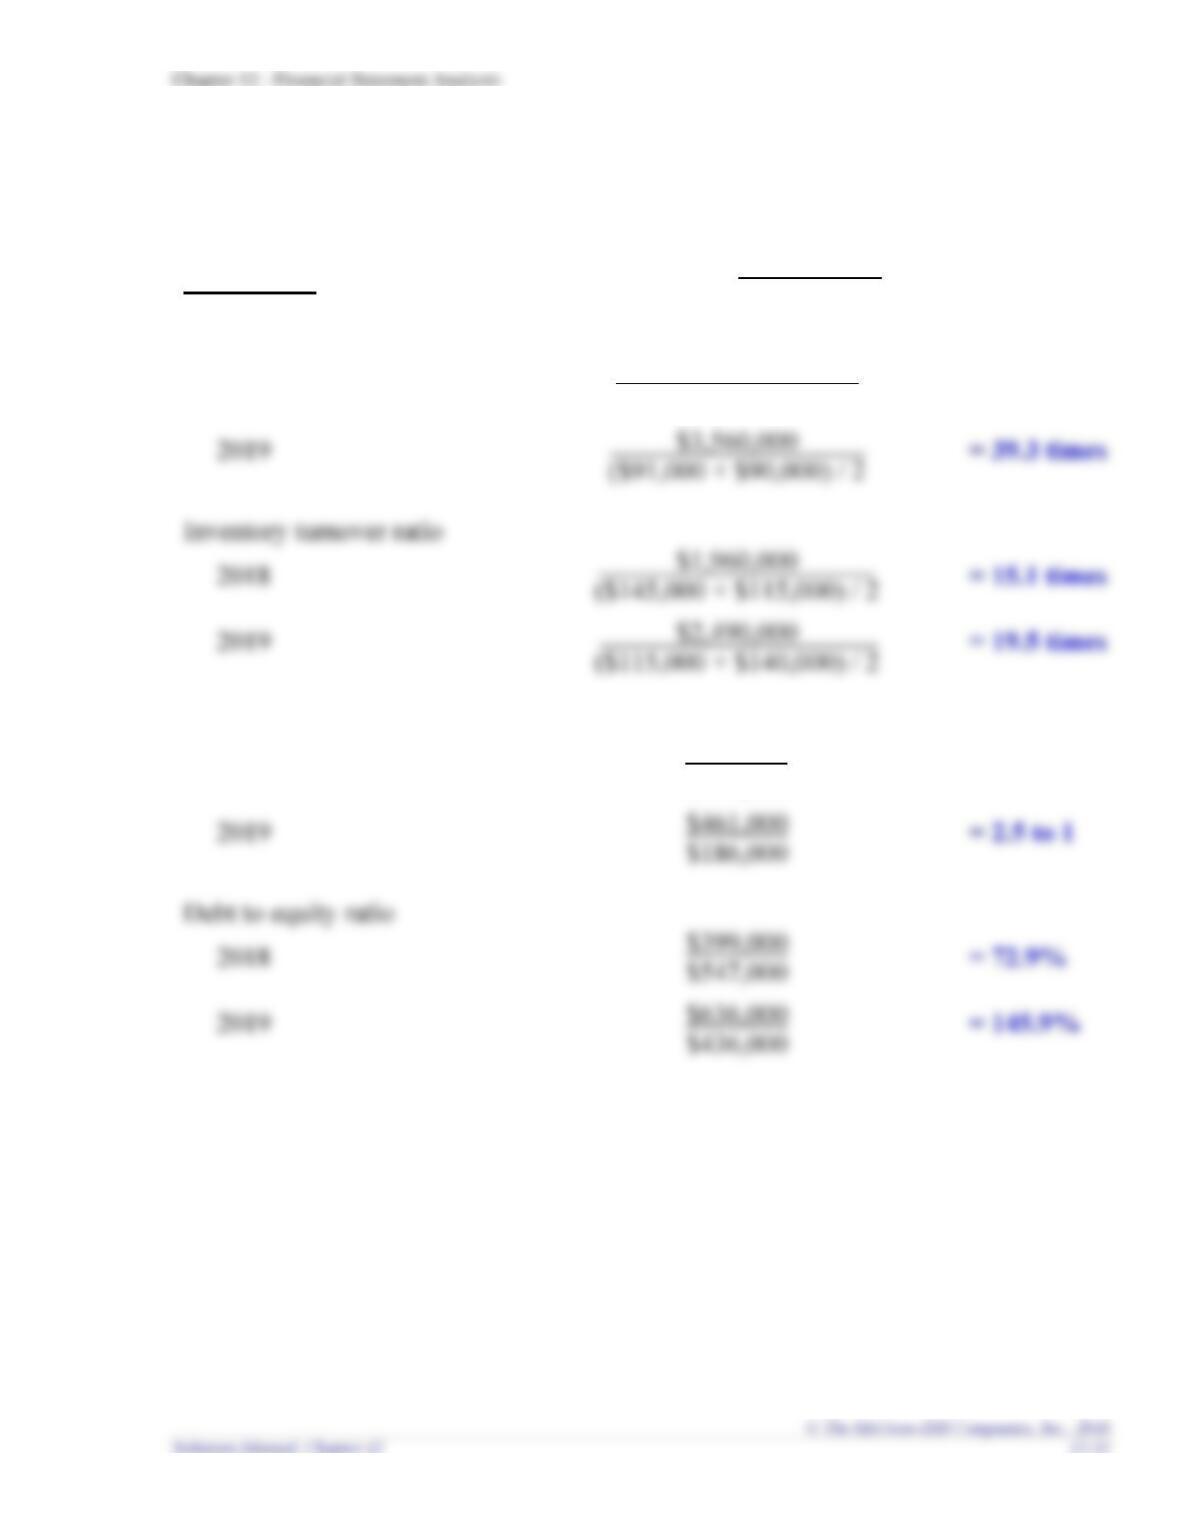
Requirement 1
Risk Ratios
Calculations
Receivables turnover ratio
2018
$3,086,000
($70,000 + $91,000) / 2
= 38.3 times
Inventory turnover ratio
2018
= 15.1 times
Current ratio
2018
$415,000
$104,000
= 4.0 to 1
$186,000
Debt to equity ratio
2018
$399,000
= 72.9%
$436,000
Chapter 12 – Financial Statement Analysis
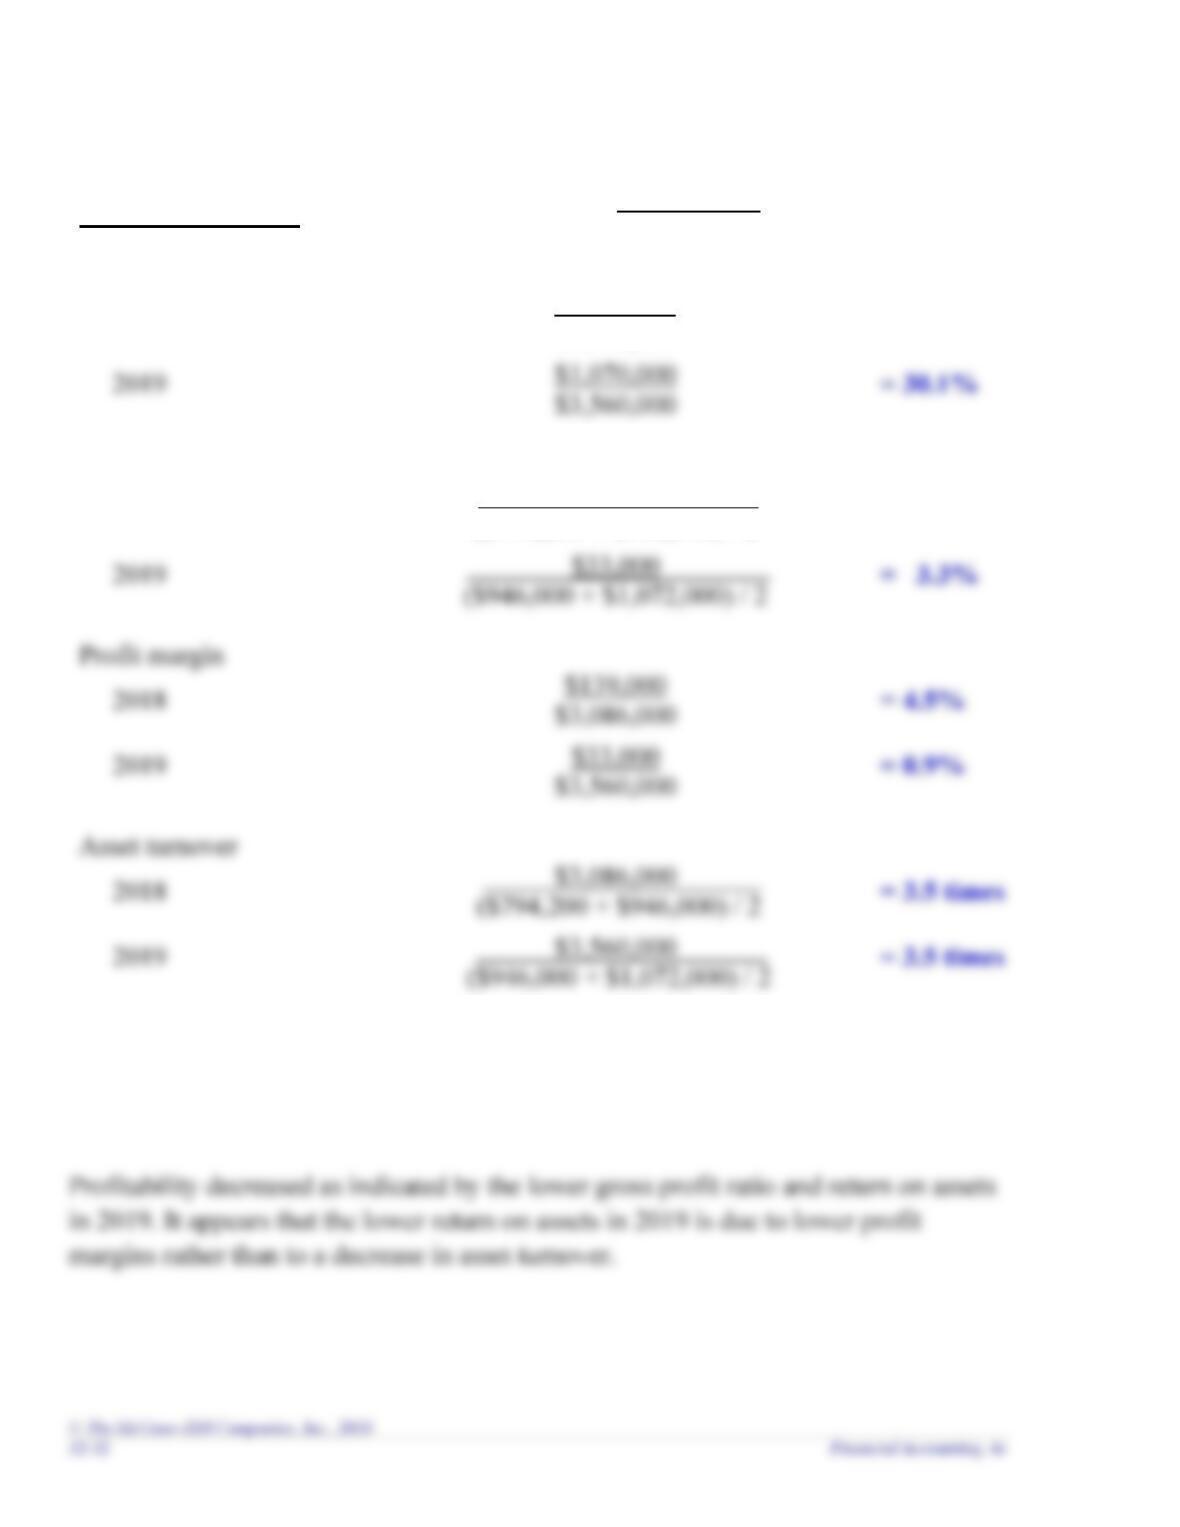
Requirement 2
Profitability Ratios
Calculations
Gross profit ratio
2018
$1,126,000
$3,086,000
= 36.5%
$3,560,000
Return on assets
2018
$139,000
($794,200 + $946,000) / 2
= 16.0%
Profit margin
2018
$139,000
$3,086,000
= 4.5%
$3,560,000
2018
= 3.5 times
Requirement 3
The risk ratios are mixed. The receivables and inventory turnover ratios improved in
2019, while the current ratio and debt to equity ratio indicate greater risk in 2019.
Chapter 12 – Financial Statement Analysis
PROBLEMS: SET B
Problem 12-1B (LO12.1)
Requirement 1
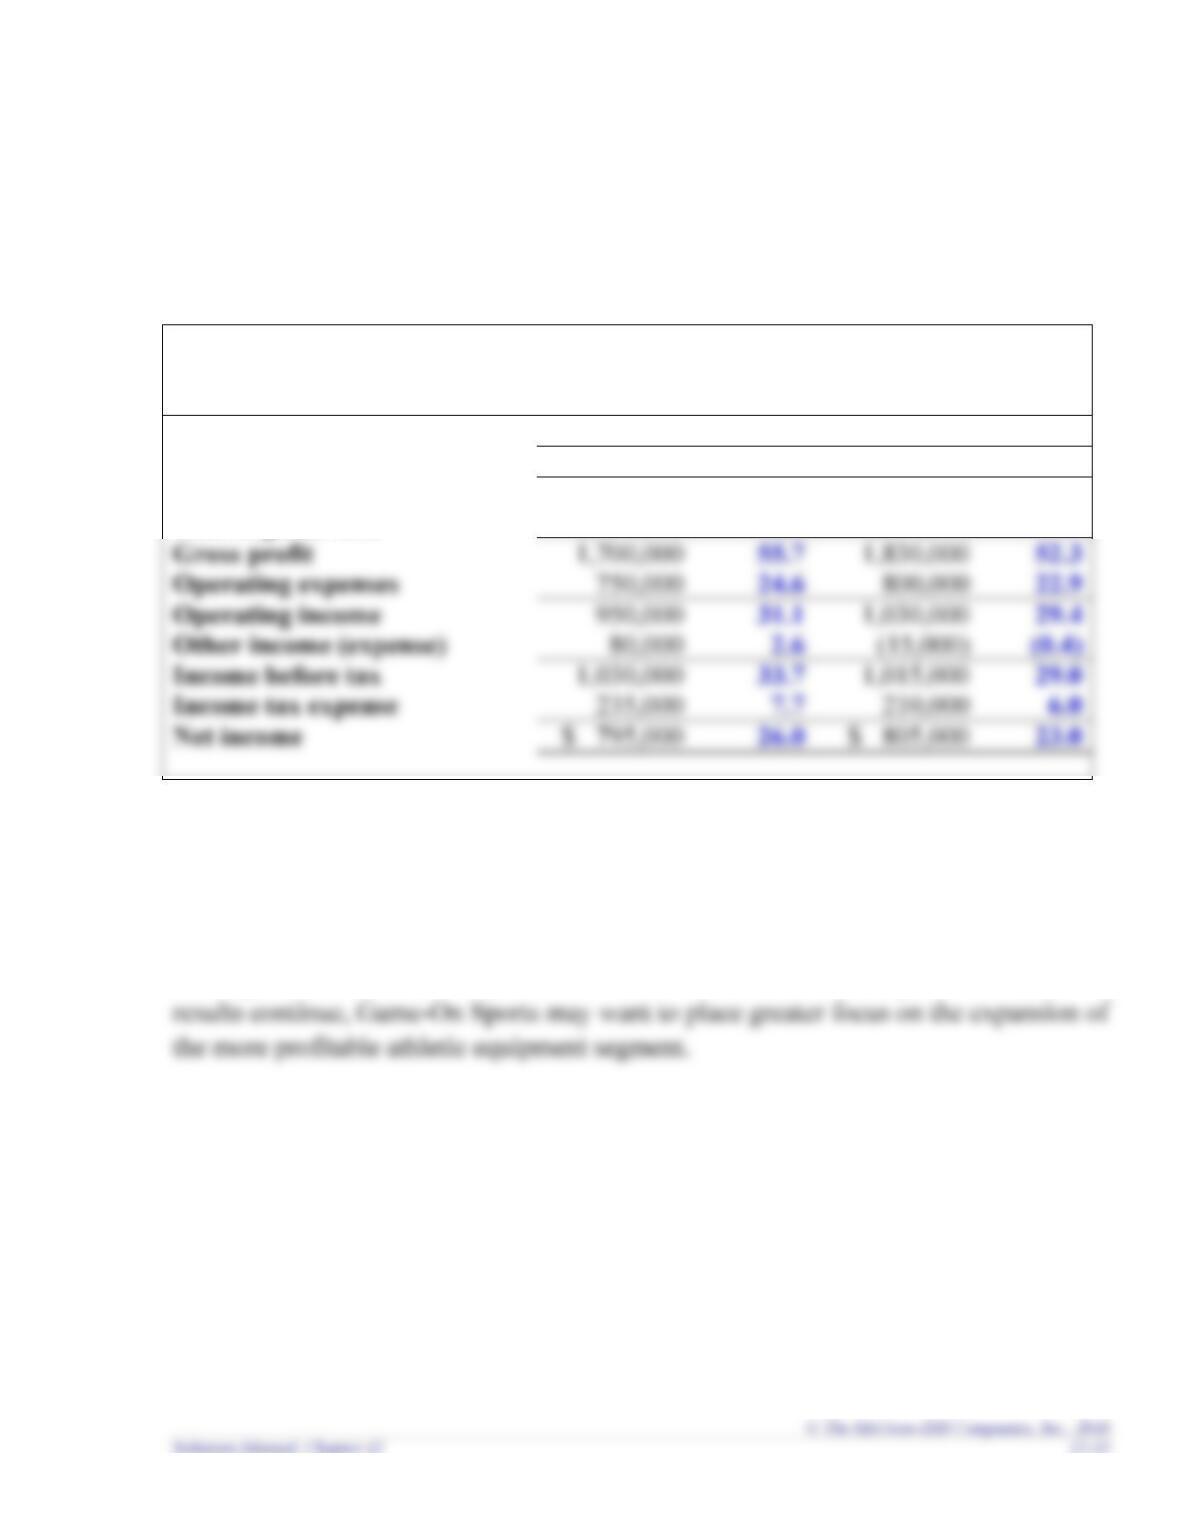
Game-On Sports
Income Statements
For the Year Ended December 31, 2018
Athletic Equipment
Accessories
Amount
%
Amount
%
Net sales
$3,050,000
100.0
$3,500,000
100.0
Cost of goods sold
1,350,000
44.3
1,670,000
47.7
Gross profit
1,700,000
55.7
52.3
Operating expenses
22.9
Operating income
1,030,000
29.4
Income before tax
1,015,000
29.0
Income tax expense
Net income
26.0
23.0
Requirement 2
The athletic equipment segment is more profitable. Net income is 26.0% of sales in
that segment compared to only 23.0% of sales in the accessories segment. If these
Problem 12-2B (LO12.2)
Requirement 1
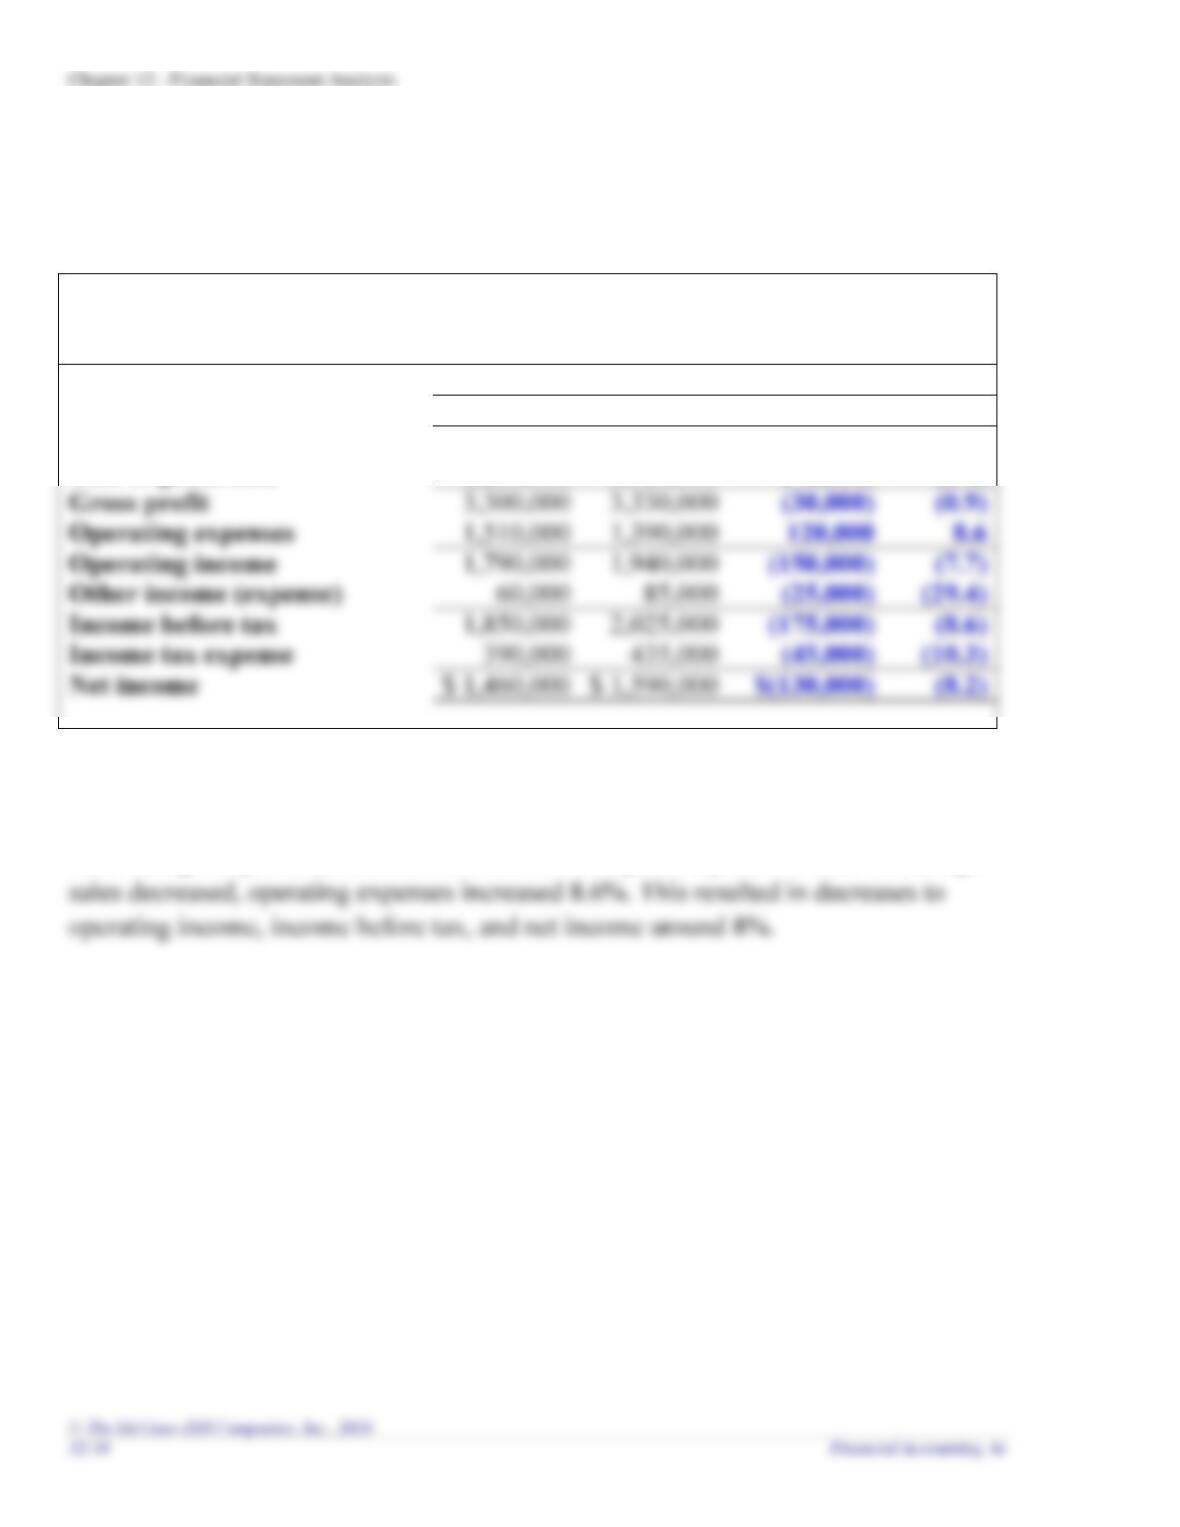
Galaxy Tennis
Income Statements
For the Years Ended December 31
Increase (Decrease)
2018
2017
Amount
%
Net sales
$ 6,150,000
$ 6,250,000
$ (100,000)
(1.6)
Cost of goods sold
2,850,000
2,920,000
(70,000)
(2.4)
Operating expenses
Operating income
(7.7)
Income before tax
(8.6)
Income tax expense
Net income
$ 1,460,000
$ 1,590,000
(8.2)
Requirement 2
Sales and gross profit decreased 1.6% and 0.9% respectively. However, even though
Problem 12-3B (LO12.1, 12.2)
Requirement 1
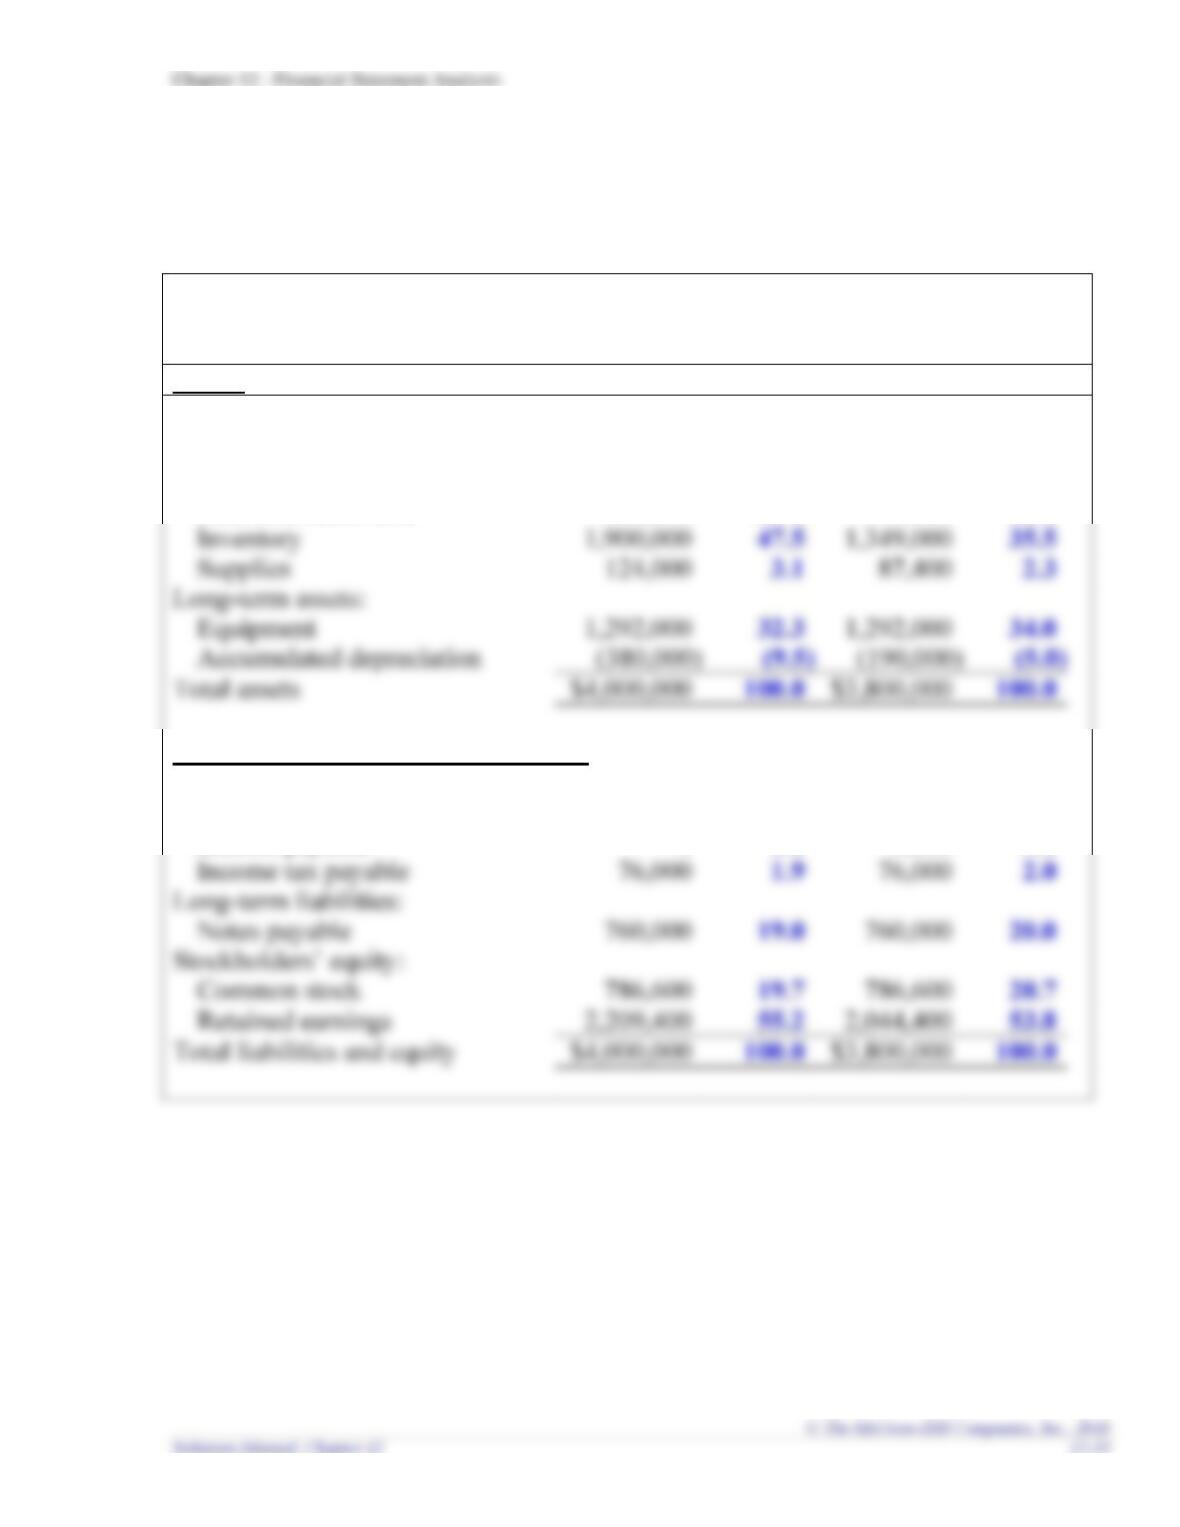
Fantasy Football
Balance Sheet
December 31
Assets
2018
2017
Amount
%
Amount
%
Current assets:
Cash
$ 208,000
5.2
$ 262,200
6.9
Accounts receivable
856,000
21.4
999,400
26.3
Inventory
Supplies
3.1
Equipment
Accumulated depreciation
Total assets
$4,000,000
$3,800,000
Liabilities and Stockholders’ Equity
Current liabilities:
Accounts payable
$ 168,000
4.2
$ 129,200
3.4
Interest payable
0
0.0
3,800
0.1
Income tax payable
1.9
Notes payable
Common stock
786,600
19.7
786,600
Retained earnings
Total liabilities and equity
$4,000,000
$3,800,000
Chapter 12 – Financial Statement Analysis
Requirement 2
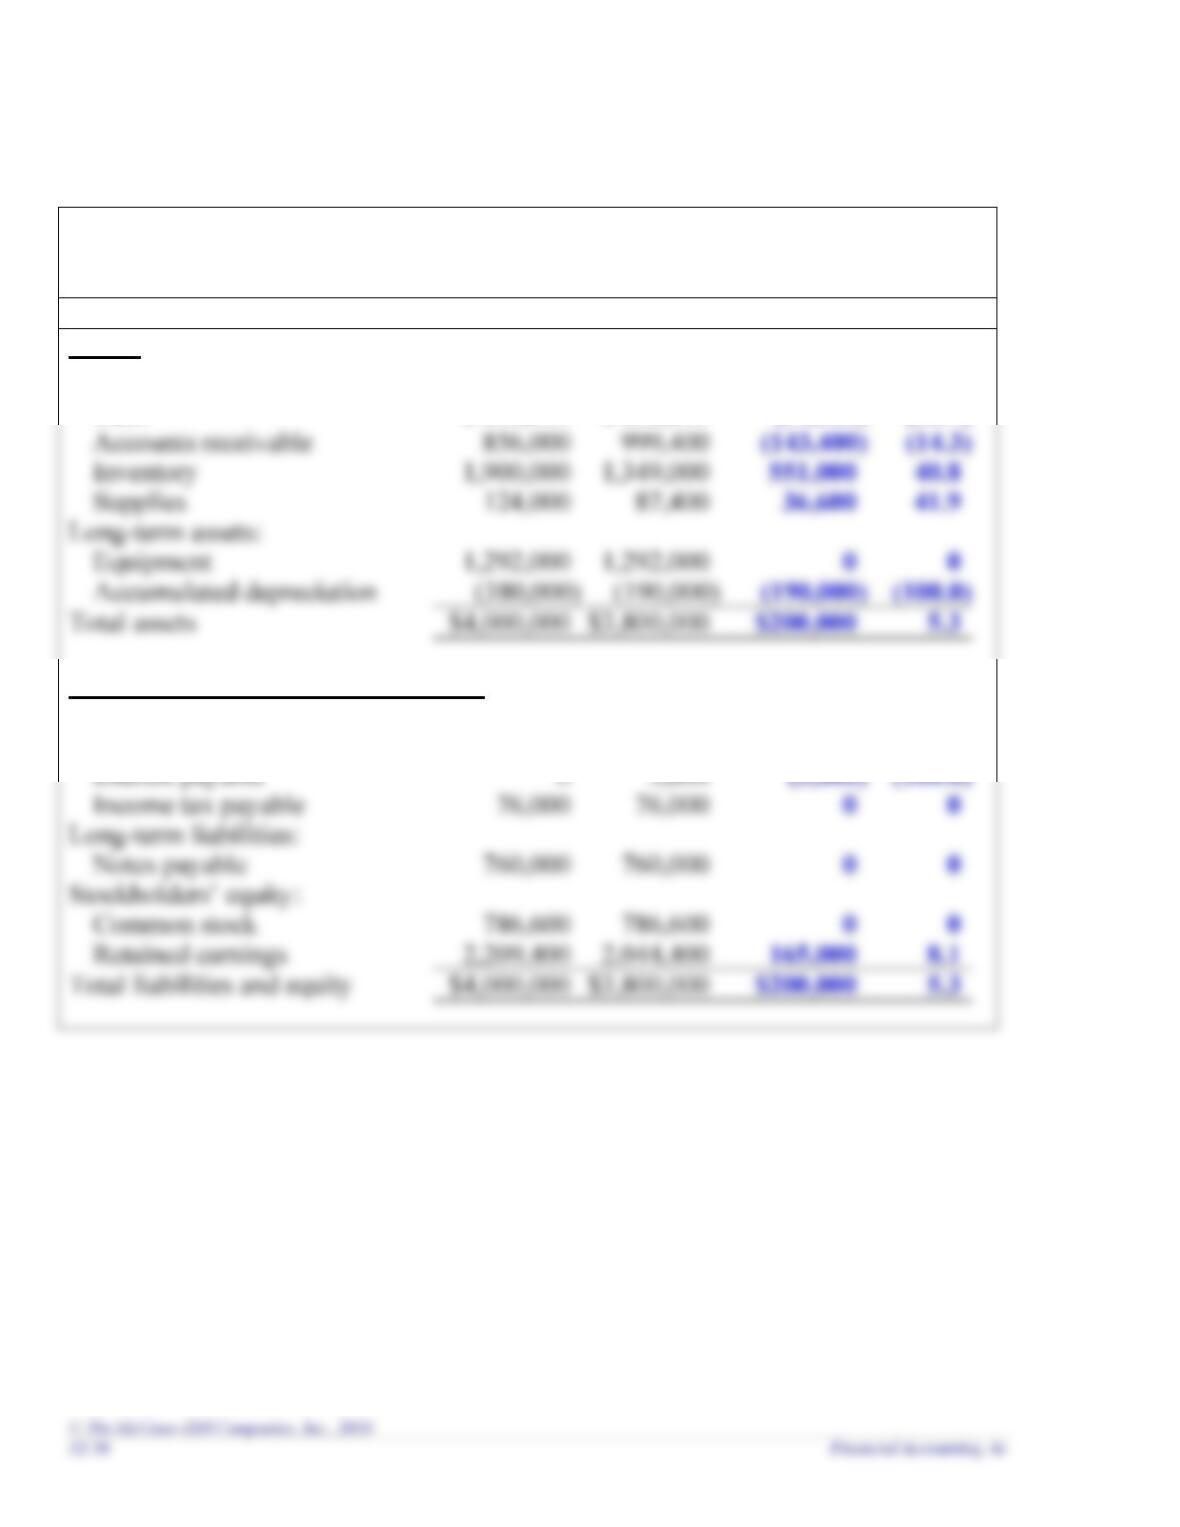
Fantasy Football
Balance Sheet
December 31
Year
Increase (Decrease)
Assets
2018
2017
Amount
%
Current assets:
Cash
$ 208,000
$ 262,200
(54,200)
(20.7)
Accounts receivable
Supplies
41.9
Long-term assets:
Equipment
Accumulated depreciation
Total assets
$3,800,000
Liabilities and Stockholders’ Equity
Current liabilities:
Accounts payable
$ 168,000
$ 129,200
38,800
30.0
Interest payable
Income tax payable
Long-term liabilities:
Notes payable
760,000
Common stock
Retained earnings
Total liabilities and equity
$3,800,000
Chapter 12 – Financial Statement Analysis
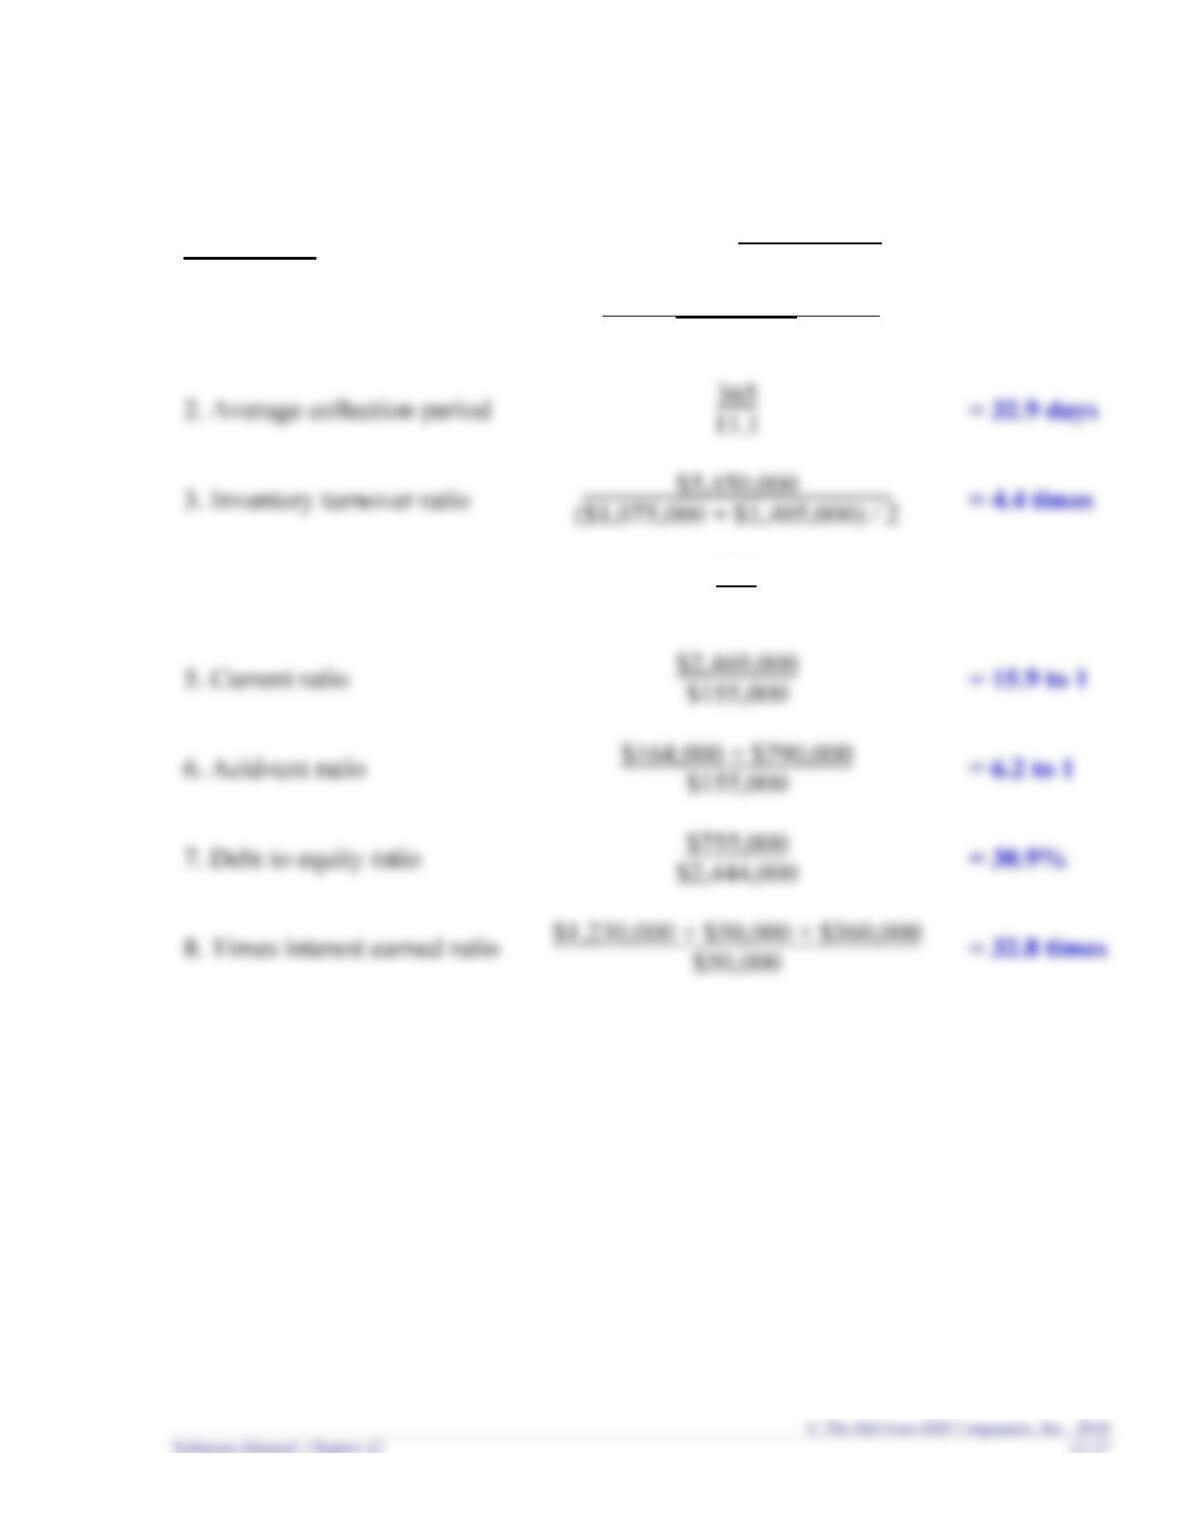
Problem 12-4B
Risk Ratios
Calculations
1. Receivables turnover ratio
$8,900,000
($810,000 + $790,000) / 2
= 11.1 times
2. Average collection period
= 32.9 days
4. Average days in inventory
365
4.4
= 83.0 days
5. Current ratio
= 15.9 to 1
6. Acid-test ratio
= 6.2 to 1
7. Debt to equity ratio
= 30.9%
8. Times interest earned ratio
= 32.8 times