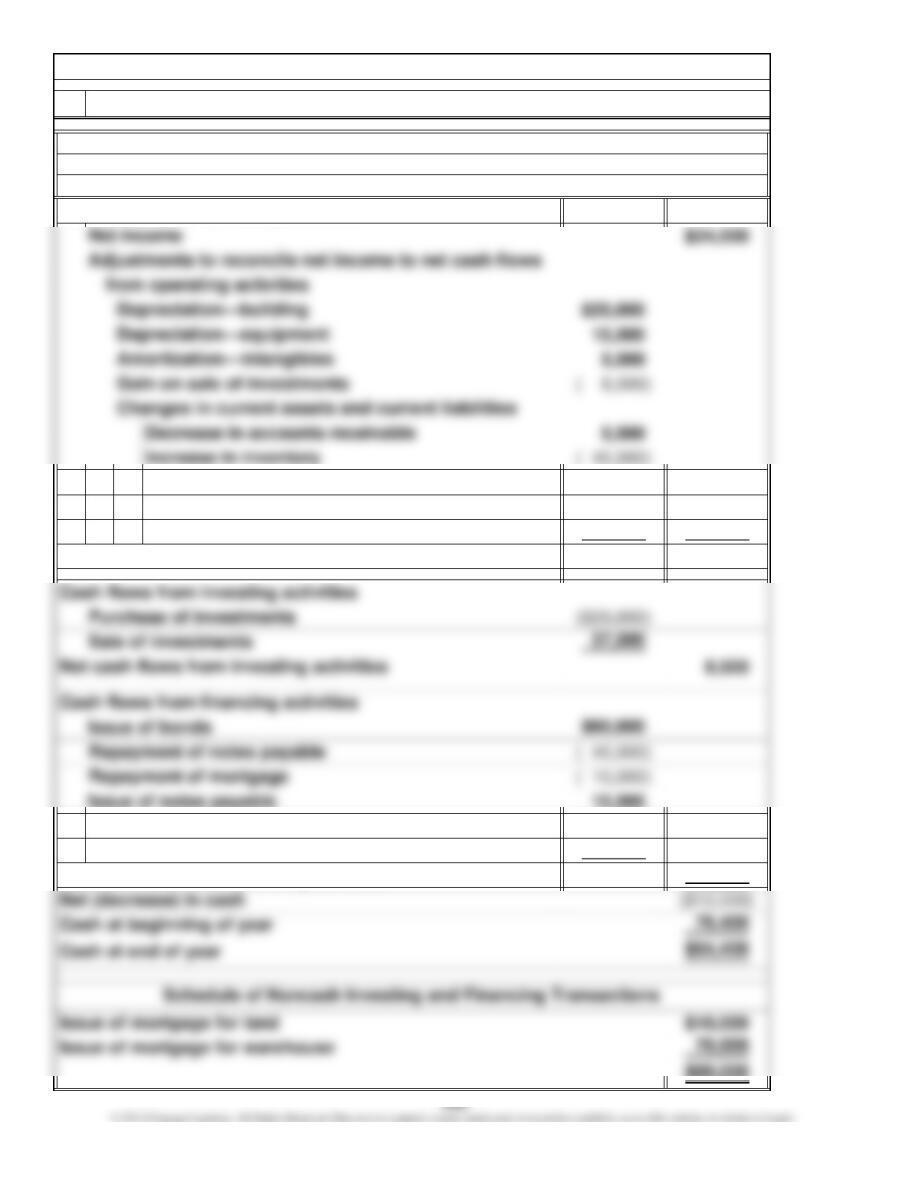
3,000
( 47,500)
( 2,500) ( 50,500)
($26,500)
( 5,000)
( 9,000)
6,000
Cash flows from operating activities
Carmelita Vases, Inc.
Chapter 12, P 5.
Statement of Cash Flows
1. Statement of cash flows prepared
Decrease in accounts payable
Decrease in accrued liabilities
Payment of dividends
For the Year Ended December 31, 2011
Purchase of treasury stock
Net cash flows from financing activities
Decrease in prepaid expenses
Net cash flows from operating activities
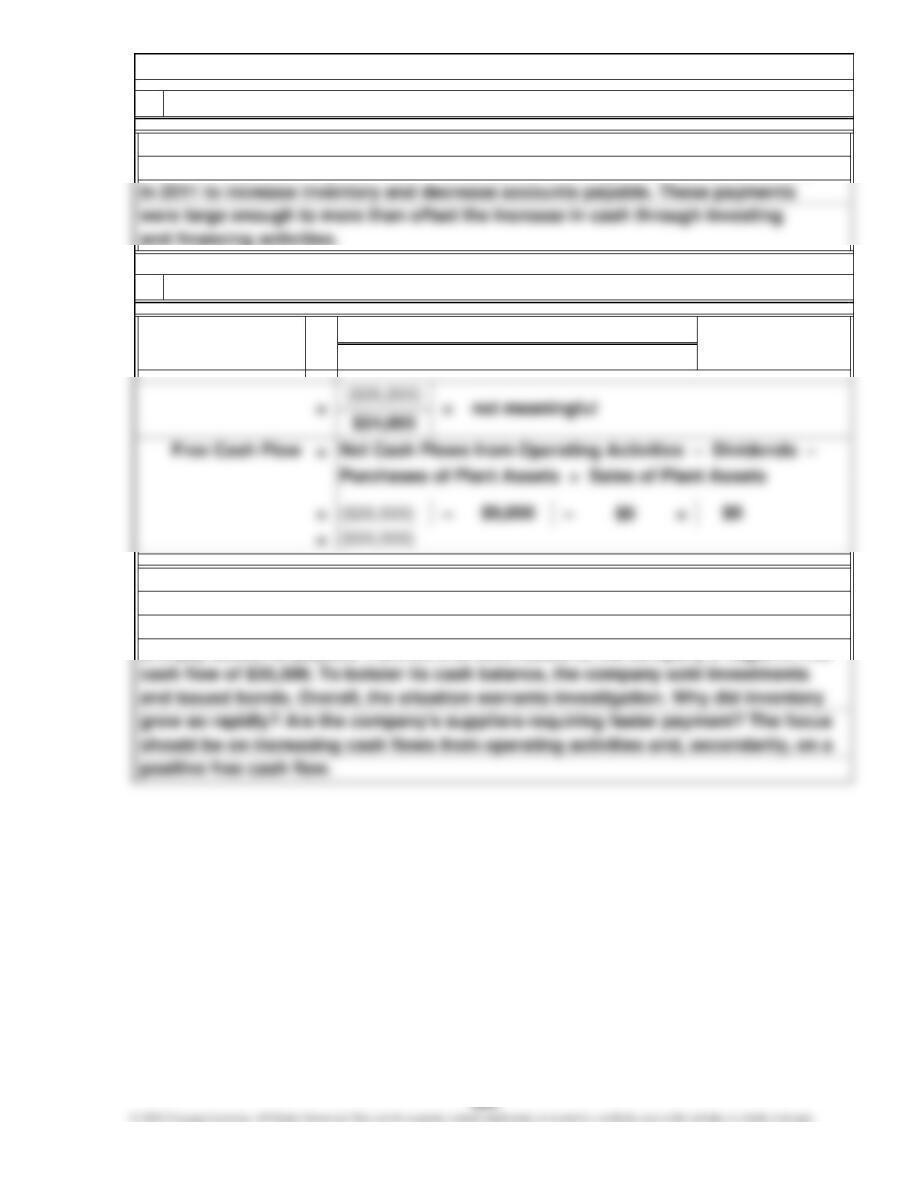
Net Income
3.
Net Cash Flows from Operating Activities
and pay accounts payable. Further, this contributed to the company’s negative free
divided into negative cash flow. The major uses of cash were to increase inventory
negative. The cash flow yield was not meaningful because a positive net income is
Despite a net income in 2011, Carmelita Vase’s cash flows from operations were
Chapter 12, P 5. (Continued)
Carmelita Vases, Inc., had a net decrease in cash as a result of large outflows of
Cash Flow Yield =
User Insight: Causes of decrease in cash identified2.
cash used by operating activities. The company used significant amounts of cash
User Insight: Computation and assessment of cash flow yield and free cash flow
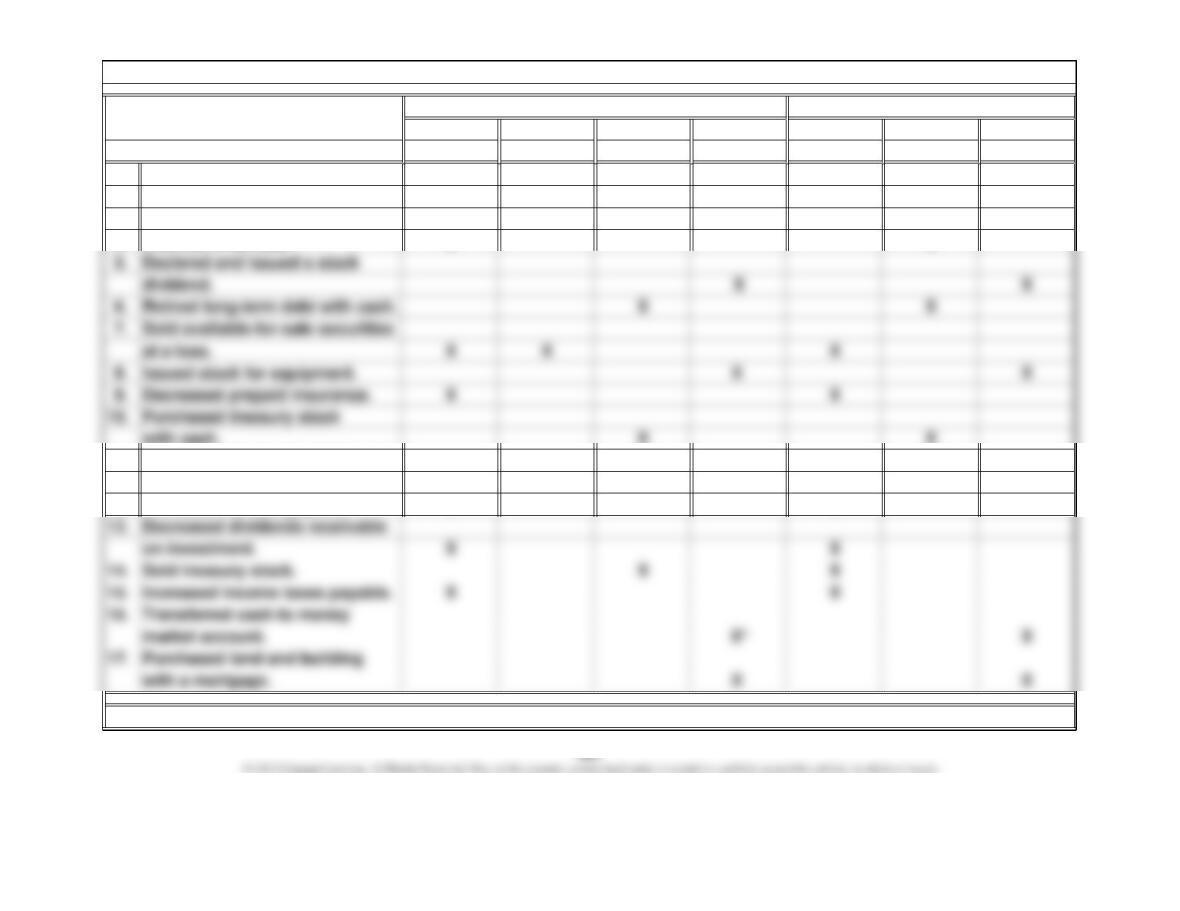
Operating Investing Financing Noncash
Activity Activity Activity Transaction Increase Decrease No Effect
1. Paid a cash dividend. X X
2. Decreased accounts receivable. X X
3. Increased inventory. X X
4. Incurred a net loss. X X
with cash. X X
11. Retired a fully depreciated truck
(no gain or loss). X X
12. Increased interest payable. X X
*Cash equivalent
Transaction
Chapter 12, P 6.
Cash Flow Classification Effect on Cash Flows
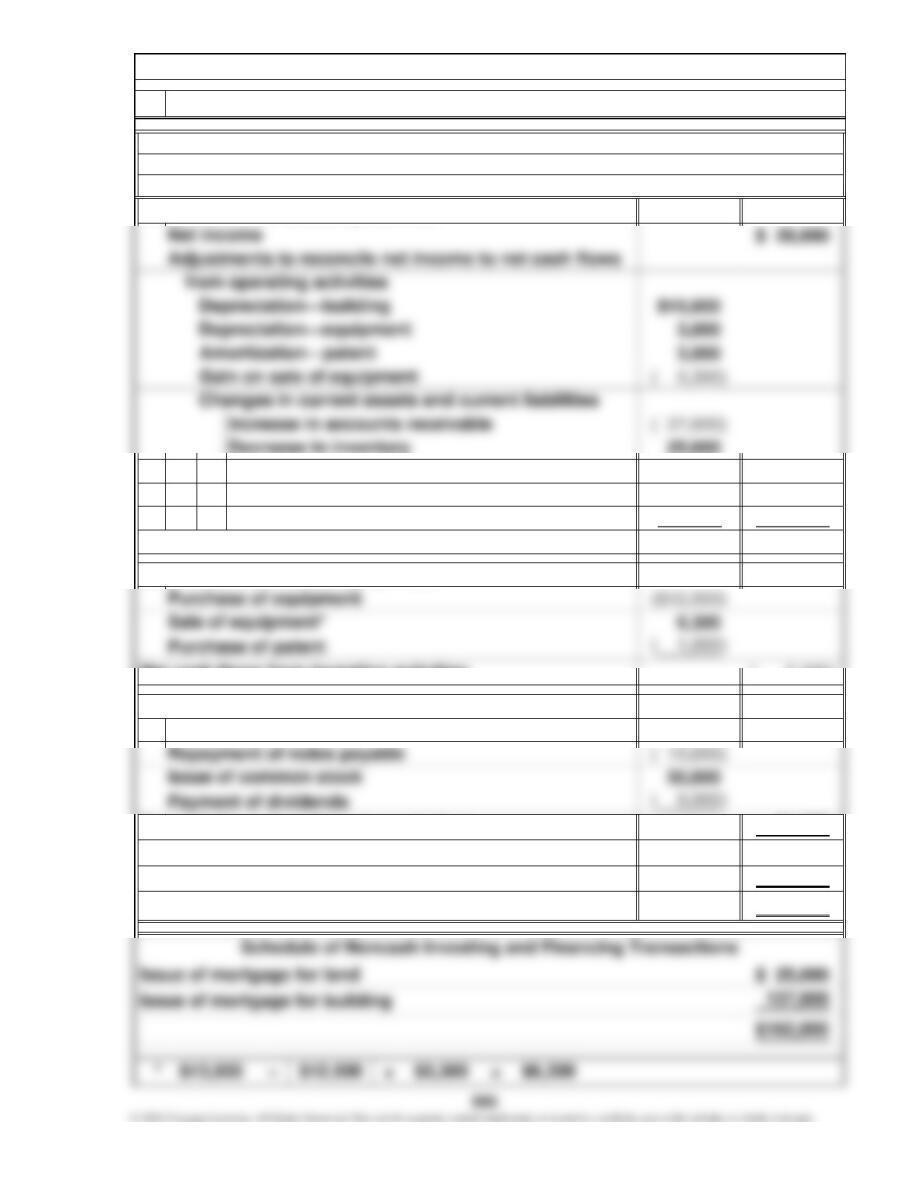
20,000
( 26,000)
( 12,300) ( 4,600)
$ 23,400
( 7,200)
$25,000
51,000
$ 67,200
27,360
$ 94,560
Cash flows from operating activities
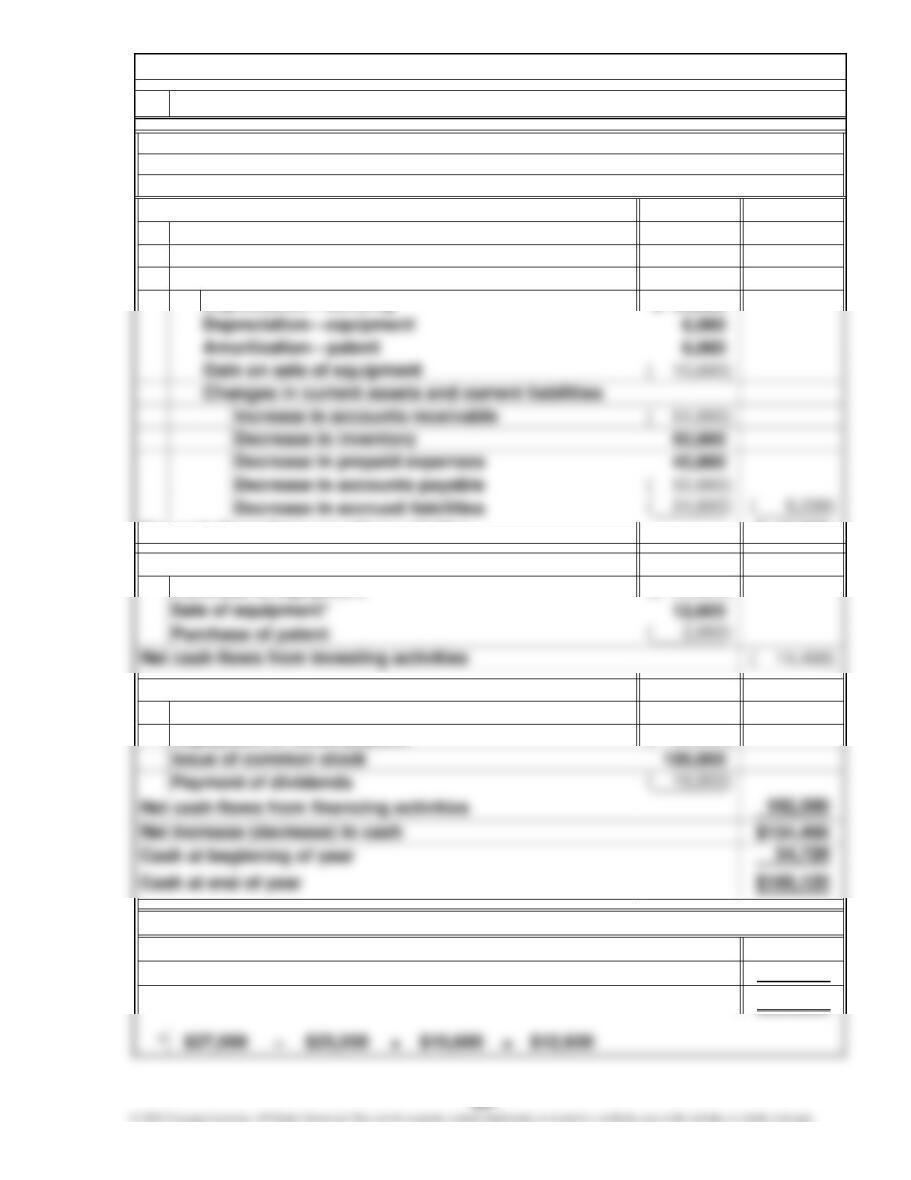
Zagloba Materials, Inc.
Chapter 12, P 7.
Statement of Cash Flows
For the Year Ended December 31, 2011
Decrease in accounts payable
Decrease in accrued liabilities
1. Statement of cash flows prepared
Cash flows from financing activities
Net cash flows from financing activities
Cash at end of year
Net cash flows from investing activities
Net increase in cash
Decrease in prepaid expenses
Net cash flows from operating activities
Issue of notes payable
Cash at beginning of year
Cash flows from investing activities
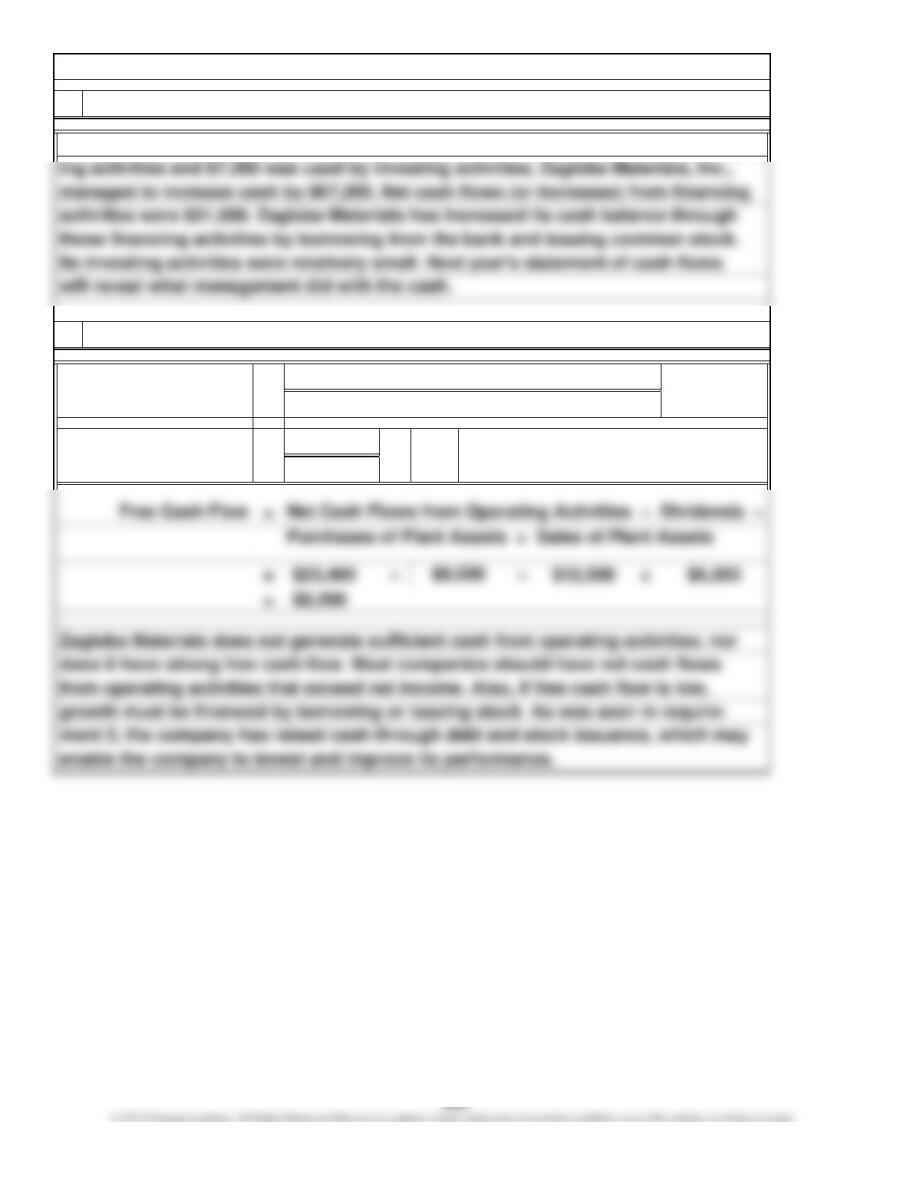
$23,400
$28,000
Cash Flow Yield = Net Cash Flows from Operating Activities
Net Income
==
3. User Insight: Computation and assessment of cash flow yield and free cash flow
0.8 Times
Chapter 12, P 7. (Continued)
User Insight: Causes of increase in cash identified2.
Although net income of $28,000 generated only $23,400 of cash flows from operat-
$ 56,000
$ 30,000
$ 46,800
($ 25,000)
$ 50,000
( 30,000)
$ 50,000
274,000
$324,000
Schedule of Noncash Investing and Financing Transactions
Cash flows from investing activities
Purchase of equipment
Issue of mortgage for land
Issue of mortgage for building
Cash flows from financing activities
Repayment of notes payable
Issue of notes payable
Cash flows from operating activities
Depreciation—building
Net cash flows from operating activities
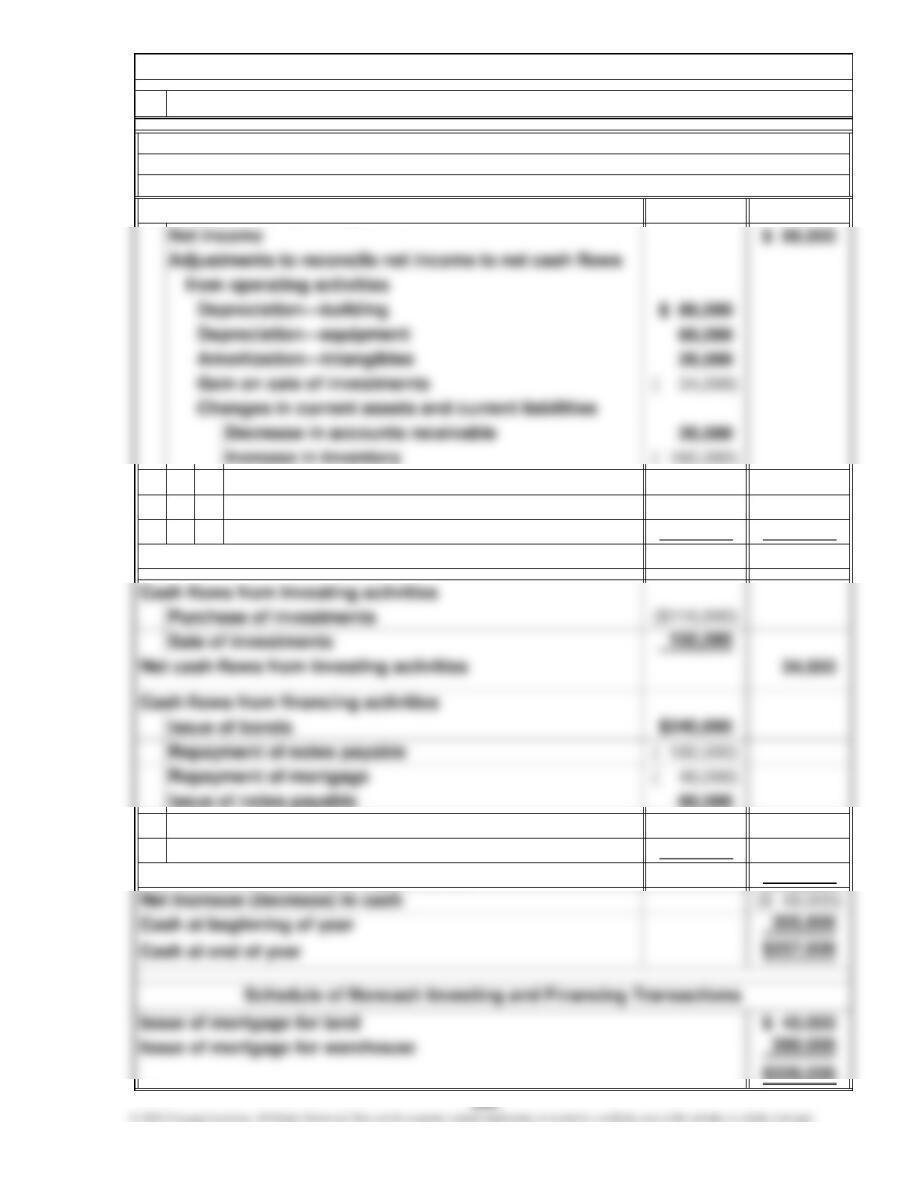
Sharma Fabrics, Inc.
Chapter 12, P 8.
1. Statement of cash flows prepared
For the Year Ended December 31, 2011
Net income
Adjustments to reconcile net income to net cash flows
from operating activities
Statement of Cash Flows
$46,800
$56,000
Chapter 12, P 8. (Continued)
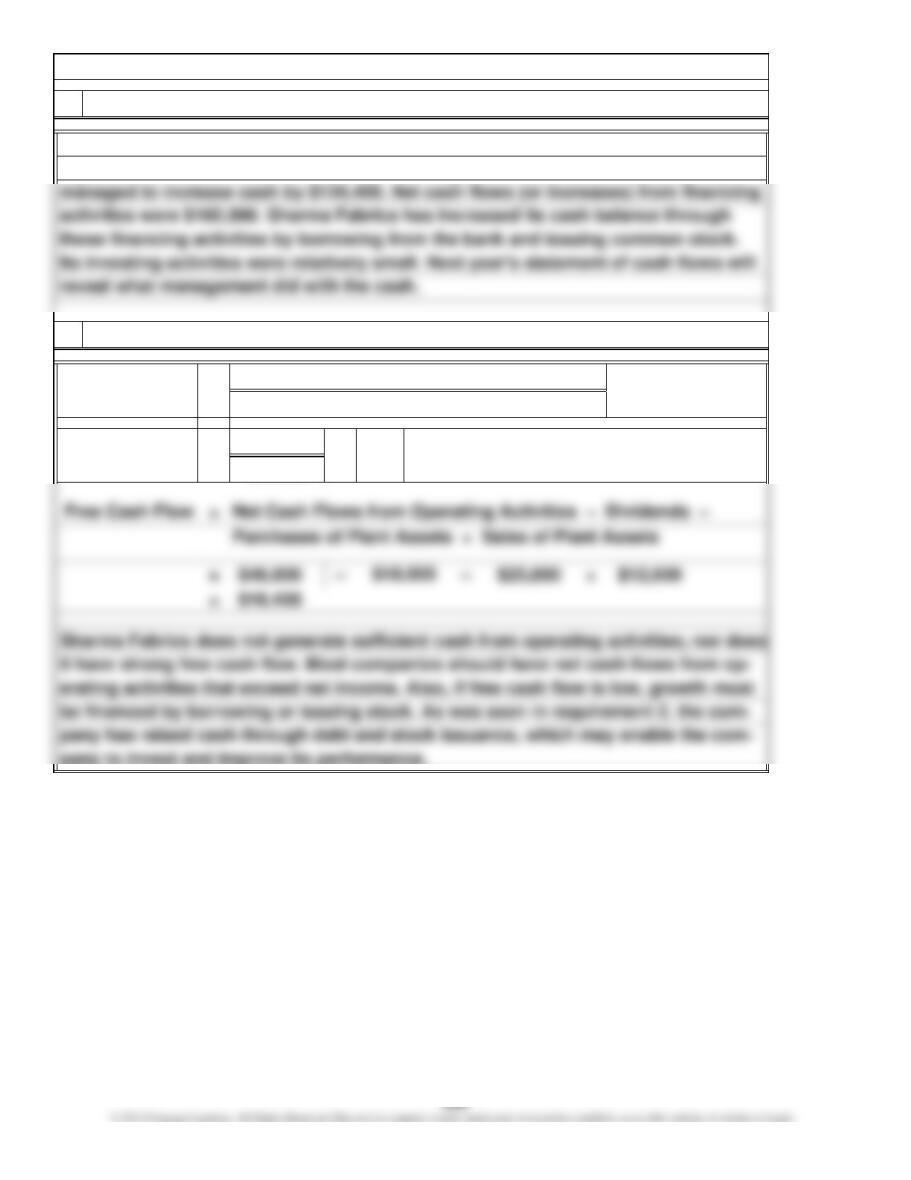
User Insight: Causes of increase in cash identified2.
Times=
3. User Insight: Computation and assessment of cash flow yield and free cash flow
ing activities and $14,400 was used by investing activities, Sharma Fabrics, Inc.,
Although net income of $56,000 generated only $46,800 of cash flows from operat-
pany to invest and improve its performance.
Net Income
Cash Flow Yield
0.8
Net Cash Flows from Operating Activities
=
=
12,000
( 190,000)
( 10,000) ( 202,000)
($106,000)
( 20,000)
( 36,000)
24,000
Net cash flows from operating activities
Net cash flows from financing activities
Decrease in prepaid expenses
Payment of dividends
Purchase of treasury stock
1. Statement of cash flows prepared
Cash flows from operating activities
Decrease in accounts payable
Decrease in accrued liabilities
Karidis Ceramics, Inc.
Chapter 12, P 9.
Statement of Cash Flows
For the Year Ended December 31, 2012
Chapter 12, P 9. (Continued)
3.
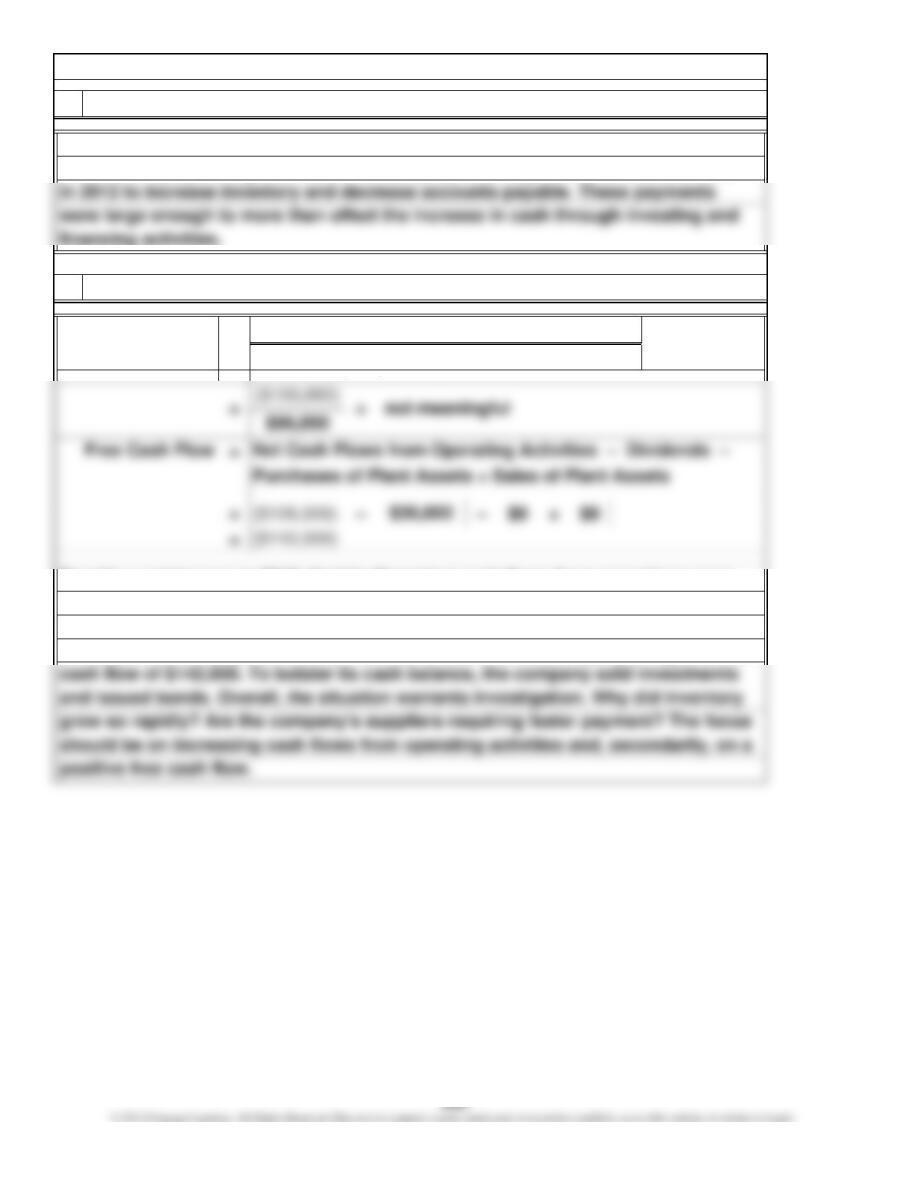
cash used by operating activities. The company used significant amounts of cash
User Insight: Computation and assessment of cash flow yield and free cash flow
User Insight: Causes of decrease in cash identified2.
Cash Flow Yield
and pay accounts payable. Further, this contributed to the company’s negative free
divided into negative cash flow. The major uses of cash were to increase inventory
Karidis Ceramics, Inc., had a net decrease in cash as a result of large outflows of
=
Despite a net income in 2012, Karidis Ceramics’ cash flows from operations were
negative. The cash flow yield was not meaningful because a positive net income is
Net Cash Flows from Operating Activities
Net Income
1.
2.
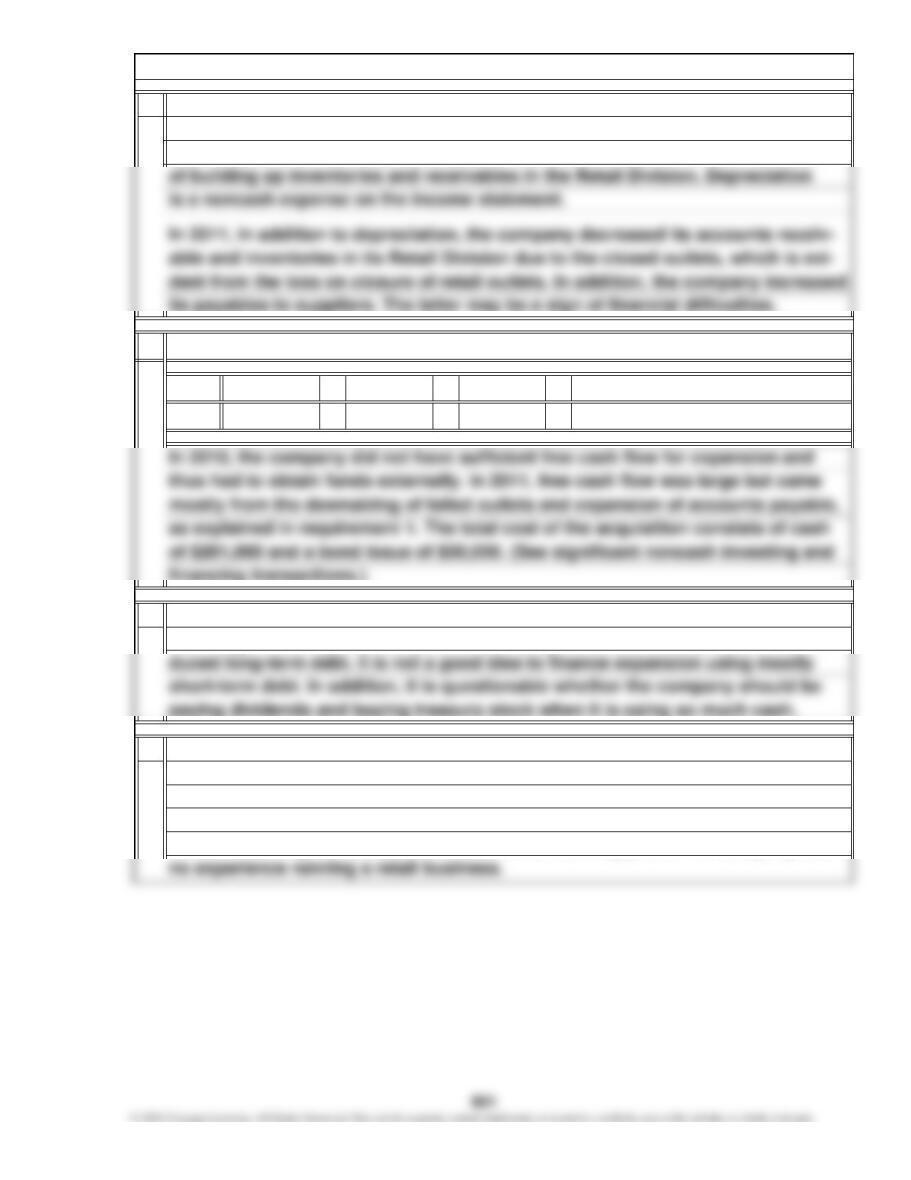
2010: ($ 38,472) – $19,973 – $33,112 =
2011: $184,227 – $22,924 – $16,145 =
3.
4.
Using the “law of large numbers,” the primary reasons for the difference between
net income and cash flows from operating activities in 2010 are depreciation
and increases in inventory and accounts receivable. The last two are the result
short-term bank notes. The entire strategy of diversification was not well thought
out. The company’s regular sales probably declined due to its traditional cus-
tomers resenting the competition from one of their suppliers. The company had
close outlets to reduce inventory and receivables to raise cash to pay off the
$145,158
The most significant financing activity by far was the increase in short-term bank
Chapter 12, P 10.
The company immediately began to lose money after the acquisition and had to
financing. The company also paid dividends, purchased treasury stock, and re-
($ 91,557)
Free Cash Flow
EBITDA (earnings before interest, taxes, depreciation, and amortization) is often
used in the financial press as a shortcut for cash flows from operating activities on
the statement of cash flows. It is not a good approximation because it leaves out
Chapter 12, C 1.
Net Cash Flows from Operating Activities
Net Income
$61,783
1.
Attachment
All dollar amounts are in millions.
Chapter 12, C 2.
=
Make required computations and label the document “Attachment”
Cash Flow Yield
Net Cash Flows from Operating Activities
Cash Flows to Assets = Total Assets
=
-1.2%
2001 = ($753)
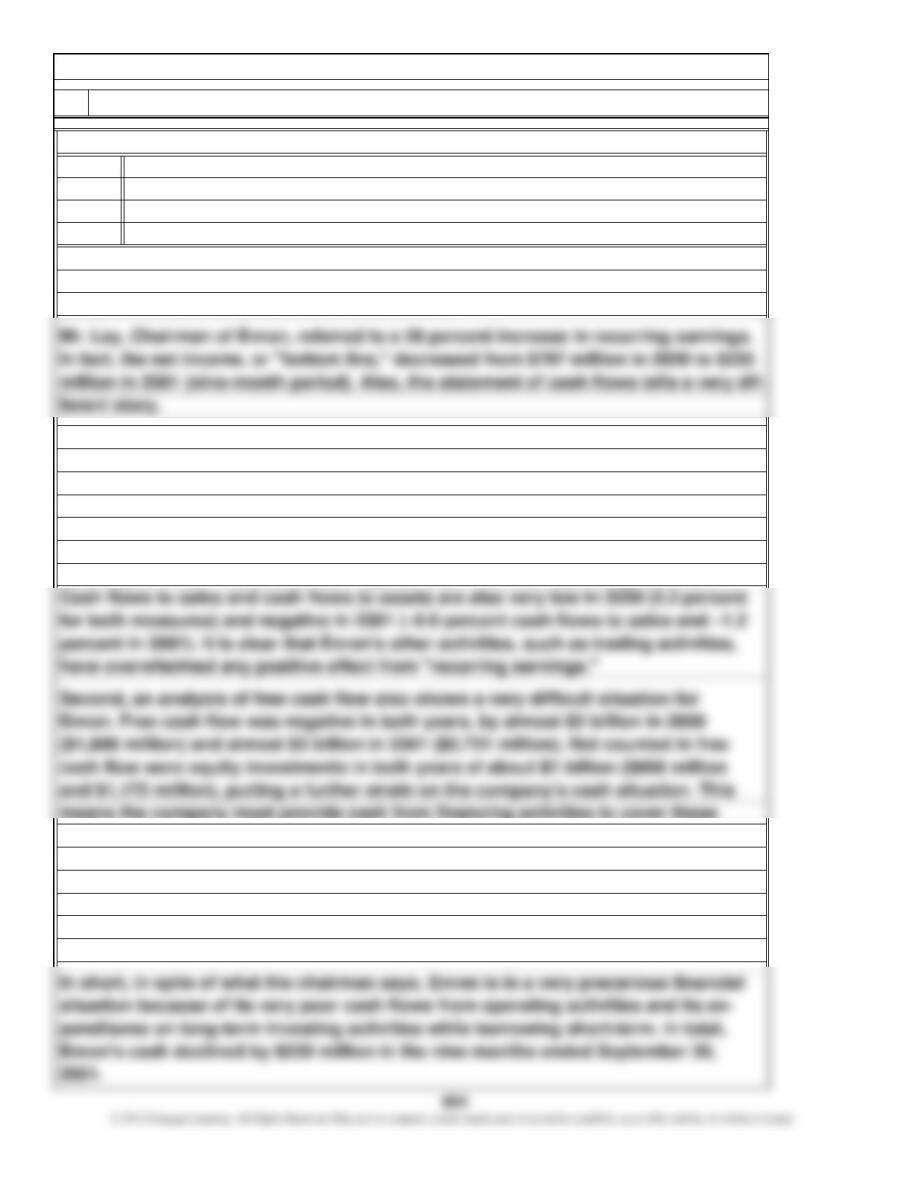
$2,365 million. Further demands on cash were the $394 million the company paid
cash flows. Enron’s statement of cash flows and the computation on which this
Re:
At your request, I have prepared an analysis of Enron Corporation’s statement of
Today’s Date
Investment Analyst
StudentFrom:
negative cash flows in 2001 were the net margin deposit activity (in connection
lion). These amounts were partially offset by the decline in receivables ($987 mil-
Chapter 12, C 2. (Continued)
Memorandum
Date:
To:
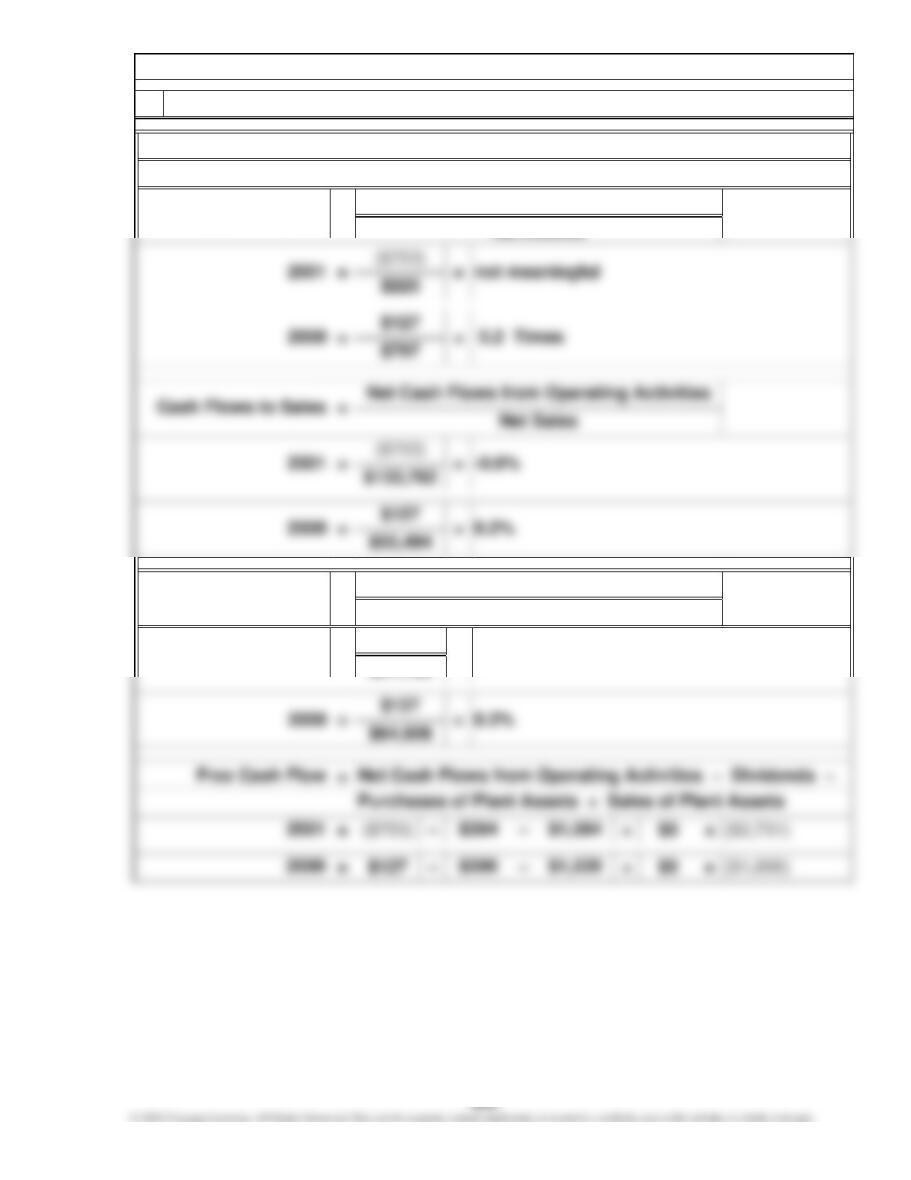
lion). The result is that cash flow yield is a very meager 0.2 times in 2000 and not
Assessment of Enron’s Statements of Cash Flows
analysis is based are presented in attachments.
First, net cash provided by operating activities was only $127 million in 2000 and
declined to a negative $753 million in 2001. The largest items accounting for the
with derivatives trading—$2,349 million) and the decline in payables ($1,764 mil-
meaningful in 2001 because of the negative cash flow from operating activities.
term and short-term borrowings, were able to make up for the shortfall. However,
in 2001, issuance and repayments of long-term debt were basically a wash. This
means the company relied heavily on short-term borrowings, which increased by
shortfalls in cash. In 2000, financing activities, mainly through increasing long-
2. Prepare a memorandum to the investment analyst
in dividends and the $398 million in treasury stock acquired in 2001.
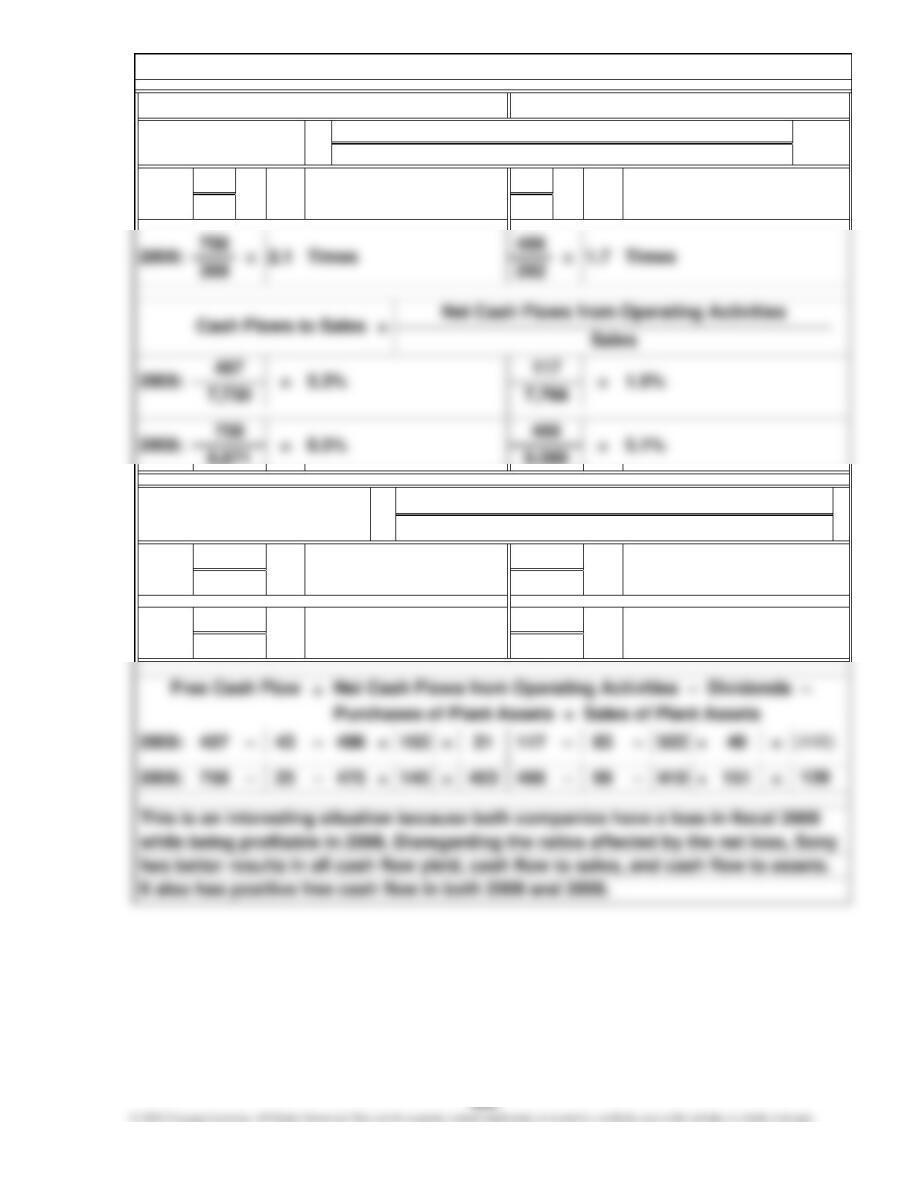
407 117
-99 -379
=
Cash Flows to Assets
9,069
=
758
Net Cash Flows from Operating Activities
Net Income
Times -0.3 Times2009: = -4.1
Chapter 12, C 3.
Cash Flow Yield =
Panasonic:
6,924
=117
8,871 =
Net Cash Flows from Operating Activities
7,671
2009: 407
3.3%
Average Total Assets
Sony (amounts in billions of yen):
2008:
=
6.1%6.2%
1.7%
12,284
466 =
=
12,135
$120,000
( 48,000)
($ 16,000)
$400,000
Net (decrease) in cash
Schedule of Noncash Investing and Financing Transactions
Issue of mortgage for building
Statement of Cash Flows
For the Year Ended December 31, 2011
Adjustments to reconcile net income to net cash
Net income
Chapter 12, C 4.
1. Statement of cash flows prepared
Roll Print Gallery, Inc.
Cash flows from investing activities
Payment of dividends
Cash flows from operating activities
flows from operating activities
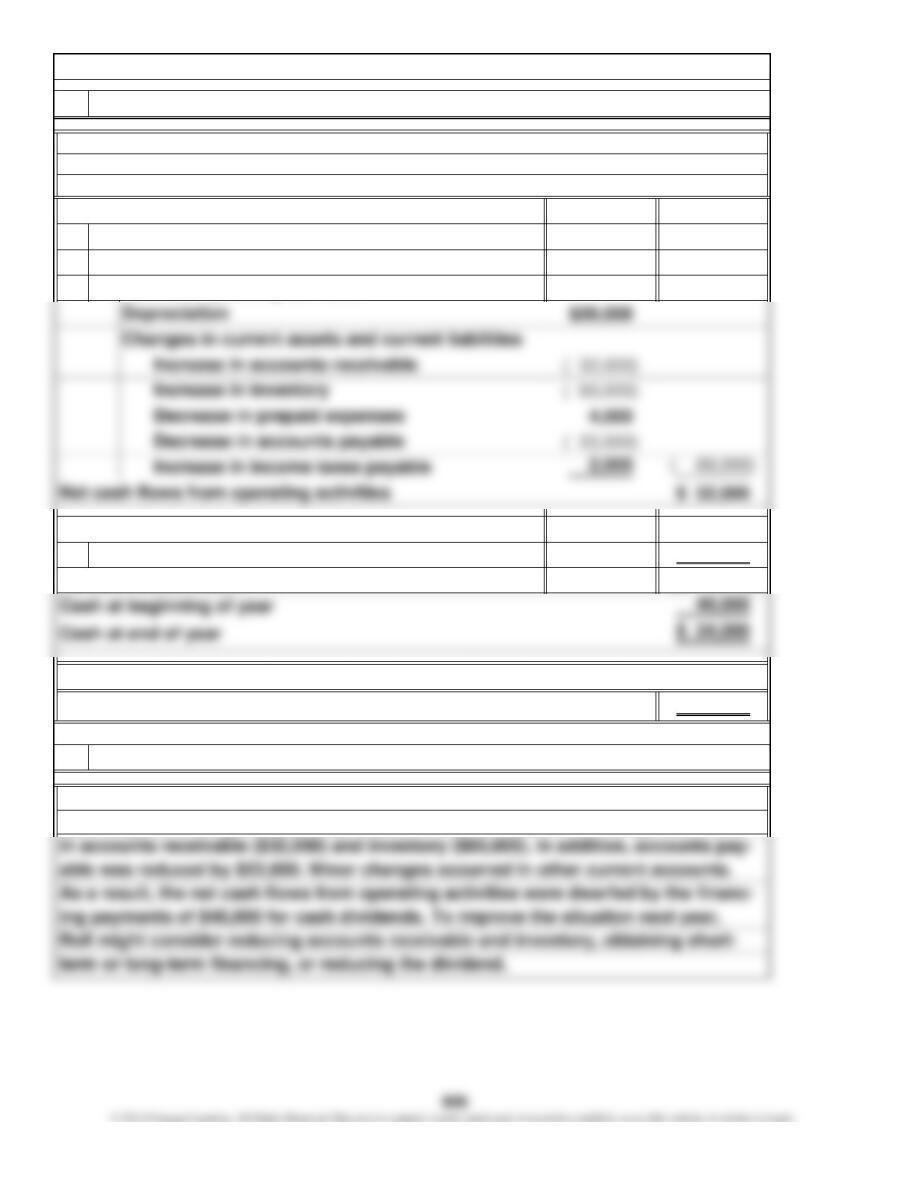
2. Cash problem explained
Although Roll earned $120,000 and had $20,000 of depreciation during the year,
operating activities generated only $32,000 in cash because of the large increases
1.
2.
3.
Chapter 12, C 5.
bottom of the statement. This reconciliation uses the indirect method and should
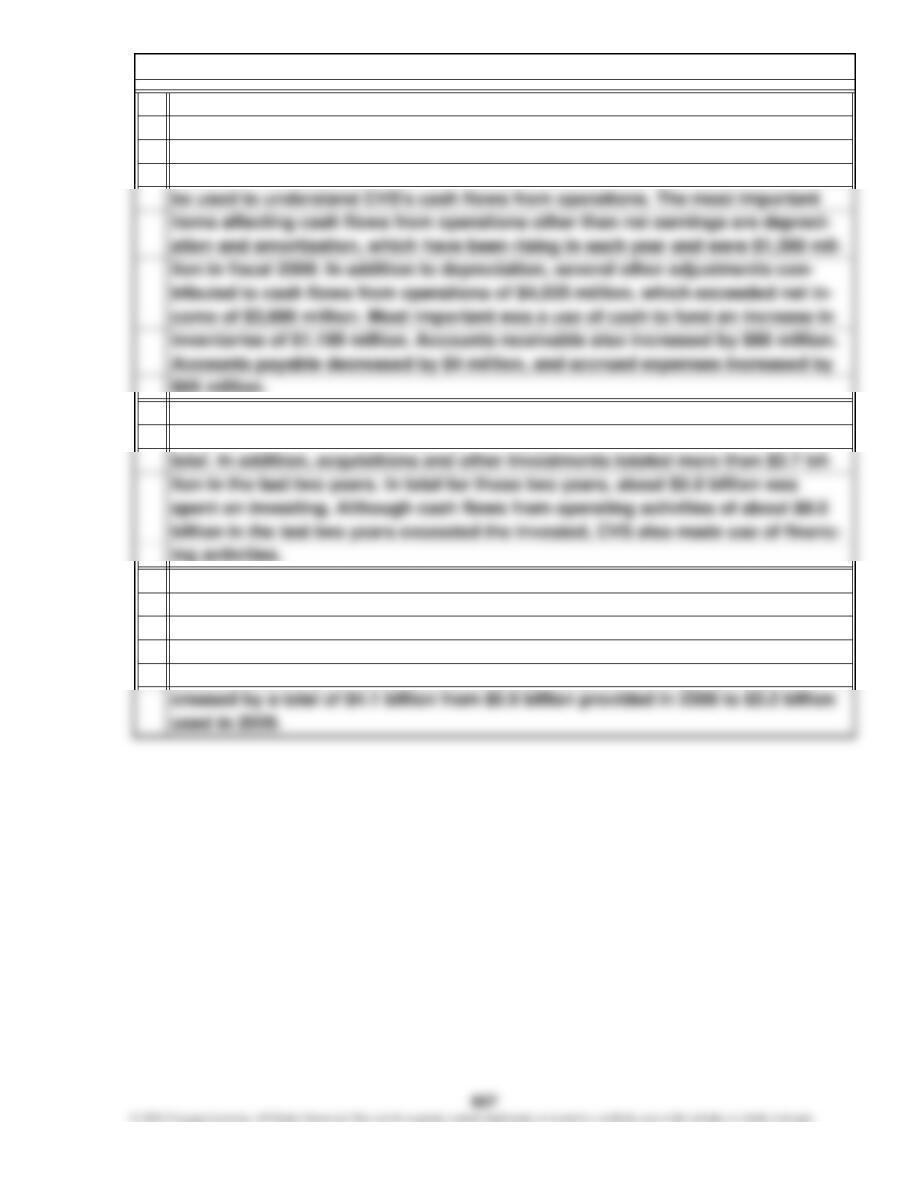
No, CVS uses the direct method of reporting cash flows from operating activi-
ties. In order to understand the difference between net income and net cash pro-
vided by operating activities, it is necessary to look at the reconciliation at the
billion in the last two years. The other large item was the repurchase of common
CVS is definitely an expanding company. In each of the last two years, the com-
Indeed, CVS was active in its financing activities. In total in the last two years,
totaled only $0.7 billion. Also, the increase in short-term debt totaled over $3.7
stock of $2.5 billion in 2009. Overall, net cash used in financing activities in-
the company had additions to long-term debt of $3.2 billion, while reductions
pany has had additions to property and equipment that exceeded $4.7 billion in
=
Chapter 12, C 6.
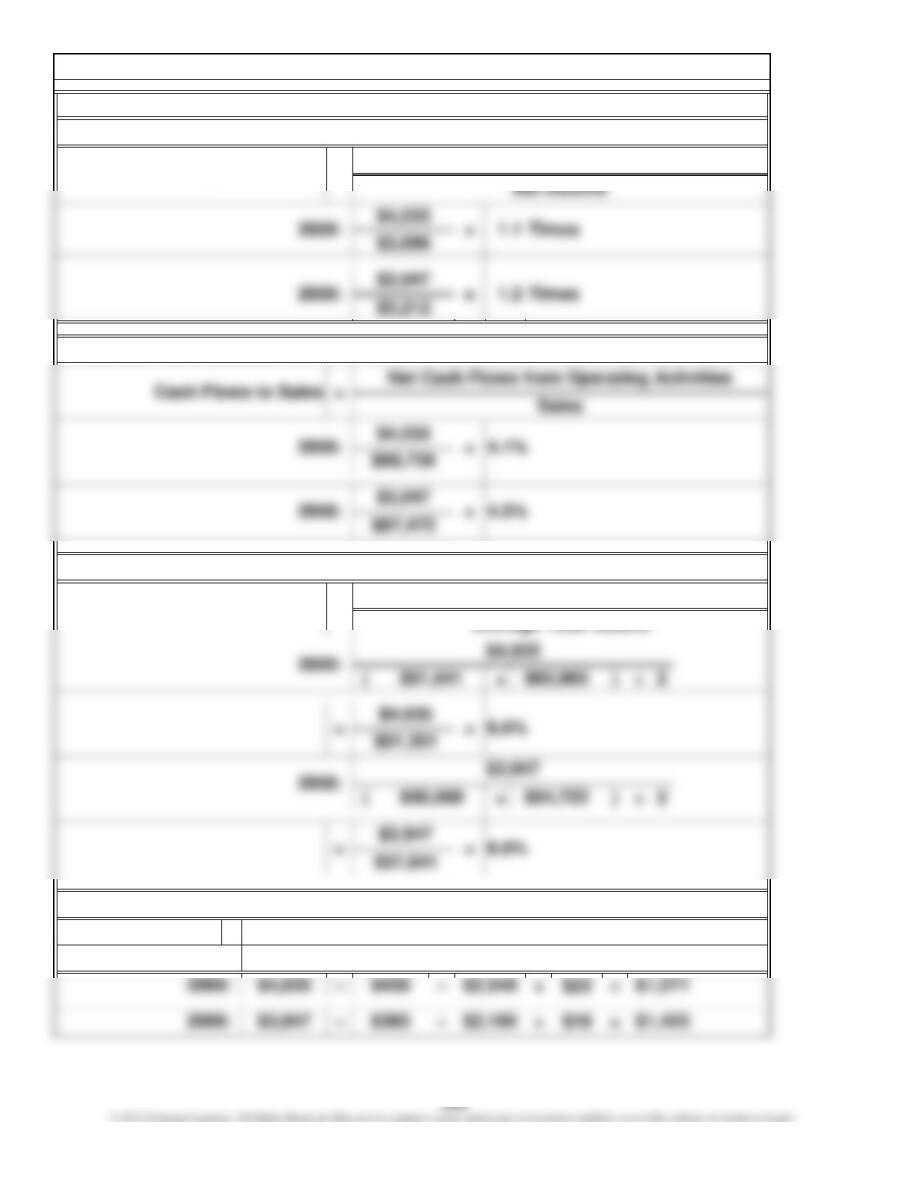
=Cash Flow Yield
(dollars in millions)
CVS’s cash flow yield:
Net Cash Flows from Operating Activities
CVS’s cash flows to sales:
Cash Flows to Assets
CVS’s cash flows to assets:
Net Cash Flows from Operating Activities
=
– Purchases of Plant Assets + Sales of Plant Assets
CVS’s free cash flow:
Free Cash Flow
Net Cash Flows from Operating Activities – Dividends
=
Net Cash Flows from Operating Activities – Dividends
Free Cash Flow
– Purchases of Plant Assets + Sales of Plant Assets
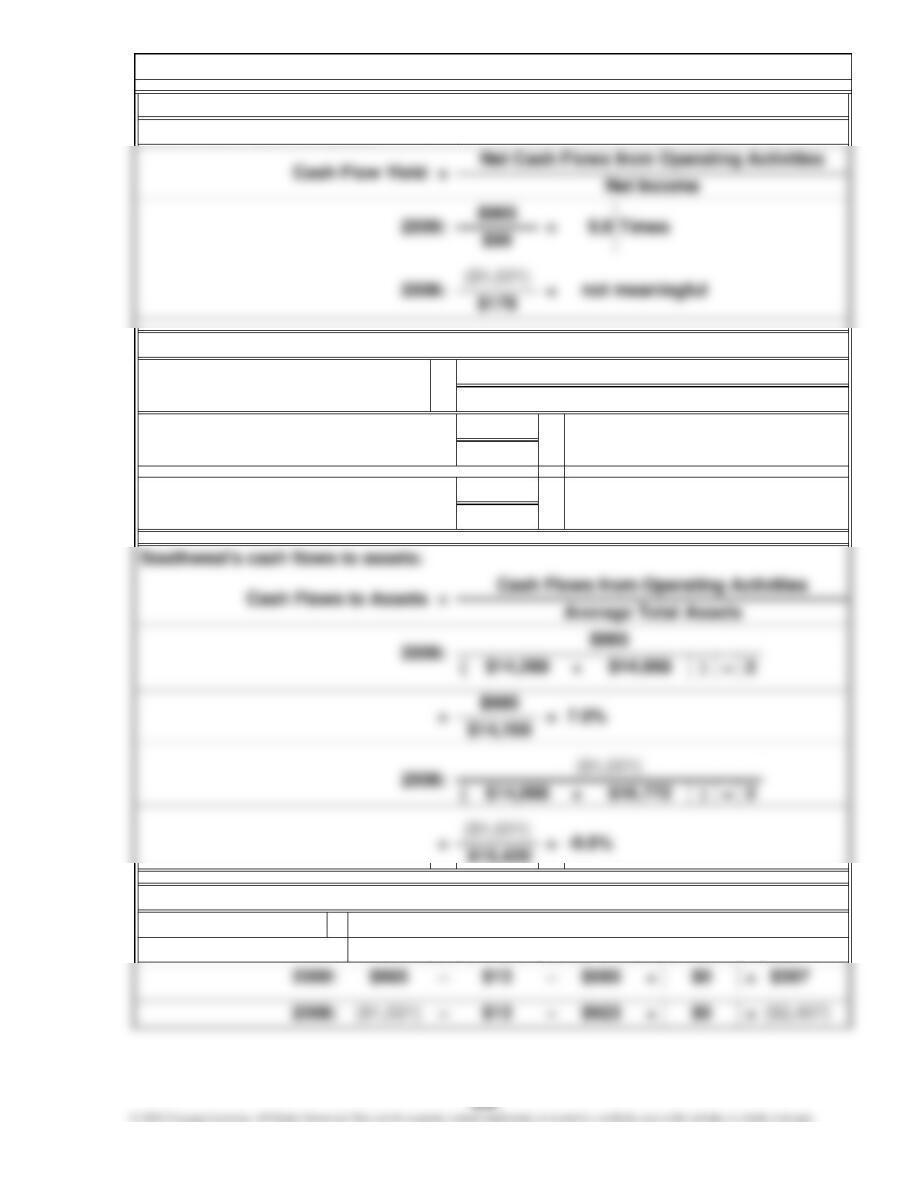
Southwest’s free cash flow:
=
$11,023
Southwest’s cash flow yield:
Chapter 12, C 6. (Continued)
(dollars in millions)
2008:
=
Cash Flows to Sales =
-13.8%
($1,521)
Sales
Net Cash Flows from Operating Activities
Southwest’s cash flows to sales:
2009: 9.5%
$10,350
$985
Chapter 12, C 6. (Continued)
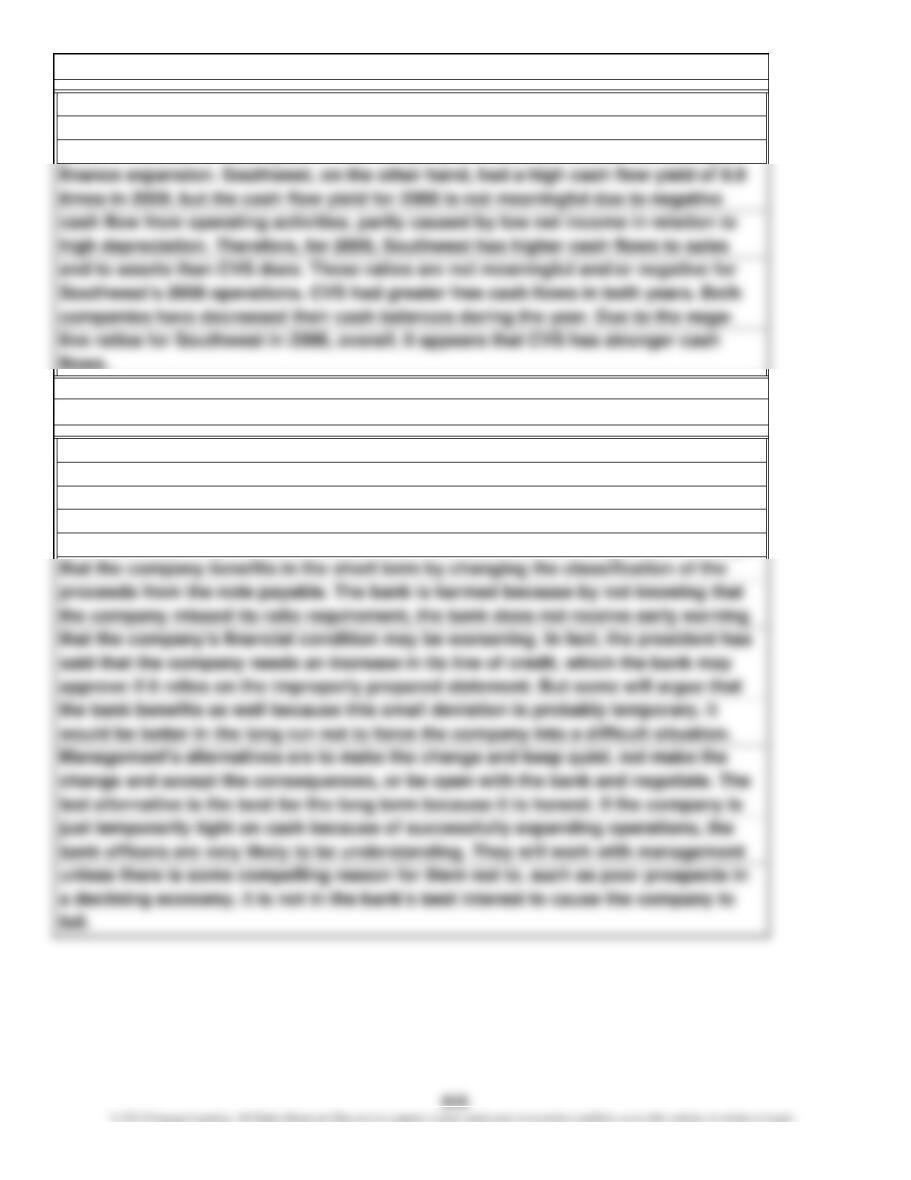
flows.
the note is for only two years and is “close” to being a current liability. Allowances
years in relation to asset growth. The company will need to continue borrowing to
CVS’s cash flow yield exceeds 1.0 times but is not sufficient to generate high cash
flows to sales or to assets. In addition, free cash flow was relatively low in both
for judgment would permit the reclassification. Also, the 3.0 ratio requirement is
Students will disagree on this case. Some will think the president’s order is tanta-
mount to lying. Others will see it as the practical thing to do, especially given that
Chapter 12, C 7.
quite arbitrary. Why risk a serious situation over such a small thing? Most will argue