1. b 4.
(+) ÷2
Cash Flows to Assets Net Cash Flows from Operating Activities
Average Total Assets
Chapter 12, SE 1.
=
=
CHAPTER 12—Solutions
The Statement of Cash Flows
Chapter 12, SE 2.
d
=
=
Cash Flow Yield
$275,000
$250,000
34.3%
Net Cash Flows from Operating Activities
Net Income
$90,000
() ÷2
Chapter 12, SE 3.
=
Cash Flows to Assets =
Average Total Assets
$825,000 +
=
$750,000
Cash Flow Yield
Net Cash Flows from Operating Activities
Net Income
34.3%
$270,000 =
Net Cash Flows from Operating Activities
$66,000
Cash flows from operating activities
Net income
For the Year Ended December 31, 2011
Chapter 12, SE 5.
Chapter 12, SE 4.
$50,000 decrease in accounts payable. The cash flows to assets is slightly larger
than cash flows to sales because the asset turnover is slightly more than 1. Be-
Titan Corporation experienced this unfavorable yield primarily because of a
are only 70 percent of earnings. A yield of less than 1 signals potential problems.
The cash flow yield is 0.7 times, which indicates that cash flows from operations
Schedule of Cash Flows from Operating Activities
Express Corporation
cause cash flow yield is less than 1, we know that profit margin and return on
$144,000
$16,000
Adjustments to reconcile net income to net cash flows
from operating activities
Schedule of Cash Flows from Operating Activities
For the Year Ended December 31, 2011
Cash flows from operating activities
Net income
Minh Corporation
Chapter 12, SE 6.
Depreciation
$216,000
$143,000
( 188,000)
Chapter 12, SE 7.
Schedule of Cash Flows from Operating Activities
For the Year Ended December 31, 2011
Pilch Corporation
Adjustments to reconcile net income to net cash flows
from operating activities
Cash flows from operating activities
Net income
Chapter 12, SE 8.
Sale of equipment
Purchase of land (see below)
Cash flows from investing activities
$ 95,000
$480,000
in the cash flows from operating activities section.)
Cash flows from financing activities
Chapter 12, SE 9.
Issuance of bonds*
Chapter 12, SE 10.
Cash flows from investing activities
Sale of building
$735,000
1. 5.
Chapter 12, SE 12.
a
c
Chapter 12, SE 11.
(Note: Interest paid appears in the cash flows from operating activities section.)
Cash flows from financing activities
Issuance of bonds*
*$750,000 × 98% = $735,000
1.
2.
1.
1. c 6. d 11. a
Chapter 12, E 3.
Chapter 12, E 2.
If a company has large gains, large increases in current assets, or decreases in
to the goal of profitability, whereas the statement of cash flows is more closely
tied to the goal of liquidity.
The change in cash from year to year, while important, can easily be obtained
from the comparative balance sheets. What is important from the statement of
Chapter 12, E 1.
The statements are equally useful. The income statement relates most directly
=
=
Chapter 12, E 4.
Cash Flow Yield
Net Income
=
=
$98,000
Net Cash Flows from Operating Activities
1.4 Times
$70,000
Free Cash Flow
Net Cash Flows from Operating Activities – Dividends –
Purchases of Plant Assets + Sales of Plant Assets
$1,200,000
$820,000
$82,000
Cash flows from operating activities
For the Year Ended December 31, 2011
flows from operating activities
Net income
Adjustments to reconcile net income to net cash
Lambda Corporation
Cash flows from operating activities
Net income
Adjustments to reconcile net income to net cash
Depreciation
Changes in current assets and current liabilities
Schedule of Cash Flows from Operating Activities
flows from operating activities
Chapter 12, E 5.
Schedule of Cash Flows from Operating Activities
For the Year Ended December 31, 2011
Sunderland Chemical Company
Chapter 12, E 6.
$14,800
2,000
( 1,200) 12,800
$27,600
Cash flows from operating activities
For the Year Ended June 30, 2011
Decrease in income taxes payable
Net cash flows from operating activities
Chapter 12, E 7.
Schedule of Cash Flows from Operating Activities
Freed Corporation
Net income
Adjustments to reconcile net income to net cash flows
from operating activities
Increase in salaries payable
Chapter 12, E 8.
Cash flows from investing activities
Purchase of plant assets (a)
Sale of plant assets (b)
a.
b.
$36,000
($67,200)
Cash flows from investing activities
Chapter 12, E 9.
T account shows total purchases of plant assets of $67,200, which is an out-
flow of cash.
lated depreciation of $29,400. The income statement shows a $8,800 gain on
Chapter 12, E 10.
T accounts show disposal of plant assets that cost $46,000 and had accumu-
25,400
Issue of notes payable
Cash flows from financing activities
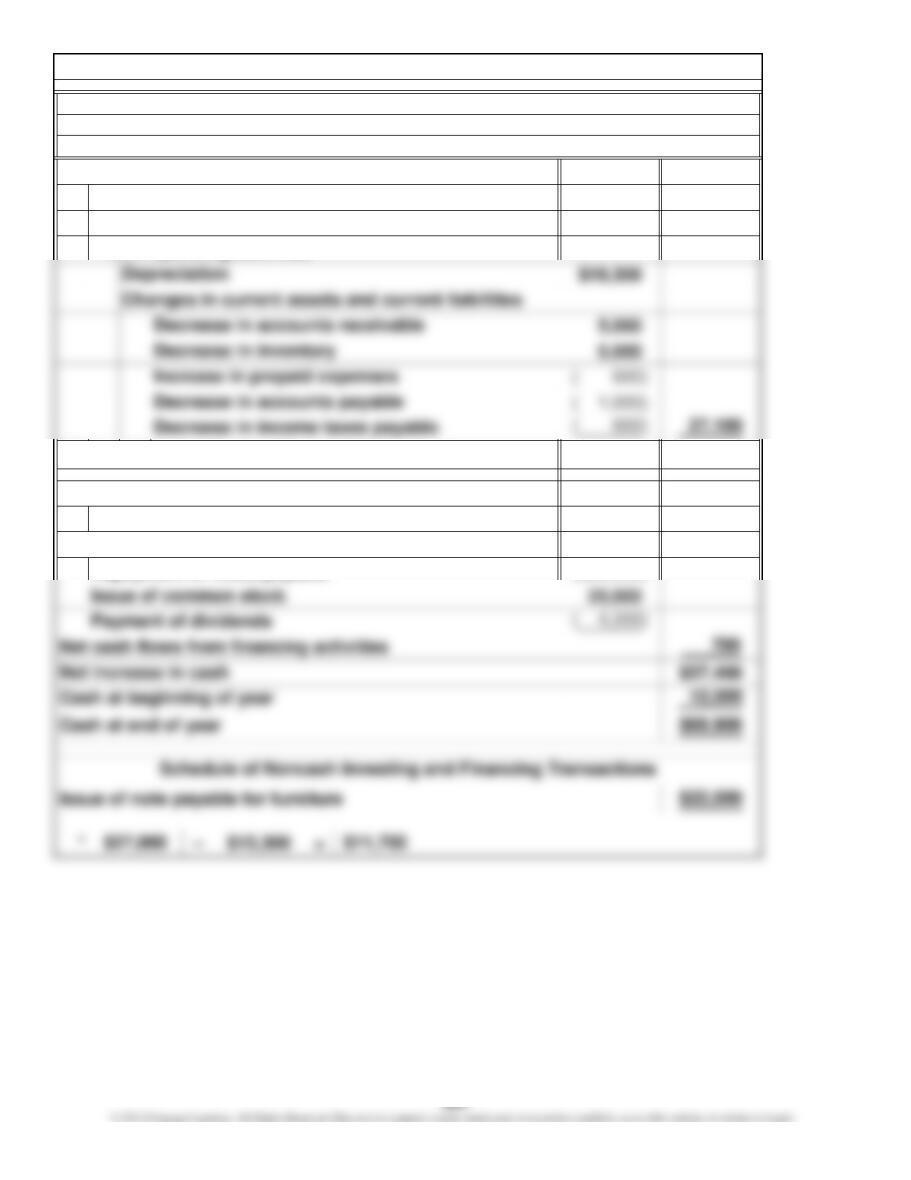
$17,900
$45,000
11,700
($20,000)
Bristol Corporation
Chapter 12, E 11.
Statement of Cash Flows
For the Year Ended June 30, 2011
Adjustments to reconcile net income to net cash flows
Cash flows from operating activities
Net income
from operating activities
Net cash flows from operating activities
Sale of furniture*
Cash flows from investing activities
Cash flows from financing activities
Repayment of notes payable
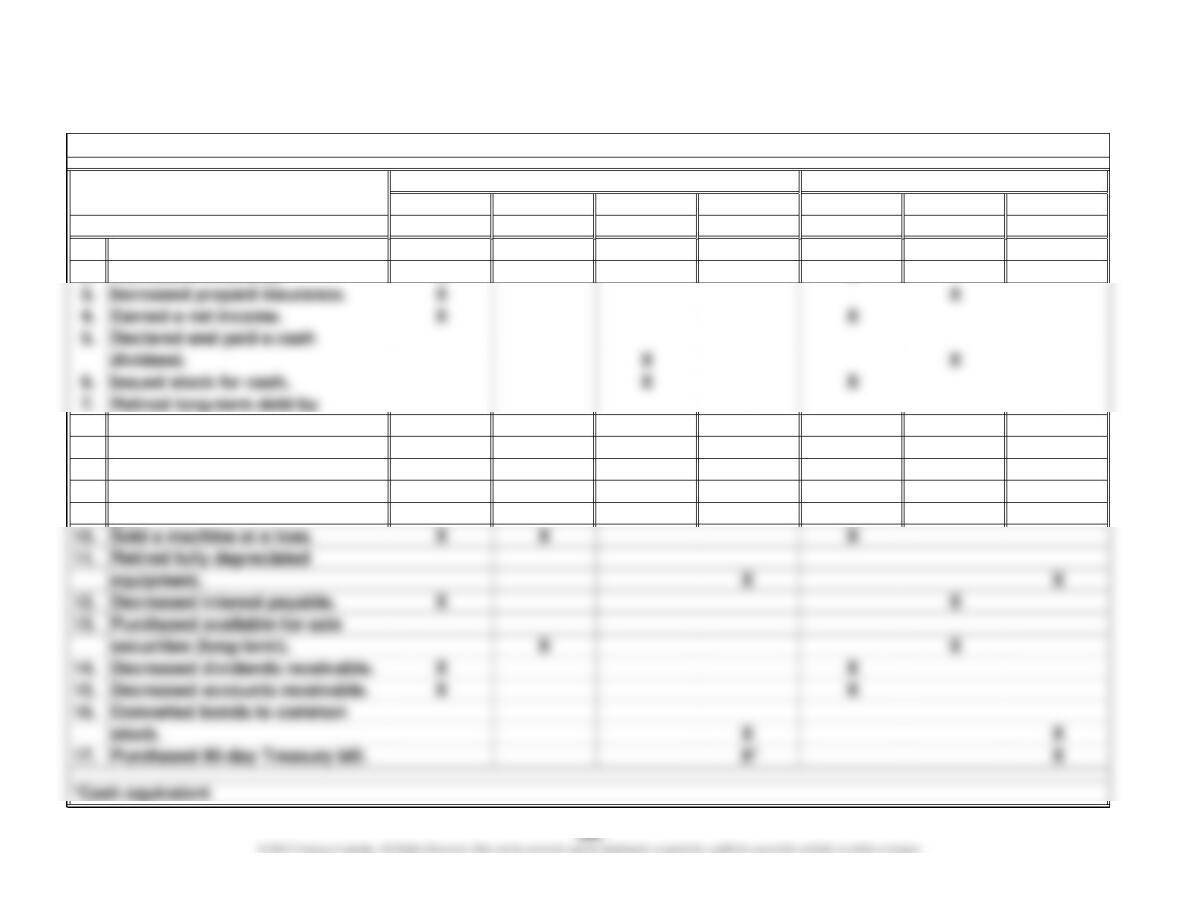
Operating Investing Financing Noncash
Activity Activity Activity Transaction Increase Decrease No Effect
1. Increased accounts payable. X X
2. Decreased inventory. X X
issuing stock. X X
8. Purchased a long-term invest-
ment with cash. X X
9. Sold trading securities at a
gain. X X
Chapter 12, P 1.
Cash Flow Classification Effect on Cash Flows
Transaction
1.
2.
2010: ($ 71,446) – $39,640 – $60,890 =
2011: $364,300 – $45,400 – $31,200 =
3.
4.
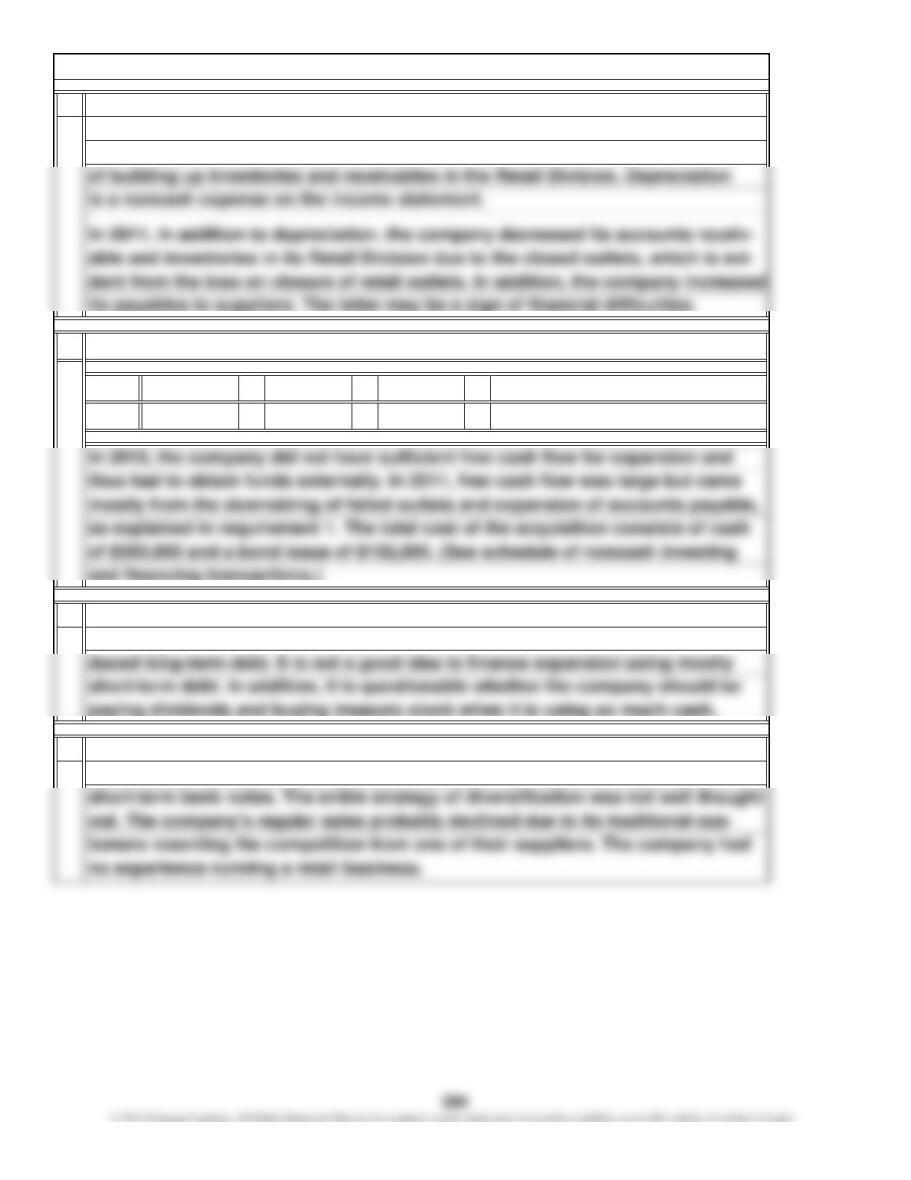
The most significant financing activity by far was the increase in short-term bank
Chapter 12, P 2.
Using the “law of large numbers,” the primary reasons for the difference between
net income and cash flows from operating activities in 2010 are depreciation
and increases in inventory and accounts receivable. The last two are the result
close outlets to reduce inventory and receivables to raise cash to pay off the
The company immediately began to lose money after the acquisition and had to
financing. The company also paid dividends, purchased treasury stock, and re-
($171,976)
$287,700
Free Cash Flow
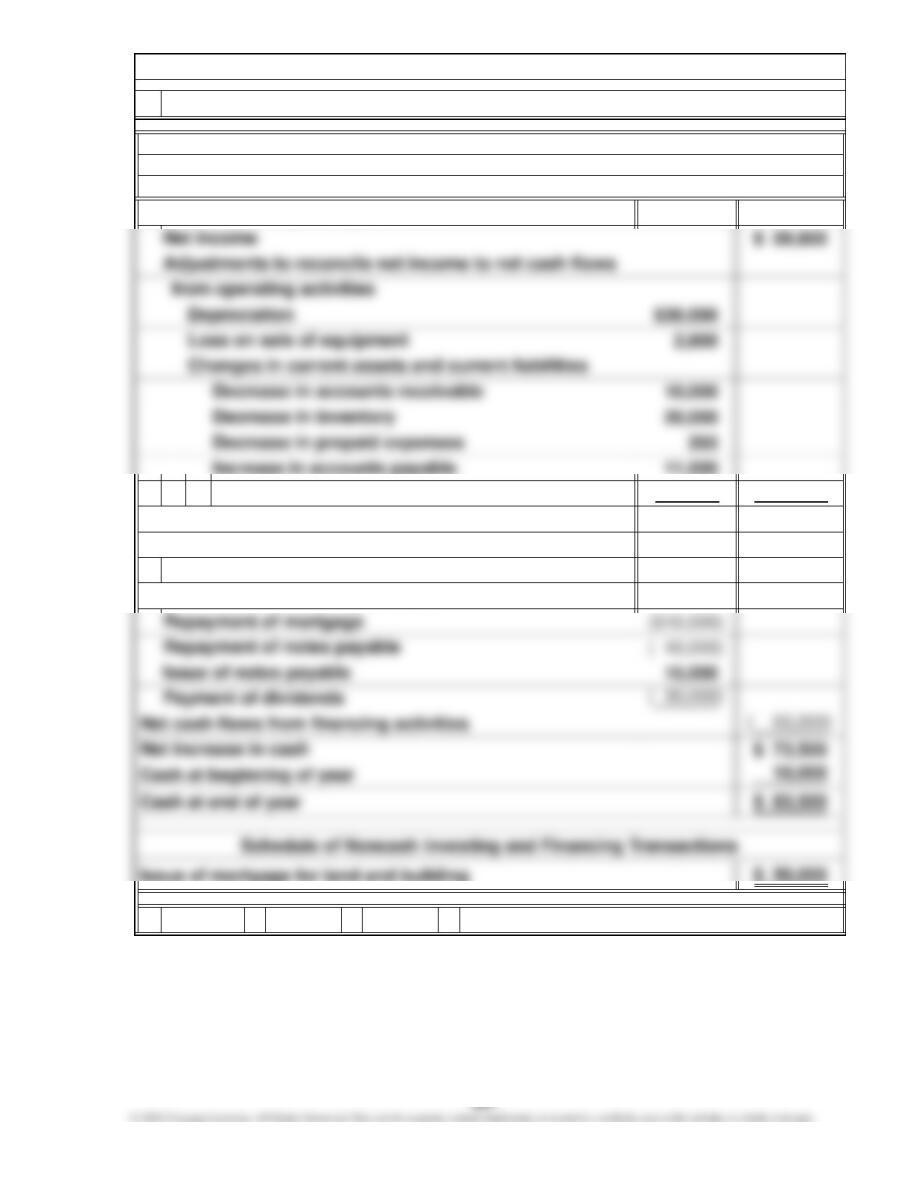
4,000 77,200
$137,000
1,500
* – $8,500 – $2,000 =
$1,500
Cash flows from operating activities
Net cash flows from operating activities
Cash flows from investing activities
Sale of equipment*
Cash flows from financing activities
$12,000
1.
Chapter 12, P 3.
Statement of cash flows prepared
Bronek Corporation
For the Year Ended June 30, 2011
Statement of Cash Flows
Increase in income taxes payable
a.
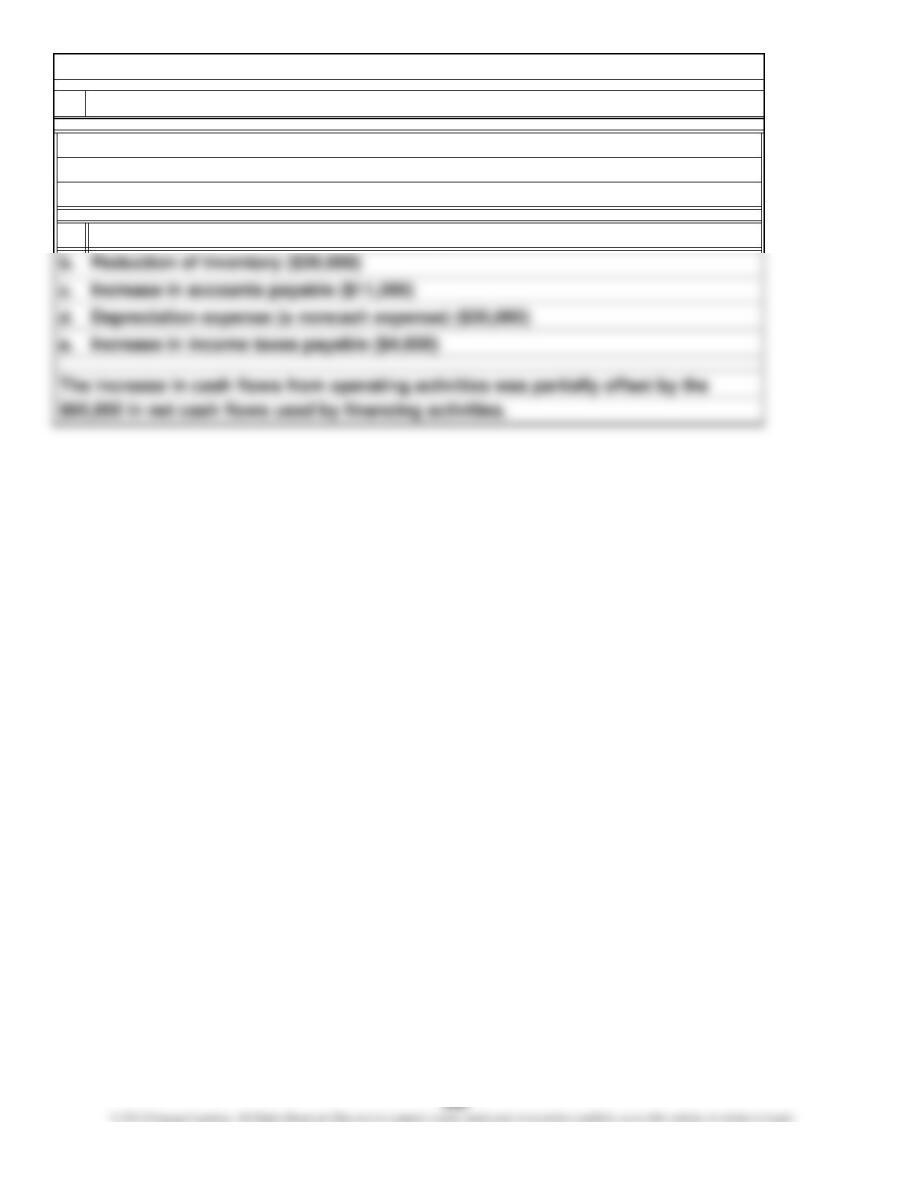
Reduction of accounts receivable ($10,000)
Bronek Corporation’s large increase in cash from 2010 to 2011 was caused by large
net cash flows from operations of $137,000. The primary reasons for the increase,
User Insight: Causes of increase in cash identified2.
in addition to net income of $59,800, were:
Chapter 12, P 3. (Continued)
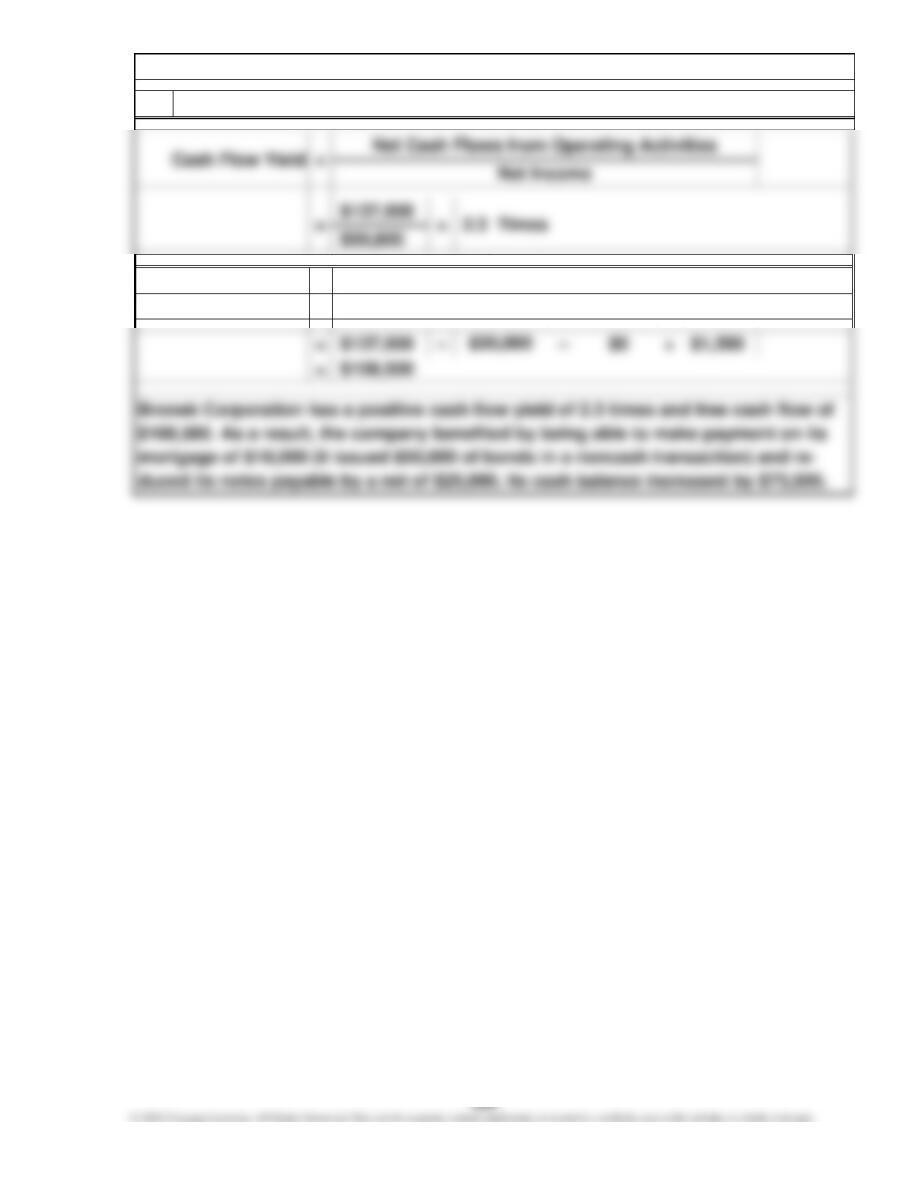
=
3. User Insight: Computation and assessment of cash flow yield and free cash flow
Free Cash Flow
Chapter 12, P 3. (Continued)
Net Cash Flows from Operating Activities – Dividends –
Purchases of Plant Assets + Sales of Plant Assets
$ 11,000
$ 46,800
$126,600
$ 13,800
( 39,600)
( 25,800)
$100,000
Cash flows from financing activities
Cash flows from investing activities
1. Statement of cash flows prepared
Conversion of bonds into common stock
Depreciation
Net cash flows from operating activities
Schedule of Noncash Investing and Financing Transactions
Cash flows from operating activities
Net income
Adjustments to reconcile net income to net cash flows
from operating activities
Sale of furniture and fixtures*
Purchase of furniture and fixtures
Net cash flows from investing activities
Brick Corporation
Chapter 12, P 4.
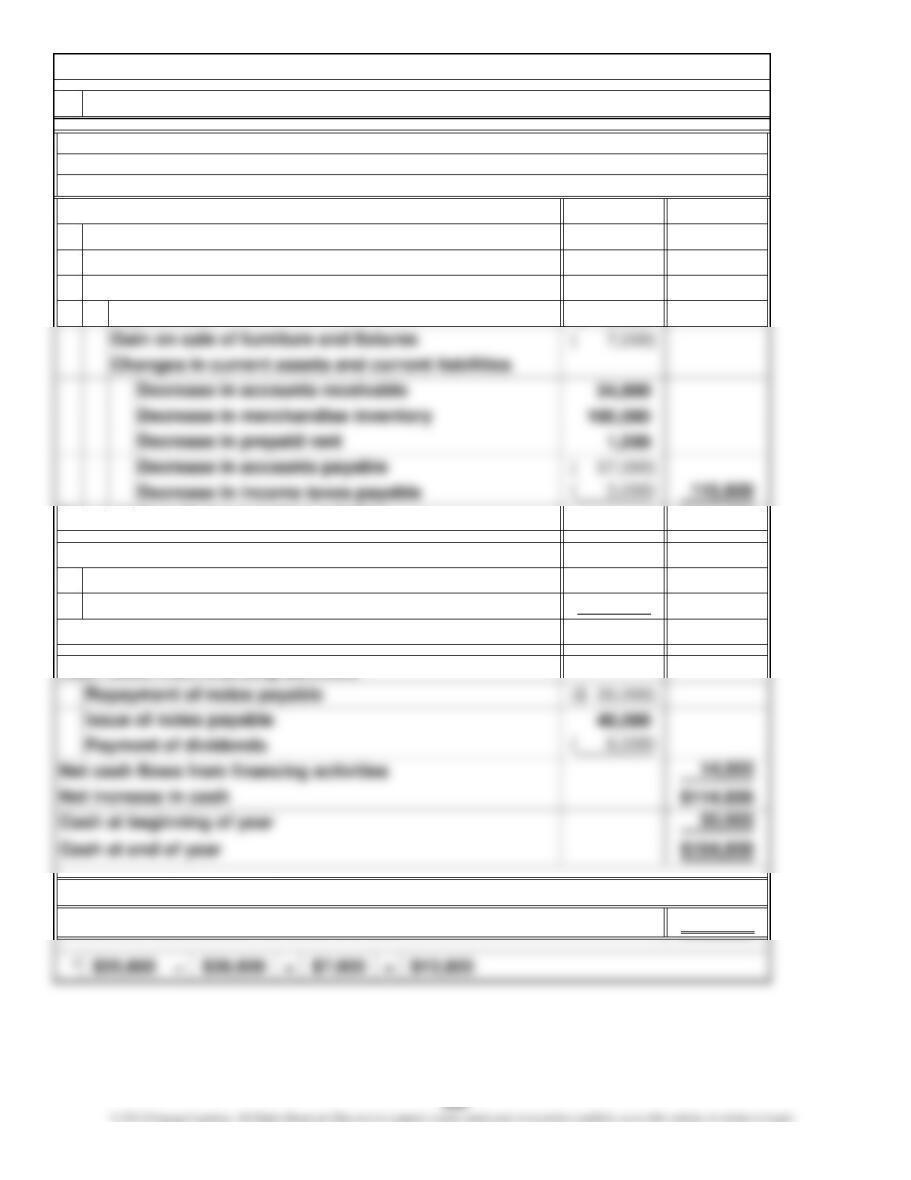
Statement of Cash Flows
For the Year Ended December 31, 2011
Chapter 12, P 4. (Continued)
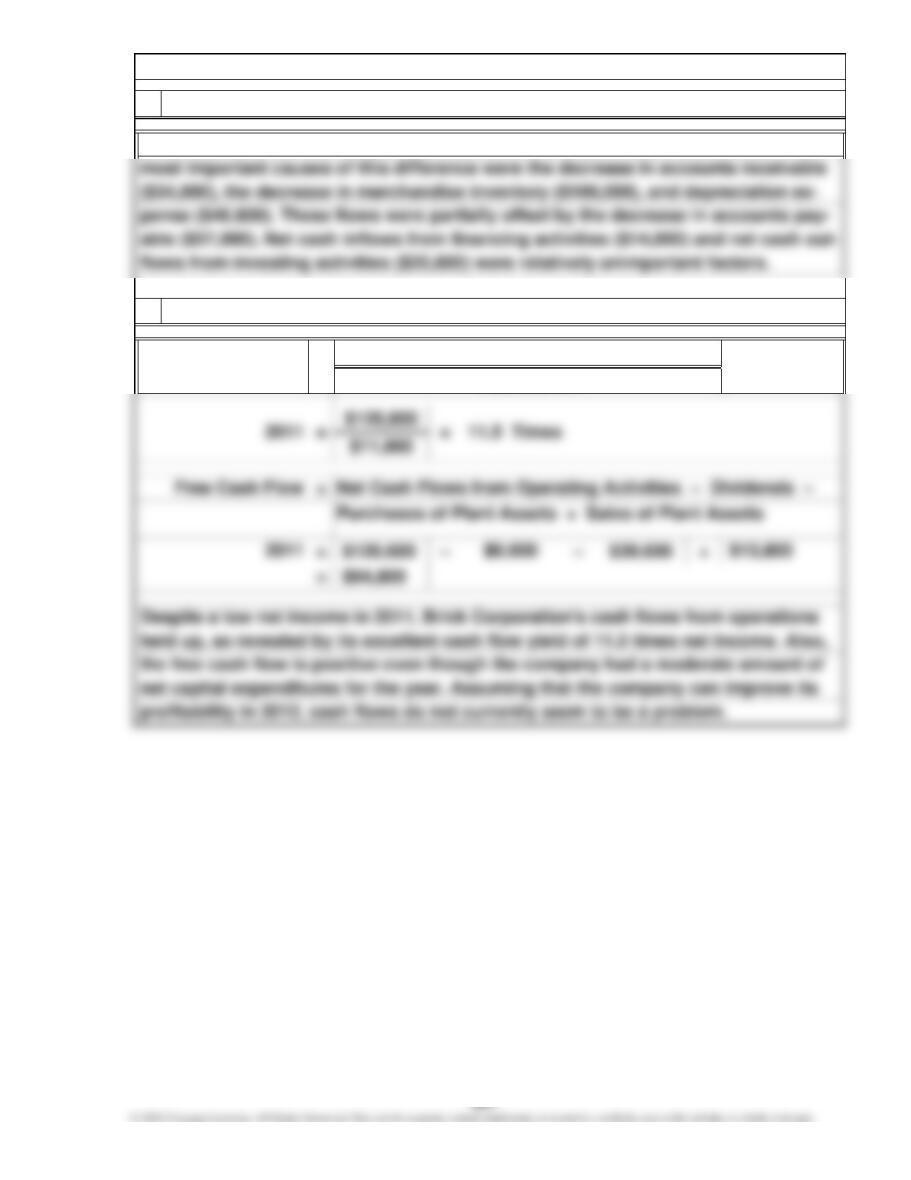
User Insight: Causes of increase in cash identified2.
3. User Insight: Computation and assessment of cash flow yield and free cash flow
Cash Flow Yield =
Net Cash Flows from Operating Activities
Net Income
Brick had net income of only $11,000, but a net increase in cash of $114,800. The