(20-30 min.) E 6-82
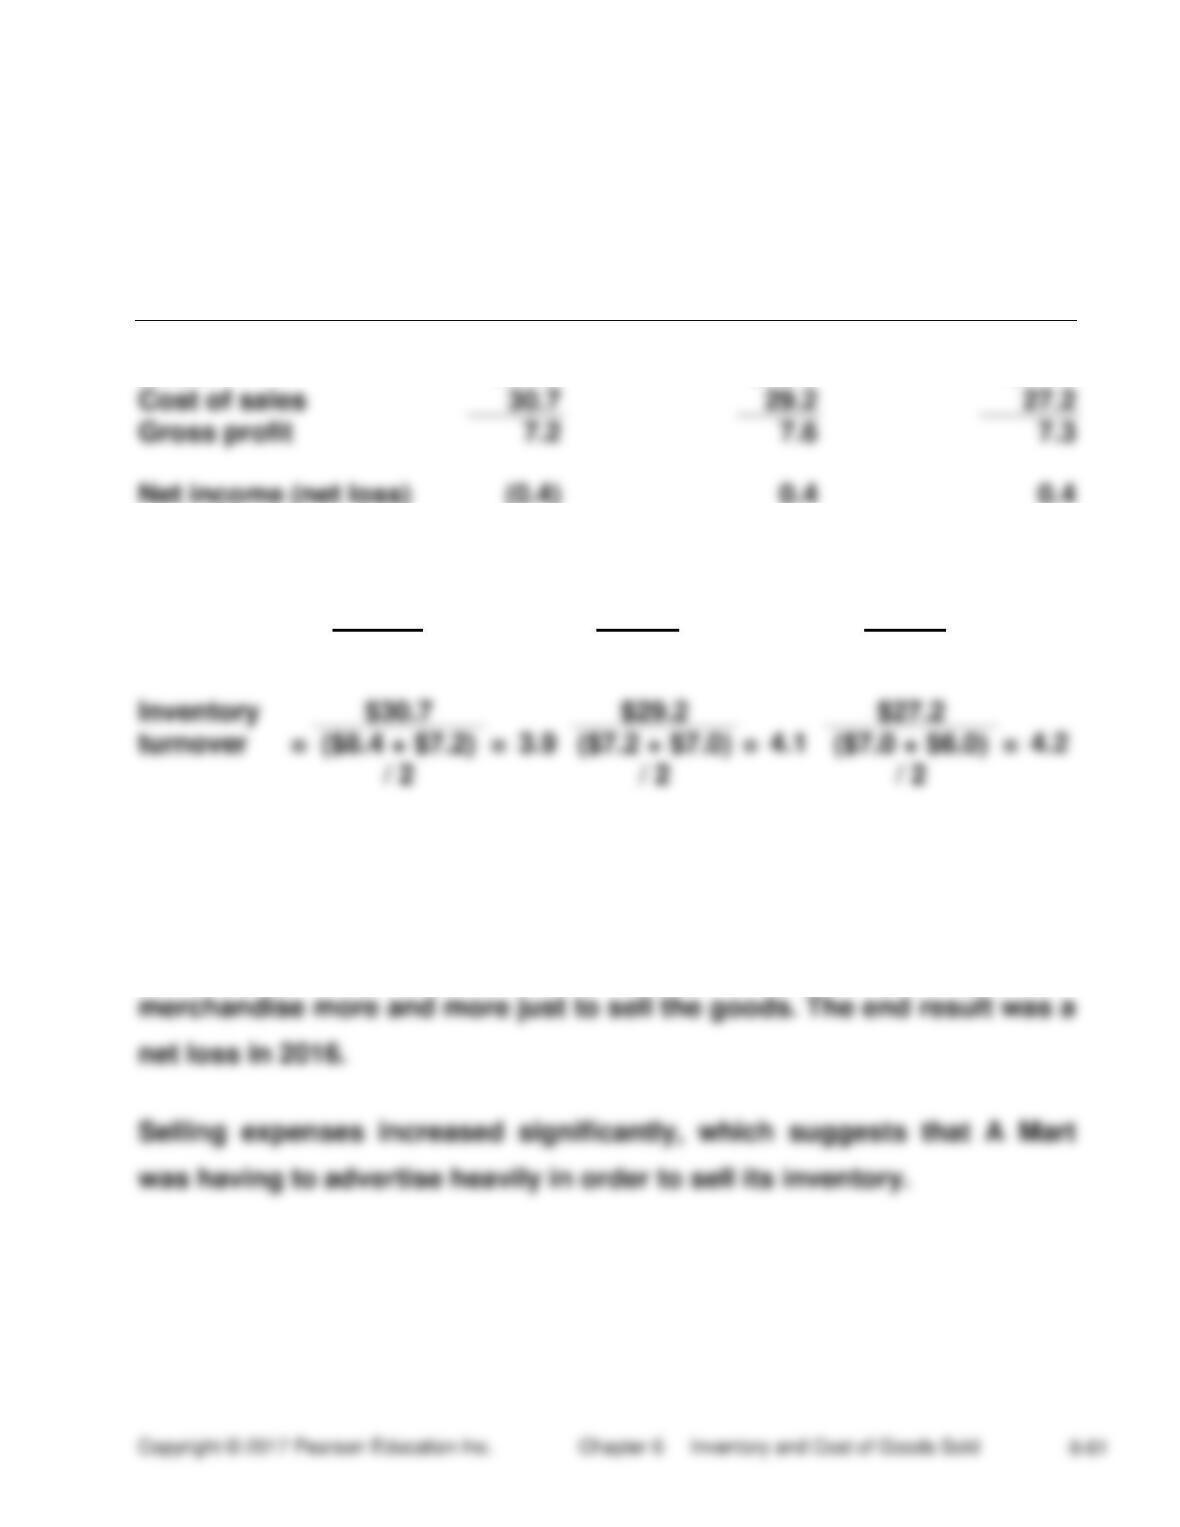
Sales increased, the gross profit increased then dropped, and net
income slid into a net loss, as shown here:
Dollars in millions
2016
2015
2014
Sales
$37.9
$36.8
$34.5
Cost of sales
Gross profit
Net income (net loss)
Gross
profit
=
$7.2 =
19.0%
$7.6 =
20.7%
$7.3 =
21.2%
percentage
$37.9
$36.8
$34.5
Inventory
$29.2
turnover
($7.2 + $7.0)
Both the gross profit percentage and the rate of inventory turnover
dropped during this period. The gross profit percentage dropped
significantly. This suggests that A Mart was having to discount its
(20-30 min) P 6-83
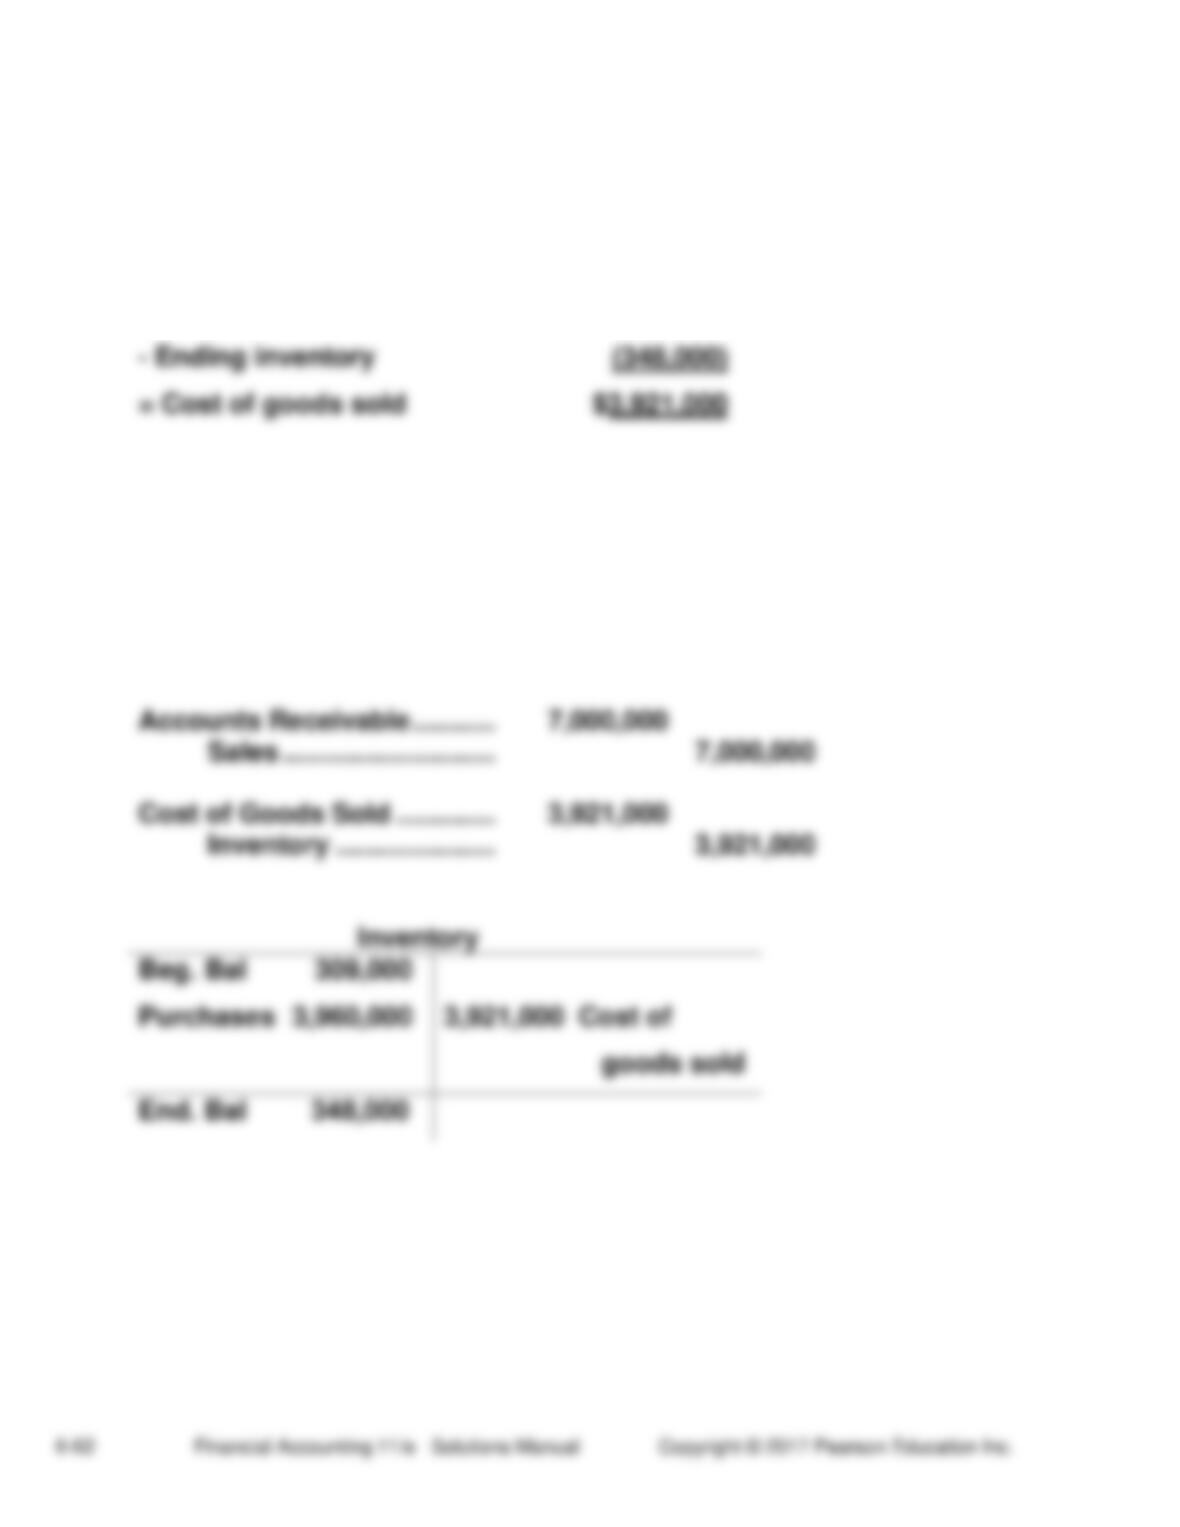
Req. 1
Beginning inventory $ 309,000
+ Purchases ? $3,960,000
Req. 2
Inventory ………………………… 3,960,000
Accounts Payable ……. 3,960,000
(continued) P 6-83
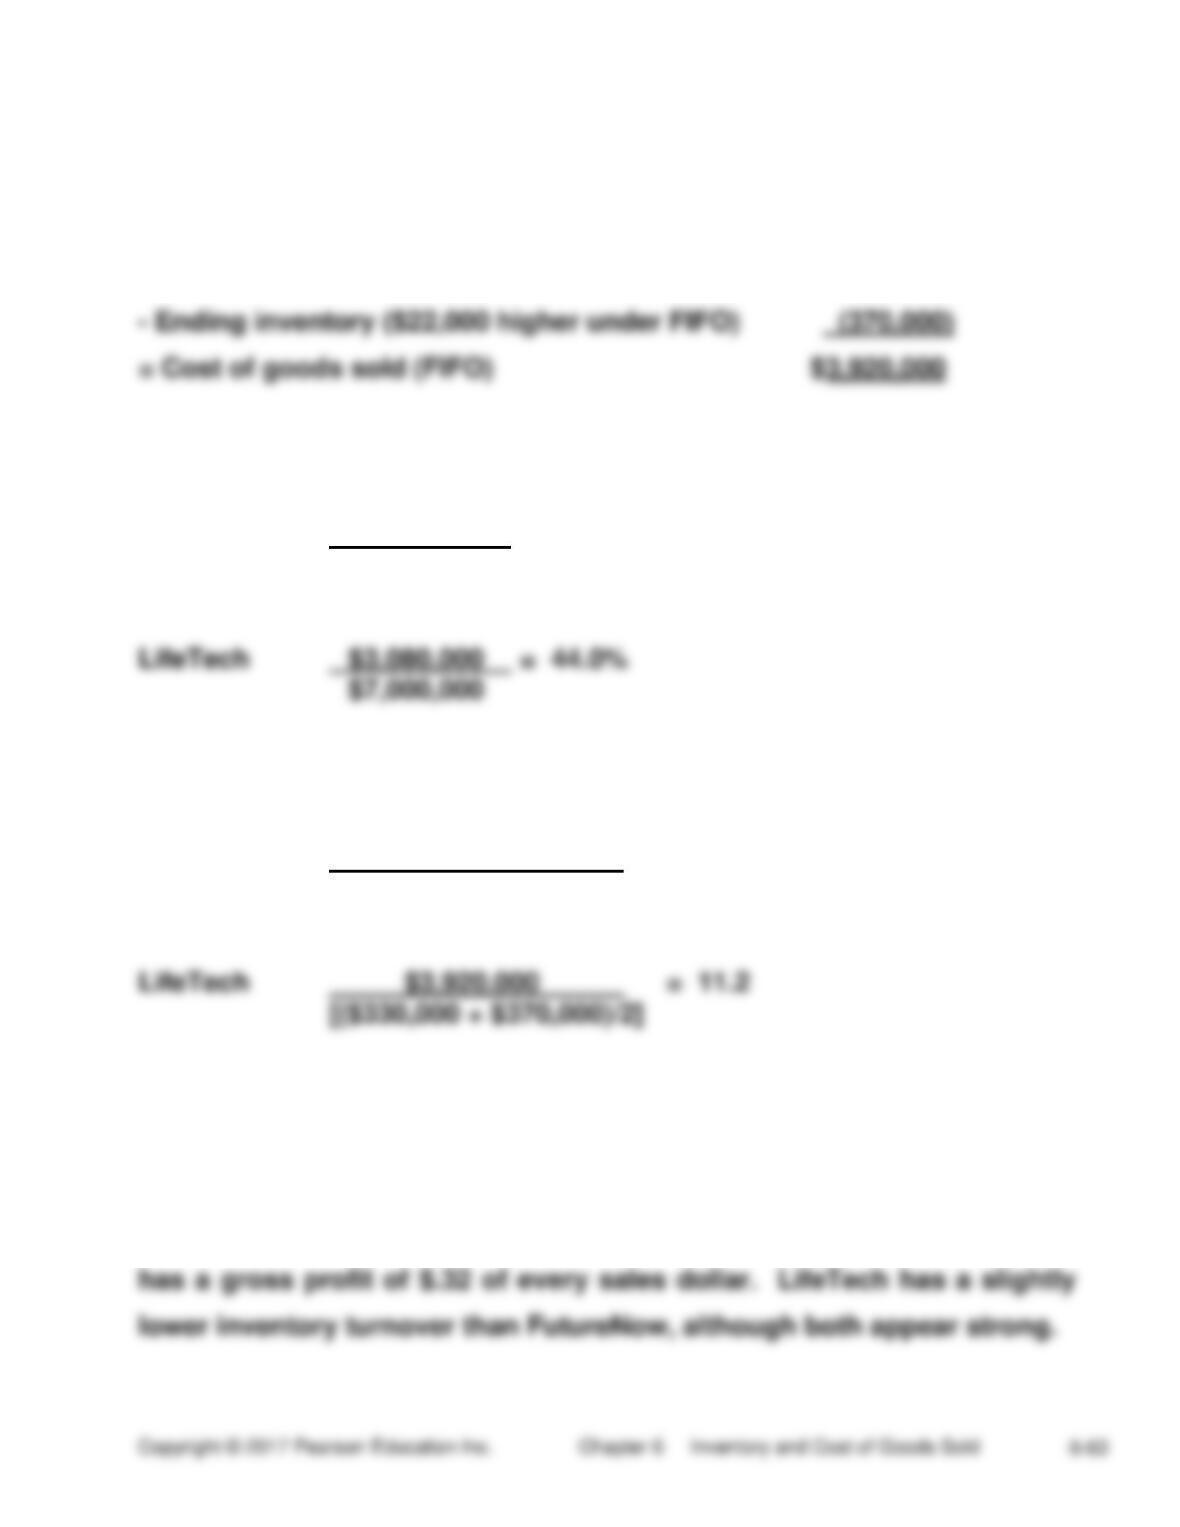
Req. 3
Beginning inventory ($21,000 higher under FIFO) $ 330,000
+ Purchases 3,960,000
Req. 4
FutureNow $480,000 = 32.0%
$1,500,000
Req. 5
FutureNow $1,020,000 = 12.0
[($80,000 + $90,000)/2]
Req. 6
LifeTech has a higher gross profit percentage which indicates that
LifeTech has a gross profit of $.44 of every sales dollar and FutureNow
Decision Cases
(50-60 min.) Decision Case 1
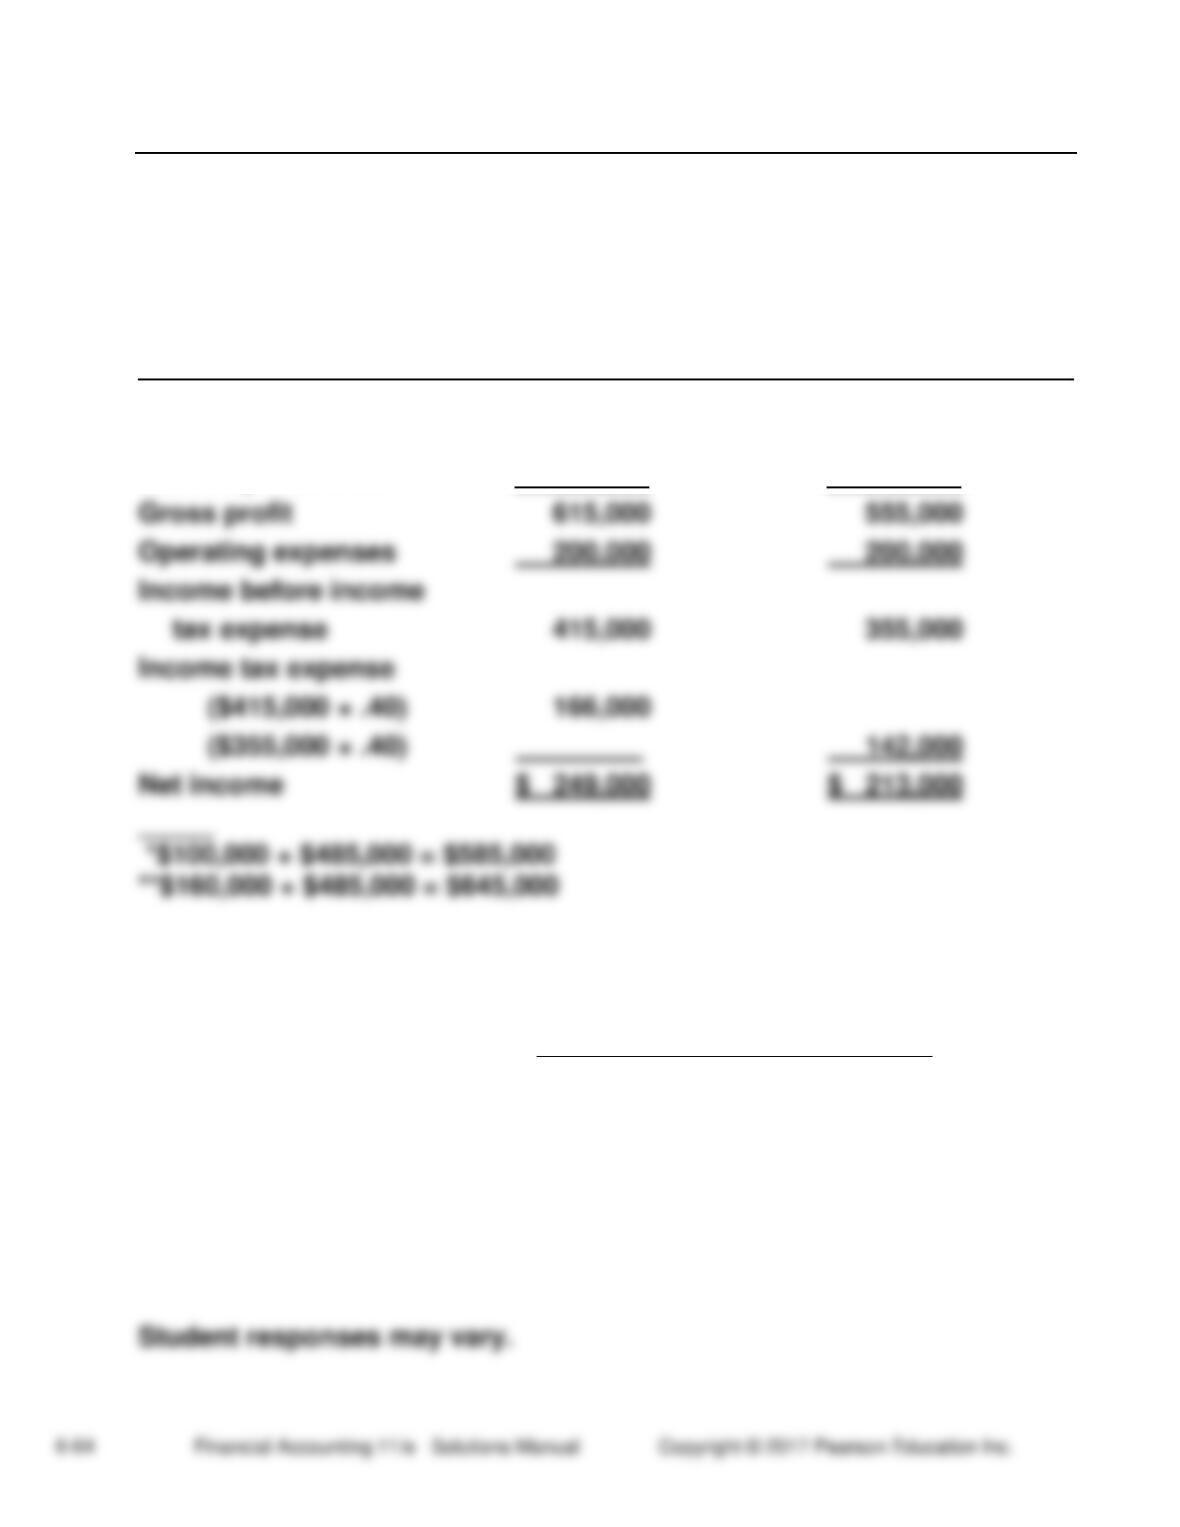
Req 1
Jubilee Corporation
Income Statement
FIFO
LIFO
Sales revenue
$1,200,000
$1,200,000
Cost of goods sold:
585,000*
645,000**
Gross profit
Income before income
tax expense
Income tax expense
($415,000 × .40)
($355,000 × .40)
142,000
Req. 2
FIFO
LIFO
Net income…………
$249,000
$213,000
FIFO net income is higher because (1) prices are rising (from $100 to
$121.25 to $160), and (2) FIFO and LIFO assign costs to expense (cost of
goods sold) in opposite patterns.
(15-25 min.) Decision Case 2
Req. 1
This question provides a rich setting for a class discussion. There’s no
single correct answer to this question. Some students may favor Company
B because it reports higher net income than Company A. B may be
Other students may prefer Company A because it discloses the inventory
method it uses. Company B does not let outsiders know which method it
Professors can point out that A, the LIFO company, may be better off
because of the lower income taxes that A pays by using the LIFO method.
We don’t know whether Company B is making the most of this cash-flow
advantage of LIFO.
Req. 2
Yes, the authors would prefer managers to be faithful in representing the
disclosures for inventory — for all the reasons accountants are transparent
and truthful. We would prefer that the financial statements present the
Ethical Issue
Req. 1
Changing accounting methods year after year hurts a company’s
credibility, which makes it hard for the company to borrow or raise
Req. 2
The consistency principle is violated.
Req. 3
Creditors and outside investors could be harmed by accounting
changes year after year. It becomes difficult to tell which changes in the
business are real and which changes result from the shift in the
Focus on Financials: Apple Inc.
(30 min.)
Req. 1
Millions
September 27,
September 28,
2014
2013
Inventory (from the balance sheet)
$2,111
$1,764
Apple Inc. reports all of its’ inventory on the balance sheet. Note 1 of the
Consolidated Financial Statements (Summary of Significant Accounting
Req. 2
Note 1 of the Consolidated Financial Statements (Summary of
Significant Accounting Policies), under Inventories, states: “Inventories
(continued) Focus on Financials: Apple Inc.
Req. 3
Millions
Rearranging,
Beginning Inventory
Cost of sales
(2014 income statement)
$112,258
+
Purchases
+
Ending inventory
=
Cost of goods available
=
Cost of goods available
114,369
Ending Inventory
Beginning inventory
=
Cost of sales
=
Purchases
$112,605
Req. 4
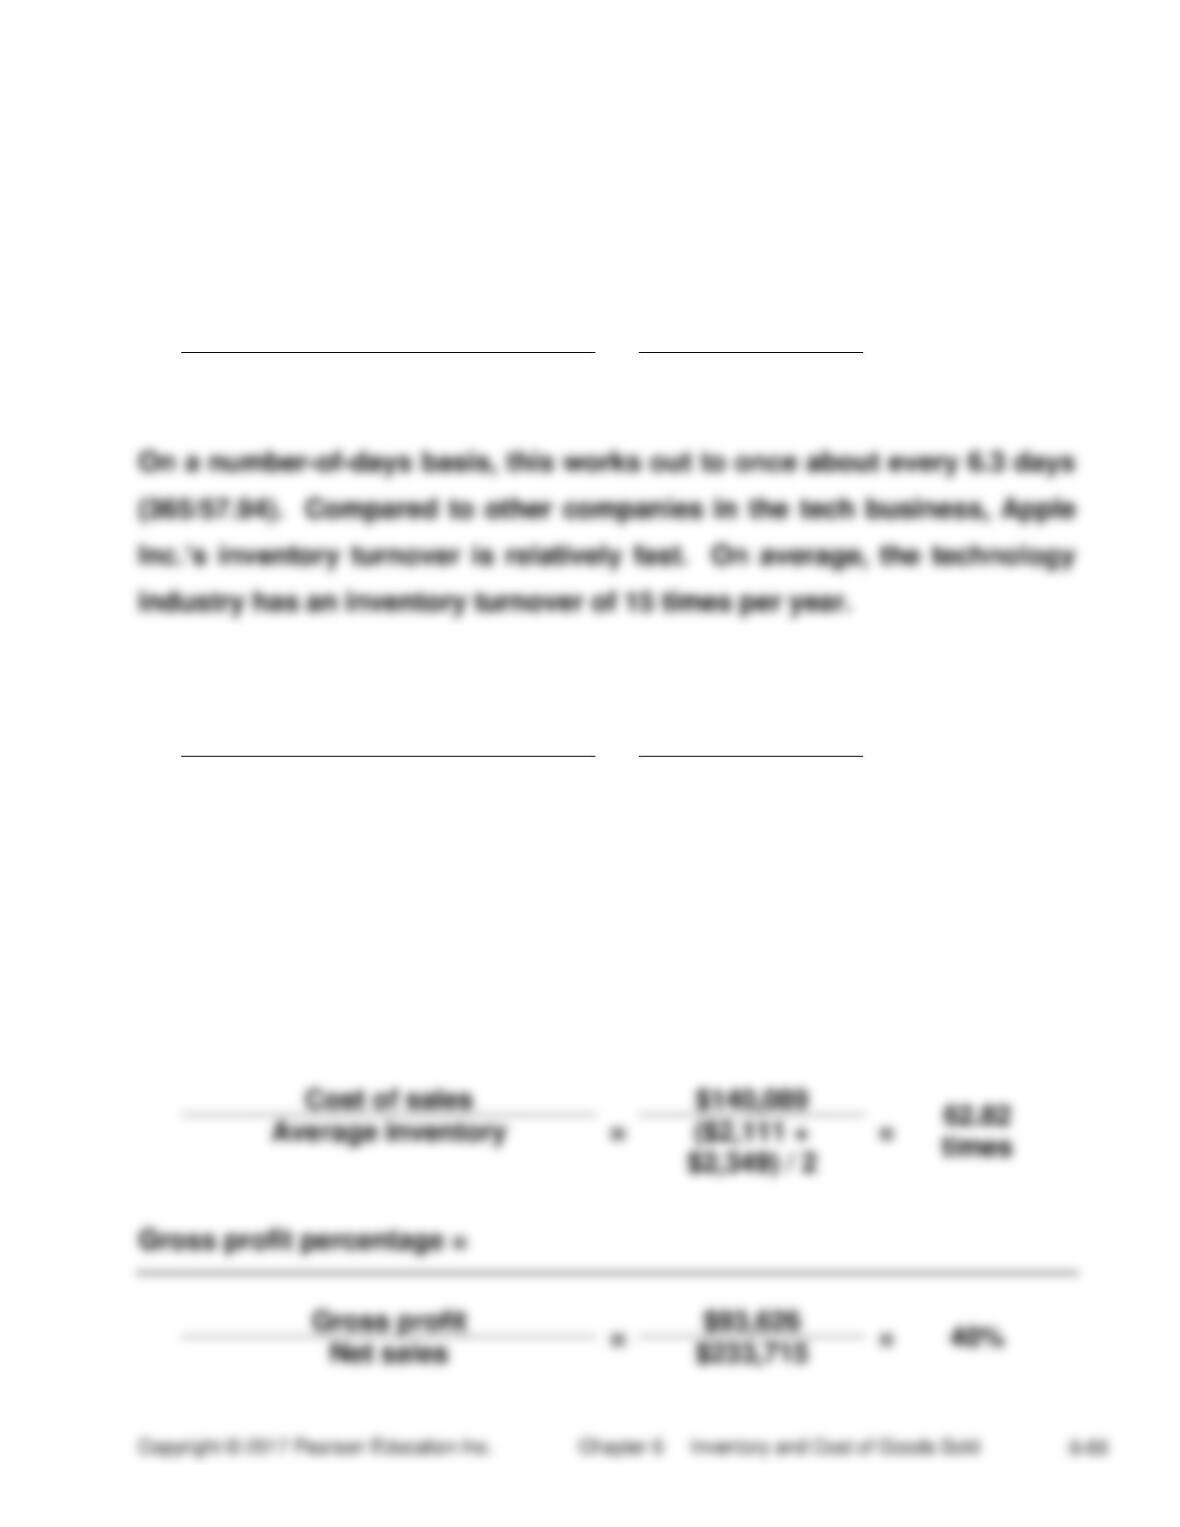
The gross profit percentage increased slightly during 2014:
2014
2013
Net product sales
$182,795
100.0%
$170,910
100.0%
Cost of sales
Gross profit
(continued) Focus on Financials: Apple Inc.
Req. 5
Apple Inc.’s rate of inventory turnover for 2014 is 57.94 times.
Cost of sales
=
$112,258
=
57.94
times
Average inventory
($2,111 +
$1,764) / 2
2013 inventory turnover is 83.45 times.
Cost of sales
=
$106,606
=
83.45
times
Average inventory
($1,764 + $791) /
2
Req. 6
Apple’s inventory turnover and gross profit percentage for the year
ending September 26, 2015:
Inventory turnover =
Cost of sales
=
$140,089
=
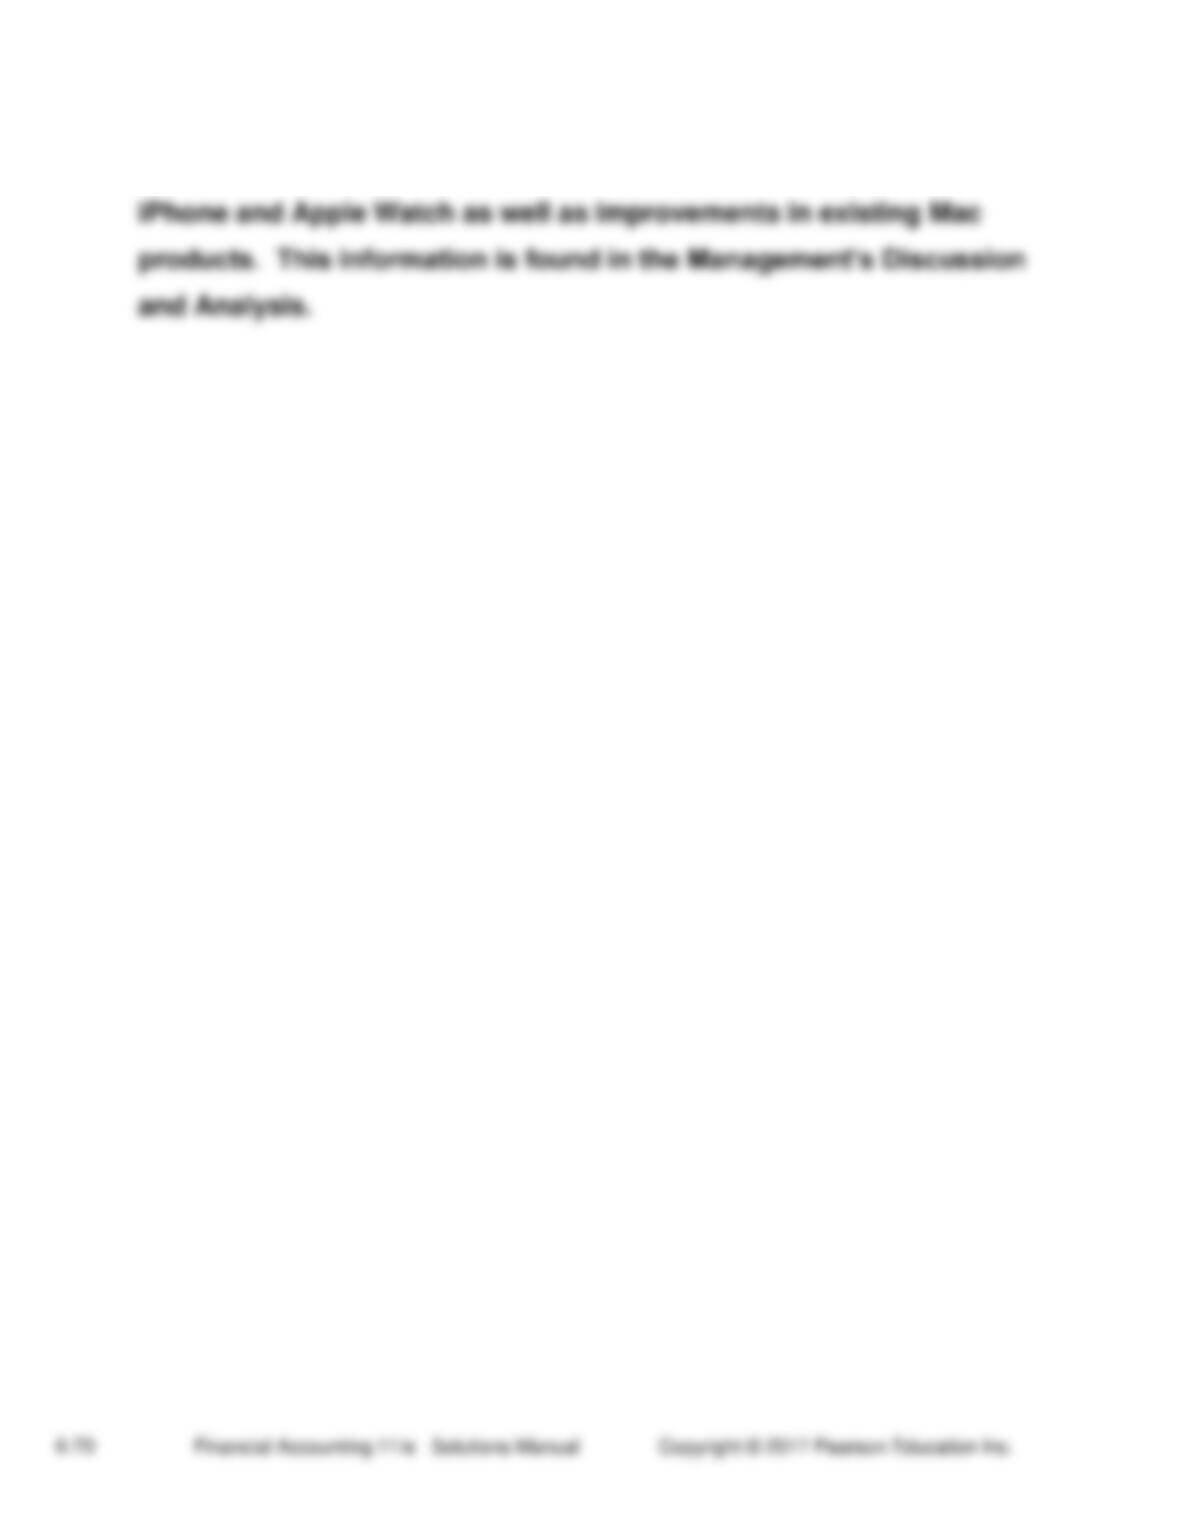
Both ratios increased or improved over the previous fiscal year.
Reasons for the increases are the introduction of new products such as
Focus on Analysis: Under Armour, Inc.
(30-40 min.)
Req. 1
a.
Inventory on hand at fiscal 2014 year end, $537 million.
b.
Cost of sales, $1,572 million.
Millions
c.
Purchases
=
Ending inventory ………………………..
$ 537
Beginning inventory …………………..
=
Purchases ………………………………….
Req. 2
Purchases are most directly related to cash flow because Under Armour,
Inc. must pay for the inventory it purchases.
Req. 3
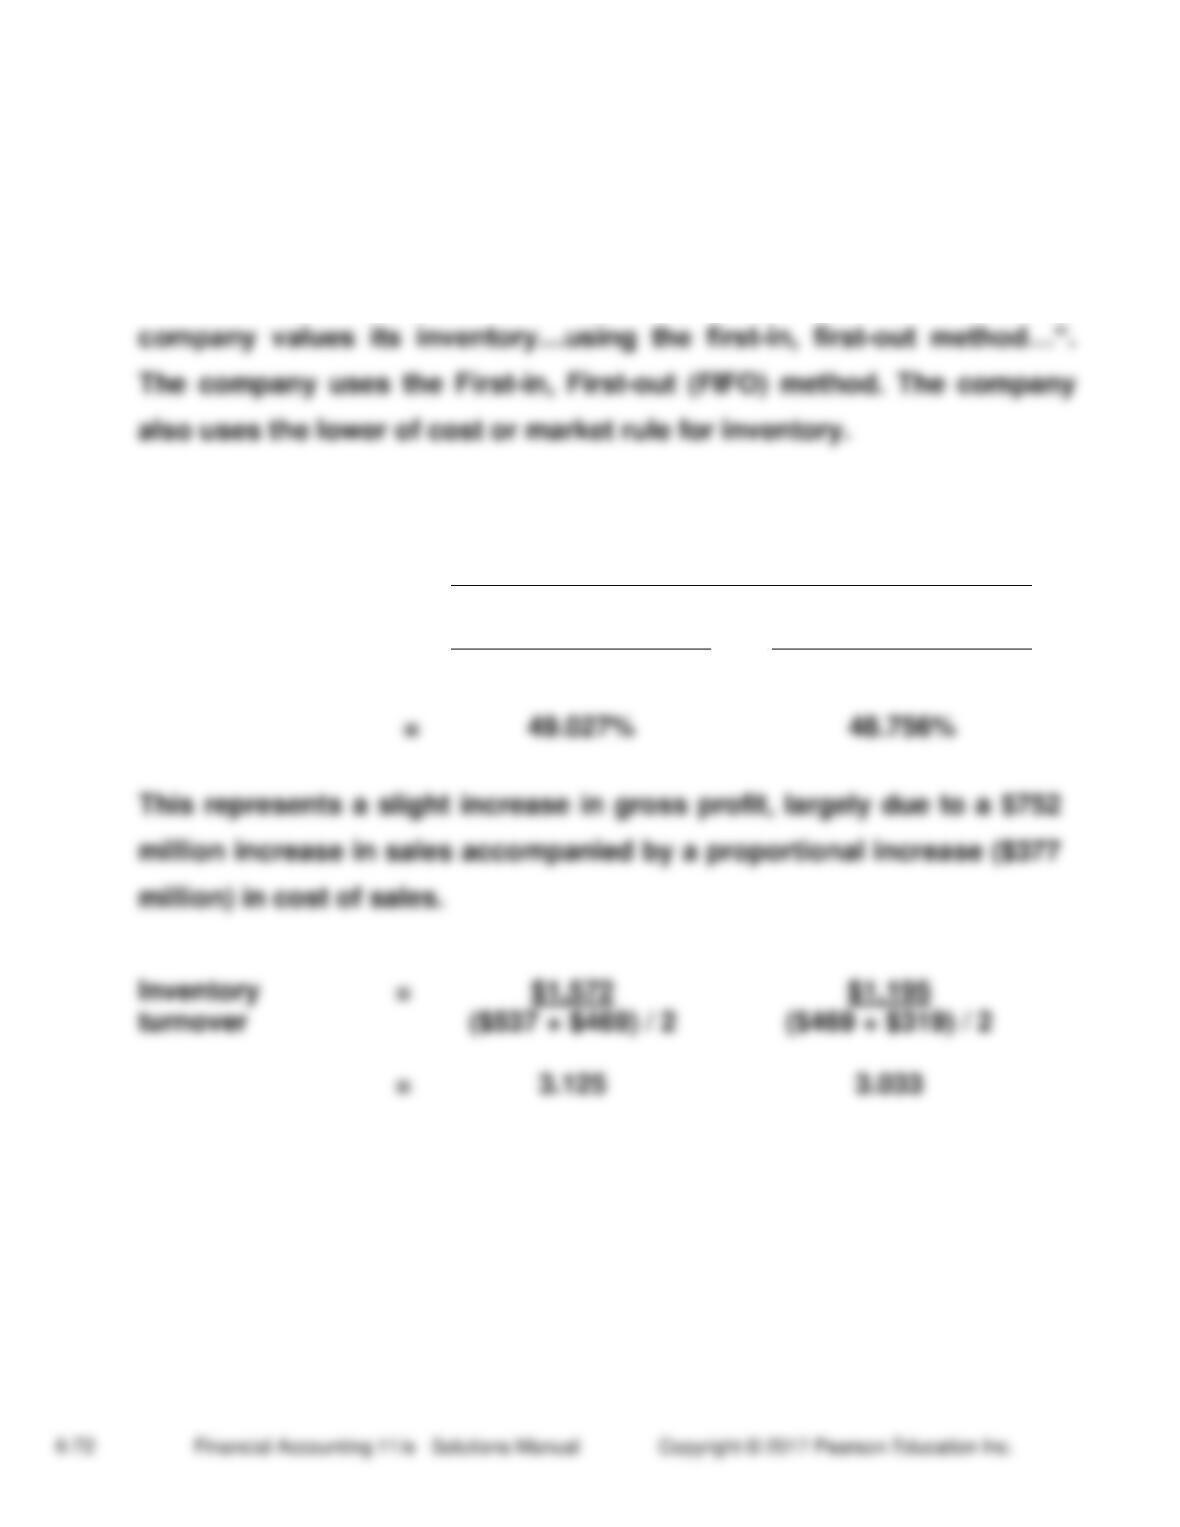
Millions
Accounts payable, beginning of 2014
(ending balance for fiscal 2013) …………………………………
$ 165
+
Purchases 2014 (Req. 1) ……………………………………………
2014 Cash payments (X) = $1,595 million
(continued) Focus on Analysis: Under Armour, Inc.
Req. 4
Note 2 of the Consolidated Financial Statements (Summary of
Significant Accounting Policies), under Inventories, states: “The
Req. 5
(Dollars in millions)
2014
2013
Gross profit
=
$3,084 − $1,572
$2,332 − $1,195
percentage
$3,084
$2,332
Inventory turnover increased slightly. Overall, Under Armour’s (a) gross
profit percentage improved slightly and (b) rate of inventory turnover
improved during 2014. This information helps to explain how income
from operations increased in fiscal 2014.

Group Project
Student responses will vary.
Chapter 6 Appendix
Appendix Short Exercises
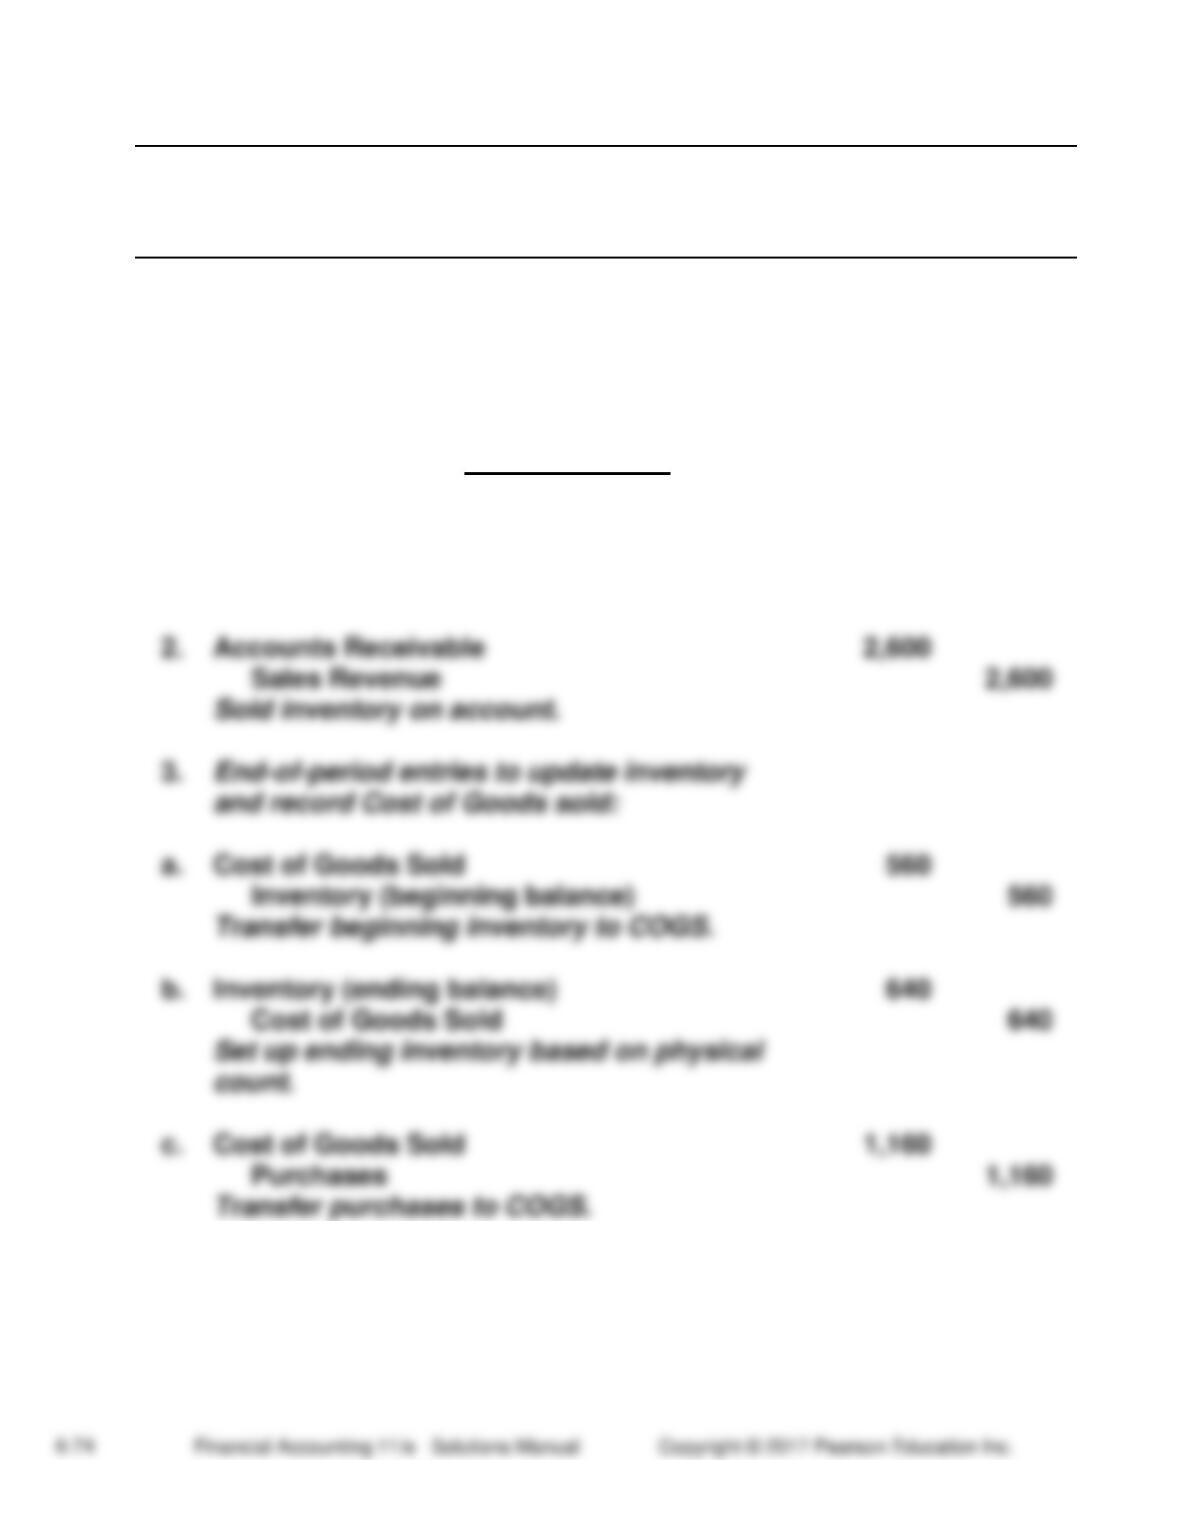
(10-15 min.) S6A-1
(Journal entries)
General Journal
1.
Purchases
1,160
Accounts Payable
1,160
Purchased inventory on account.
2.
Accounts Receivable
Sales Revenue
and record Cost of Goods sold:
Cost of Goods Sold
Inventory (beginning balance)
Inventory (ending balance)
Cost of Goods Sold
Cost of Goods Sold
Purchases
1,160
Transfer purchases to COGS.
(10-15 min.) S6A-2
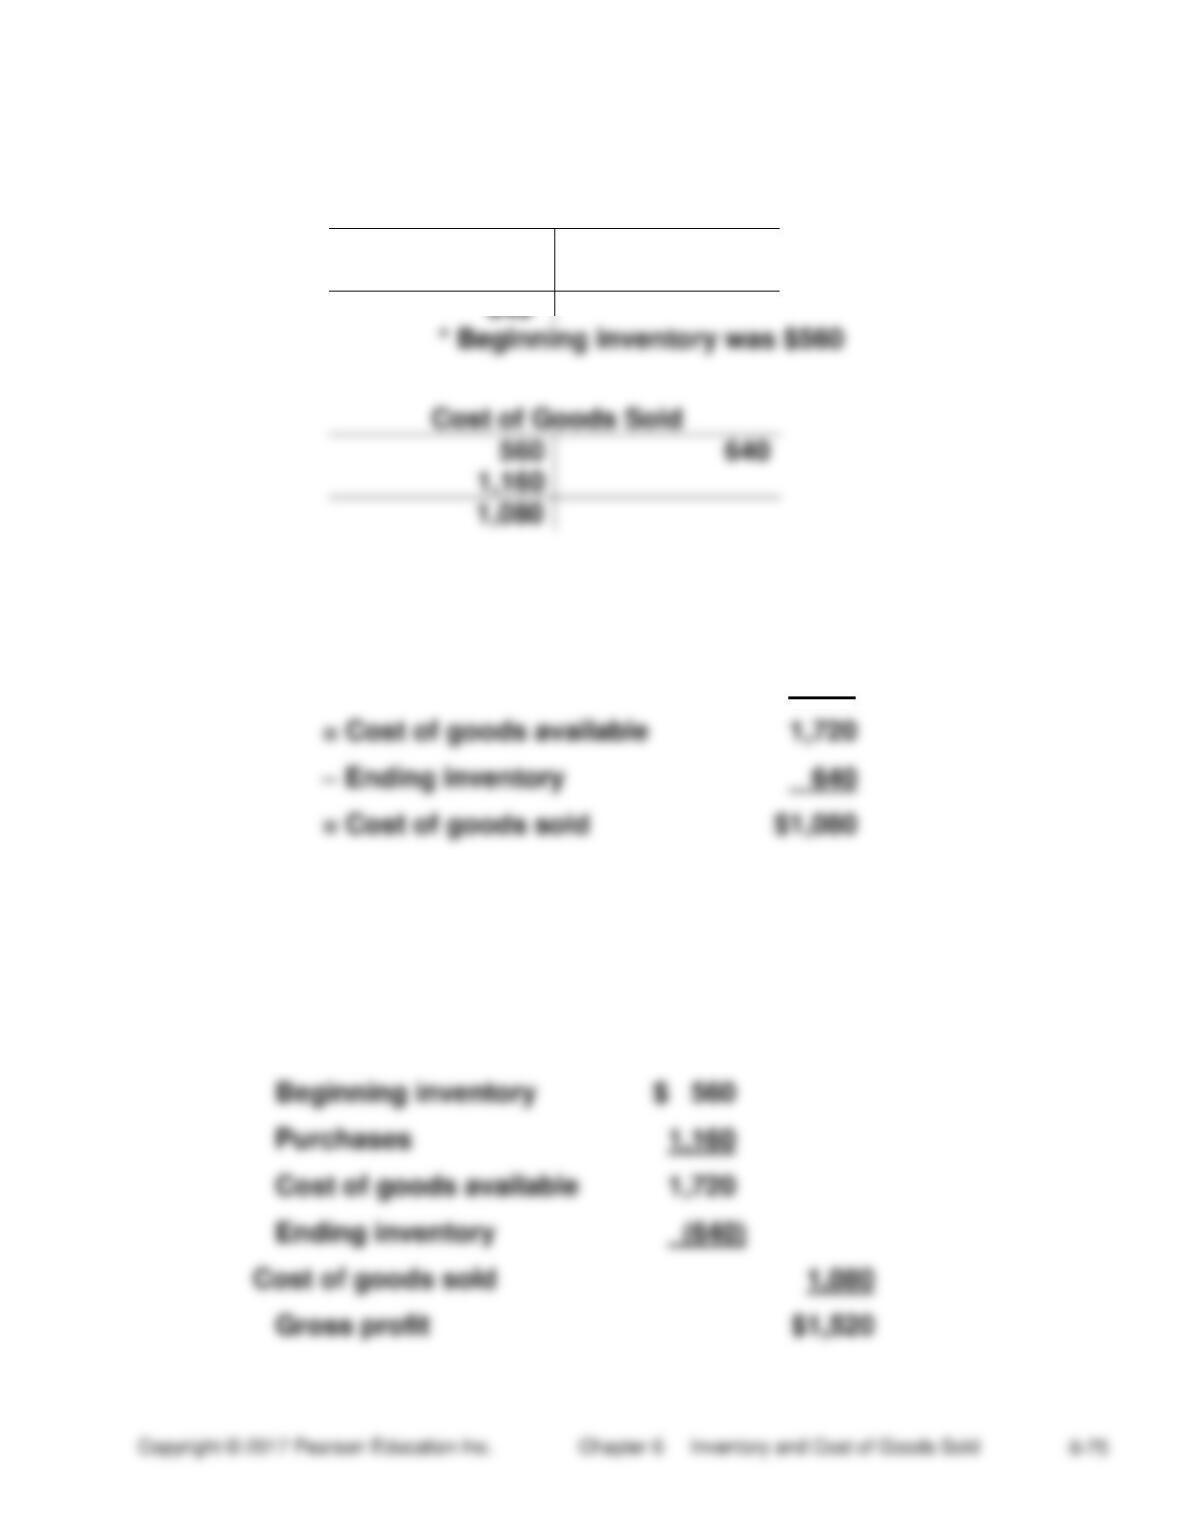
Req. 1 Posting general journal entries
Inventory
560*
560
640
640
560
Req. 2
Cost-of-Goods-Sold Model
Beginning inventory
$ 560
+ Purchases
1,160
$1,080
Req. 3
Wexton Technologies
Income Statement (Partial)
Sales revenue
$2,600
Cost of goods sold:
Beginning inventory
Cost of goods available
1,720
Ending inventory
Cost of goods sold
Appendix Exercises
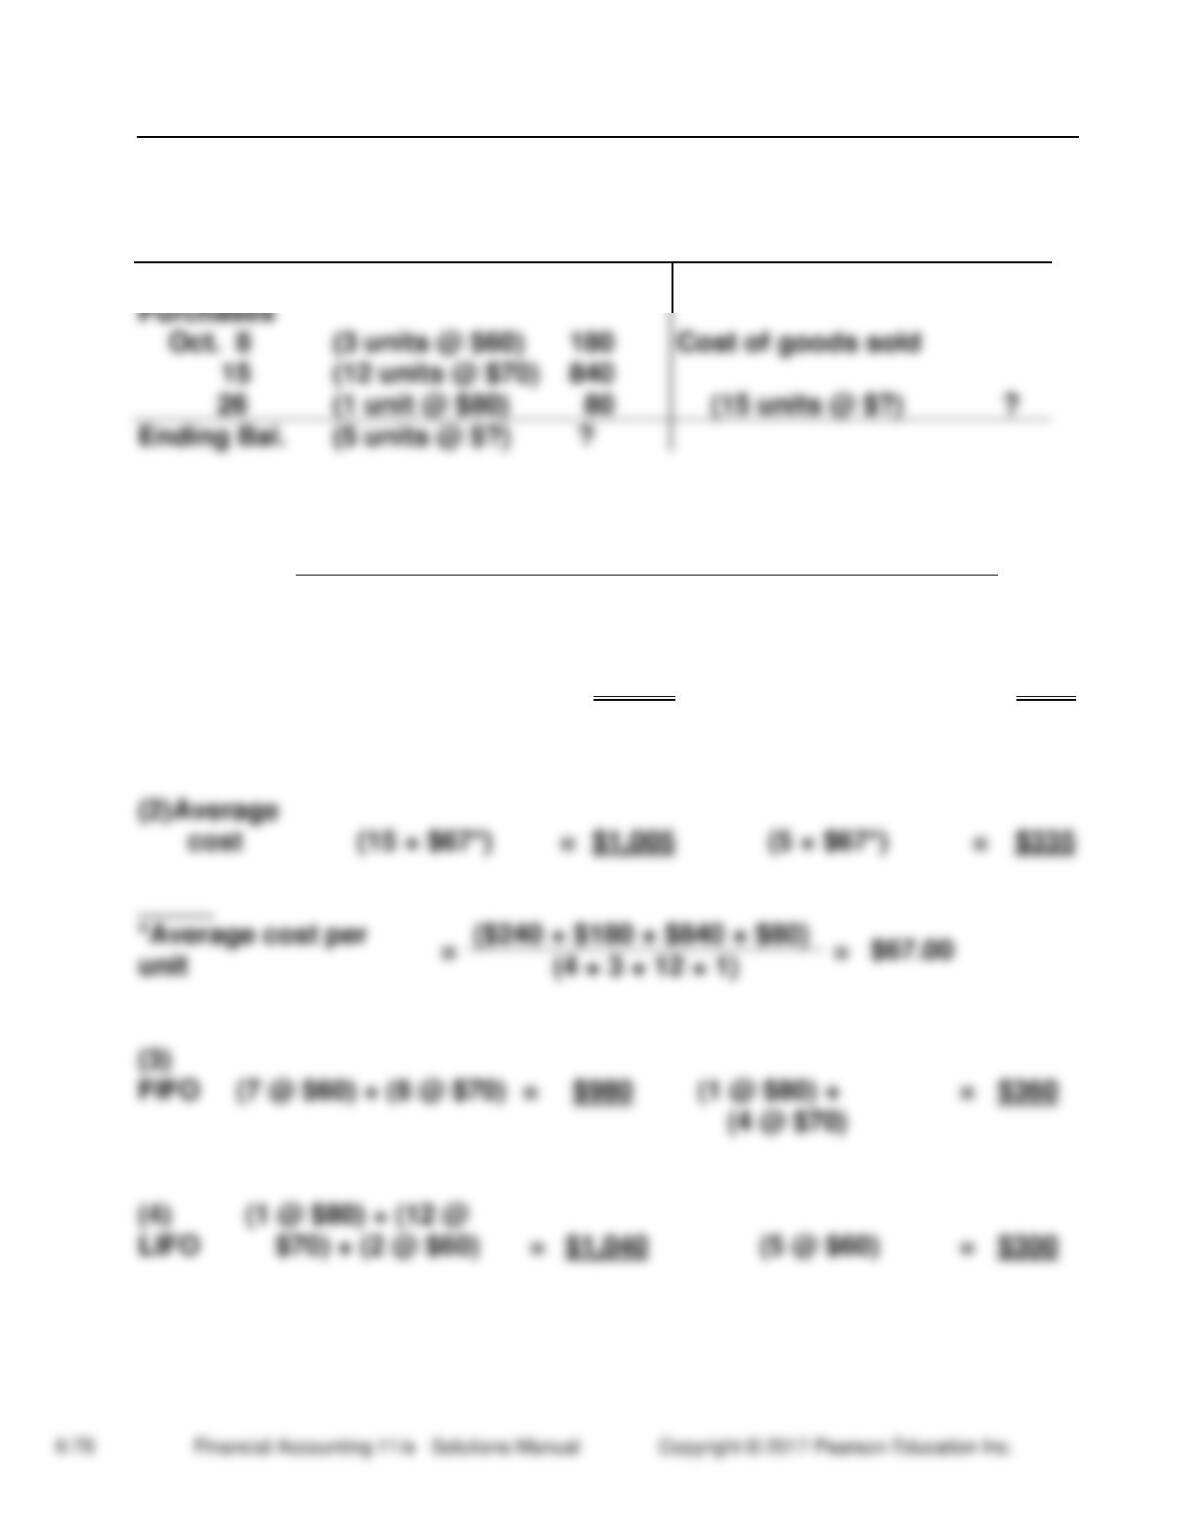
(10-15 min.) E6A-3
Inventory
Begin. Bal.
(4 units @ $60) 240
Purchases
Oct. 8
(3 units @ $60) 180
Cost of goods sold
15
(12 units @ $70) 840
26
(1 unit @ $80) 80
(15 units @ $?)
Ending Bal.
(5 units @ $?) ?
Cost of
Goods Sold
Ending Inventory
(1) Specific
unit
cost
(4 @ $60) + (10 @
$70) + (1 @ $80)
=
$1,020
(3 @ $60) +
(2 @ $70)
=
$320
(2) Average
=
($240 + $180 + $840 + $80)
(4)
(1 @ $80) + (12 @
(10-15 min.) E6A–4
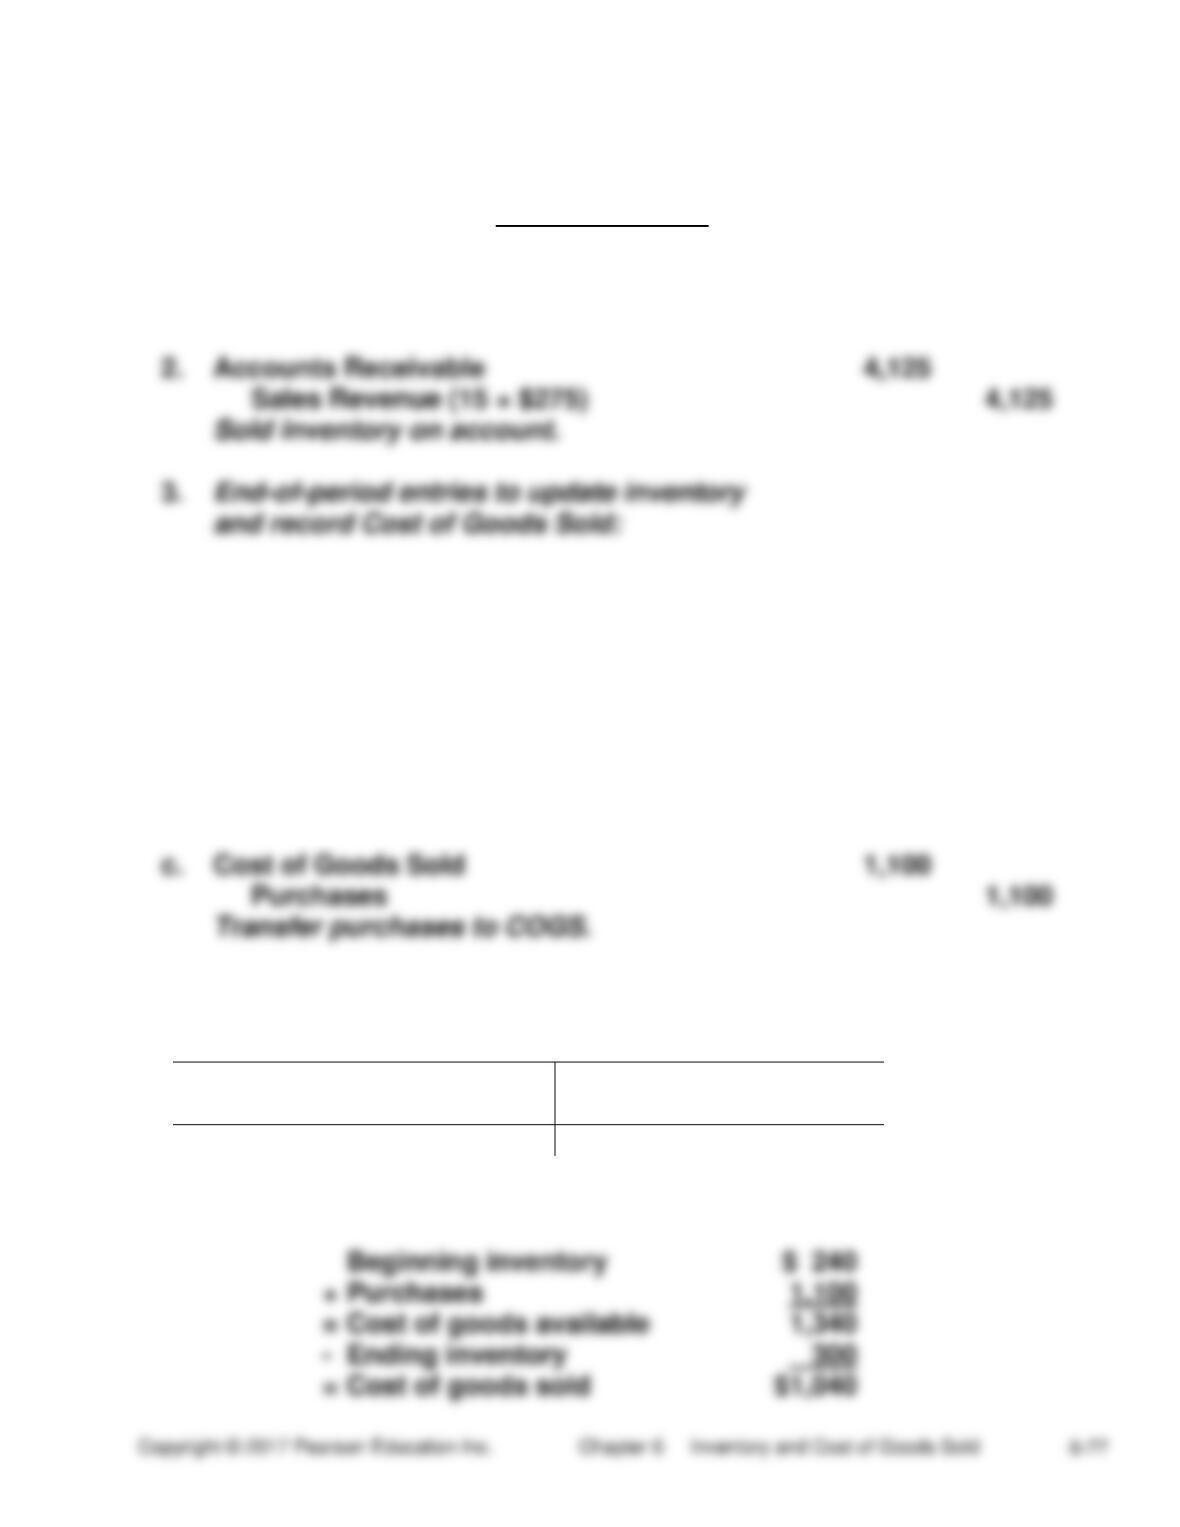
Reqs. 1, 2, & 3 (Journal entries)
General Journal
1.
Purchases
1,100
Accounts Payable
1,100
Purchased inventory on account.
2.
Accounts Receivable
Sales Revenue (15 × $275)
Sold inventory on account.
a.
Cost of Goods Sold
240
Inventory (beginning balance)
240
Transfer beginning inventory to COGS.
b.
Inventory (ending balance)
300
Cost of Goods Sold
300
Set up ending inventory based on physical
count.
c.
Cost of Goods Sold
Purchases
Transfer purchases to COGS.
Posting general journal entries:
Cost of Goods Sold
Beginning inventory 240
Ending Inventory 300
Purchases 1,100
Cost of goods sold 1,040
Req. 4 Cost-of-Goods-Sold Model
Beginning inventory
– Ending inventory
Appendix Problems
(20-25 min.) P6A-5
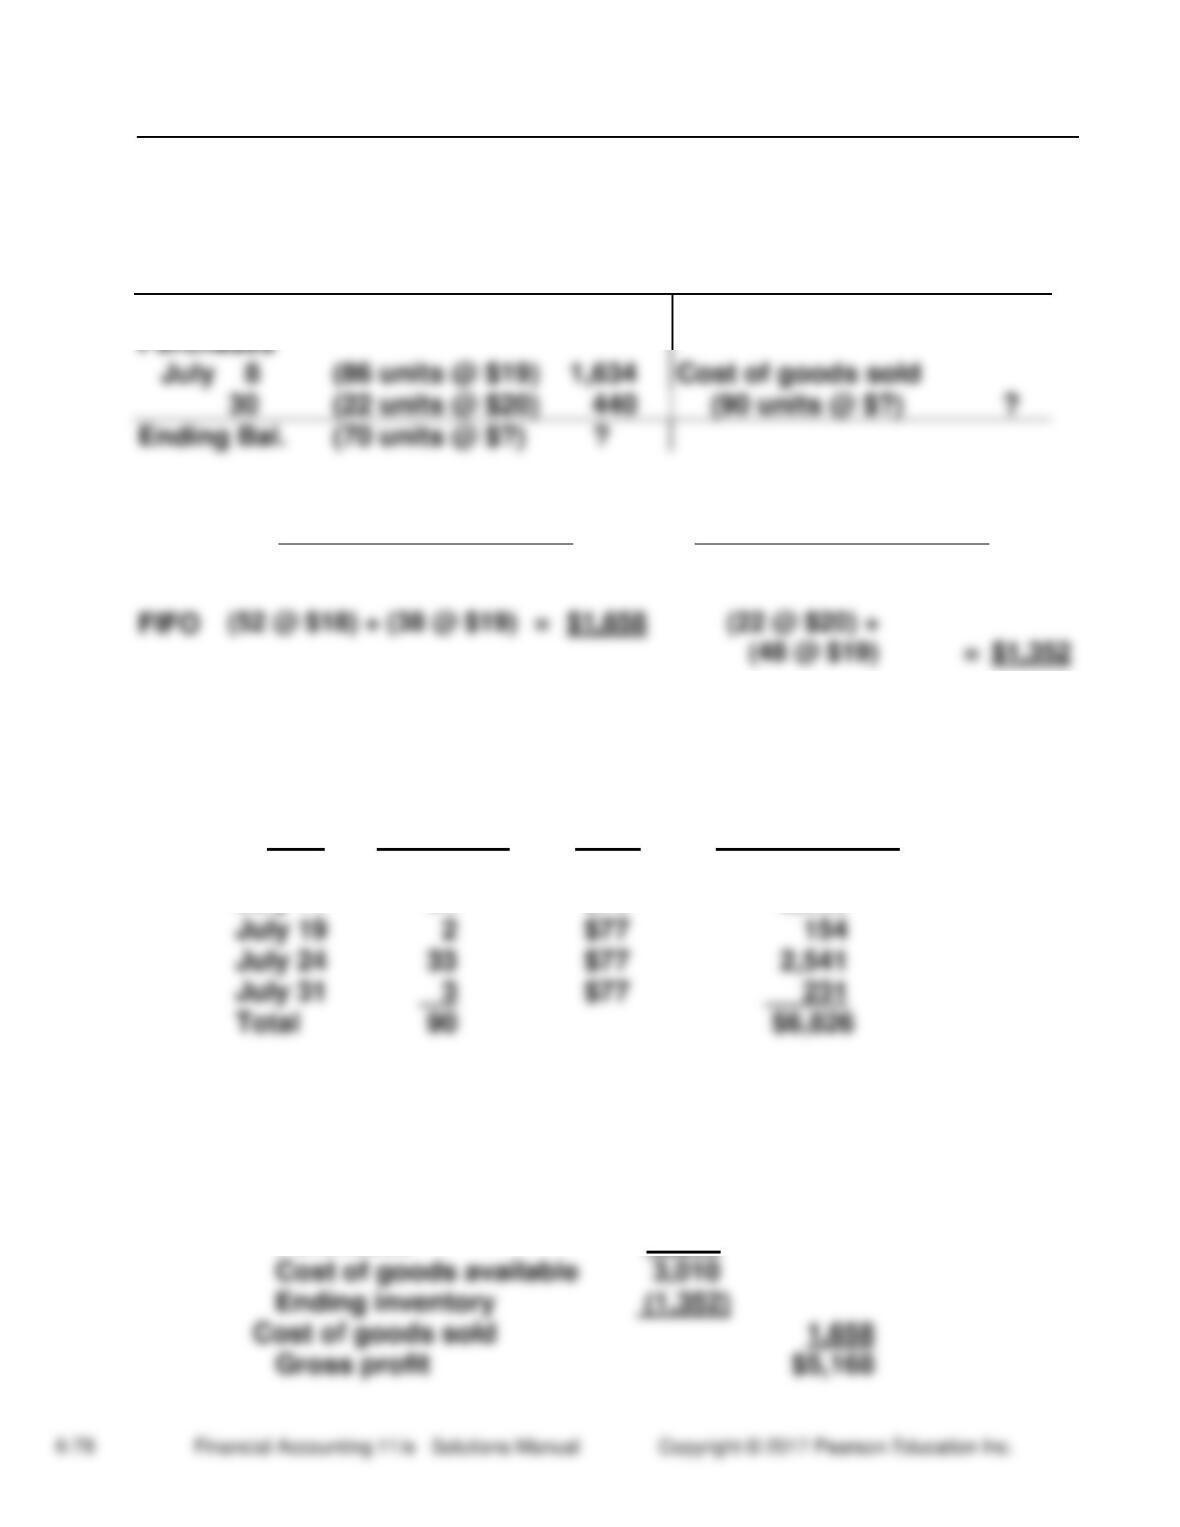
Req. 1
Inventory
Begin. Bal.
(52 units @ $18) 936
Purchases
July 8
(86 units @ $19) 1,634
Cost of goods sold
30
(22 units @ $20) 440
Ending Bal.
(70 units @ $?) ?
Cost of Goods Sold
Ending Inventory
Req. 2
Date
Units Sold
Selling
Price
Total Revenue
July 3
18
$75
$1,350
July 11
34
$75
2,550
July 19
$77
154
July 24
33
$77
2,541
July 31
3
Total
90
$6,826
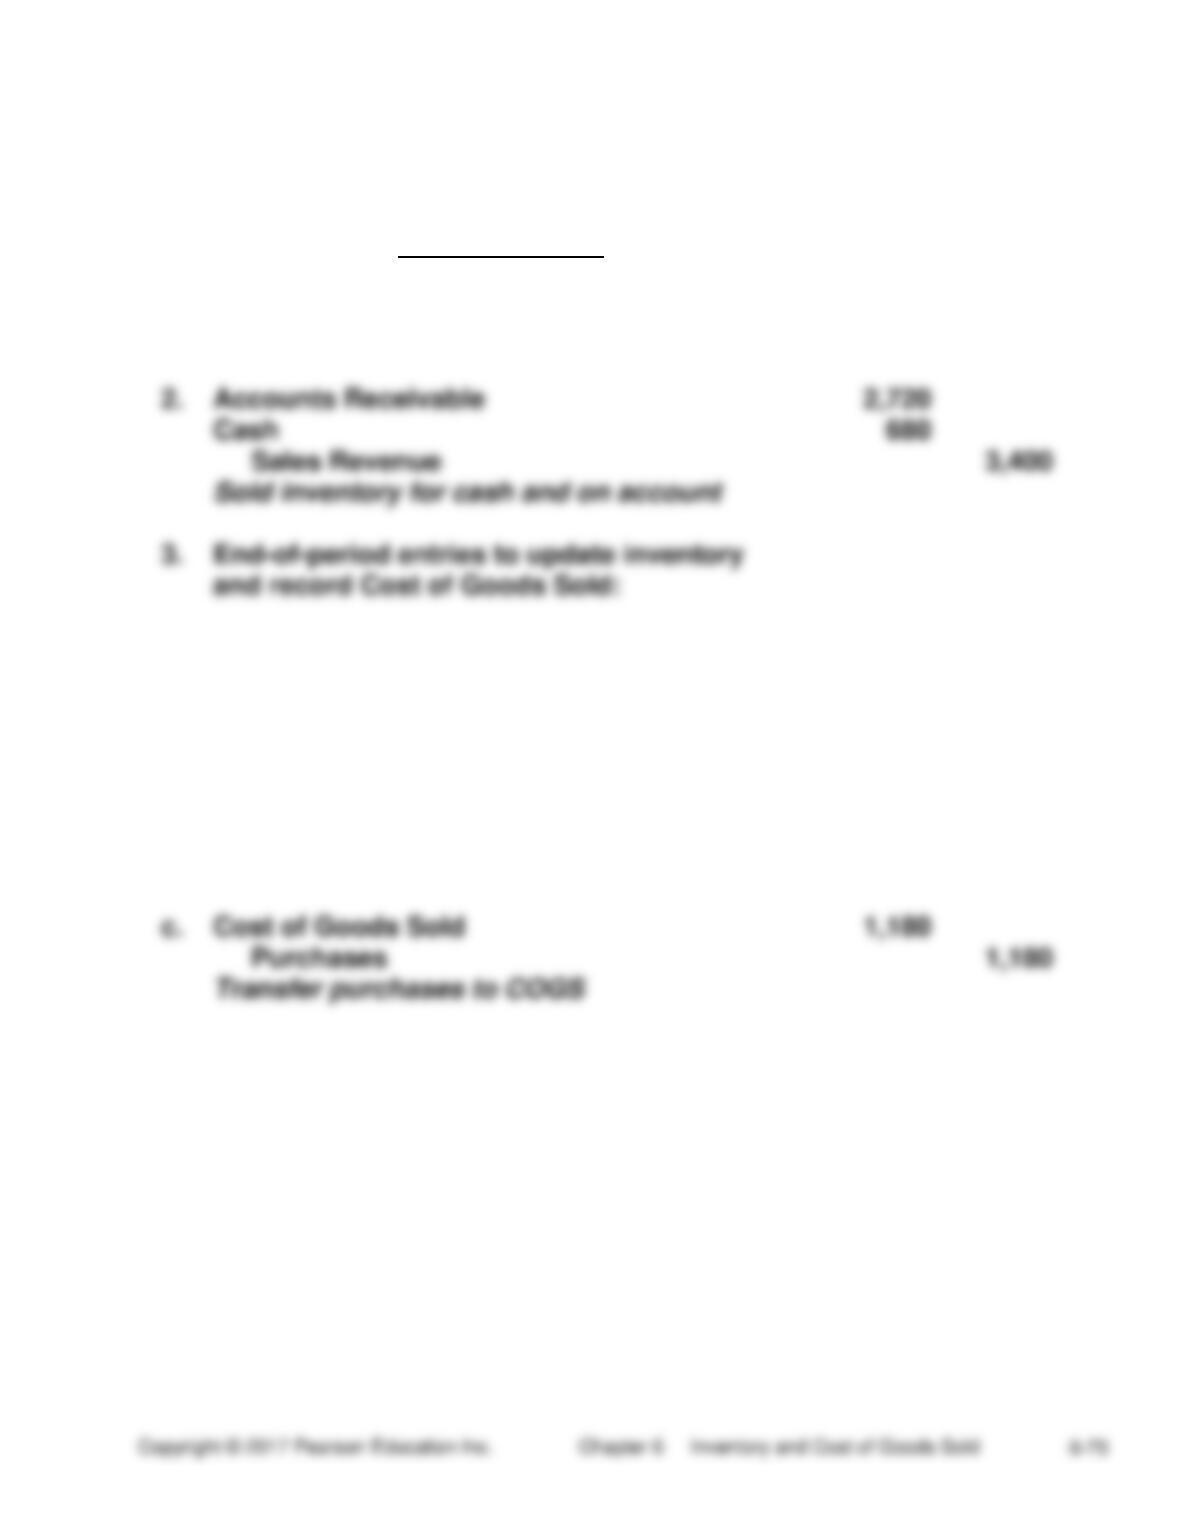
Championship Outlet
Income Statement (Partial)
Sales revenue
$6,826
Cost of goods sold:
Beginning inventory
$ 936
Purchases
2,074
Cost of goods available
Ending inventory
(1,352)
Cost of goods sold
Gross profit
$5,168
(20-30 min.) P6A–6
Req. 1 (Journal entries)
General Journal
(thousands)
1.
Purchases
1,180
Accounts Payable
1,180
Purchased inventory on account
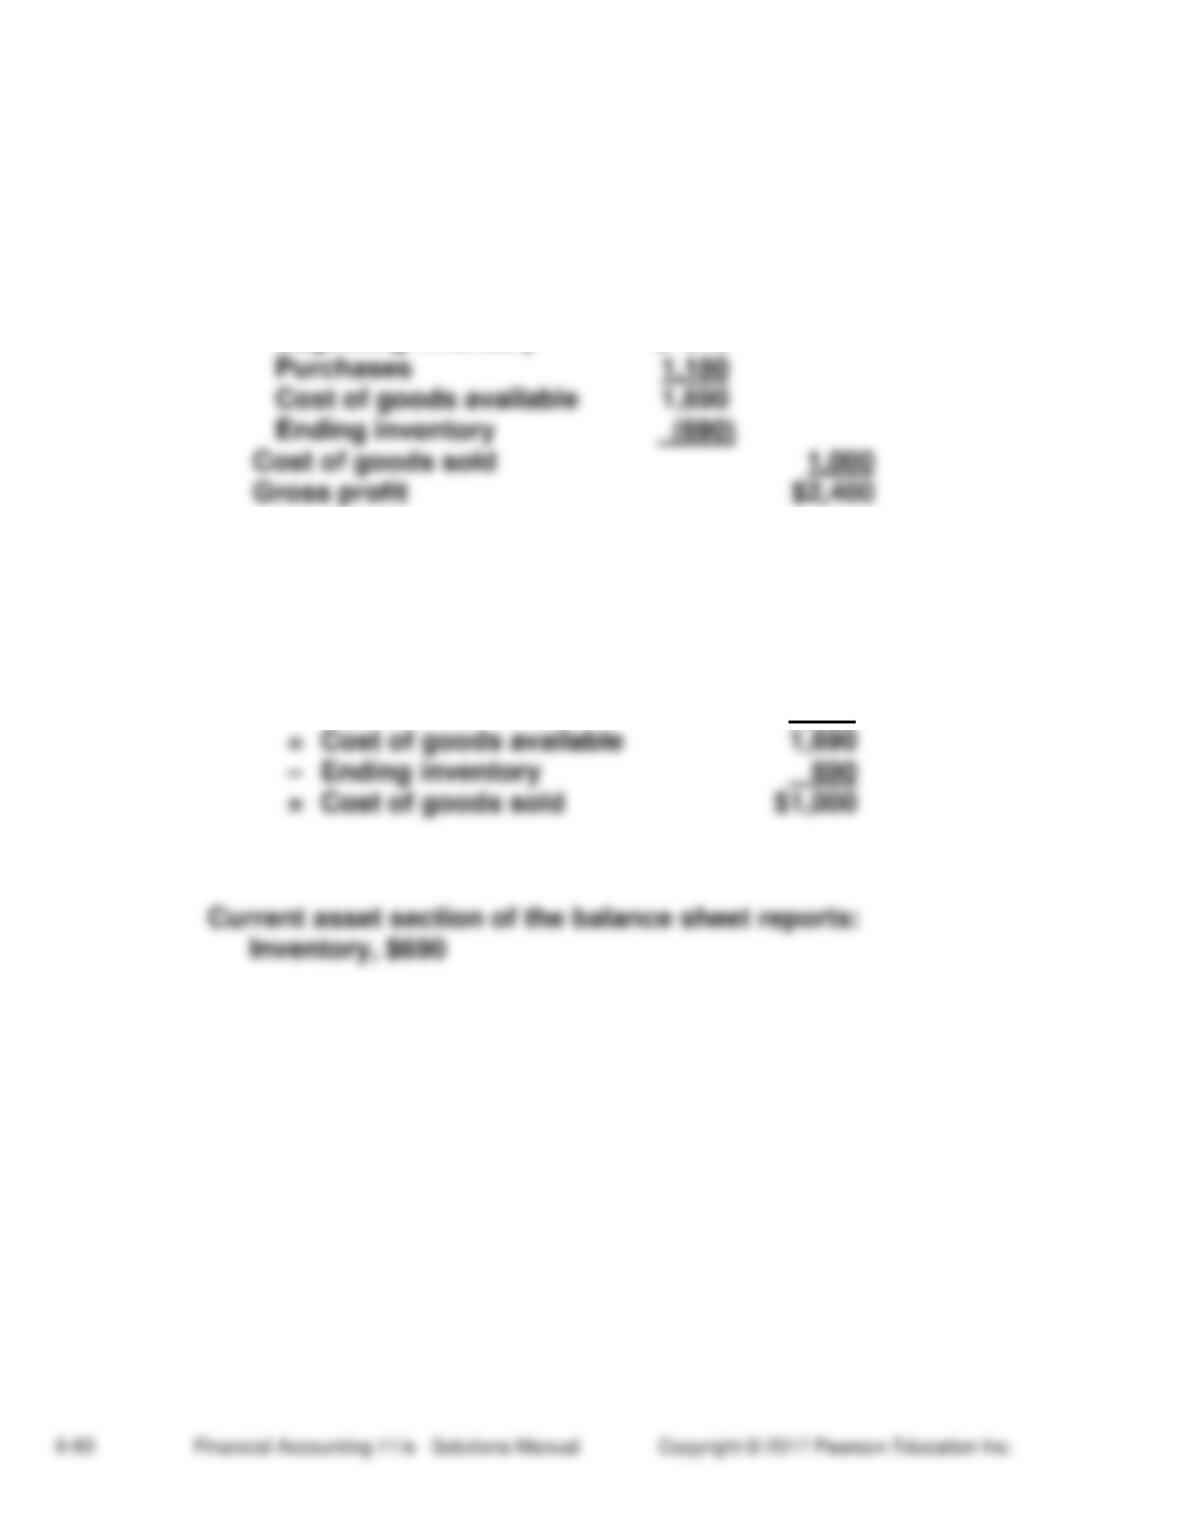
2.
Accounts Receivable
Cash
680
Sales Revenue
3,400
Sold inventory for cash and on account
a.
Cost of Goods Sold
510
Inventory (beginning balance)
510
Transfer beginning inventory to COGS
b.
Inventory (ending balance)
690
Cost of Goods Sold
690
c.
Cost of Goods Sold
Purchases
1,180
Set up ending inventory based on physical
count
(continued) P6A-6
Req. 2
Just Desserts, Inc.
Income Statement (Partial)
Sales revenue
$3,400
Cost of goods sold:
Beginning inventory
$ 510
Purchases
Ending inventory
Cost of goods sold
Gross profit
$2,400
Cost-of-Goods-Sold Model
Beginning inventory
$ 510
+ Purchases
1,180
= Cost of goods available
1,690
690