331
CHAPTER 11
COST-VOLUME-PROFIT ANALYSIS
CLASS DISCUSSION QUESTIONS
1. Total variable costs vary in direct proportion
to changes in the level of activity. Unit varia-
ble costs remain the same with changes in
4. a. Fixed costs
b. Fixed costs
c. Fixed costs
5. Mixed costs are separated into their fixed
and variable cost components.
at that level to determine the total fixed cost.
10. a. No impact on the contribution margin.
b. Operating income would decrease.
11. A high contribution margin ratio, coupled
with idle capacity, indicates a potential for
increased operating income if additional sales
can be made. A large percentage of each
advantage of the low ratio of variable costs
to sales.
12. Decreases in unit variable costs, such as a
point for Gouda Company.
15. CVP analysis depends on five primary as-
sumptions. They are (1) total sales and total
costs can be represented by straight lines;
(2) within the relevant range of operating
activity, the efficiency of operations does not
sales mix percentages.
17. Operating leverage measures the relative
mix of a business’s variable costs and fixed
costs. Operating leverage measures the re-
lationship of a company’s contribution mar-
gin to operating income. It is computed as
332
EXERCISES
E11–1
1. Fixed
2. Variable
3. Variable
9. Fixed
10. Mixed
11. Variable
E11–2
a. Graph Two
d. Graph One
E11–3
1. a
2. b
333
E11–4
1. g
*(f) is better than (b) because the administrative costs would be the same
for expensive and inexpensive cars.
E11–5
a. Variable
b. Variable
c. Variable
g. Fixed
h. Fixed*
i. Fixed
334
E11–6
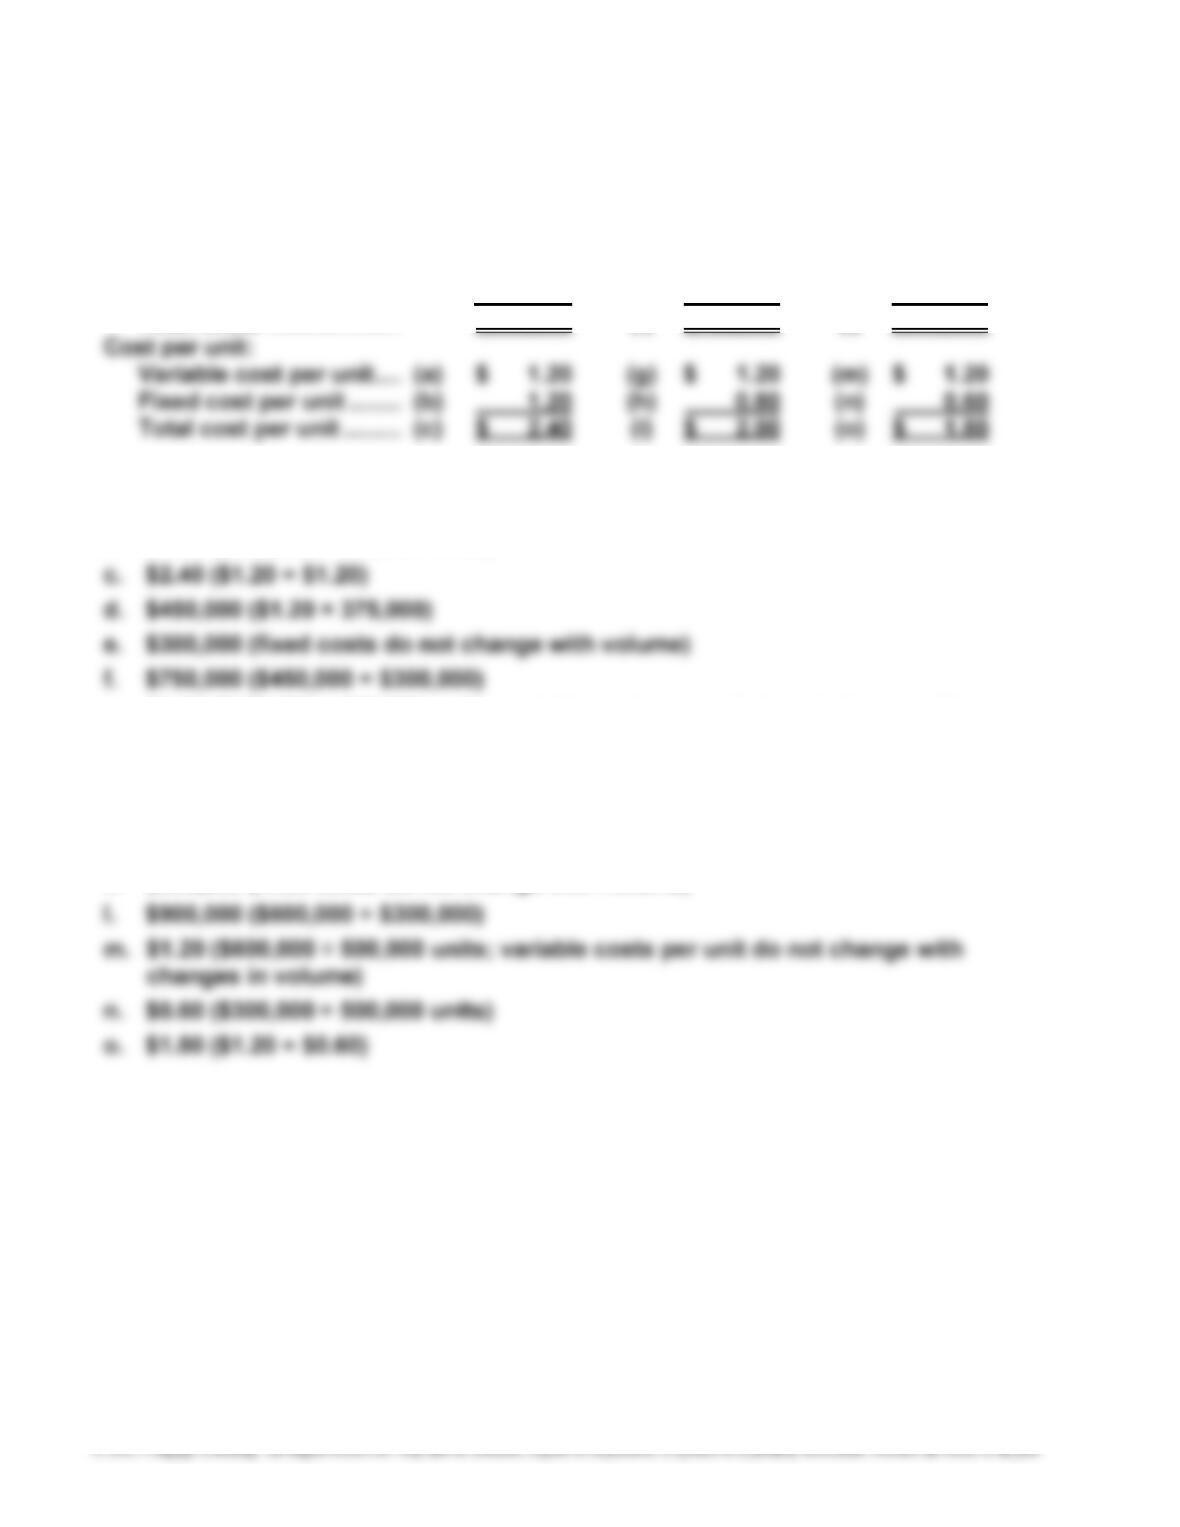
Components produced …… 250,000 375,000 500,000
Total costs:
Total variable costs ……. $300,000 (d) $450,000 (j) $600,000
Total fixed costs ………… 300,000 (e) 300,000 (k) 300,000
Total costs ………………… $600,000 (f) $750,000 (l) $900,000
Supporting calculations:
a. $1.20 ($300,000 ÷ 250,000 units)
b. $1.20 ($300,000 ÷ 250,000 units)
g. $1.20 ($450,000 ÷ 375,000 units; variable costs per unit do not change with
changes in volume)
h. $0.80 ($300,000 ÷ 375,000 units)
i. $2.00 ($1.20 + $0.80)
j. $600,000 ($1.20 × 500,000 units)
k. $300,000 (fixed costs do not change with volume)
335
E11–7
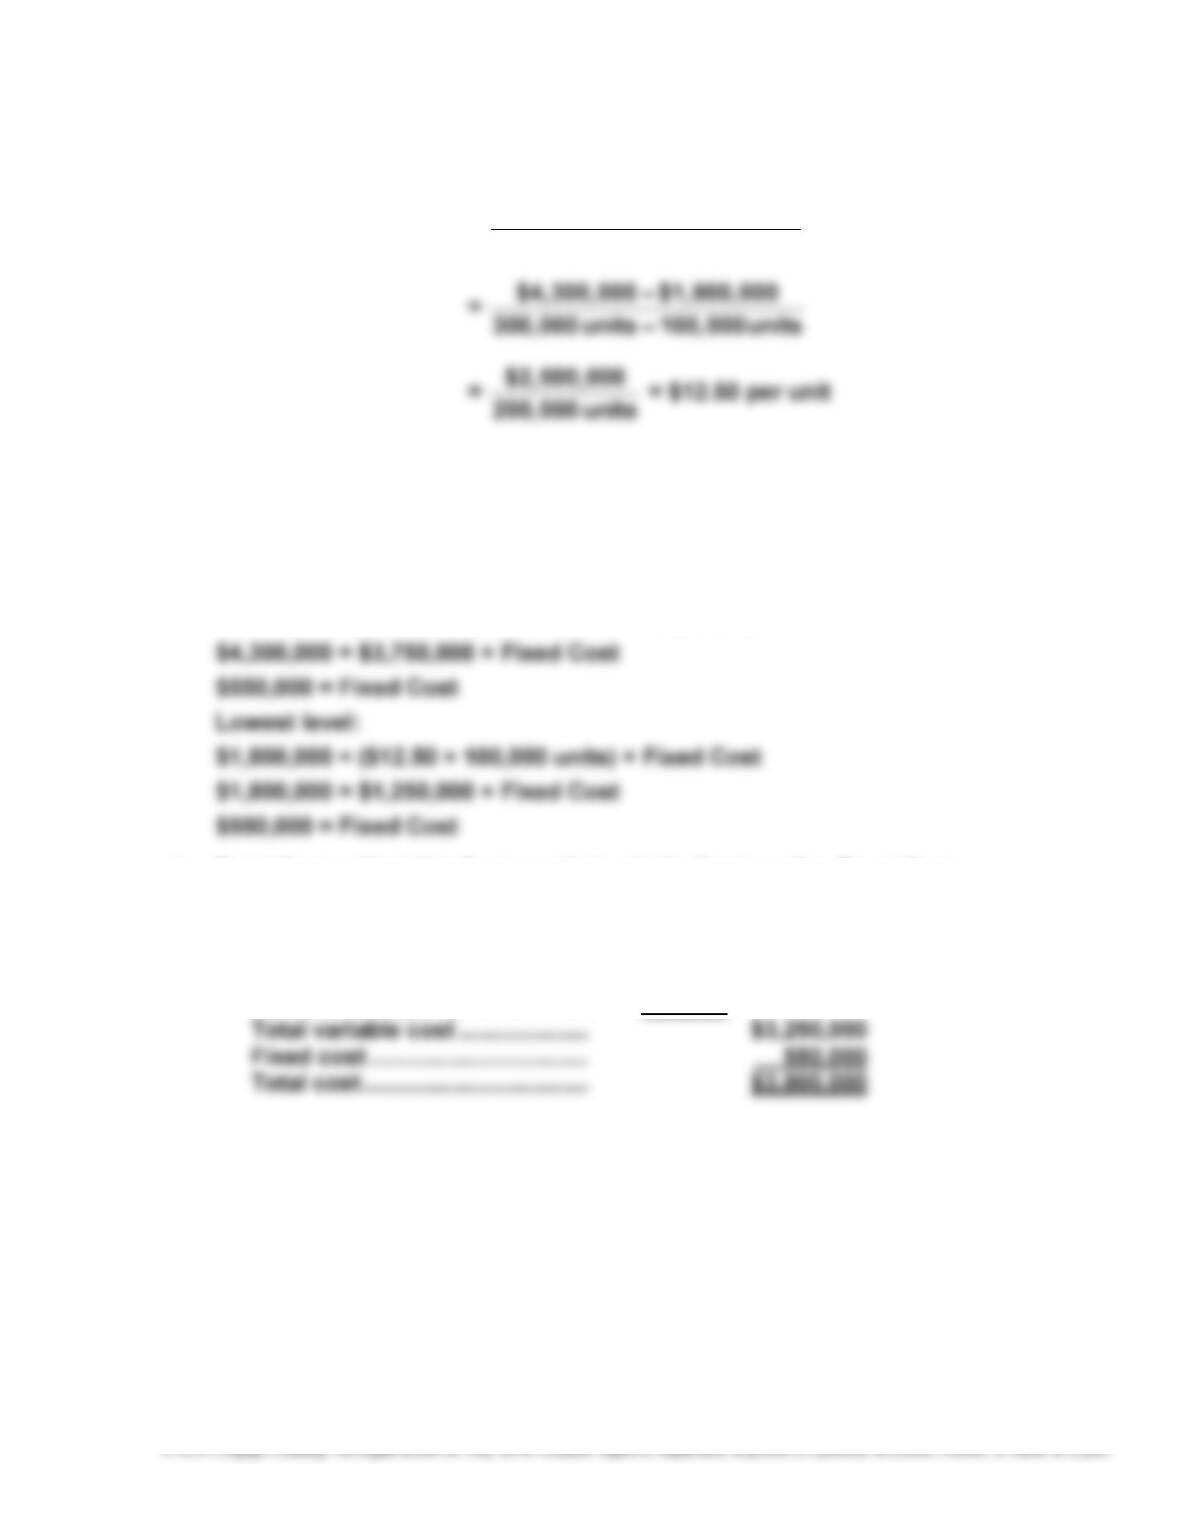
a. Variable Cost per Unit = Difference in Total Cost
Difference in Units Produced
The fixed cost can be determined by subtracting the estimated total variable
cost from the total cost at either the highest or lowest level of production, as
follows:
Total Cost = (Variable Cost per Unit × Units Produced) + Fixed Cost
Highest level:
$4,300,000 = ($12.50 × 300,000 units) + Fixed Cost
b. Total Cost = (Variable Cost per Unit × Units Produced) + Fixed Cost
Total cost for 260,000 units:
Variable cost:
Units ……………………………………. 260,000
Variable cost per unit …………… × $12.50
336
E11–8
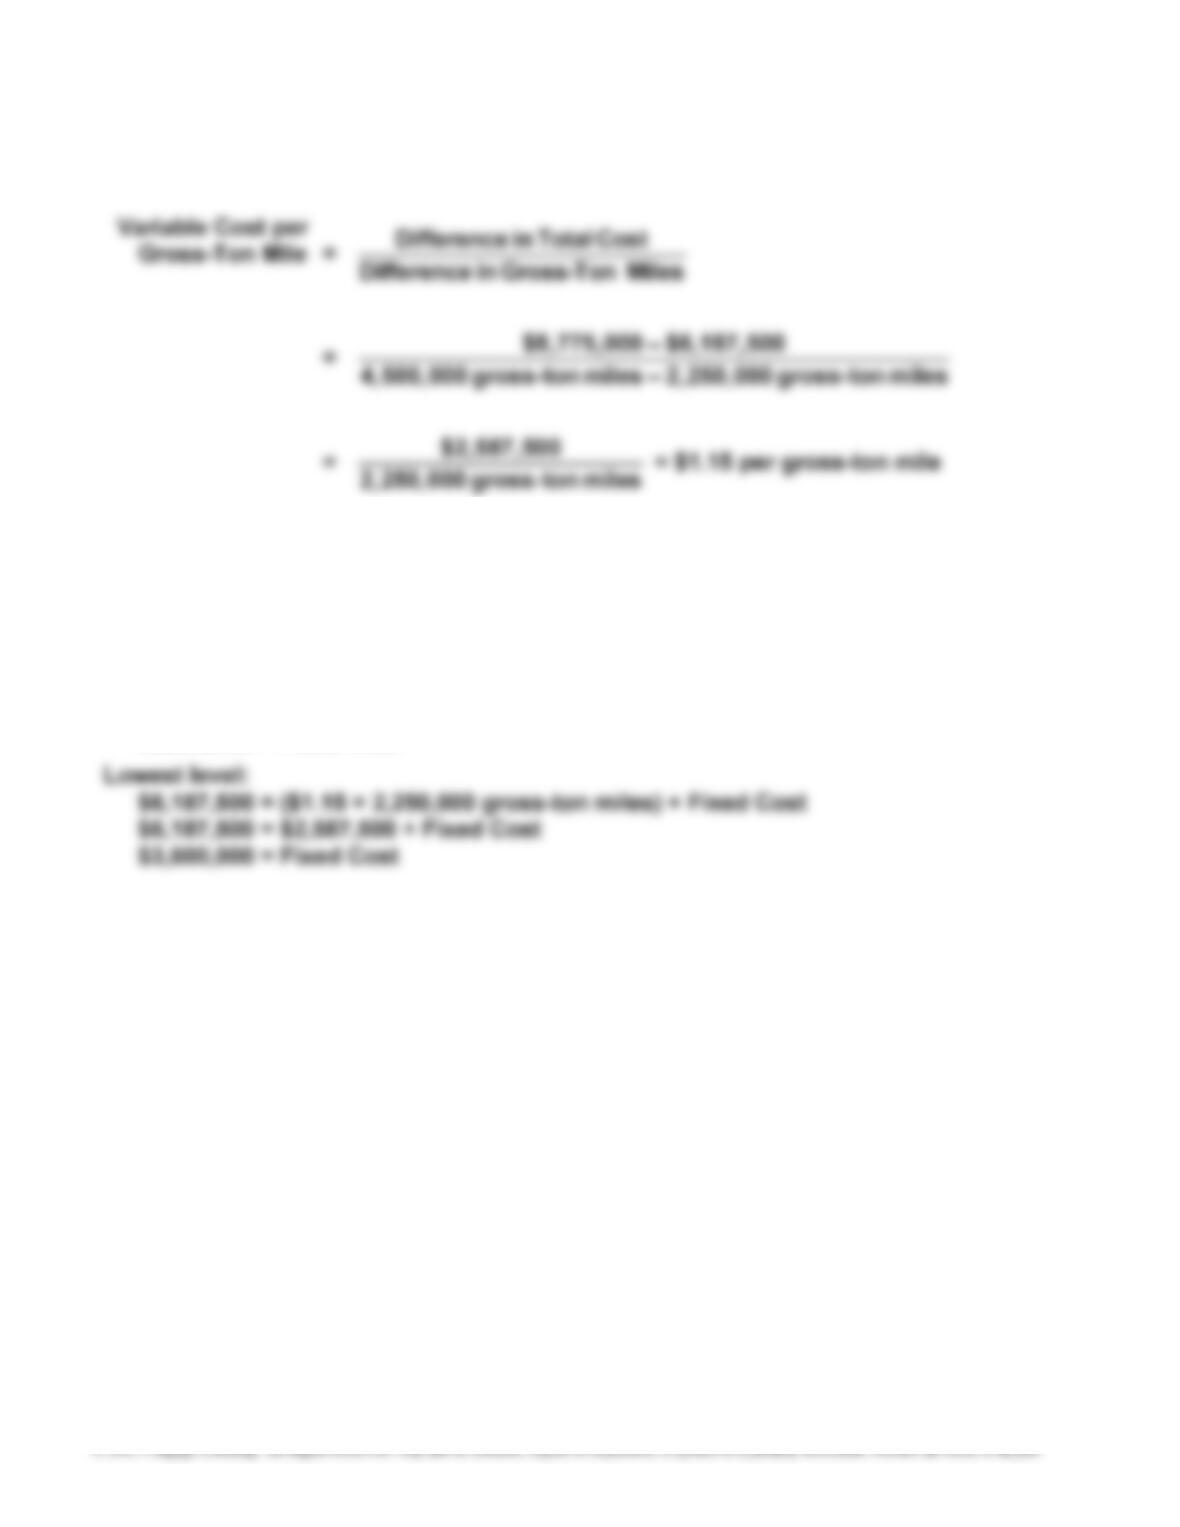
The fixed cost can be determined by subtracting the estimated total variable cost
from the total cost at either the highest or lowest level of gross-ton mile, as fol-
lows:
Total Cost = (Variable Cost per Gross-Ton Mile × Gross-Ton Miles) + Fixed Cost
Highest level:
$8,775,000 = ($1.15 × 4,500,000 gross-ton miles) + Fixed Cost
$8,775,000 = $5,175,000 + Fixed Cost
$3,600,000 = Fixed Cost
337
E11–9
b.
Sales ………………………………. $3,100,000
Contribution margin ratio … × 35%
Contribution margin ………… $1,085,000
Less fixed costs ……………… (675,000)
Operating income ……………. $ 410,000
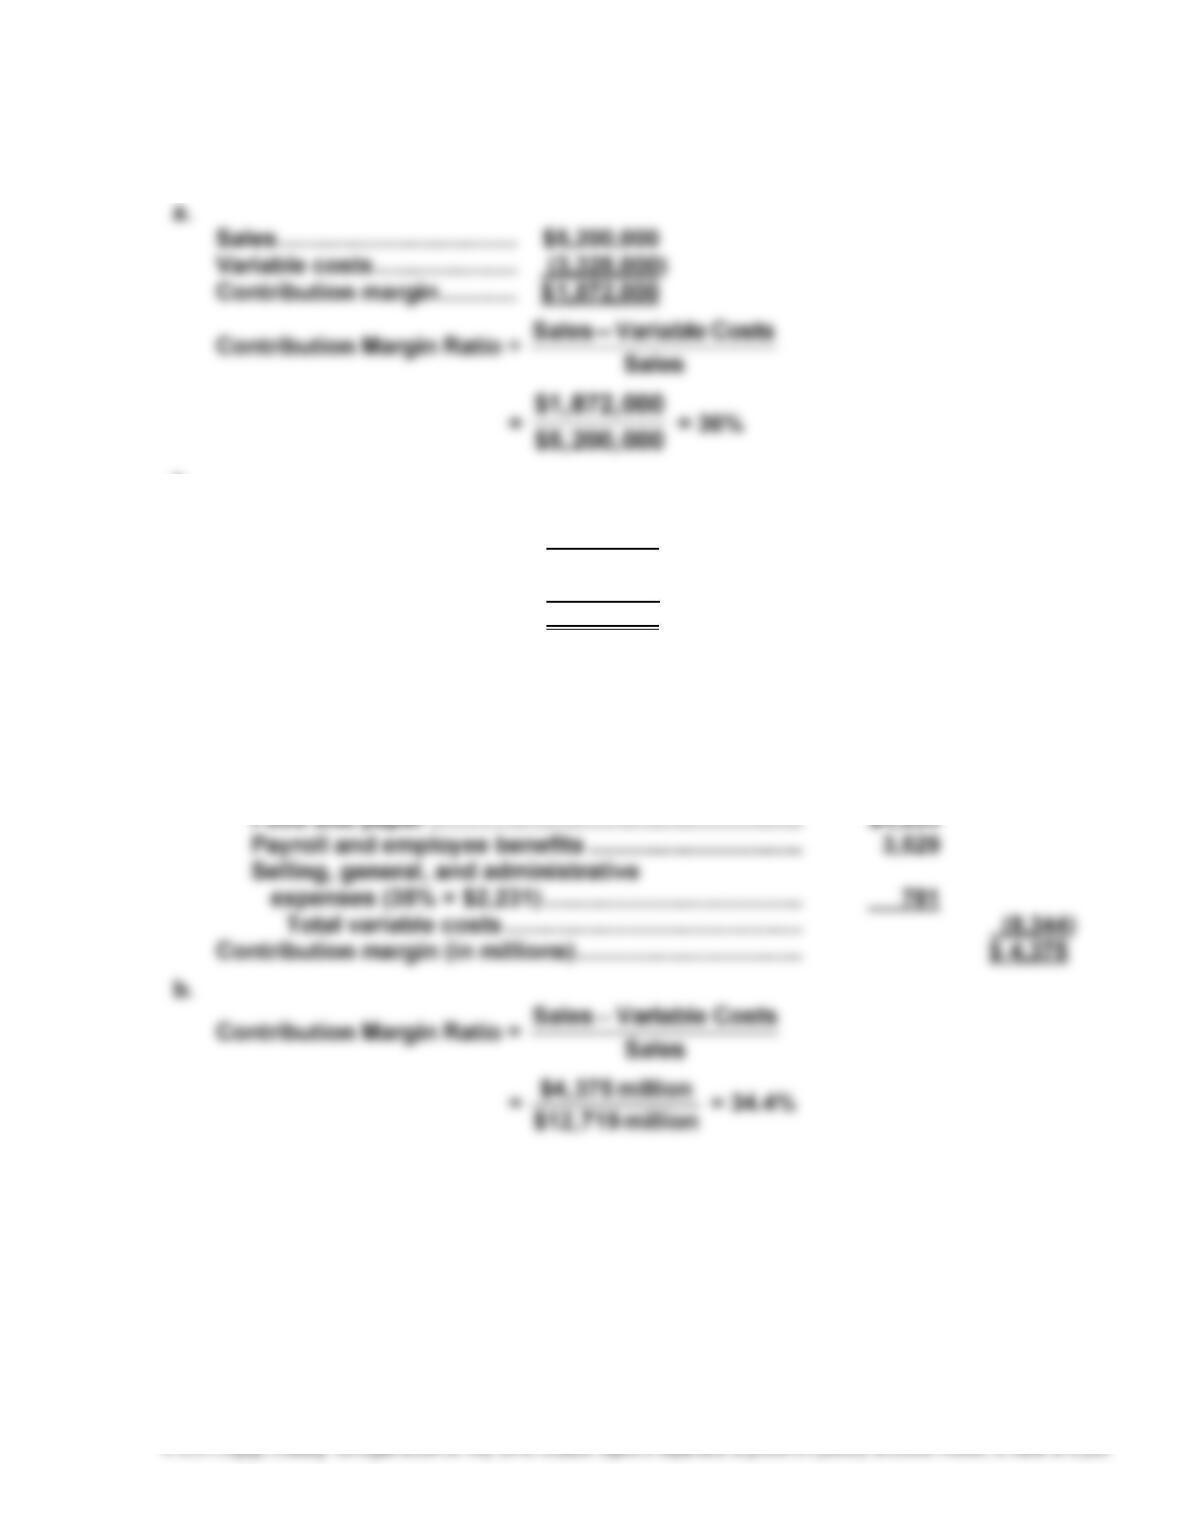
E11–10
a.
Sales (in millions) …………………………………………………… $12,719
Variable costs (in millions):
338
E11–10, Concluded
c. Same-store sales increase (in millions) ………………….. $ 250
Contribution margin ratio [from part (b)] ………………… × 34.4%
Increase in operating income (in millions) ……………… $ 86
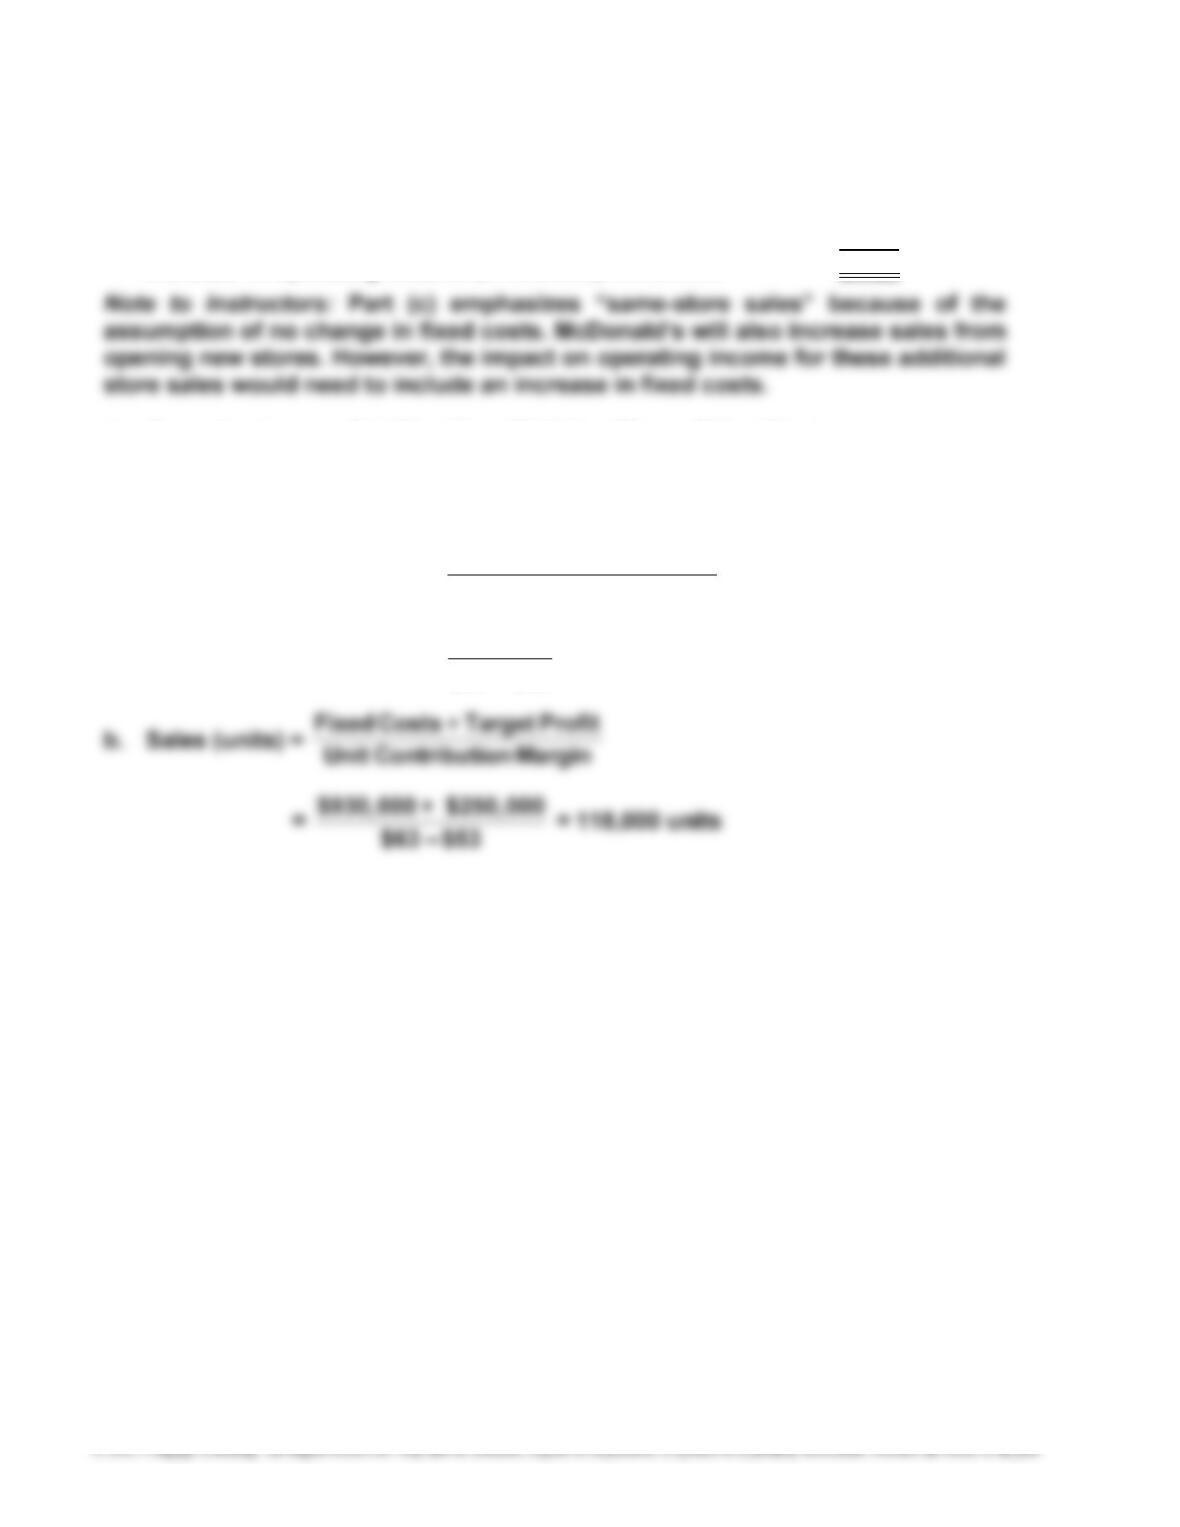
d. Operating income $1,326 million ($1,240 million + $86 million)
E11–11
a. Break-Even Sales (units) = Margin onContributiUnit
Costs Fixed
=
$930,000
$63 – $53 = 93,000 units
339
E11–12
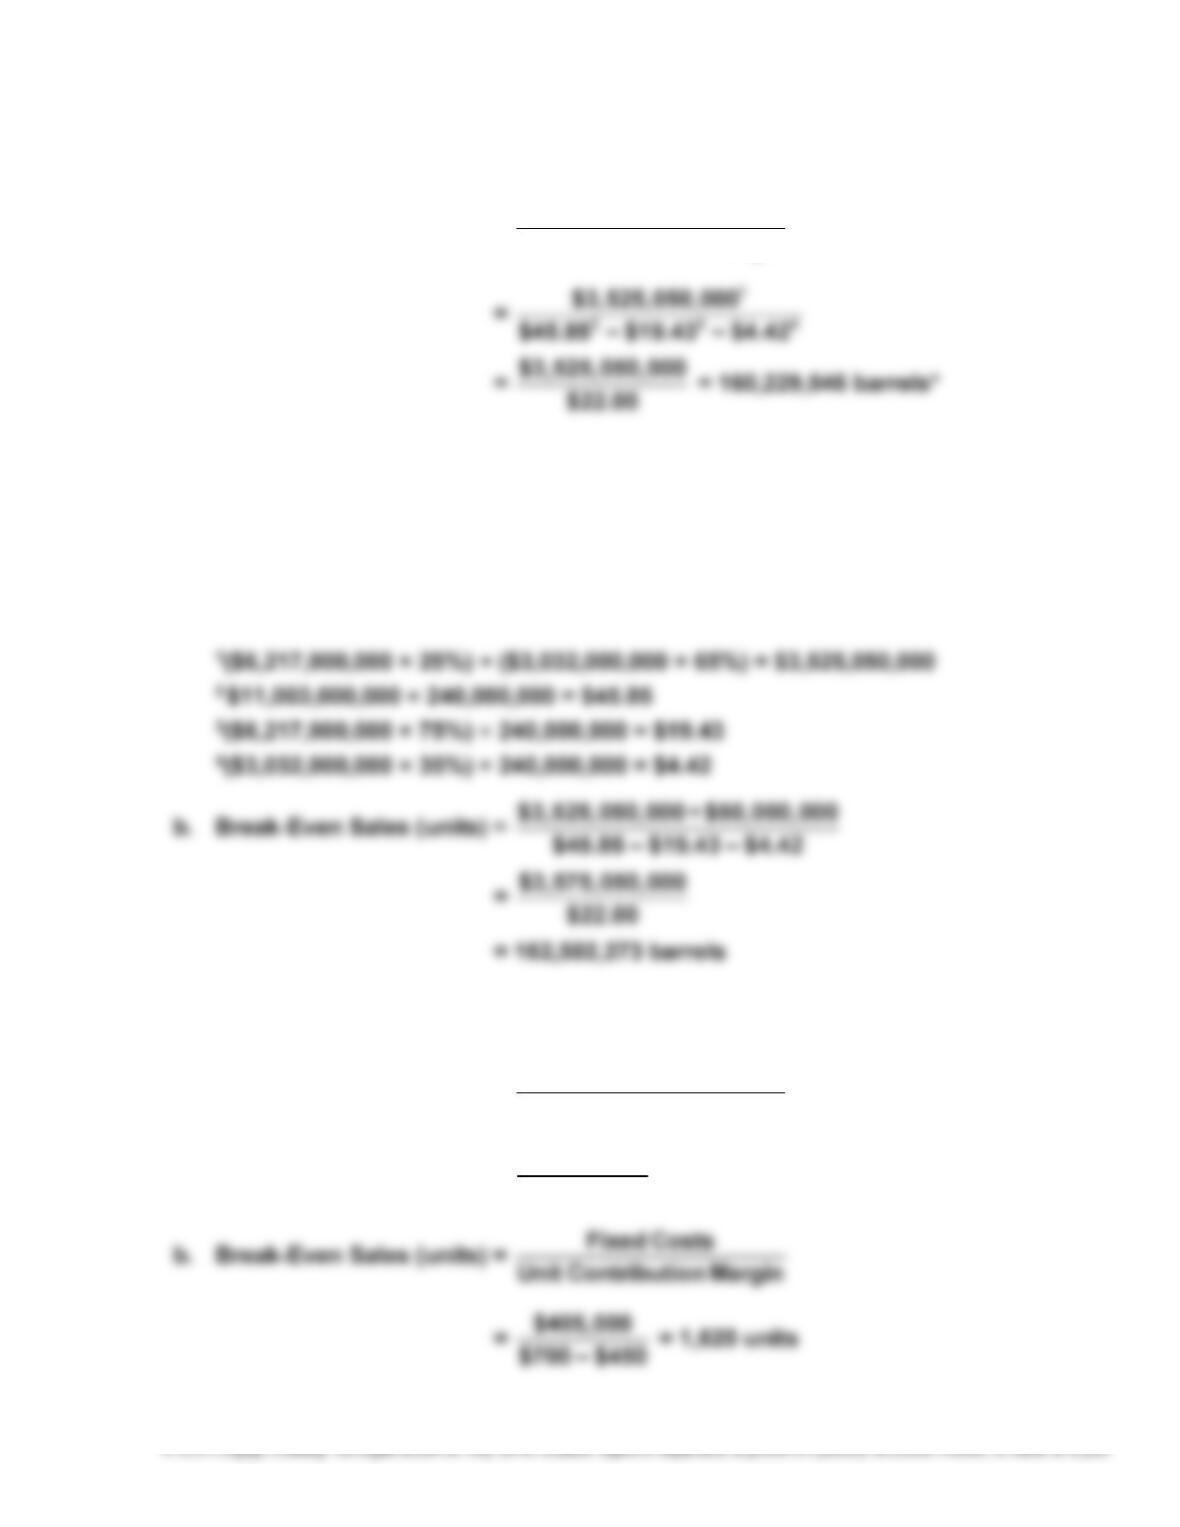
a. Break-Even Sales (units) = Margin onContributiUnit
Costs Fixed
*Rounded 160,229,545.46 barrels up to next barrel so that break-even will be
achieved.
The variable costs per unit are determined by multiplying the total amount of
each cost by the variable cost percentage (75% for cost of goods sold and
35% for selling, general and administrative costs), then dividing by the
number of barrels.
E11–13
a. Break-Even Sales (units) = arginM onContributiUnit
Costs Fixed
=
$405,000
$675 – $450 = 1,800 units
340
E11–14
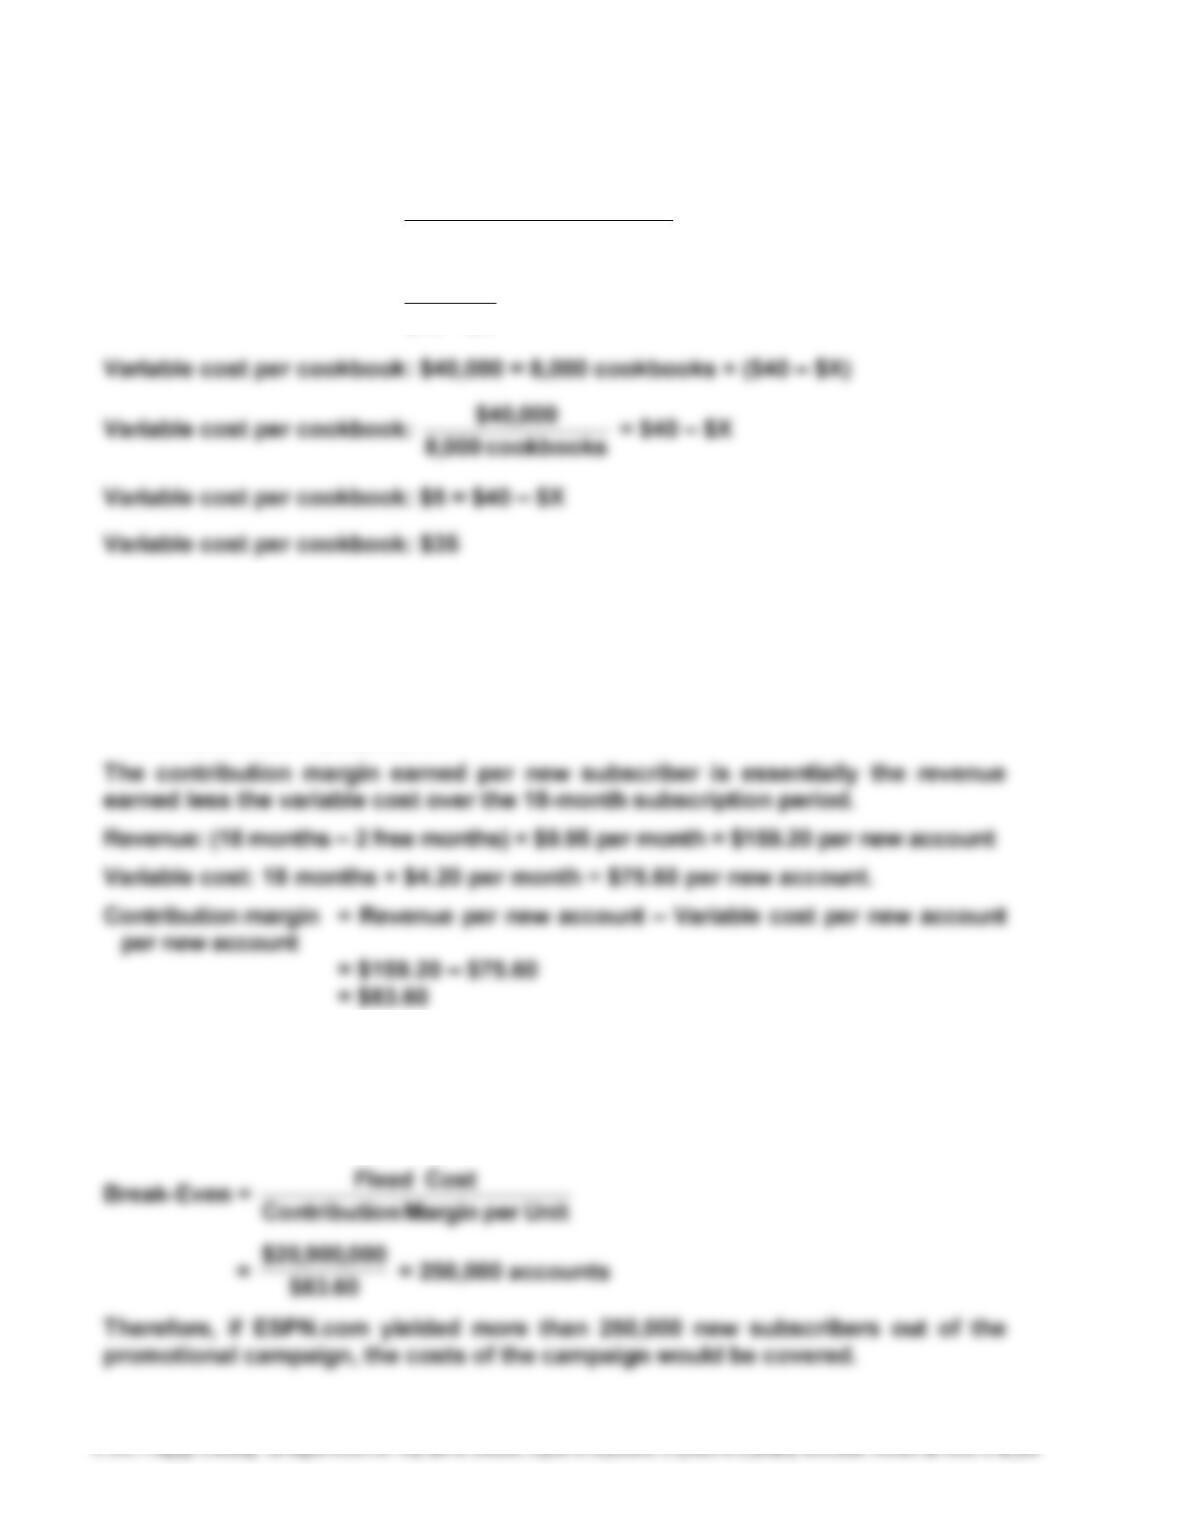
Break-Even Sales (units) = arginM onContributiUnit
Costs Fixed
=
$40,000
$40 – $X = 8,000 cookbooks
E11–15
The cost of the promotion campaign is the fixed cost in this analysis since we
want to determine the break-even adoption rate of the campaign.
Promotional cost = $20,900,000
Note: The variable cost is for 18 months since the costs are incurred even for the
2 free months.
The break-even number of subscribers necessary to cover the fixed cost of the
promotion would be computed as follows:
341
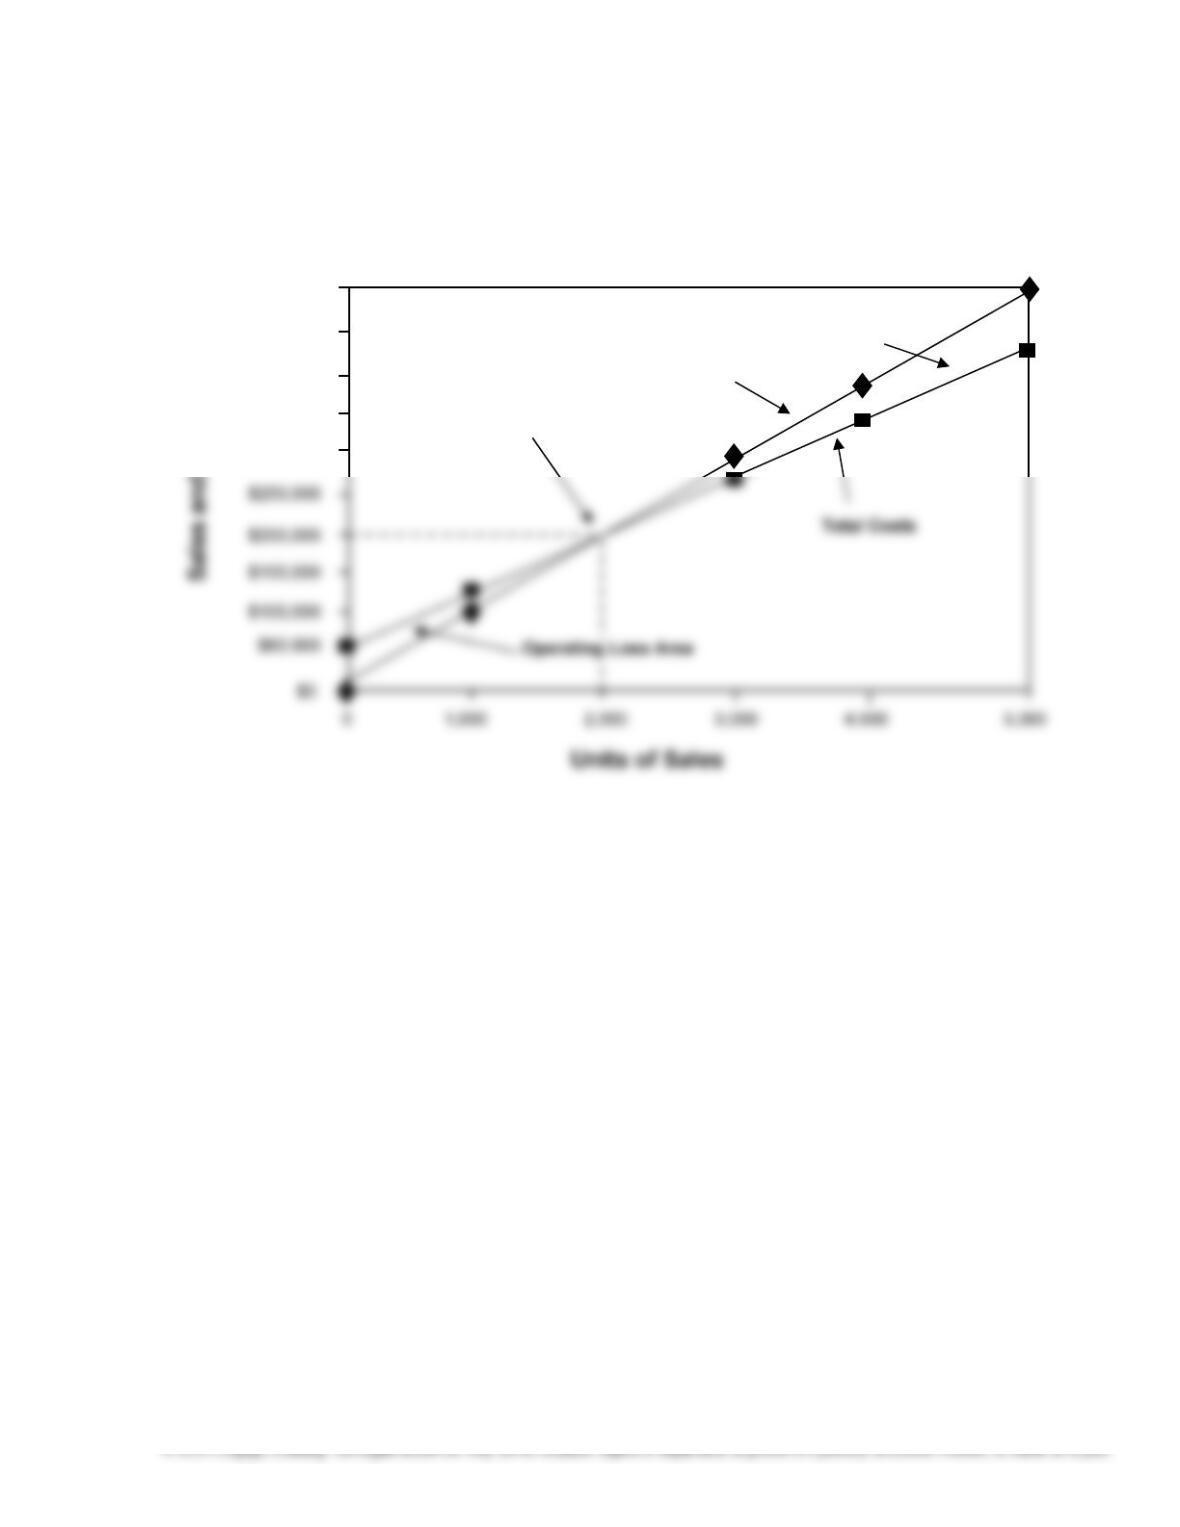
E11–16
a.
b. $200,000 (the intersection of the total sales line and the total costs line)
c. The graphic format permits the user (management) to visually determine the
break-even point and the operating profit or loss for any given level of sales.
$500,000
$450,000
$400,000
$350,000
$300,000
Break-Even
Point
Total
Sales
Operating
Profit Area
342
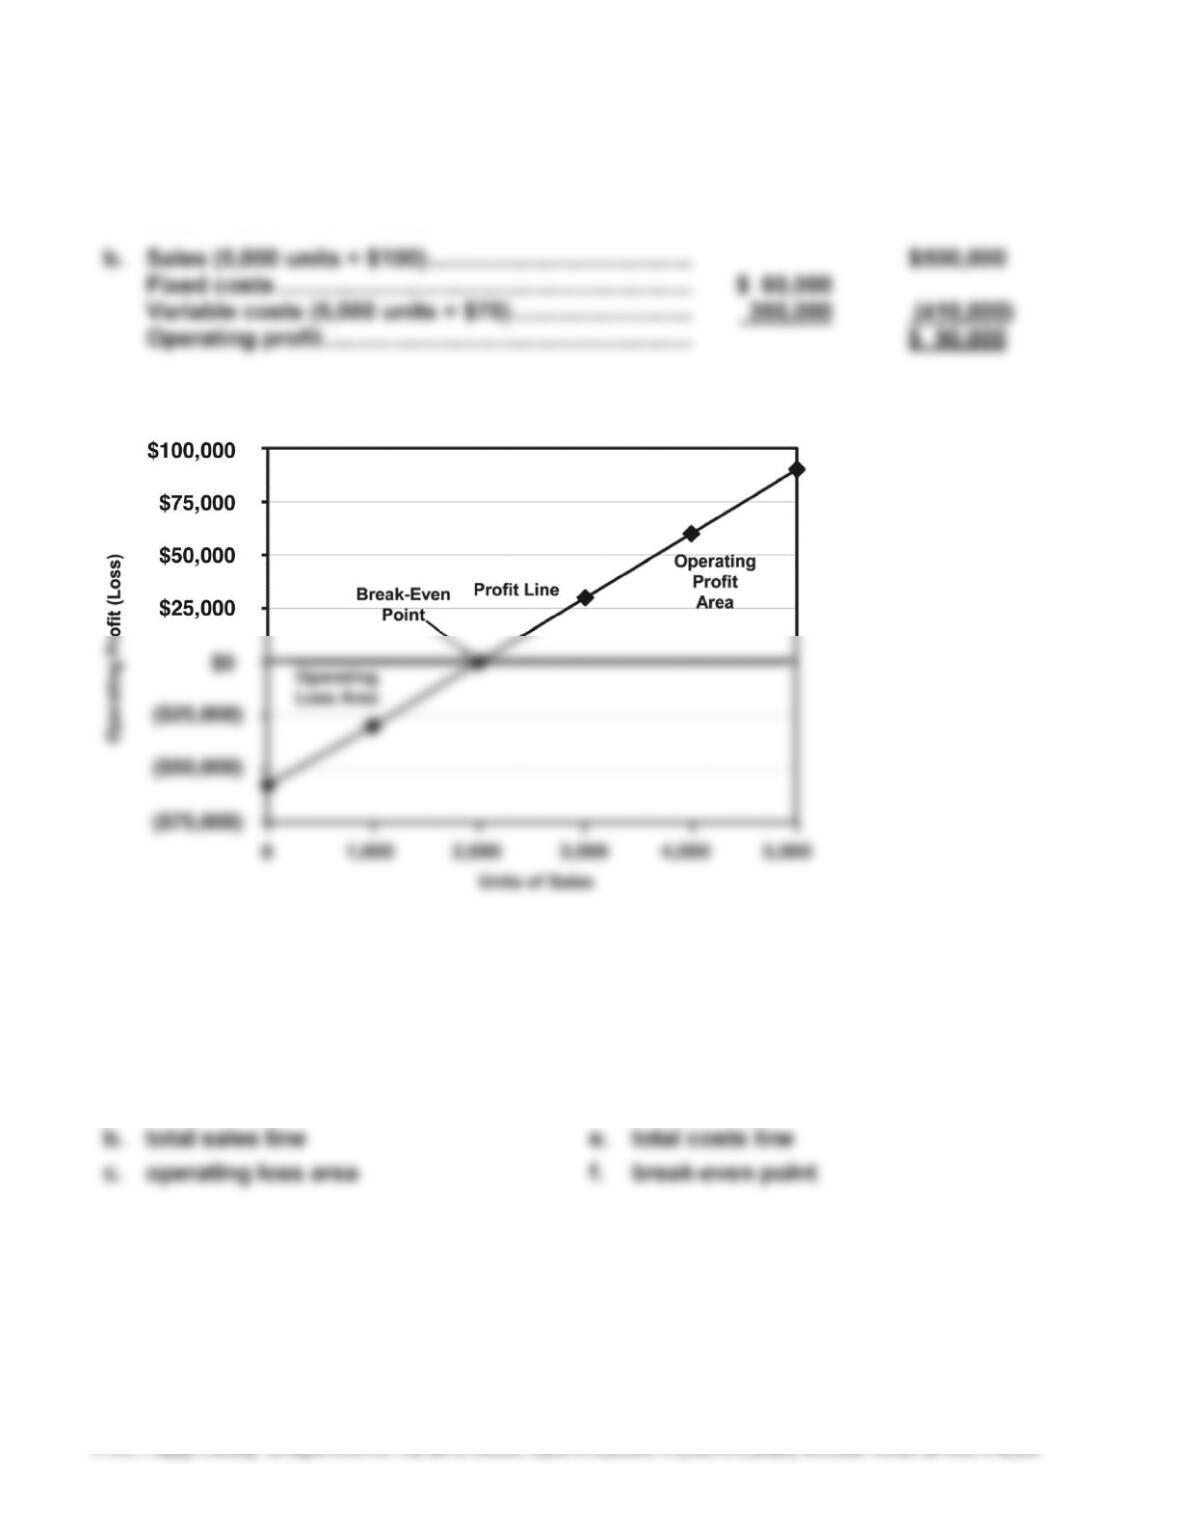
E11–17
a. $60,000 (total fixed costs)
c.
d. 2,000 units (the intersection of the profit line and the horizontal axis)
E11–18
Cost-volume-profit graph
a. fixed costs
d. operating profit area
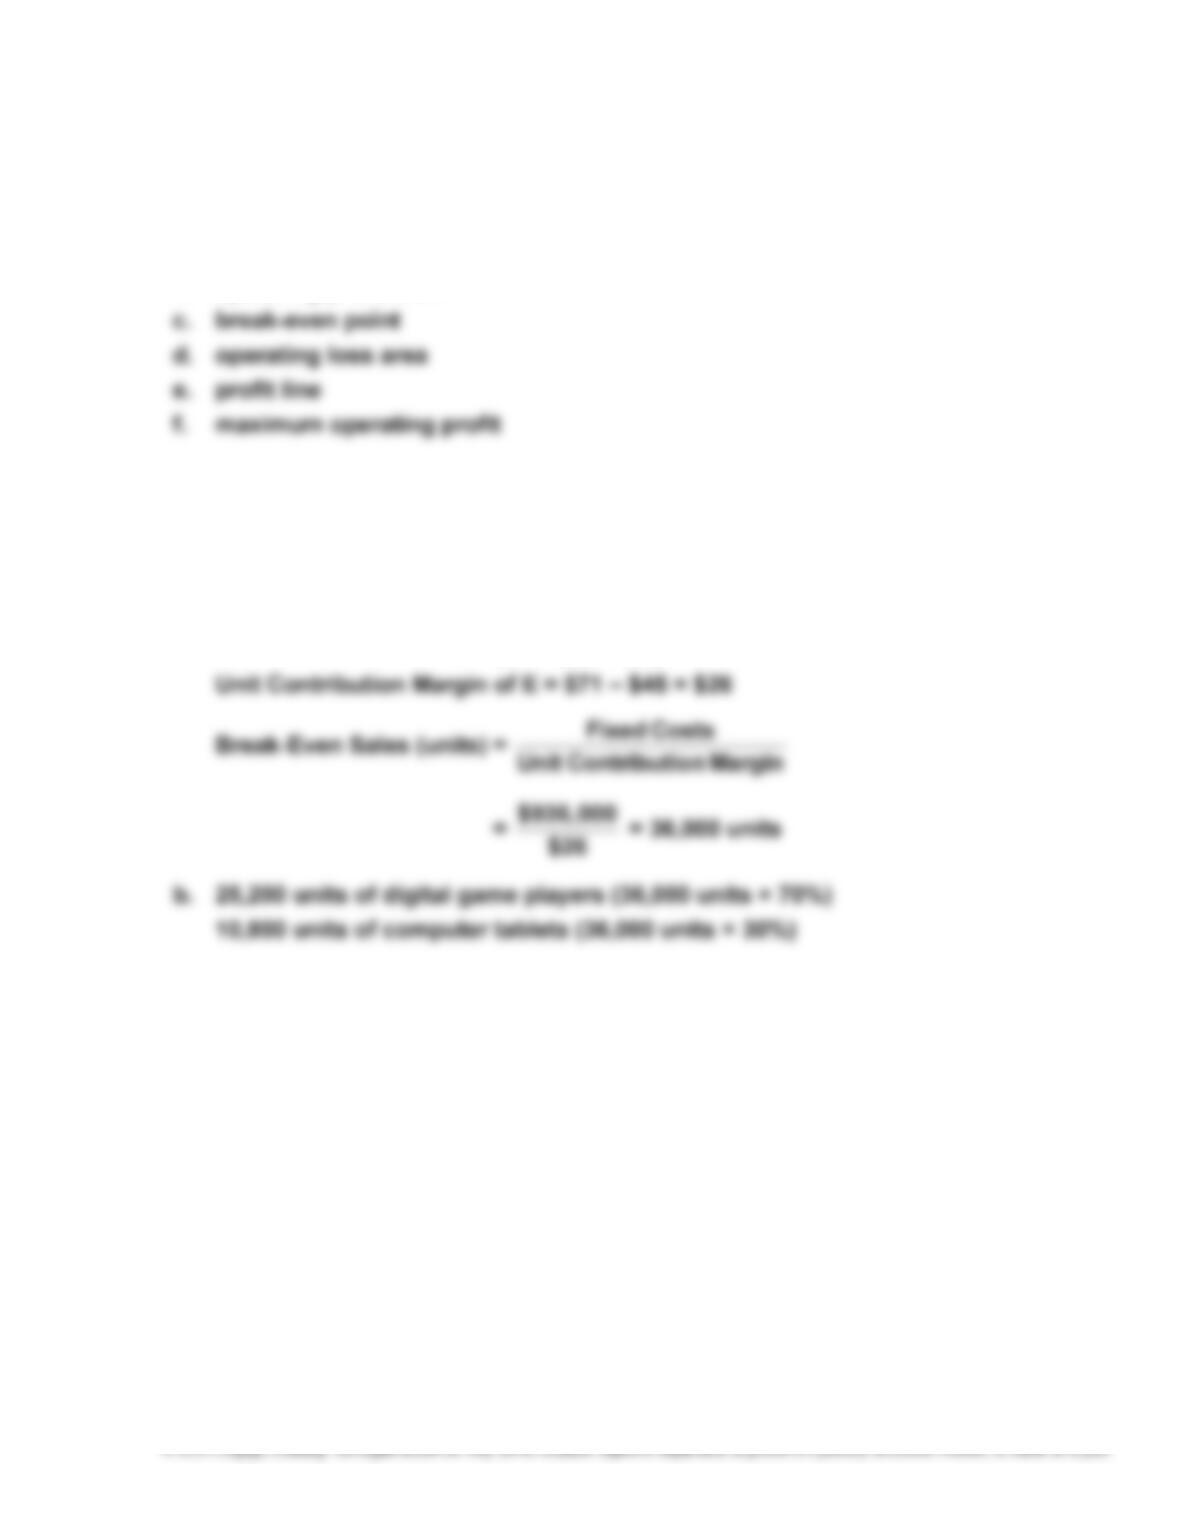
343
E11–19
Profit-volume graph
a. fixed costs or maximum operating loss
b. operating profit area
E11–20
a. Unit Selling Price of E = ($50 × 70%) + ($120 × 30%)
= $35 + $36 = $71
Unit Variable Cost of E = ($30 × 70%) + ($80 × 30%)
= $21 + $24 = $45
344
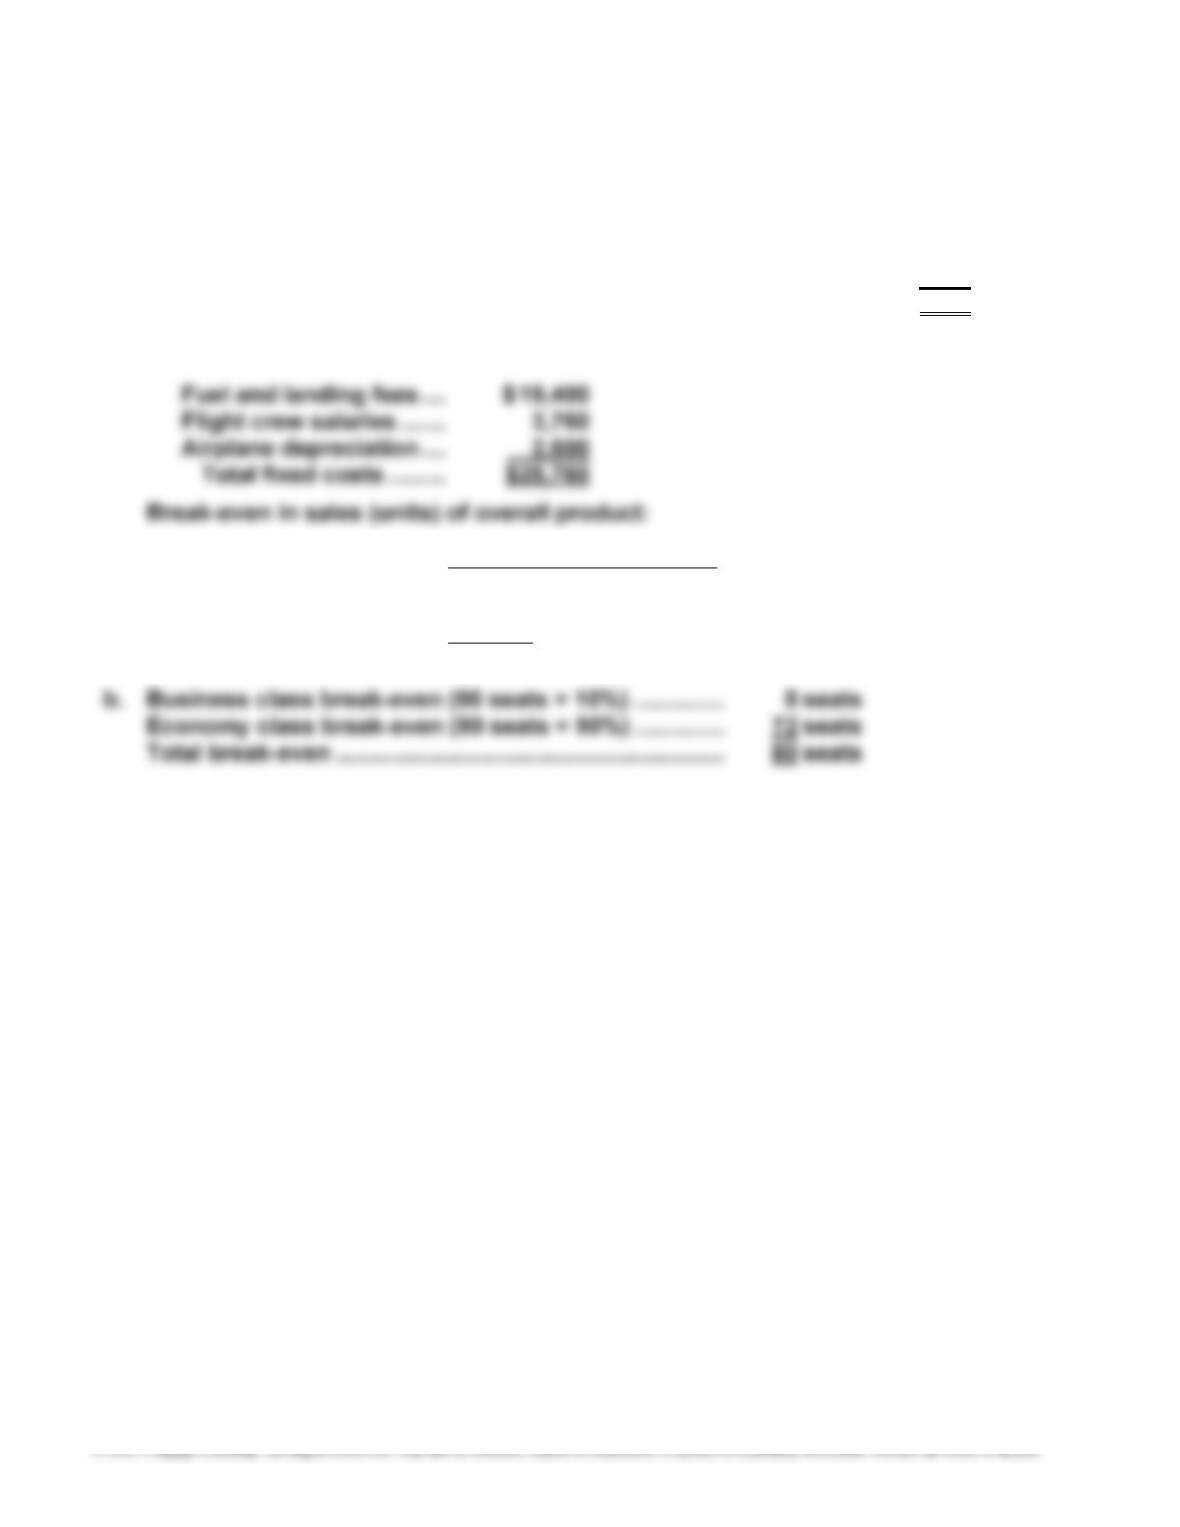
E11–21
a. Unit contribution margin of overall product (E):
Unit selling price of E [(10% × $750) + (90% × $300)] ………………….. $345
Unit variable cost of E [(10% × $50) + (90% × $20)] …………………….. 23
Unit contribution margin of E …………………………………………………… $322
Fixed costs of the Portland to Minneapolis round-trip flight:
Break-Even Sales (units) = Margin onContributiUnit
Costs Fixed
=
322$
760,25$ = 80 seats (tickets)
345
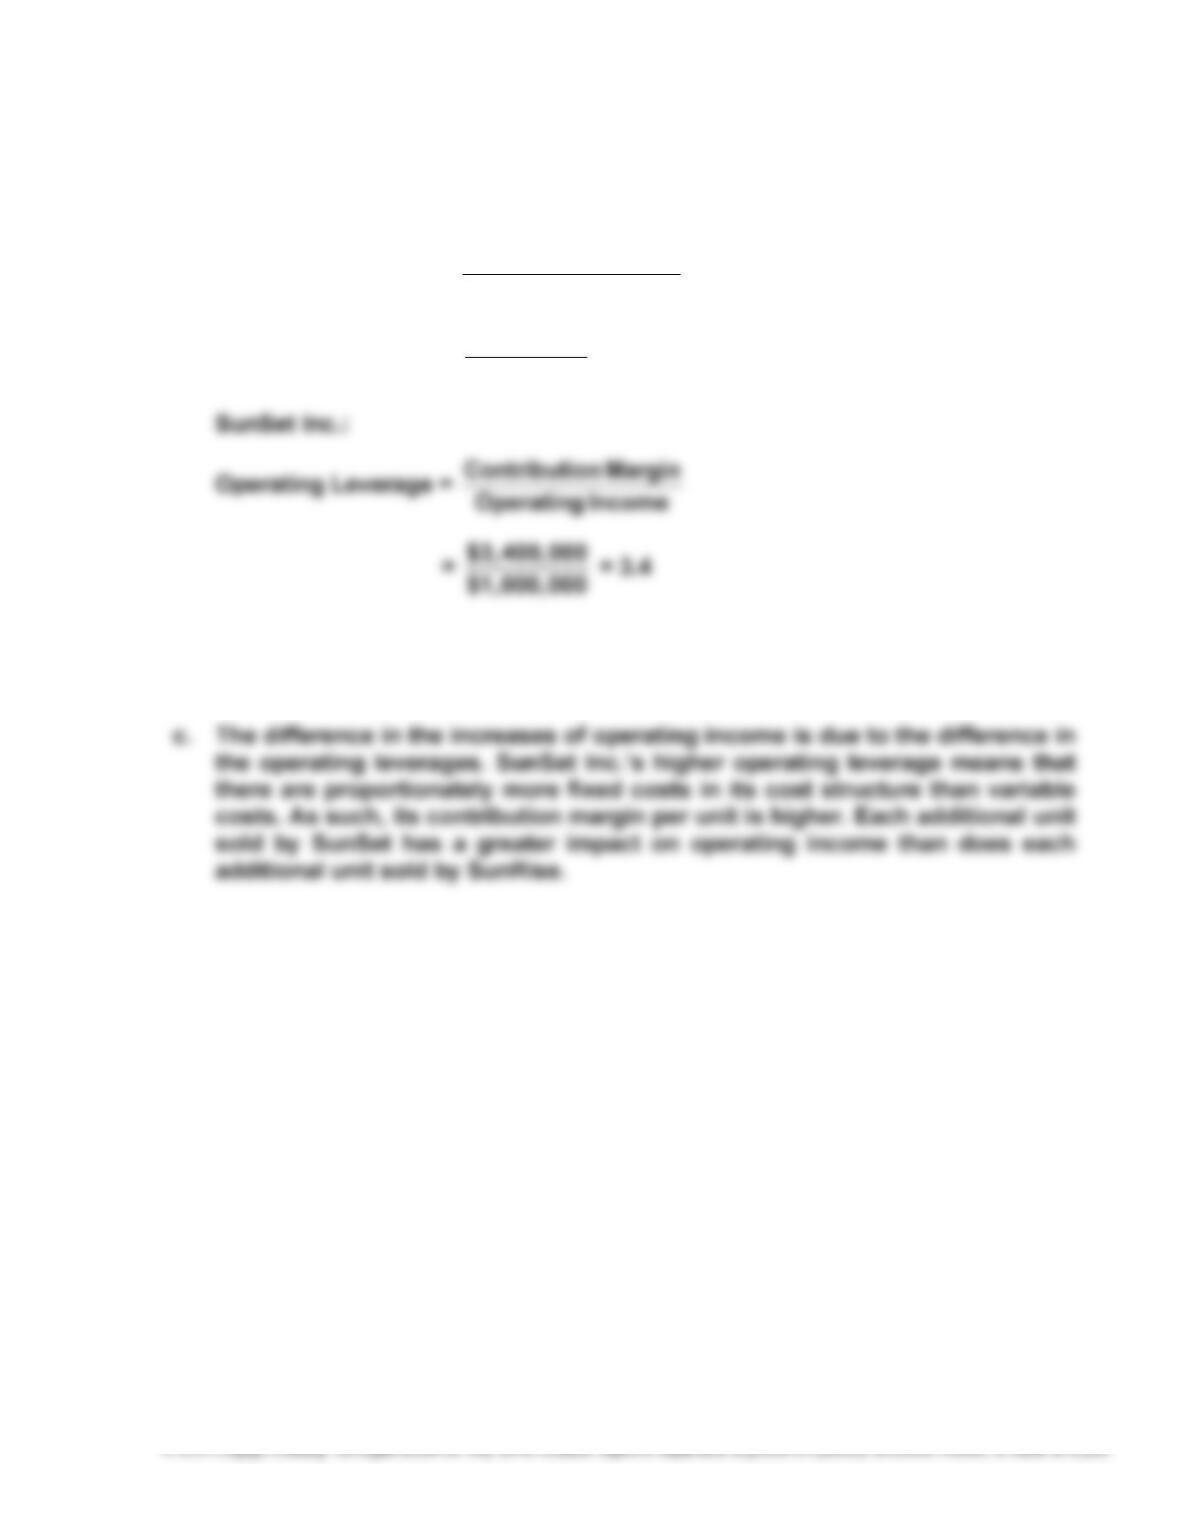
E11–22
a. SunRise Inc.:
Operating Leverage =
Contribution Margin
Operating Income
=
$1,250,000
$500,000 = 2.5
b. SunRise Inc.’s operating income would increase by 62.5% (2.5 × 25%), or
$312,500 (62.5% × $500,000), and SunSet Inc.’s operating income would
increase by 85% (3.4 × 25%), or $850,000 (85% × $1,000,000).
346
P11–1
Fixed Variable Mixed
Cost Cost Cost Cost
a. X
g. X
h. X
i. X
j. X
k. X
l. X
r. X
s. X
t. X
347
P11–2
1. Fixed Costs Variable Costs
Cost of goods sold ………………………………….. $12,460,000 $ 32,040,000
Selling expenses …………………………………….. 2,000,000 6,000,000
Administrative expenses …………………………. 2,400,000 600,000
Total ……………………………………………………….. $ 16,860,000 $ 38,640,000
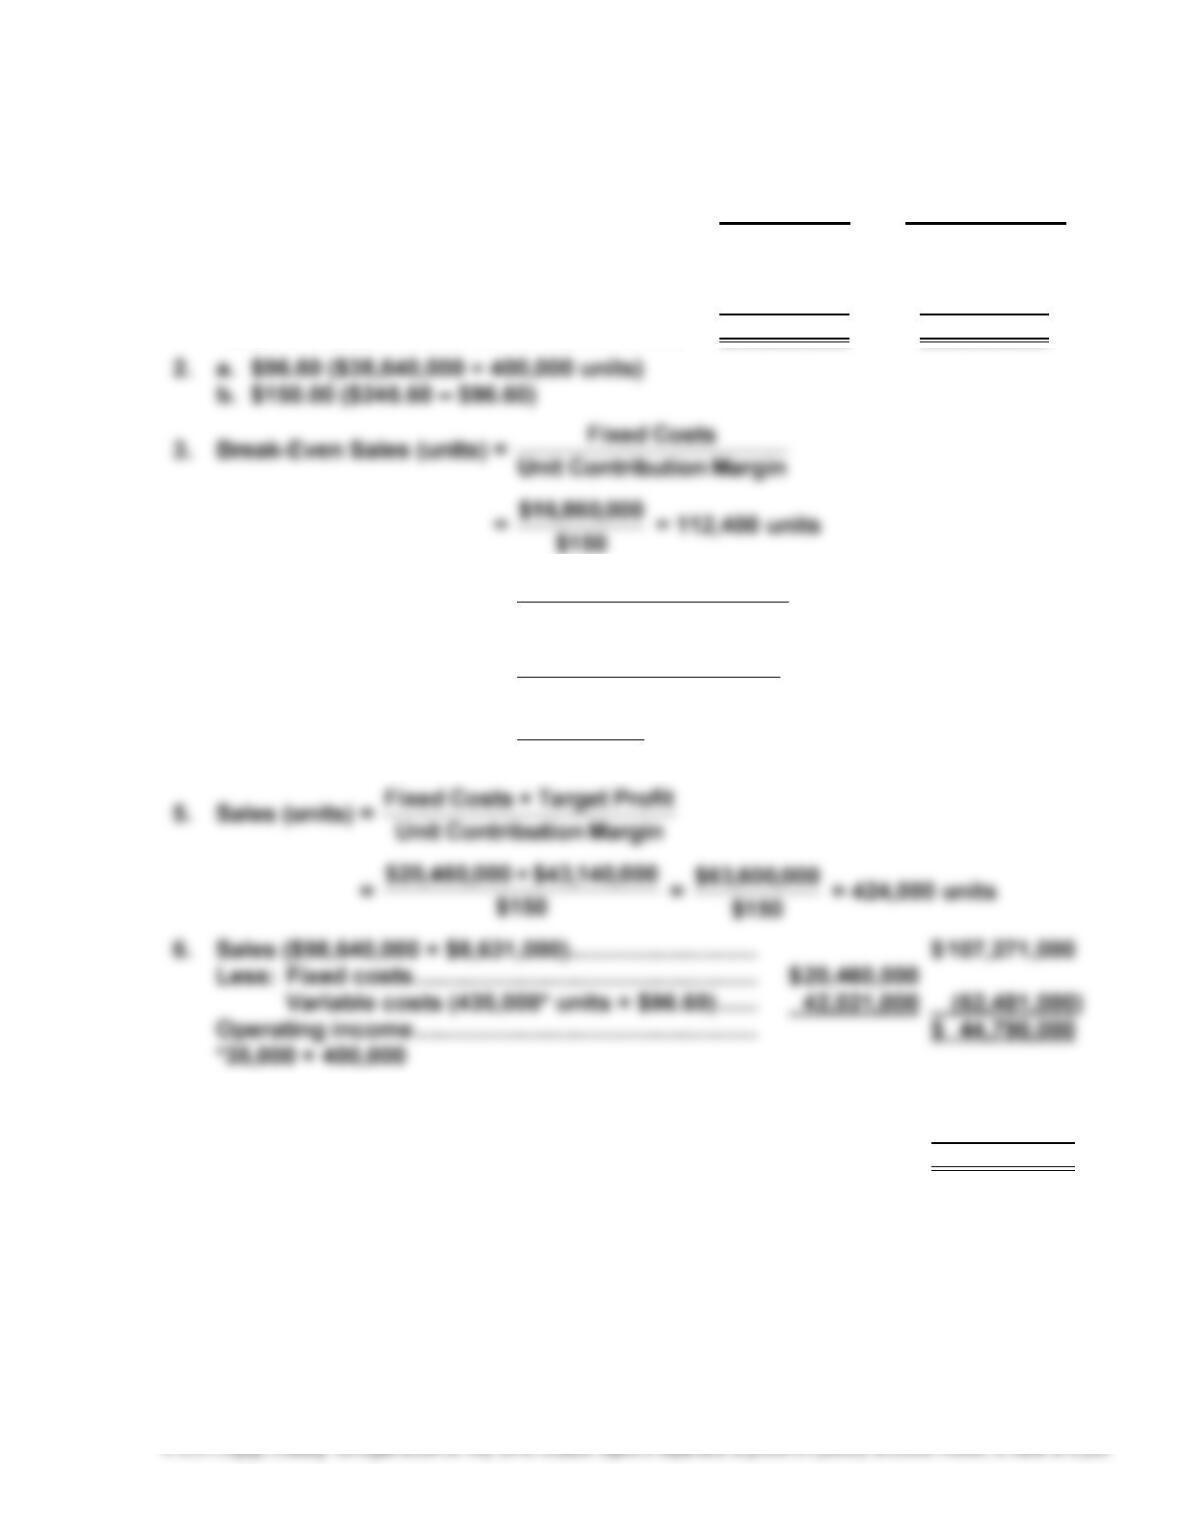
4. Break-Even Sales (units) = arginMnontributioCUnit
CostsFixed
=
150$
000,600,3$+000,860,16$
=
150$
000,460,20$ = 136,400 units
7. Present operating income ………………………………… $ 43,140,000
Less additional fixed costs ………………………………. (3,600,000)
Operating income …………………………………………….. $ 39,540,000