Name:
Section:
Score: 0%
Key Code:
1.
Sales
Cost of goods sold:
Direct materials
Direct labor
Factory overhead
Cost of goods sold
2.
–
3.
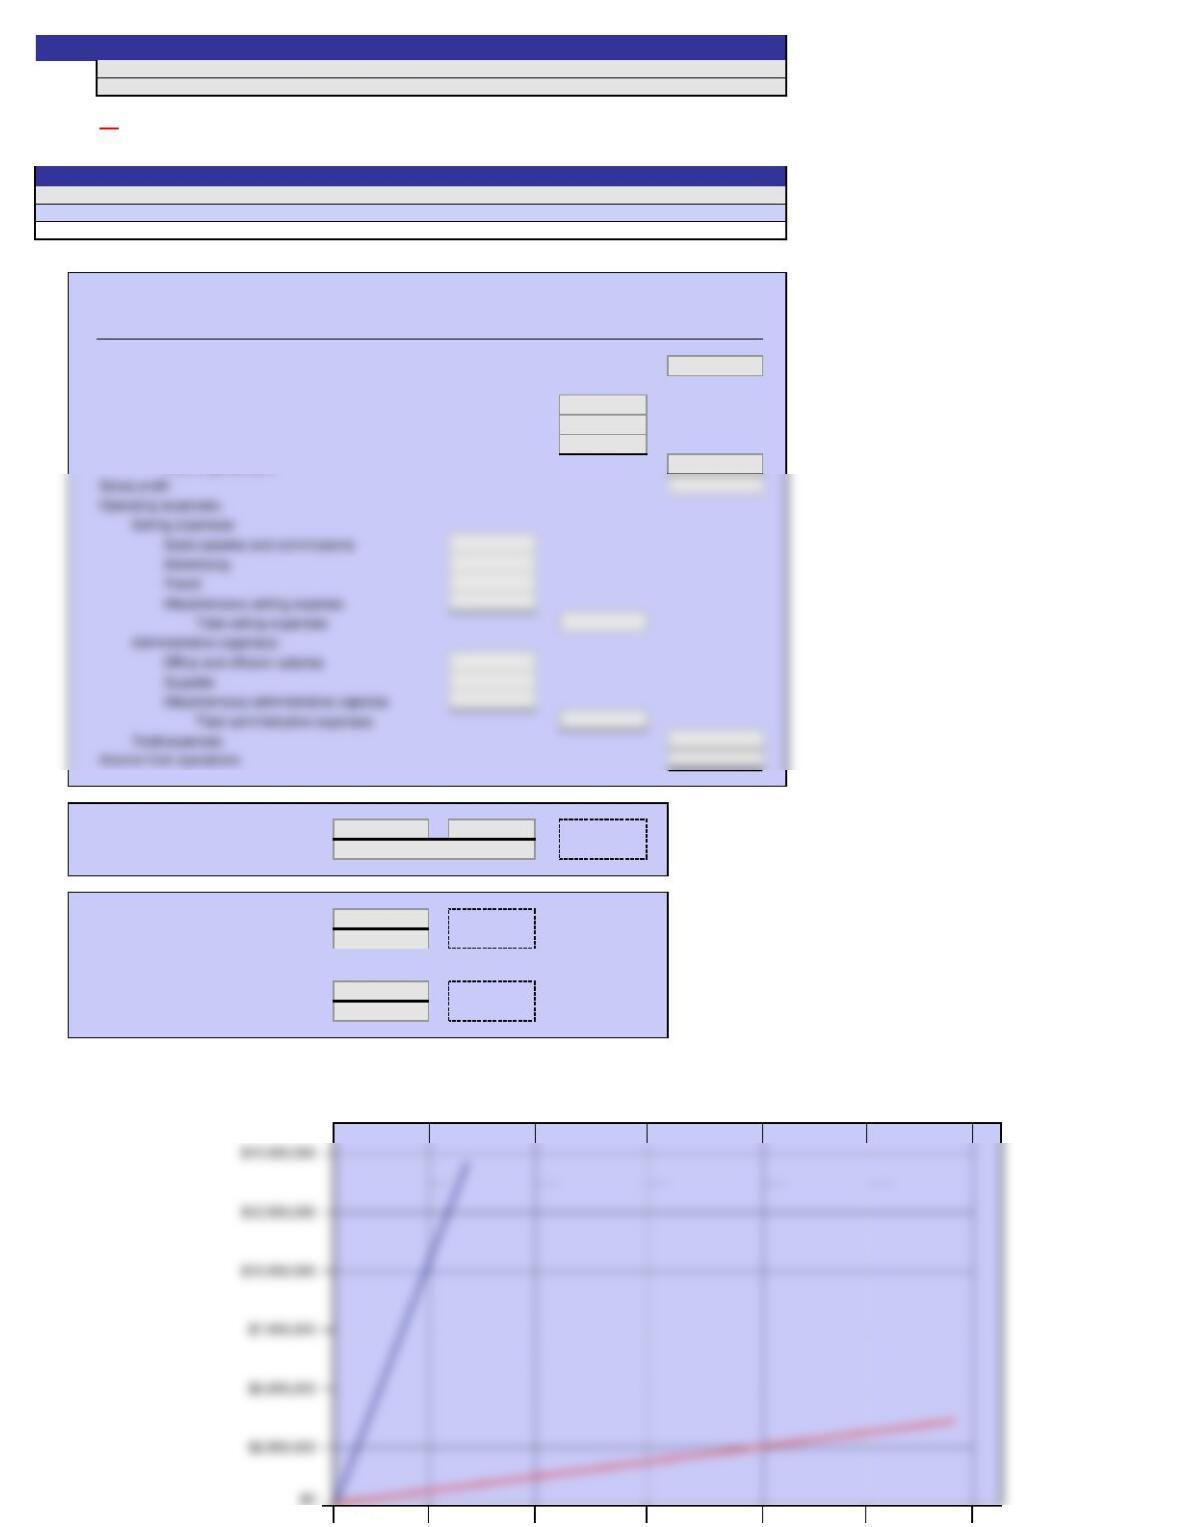
4. Use the Autoshapes line feature to construct a cost-volume-profit chart indicating the break-even point.
Click, drag, and shape the red and blue lines below to sketch the total revenue and total cost functions on the graph.
This requirement is not automatically scored.
=
sales
Break-even sales (dollars) =
Contribution margin ratio =
Problem 11-6
Instructions
Answers are entered in the cells with gray backgrounds.
A red asterisk (*) will appear beside, above, or immediately below an incorrect answer.
ORGANIC HEALTH CARE PRODUCTS INC.
2
=
Cells with non-gray backgrounds are protected and cannot be edited.
Break-even sales (units) =
=
For the Year Ending December 31, 20Y8
Estimated Income Statement
5.
Margin of safety:
Expected sales (in dollars)
Break-even point (in dollars)
400,000
500,000
600,000
0
100,000
200,000
300,000
Name:
Section:
Score: See student sheet for student’s score
Scoring:
1.
Sales 10,000,000$
Cost of goods sold:
Direct materials $3,200,000
Direct labor 1,200,000
Factory overhead 800,000
2.
$10,000,000 –$6,000,000
3.
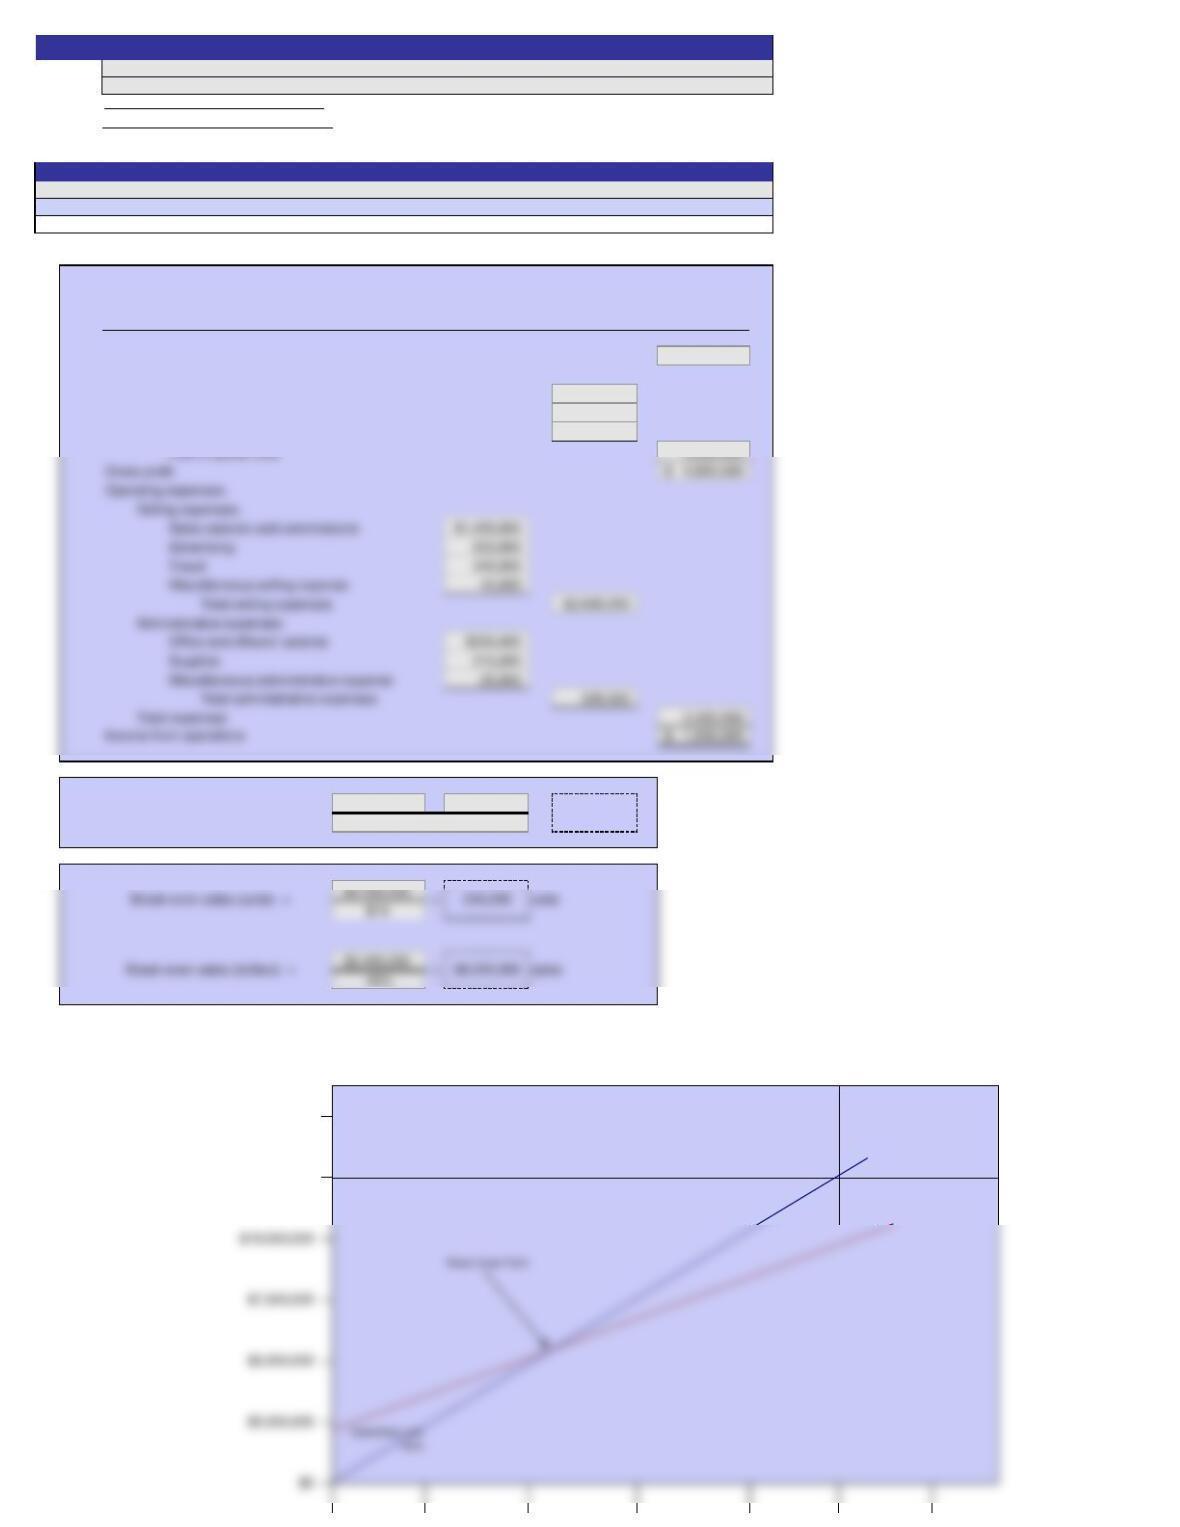
4. Use the Autoshapes line feature to construct a cost-volume-profit chart indicating the break-even point.
Click and drag either of the lines to sketch the total revenue and total cost functions on the graph.
This requirement is not automatically scored.
$10,000,000
Operating Profit Area
ON
Answers are entered in the cells with gray backgrounds.
Cells with non-gray backgrounds are protected and cannot be edited.
A red asterisk (*) will appear beside, above, or immediately below an incorrect answer.
For the Year Ending December 31, 20Y8
=
$10,000,000
Contribution margin ratio =
Problem 11-6
SOLUTION
Instructions
ORGANIC HEALTH CARE PRODUCTS INC.
Estimated Income Statement
40.0%
$15,000,000
$12,500,000
5.
Margin of safety:
Expected sales (in dollars) 10,000,000$
Break-even point (in dollars) 6,000,000
Margin of safety (in dollars) 4,000,000$
0
500,000
600,000
100,000
200,000
300,000
400,000
Name:
Section:
Score: 0%
Key Code:
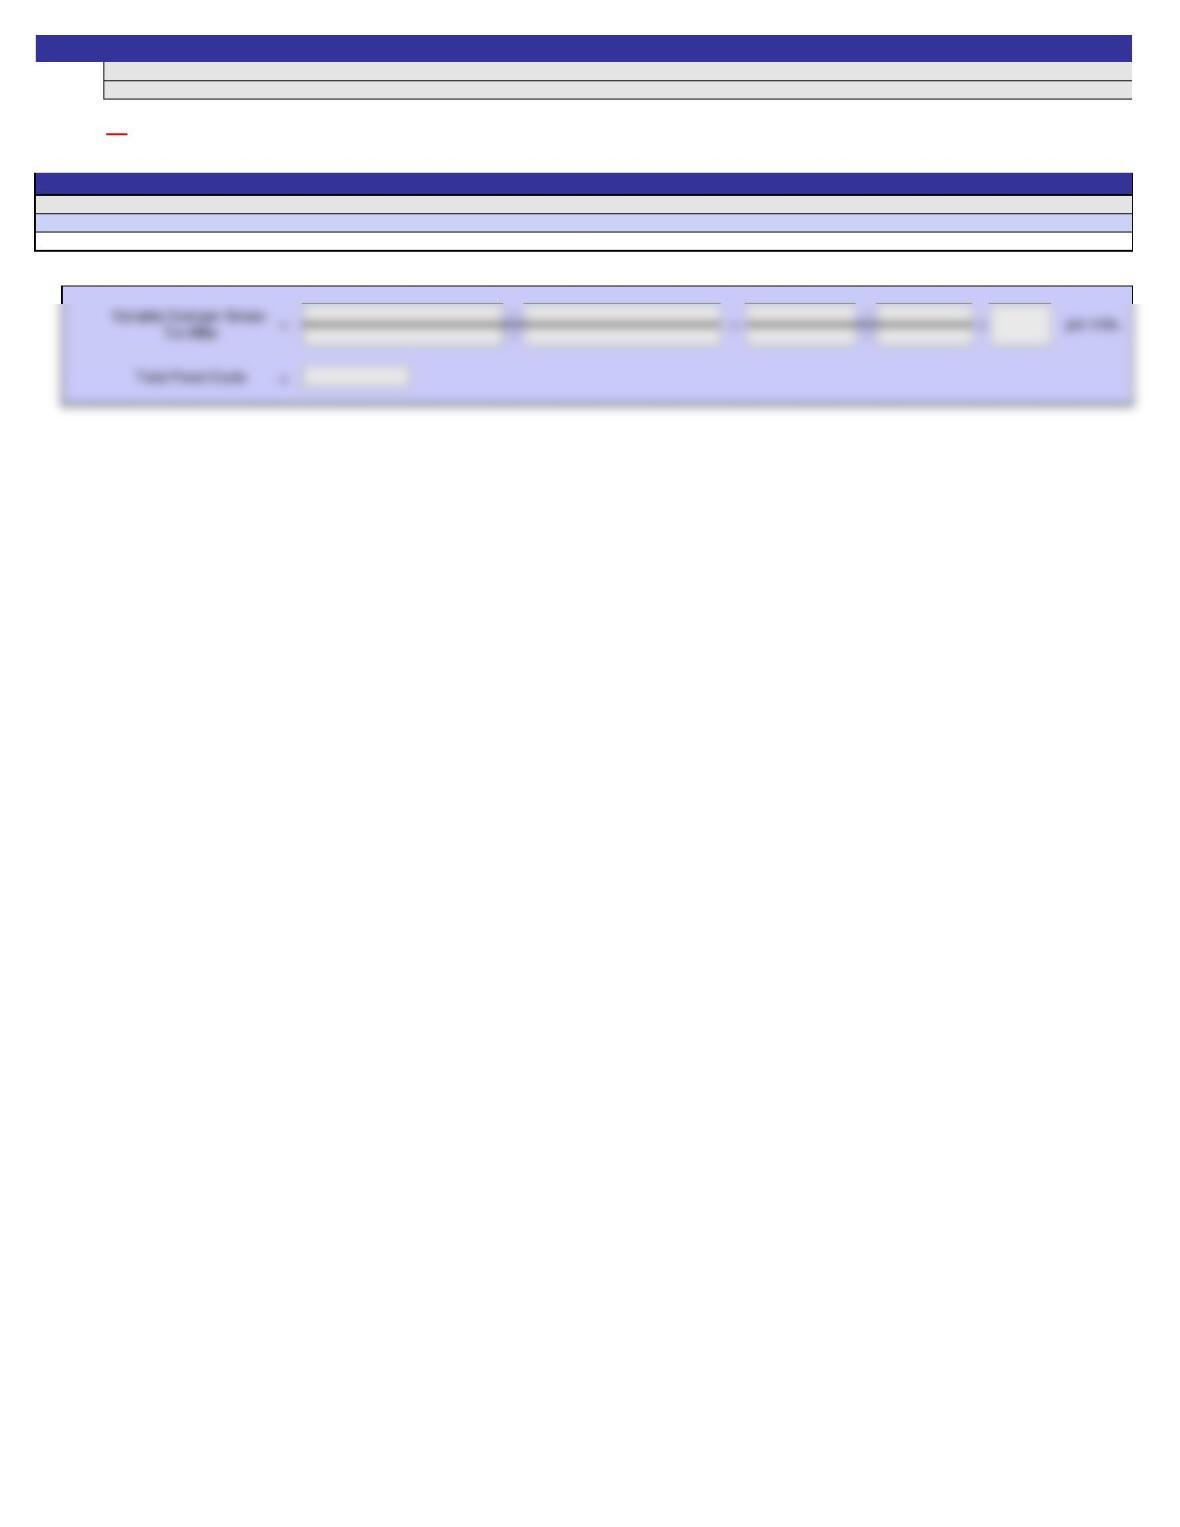
a.
– –
– –
Exercise 11-7
Instructions
2
Answers are entered in the cells with gray backgrounds.
Cells with non-gray backgrounds are protected and cannot be edited.
A red asterisk (*) will appear below or immediately to the right of an incorrect answer.
Variable Cost per Unit
=
=
per unit.
=
Name:
Section:
Score: See student sheet for student’s score
Scoring:
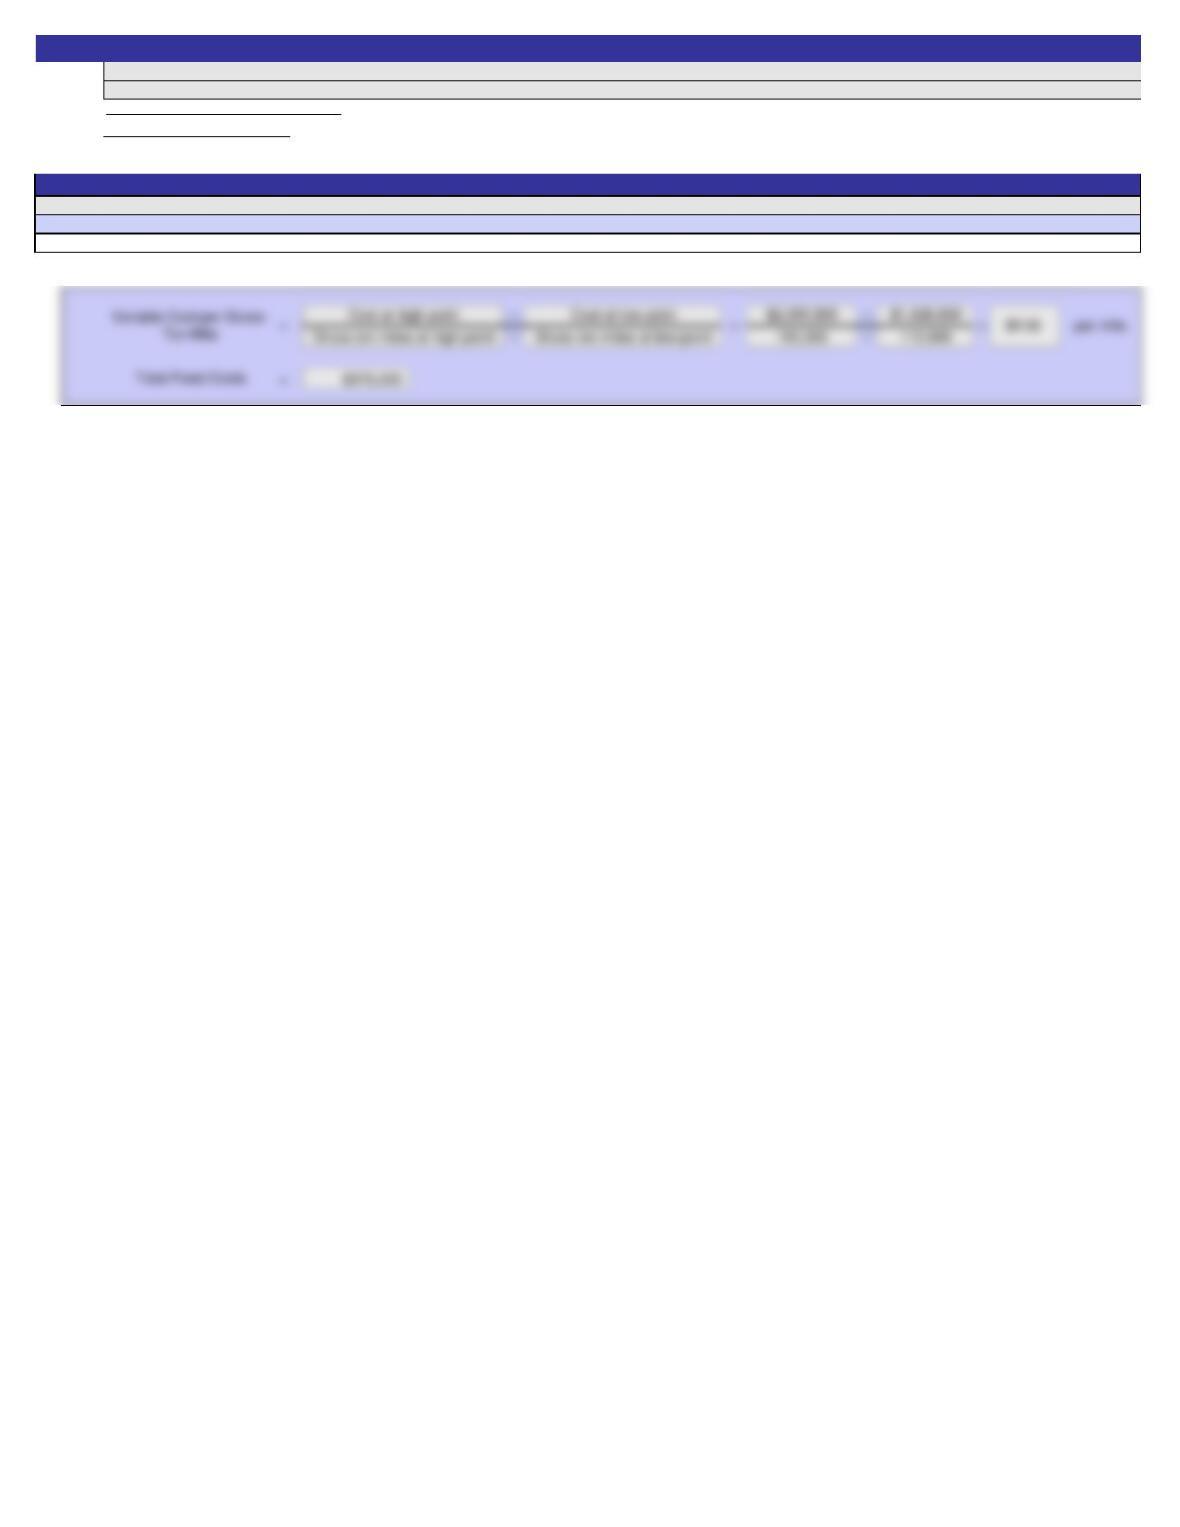
a.
– –
– –
=
$2,110,000
70,000
45,000
Units produced at high point
Units produced at low point
per unit.
$1,535,000
=
A red asterisk (*) will appear below or immediately to the right of an incorrect answer.
Cost at high point
Variable Cost per Unit
=
Cost at low point
23.00$
Answers are entered in the cells with gray backgrounds.
Cells with non-gray backgrounds are protected and cannot be edited.
Exercise 11-7
SOLUTION
Instructions
ON
Name:
Section:
Score: 0%
Key Code:
2
Exercise 11-8
Instructions
Answers are entered in the cells with gray backgrounds.
Cells with non-gray backgrounds are protected and cannot be edited.
A red asterisk (*) will appear below or immediately to the right of an incorrect answer.
Name:
Section:
Score: See student sheet for student’s score
Scoring:
ON
Cells with non-gray backgrounds are protected and cannot be edited.
A red asterisk (*) will appear below or immediately to the right of an incorrect answer.
Exercise 11-8
SOLUTION
Instructions
Answers are entered in the cells with gray backgrounds.
Name:
Section:
Score: 0%
Key Code:
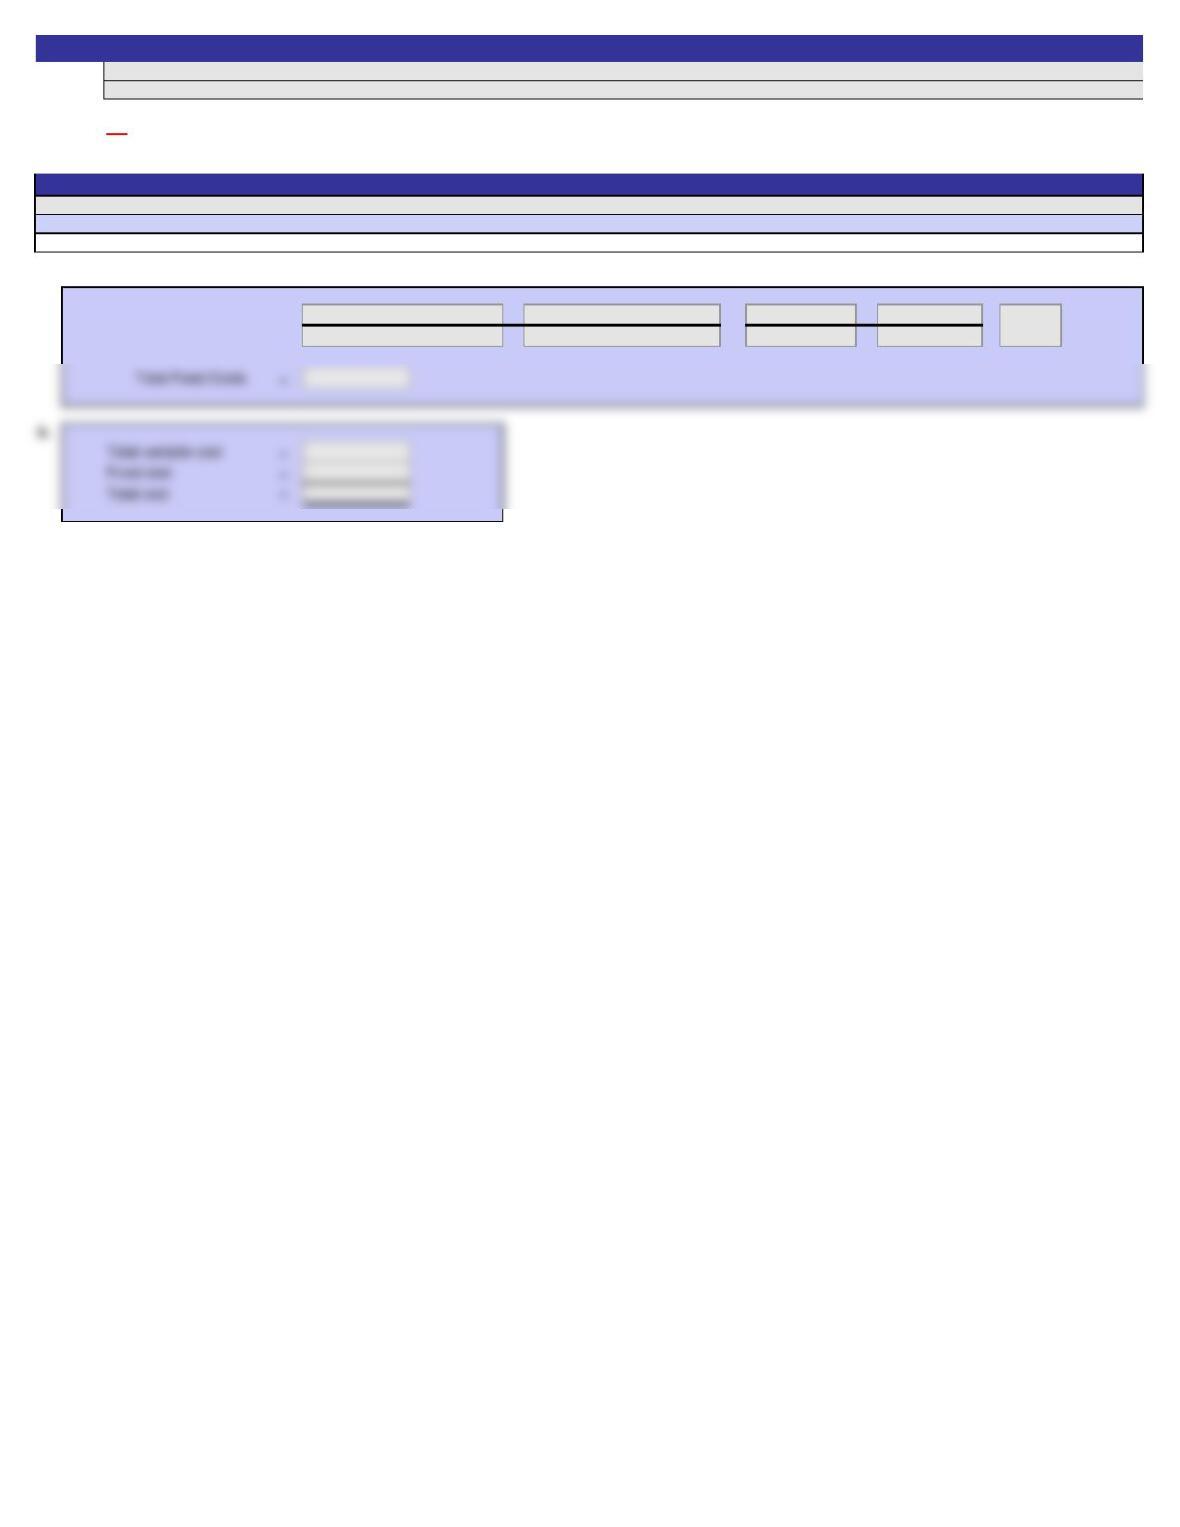
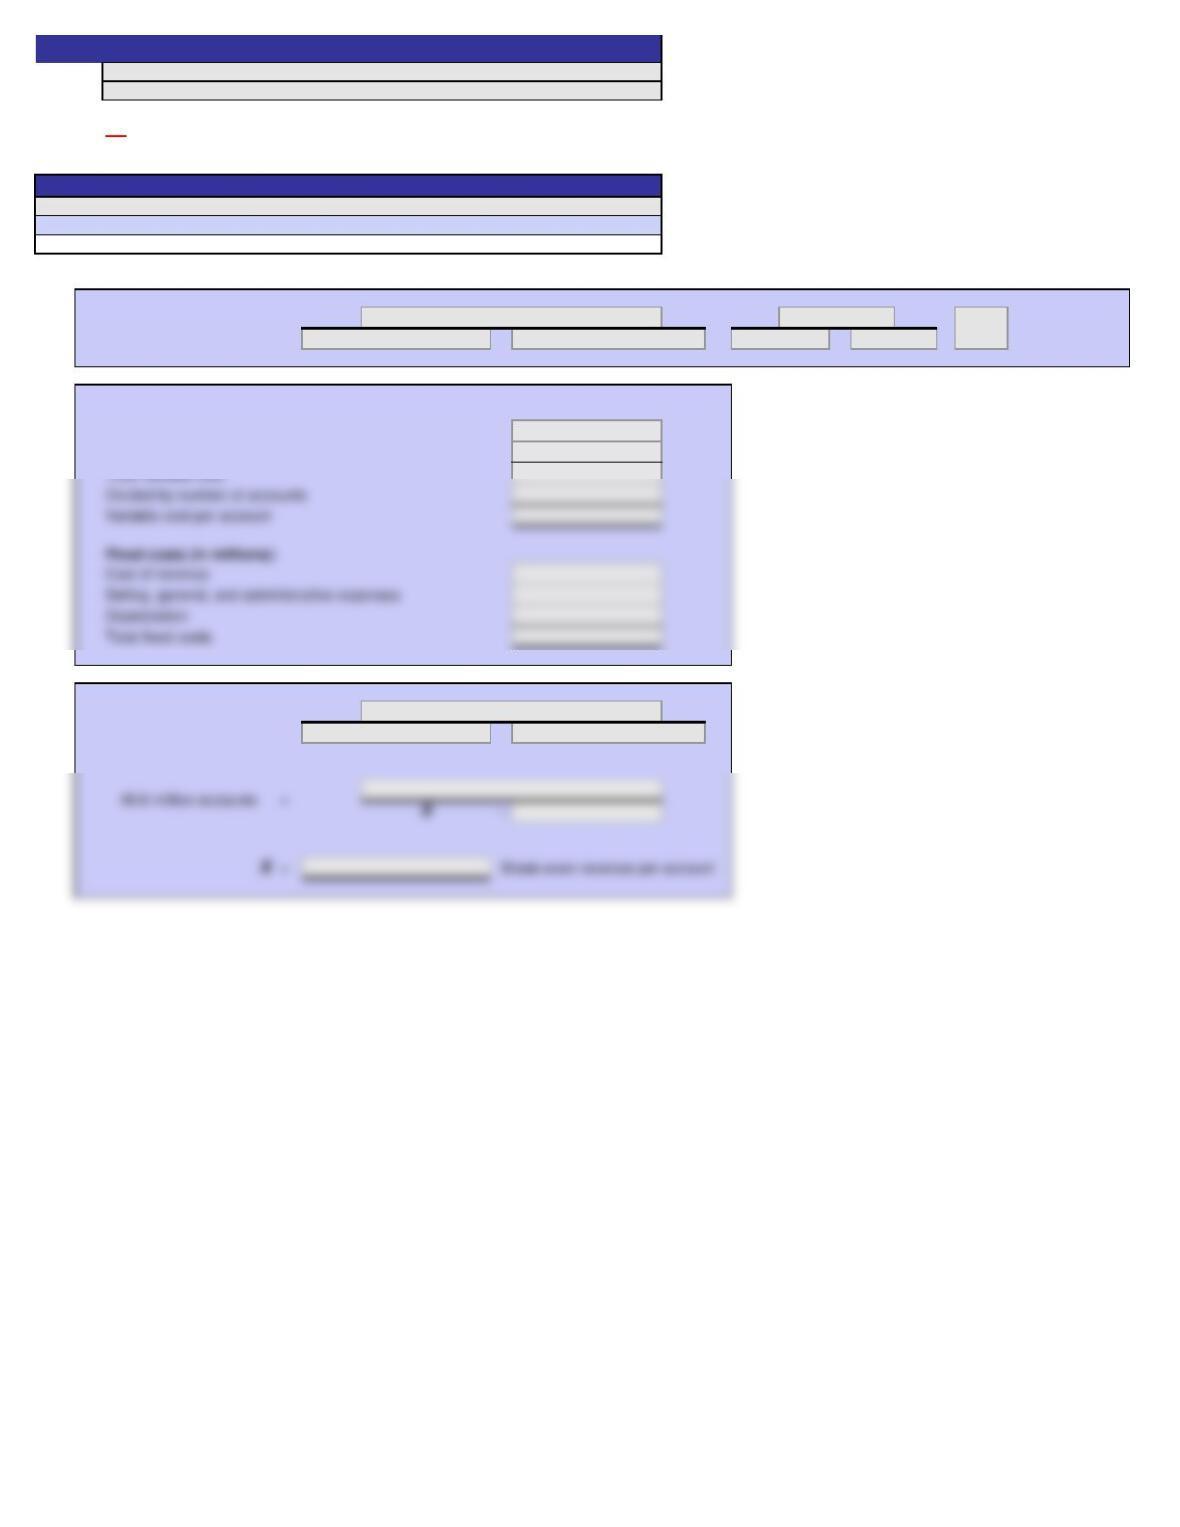
a.
– –
Variable cost per account (in millions):
Cost of revenue
Selling, general, and administrative expenses
b.
–
Exercise 11-16
Instructions
2
=
Answers are entered in the cells with gray backgrounds.
Cells with non-gray backgrounds are protected and cannot be edited.
A red asterisk (*) will appear beside, below, or above an incorrect answer.
Break-even (accounts)
=
million accounts
=
Break-even (accounts)
=
Fixed costs (in millions):
Name:
Section:
Score: See student sheet for student’s score
Scoring:
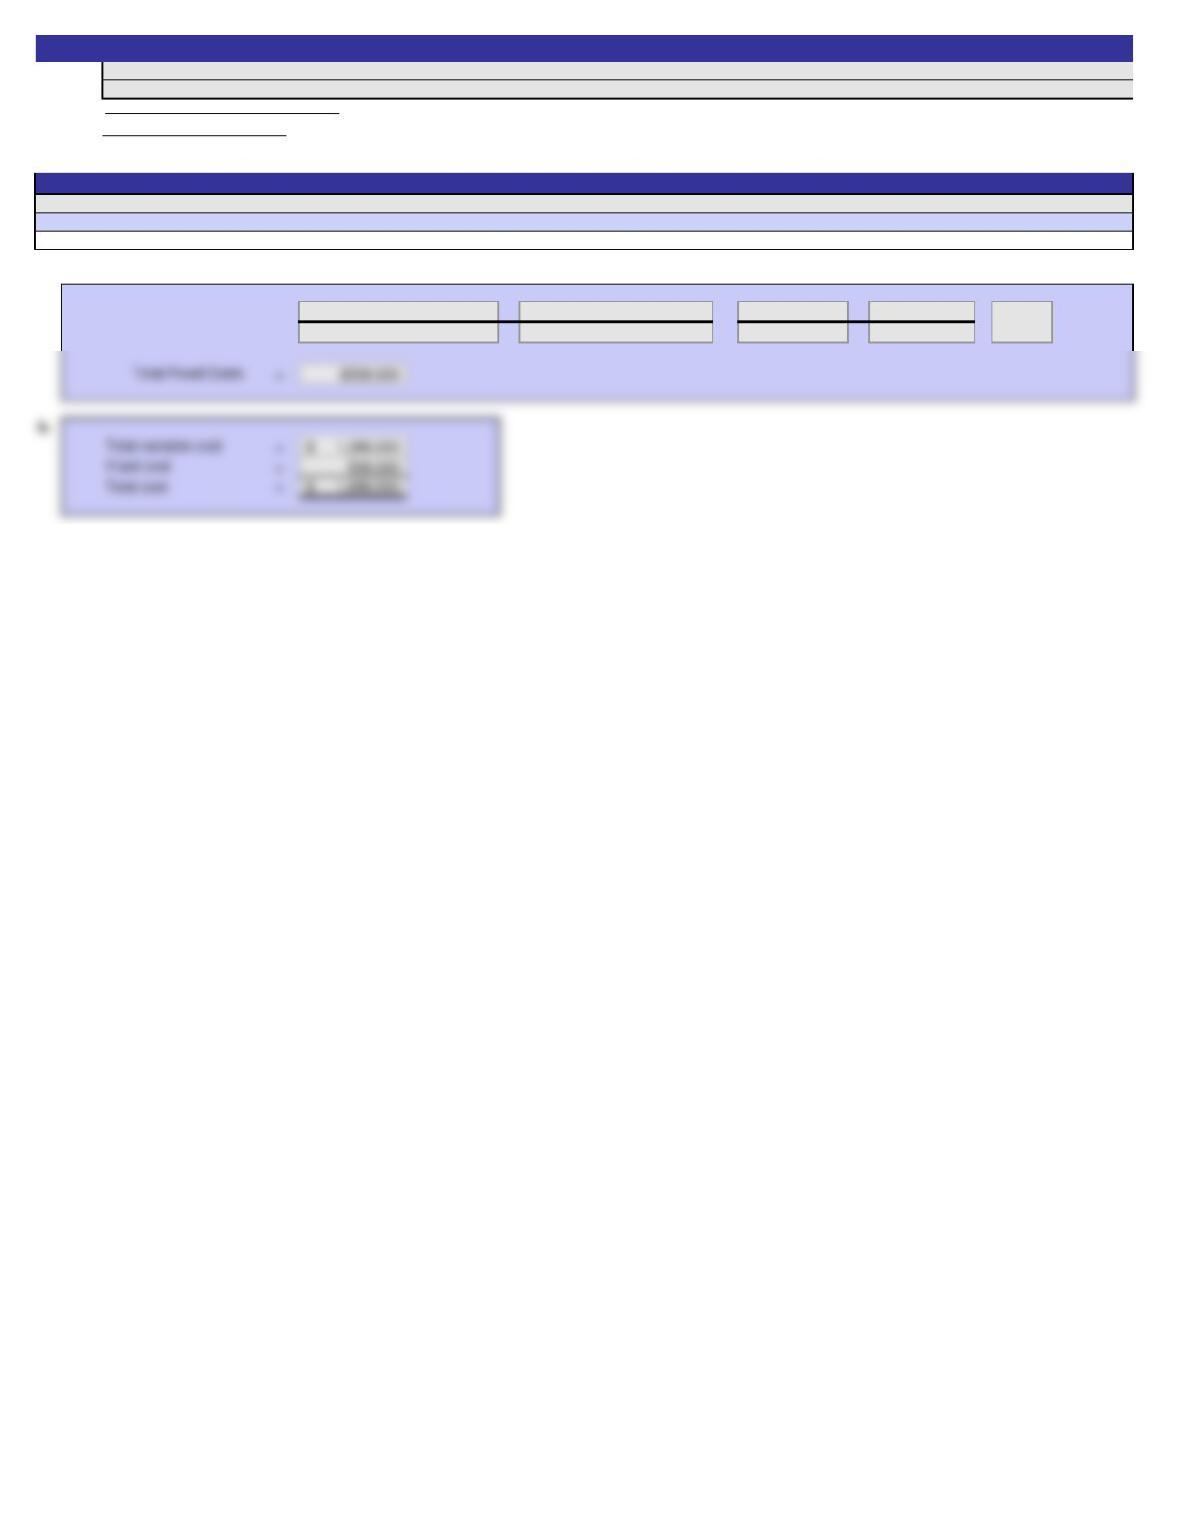
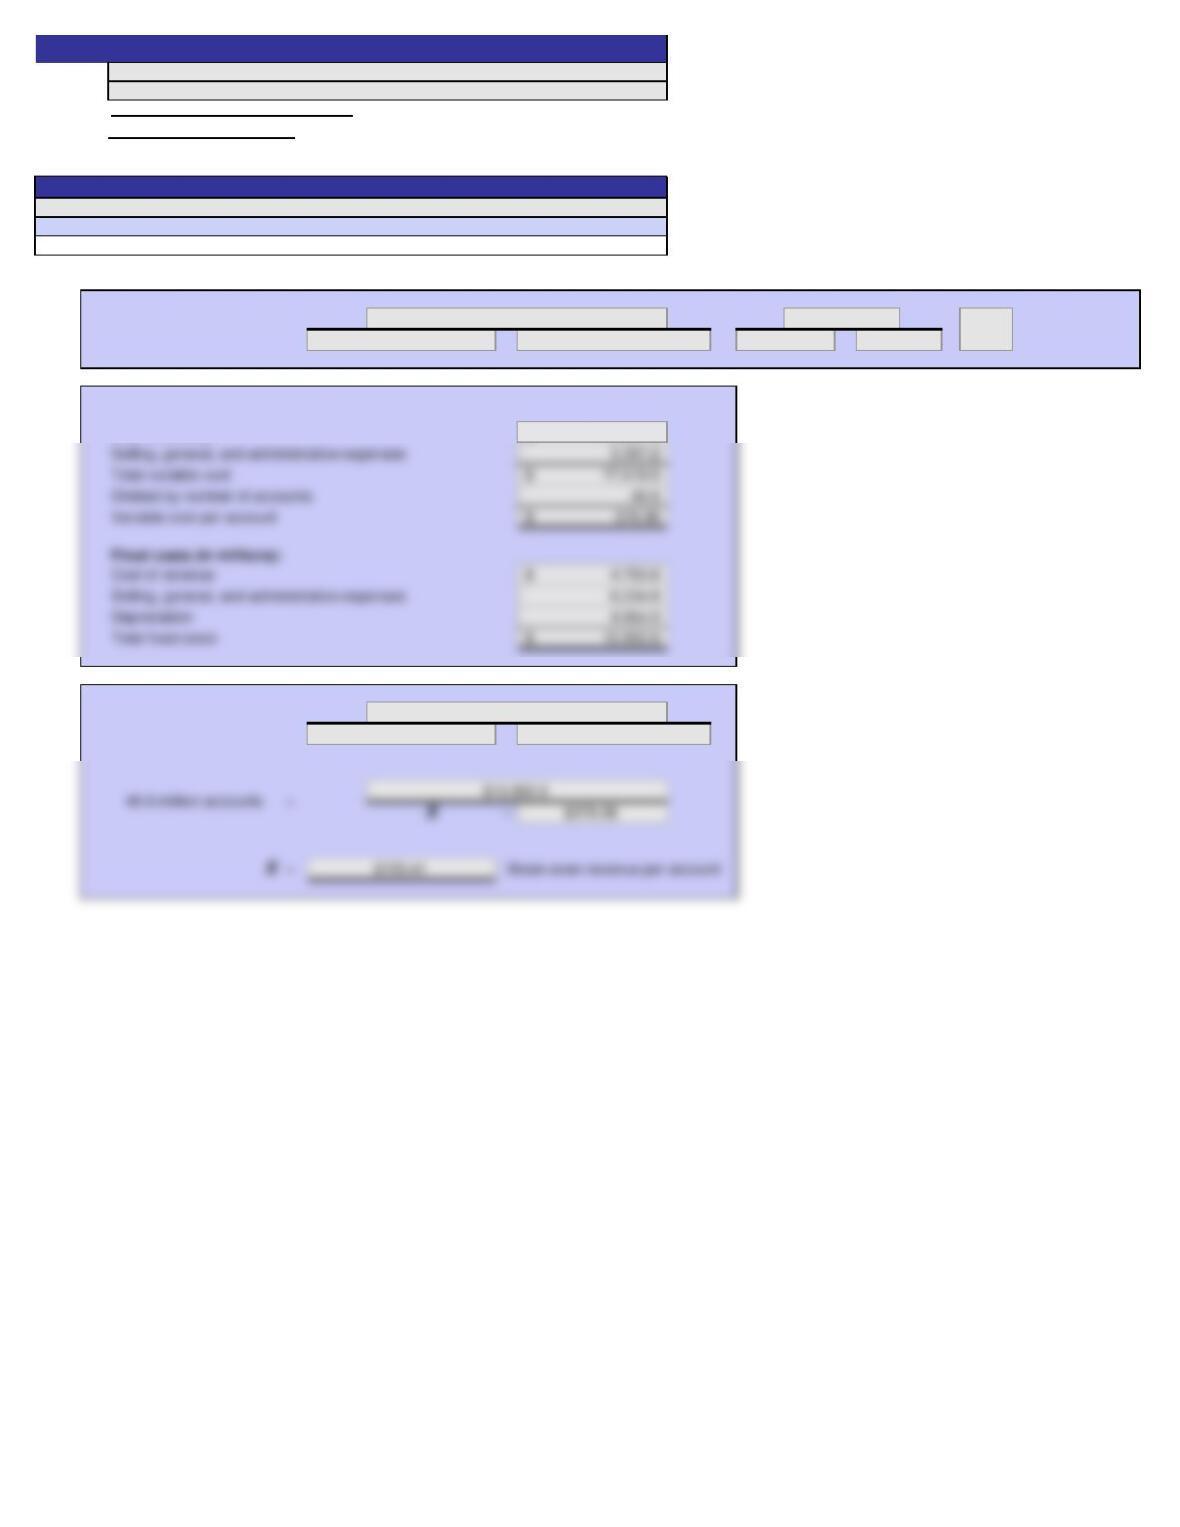
a.
– –
Variable cost per account (in millions):
Cost of revenue 14,261.3$
b.
–
ON
Answers are entered in the cells with gray backgrounds.
Cells with non-gray backgrounds are protected and cannot be edited.
Exercise 11-16
SOLUTION
Instructions
A red asterisk (*) will appear beside, below or above an incorrect answer.
Total Fixed Cost
Break-even (accounts)
=
million accounts
Revenue per Account
Variable Cost per Account
$722.7
$378.08
=
$15,952.6
=
46.3
Break-even (accounts)
=
Total Fixed Cost
Revenue per Account
Variable Cost per Account
Fixed costs (in millions):