11–21
o Two common methods of accounting for by-products are:
▪ Method 1: The net realizable value from sale of the by-products is deducted from the
joint cost of the main product(s). The remaining joint costs are allocated to the main
products.
• See Panel A of Exhibit 11.20 for the computation of the gross margin for the two
joint products when the net realizable value of the by-product is used to reduce
the joint cost (method 1).
▪ Method 2: The proceeds from sale of the by-products are treated as other revenue. All
joint costs are allocated to the main products.
See Demonstration Problem 9
11–22
Formatted: Normal1, Centered, Border: Top: (No border),
Tab stops: Not at 1″
LO 11–11 (Appendix) Use spreadsheets to solve reciprocal cost allocation
problems.
APPENDIX: CALCULATION OF THE RECIPROCAL METHOD USING COMPUTER
SPREADSHEETS
• The reciprocal method requires that cost relationships be written in equation form. The
method then solves the equations for the total costs to be allocated to each department.
o For any department (both service and production), the following equation applies:
• The set of equations can be rewritten and expressed in matrix form, and solved using the
matrix functions of a spreadsheet program such as Microsoft Excel.
o Exhibit 11.21 is a screenshot of the spreadsheet set up to solve the reciprocal cost
allocation problem.
▪ The process has three steps:
▪ The resulting allocations show the costs of the departments.
11–23
Formatted: Normal1, Centered, Border: Top: (No border),
Tab stops: Not at 1″
Formatted: Font: 8 pt
Matching
A.
By-products
H.
Net realizable value method
B.
Direct method
I.
Physical quantities method
C.
Estimated net realizable value
J.
Reciprocal method
D.
Final cost center
K.
Service department
Joint cost
Step method
_____ 1. The method to allocate service department costs that recognizes all services provided
by any service department, including services provided to other service departments.
_____ 2. The stage of processing thatwhat separates two or more products.
_____ 5. Sales price of a final product minus the additional processing costs necessary to
prepare a product for sale.
_____ 6. The method of service department cost allocation that allocates some service
department costs to other service departments.
_____ 7. A cost center, such as a production or marketing department, whose costs are not
allocated to another cost center.
_____ 8. Uses the functions of service departments.
_____ 13. Joint cost allocation based on the proportional values of the joint products at the split–
off point.
11–24
_____ 14. Outputs from a common input and common production process.
Matching Answers
2. L
4. A
6. M
8. N
10. B
12. K
14. G
Multiple Choice
M2). The following information is available.
2. Using the direct method, what proportion of S1’s costs will be allocated to M2?
a. 20%
b. 37.5%
c. 50%
d. 62.5%
3. Using the direct method, how much of the service department costs will be allocated to M1?
a. $195,250
b. $205,750
c. $308,750
d. $326,450
4. Using the step method, how much of the service department costs will be allocated to M1?
a. $243,000
b. $265,700
c. $295,400
d. $302,500
5. Using the reciprocal method, how should the total service department costs of S1 be
6. Using the reciprocal method, how much of the service department costs will be allocated to
7. Using the net realizable value method, how much of the joint costs would be allocated to P1?
a. $120,000
b. $144,000
c. $156,000
d. $183,000
8. Using the physical quantities method, how much of the joint costs would be allocated to P1?
a. $90,000
b. $120,000
c. $150,000
d. $180,000
9. If the sale value of the by-product is deducted from the joint costs of the main products, how
10. The relevant data for deciding whether to process further are:
a. Additional revenue after further processing.
b. Joint costs.
c. Additional costs of processing further.
d. Both a and c.

Formatted: Normal1, Centered, Border: Top: (No border),
Tab stops: Not at 1″
Formatted: Font: 8 pt
12. Which of the following allocation methods does not consider any mutual support among
service departments?
a. Step method
b. Direct method
c. Reciprocal method
d. None of the above
11–29
Multiple Choice Answers
1. b (LO1)
3. c (LO2)
30%
30% + 50%
4. d (LO3)
Using the step method, S2’s costs will be allocated first.
$302,500 = $500,000 × 20% + [$290,000 + $500,000 × 50%] ×
30%
30% + 50%
5. a (LO4)
6. c (LO4)
7. b (LO7)
8. a (LO8)
$90,000 = $240,000 ×
15,000
15,000 + 25,000
9. a (LO10)
10. d (LO9)
11. d (LO1)
12. b (LO2, LO3, LO4)
11–32
Formatted: Normal1, Centered, Border: Top: (No border),
Tab stops: Not at 1″
Formatted: Font: 8 pt
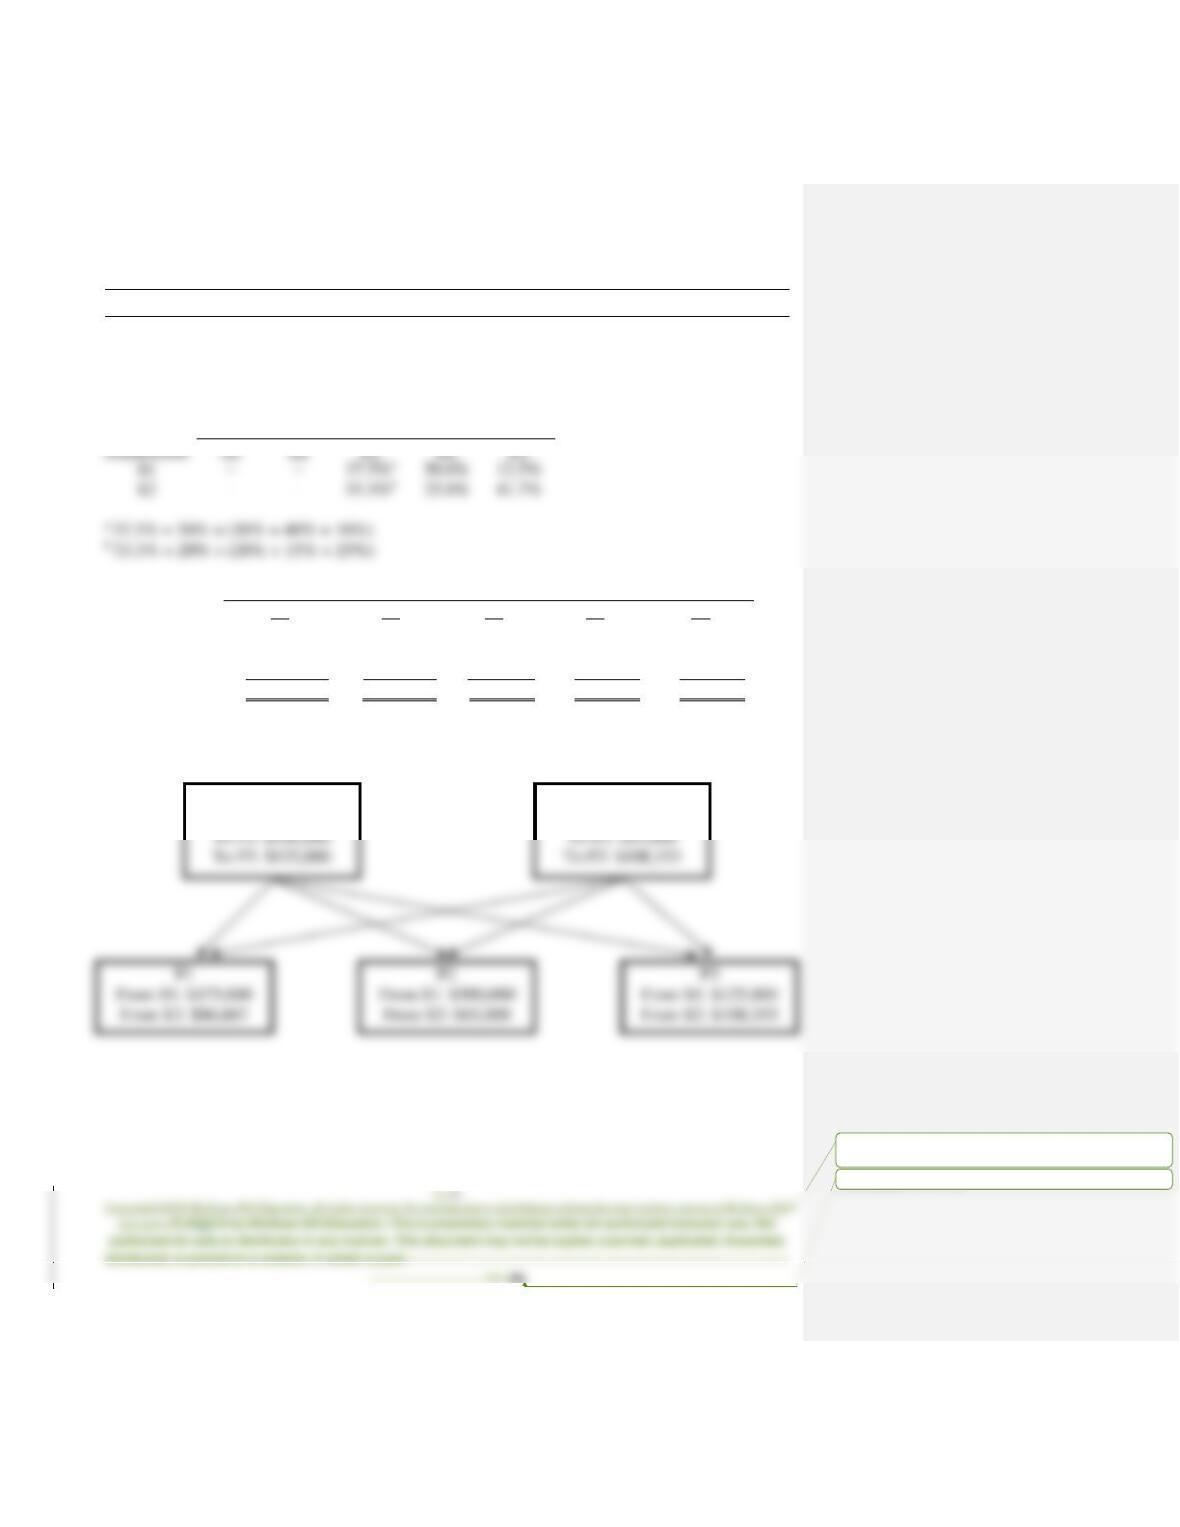
Demonstration Problem 1
Kirby Industries has two service departments (S1 and S2) and three production departments (P1,
P2, and P3). The following table shows the costs incurred at the two service departments, as well
as the proportion of services provided by the two service departments to the other departments.
Costs
Incurred
Service
Department
Percent Allocable to
S1
S2
P1
P2
P3
$1,000,000
S1
–
20%
30%
40%
10%
260,000
S2
40%
–
20%
15%
25%
For example, service department S1 incurred $1,000,000 while providing 20 percent of its
services to service department S2, 30 percent to production department P1, 40 percent to
production department P2, and 10 percent to production department P3.
Formatted: Normal1, Centered, Border: Top: (No border),
Tab stops: Not at 1″
Formatted: Font: 8 pt
Demonstration Problem 1 – Solution
The proportion of services to be allocated has to be revised since allocations between the two
service departments are not allowed under the direct method. These are relative usages that
ignore the mutual support between the service departments.
Service
S1
Percent Allocable to (Revised)
Amount Allocable to
From:
S1
S2
P1
P2
P3
Costs incurred
$ 1,000,000
$ 260,000
$ 0
$ 0
$ 0
S1
(1,000,000)
0
375,000c
500,000
125,000
S2
0
(260,000)
86,667d
65,000
108,333
Total
$ 0
$ 0
$461,667
$565,000
$233,333
c $375,000 = $1,000,000 × 37.5%.
d $86,667 = $260,000 × 33.3%.
S1
To P1: $375,000
S2
To P1: $86,667
11–34
Formatted: Normal1, Centered, Border: Top: (No border),
Tab stops: Not at 1″
Formatted: Font: 8 pt
Demonstration Problem 2
(Continued from Demonstration Problem 1; data were reproduced here.)
Kirby Industries has two service departments (S1 and S2) and three production departments (P1,
P2, and P3). The following table shows the costs incurred at the two service departments, as well
as the proportion of services provided by the two service departments to the other departments.
Costs
Service
Percent Allocable to
For example, service department S1 incurred $1,000,000 while providing 20 percent of its
services to service department S2, 30 percent to production department P1, 40 percent to
production department P2, and 10 percent to production department P3.
For simplicity, the direct costs incurred by the production departments are ignored.
The general manager of Kirby Industries wanted to know how the service department costs can
be allocated to the production departments in order to facilitate performance evaluation.
Required:
Formatted: Normal1, Centered, Border: Top: (No border),
Tab stops: Not at 1″
Formatted: Font: 8 pt
Demonstration Problem 2 – Solution
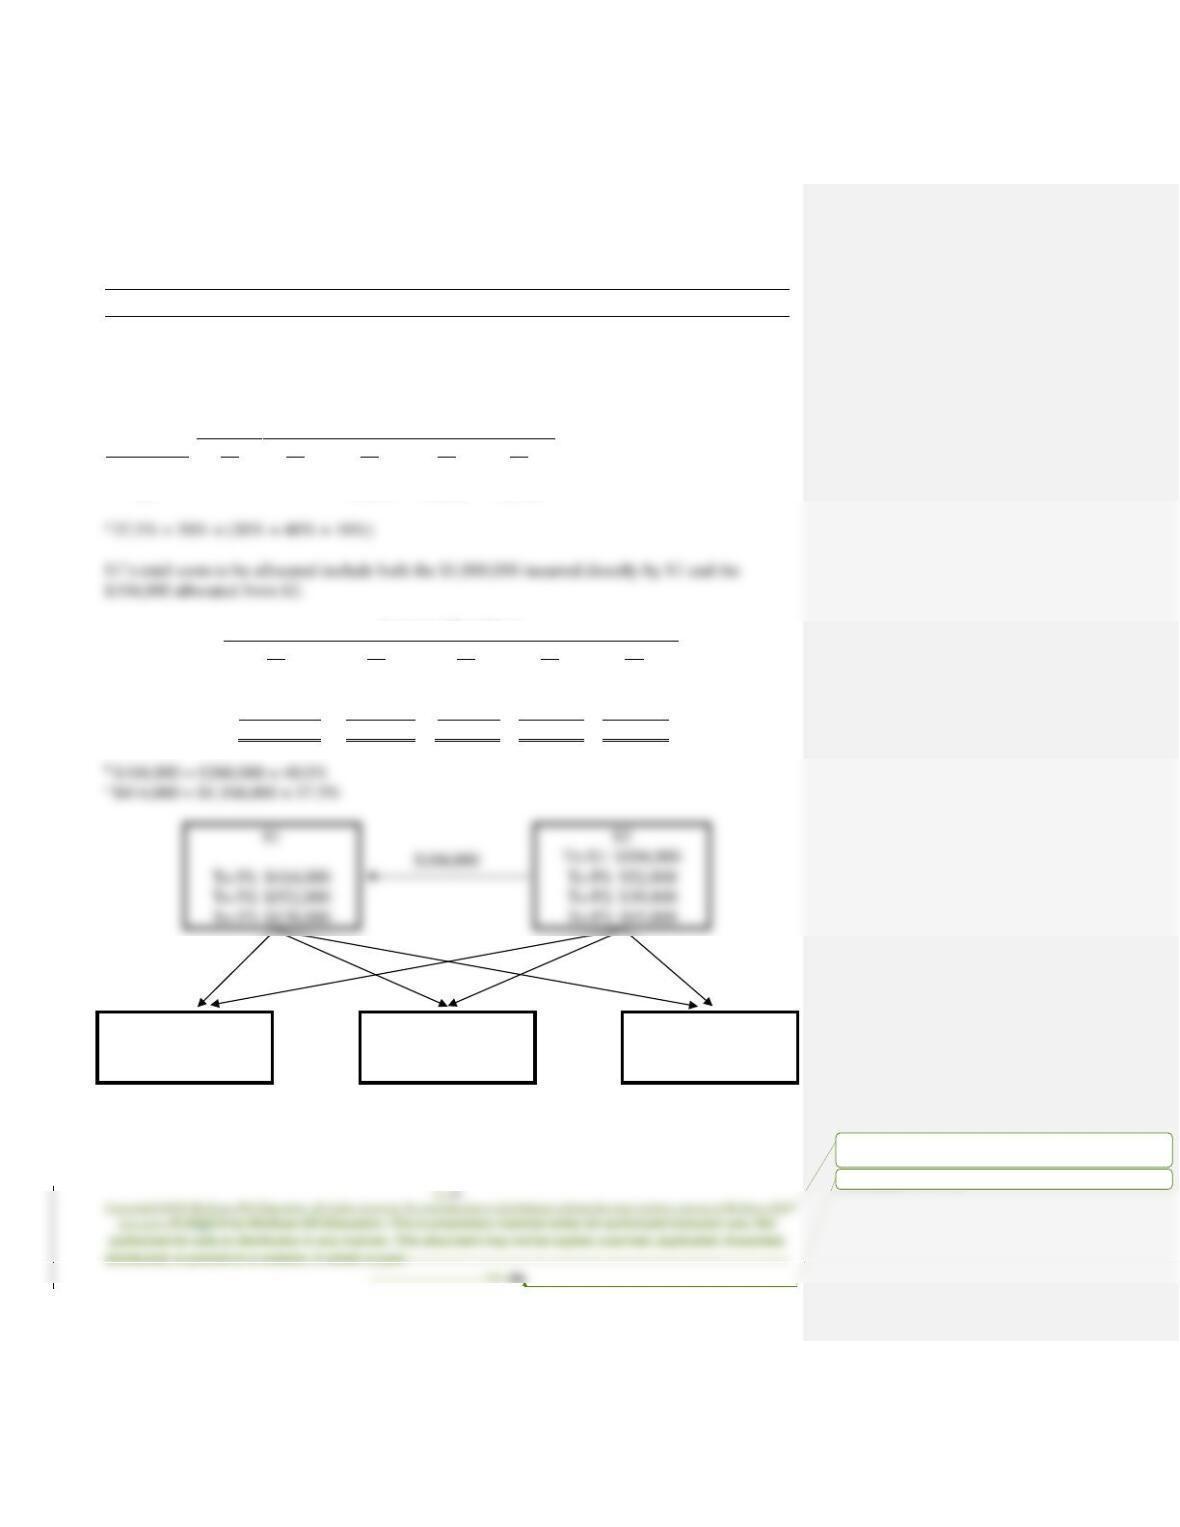
Since the service department S2 provides the largest proportion of its services to the other
service department (40 percent vs. S1’s 20 percent), S2’s costs would be allocated first to all
other departments. Once it is done, S1’s costs should not be allocated back to S2.
Service
Percent Allocable to (Revised)
Department
S1
S2
P1
P2
P3
S2
40.0%
–
20.0%
15.0%
25.0%
S1
–
–
37.5%a
50.0%
12.5%
Amount Allocable to
From:
S1
S2
P1
P2
P3
Costs incurred
$ 1,000,000
$ 260,000
$0
$ 0
$ 0
S2
104,000b
(260,000)
52,000
39,000
65,000
S1
(1,104,000)
0
414,000c
552,000
138,000
Total
$ 0
$ 0
$466,000
$591,000
$203,000
P1
From S1: $414,000
From S2: $52,000
P2
From S1: $552,000
From S2: $39,000
P3
From S1: $138,000
From S2: $65,000