
11–1
Chapter 11
Service Department and Joint Cost Allocation
Learning Objectives
1. Explain why service costs are allocated.
2. Allocate service department costs using the direct method.
3. Allocate service department costs using the step method.
4. Allocate service department costs using the reciprocal method.
5. Use the reciprocal method for outsourcing decisions.
6. Explain why joint costs are allocated.
7. Allocate joint costs using the net realizable value method.
8. Allocate joint costs using the physical quantities method.
9. Explain how cost data are used in the sell-or-process-further decision.
10. Account for by-products.
11. (Appendix) Use spreadsheets to solve reciprocal cost allocation problems.
11–2
Chapter Overview
I. SERVICE DEPARTMENT COST ALLOCATION
II. METHODS OF ALLOCATING SERVICE DEPARTMENT COSTS
• Allocation Bases
• Direct Method
o Allocate Information Systems Department Costs
o Allocate Administration Department Costs
o Limitations of the Direct Method
• Step Method
o Allocate Service Department Costs
o Limitations of the Step Method
• Reciprocal Method
o Allocating Service Department Costs
• Comparison of Direct, Step, and Reciprocal Methods
• The Reciprocal Method and Decision Making
III. ALLOCATION OF JOINT COSTS
• Joint Costing Defined
• Reasons for Allocating Joint Costs
IV. JOINT COST ALLOCATION METHODS
V. DECIDING WHETHER TO SELL GOODS NOW OR PROCESS THEM FURTHER
VI. DECIDING WHAT TO DO WITH BY-PRODUCTS
VII. APPENDIX: CALCULATION OF THE RECIPROCAL METHOD USING
COMPUTER SPREADSHEETS
11–3
Chapter Outline
LO 11-1 Explain why service costs are allocated.
SERVICE DEPARTMENT COST ALLOCATION
• The cost allocation process has other roles, two of which are explored in this chapter.
o In our discussion of two-stage cost allocation, we took the first-stage allocation process
as given and concentrated on allocating the cost pools in the second stage.
• Service departments provide services to other departments in the organization.
o Examples of service departments and what they do:
▪ Personnel, accounting, and purchasing departments provide services to production
departments.
• User departments use the functions of service departments. For example, the production
department uses the services provided by the information systems and human resources
departments.
11–4
• As shown in Exhibit 11.1, most user departments make use of all service departments.
Depending on the situation, the service departments also provide service to each other.
o An intermediate cost center is any cost center whose costs are charged to other
departments in the organization.
METHODS OF ALLOCATING SERVICE DEPARTMENT COSTS
• Three methods to allocate service department overhead costs are:
o Direct method
o Step method
▪ Each service department is an intermediate cost center whose costs are recorded as
incurred and then distributed to other cost centers.
• Allocation Bases
LO 11-2 Allocate service department costs using the direct method.
• Direct Method
▪ The direct method allocates costs directly to the final users of a service, ignoring
intermediate users.
o Allocate Information Systems Department Costs
▪ Exhibit 11.4 is the cost flow diagram that illustrates the direct method.
o Allocate Administration Department Costs
▪ Exhibit 11.5 shows the flow of costs in T-accounts and the allocations to be
recognized for the departments when the direct method is used.
See Demonstration Problem 1
o Limitations of the Direct Method
• Some people have criticized the direct method because it ignores services
provided by one service department to another.
11–6
LO 11-3 Allocate service department costs using the step method.
• Step Method
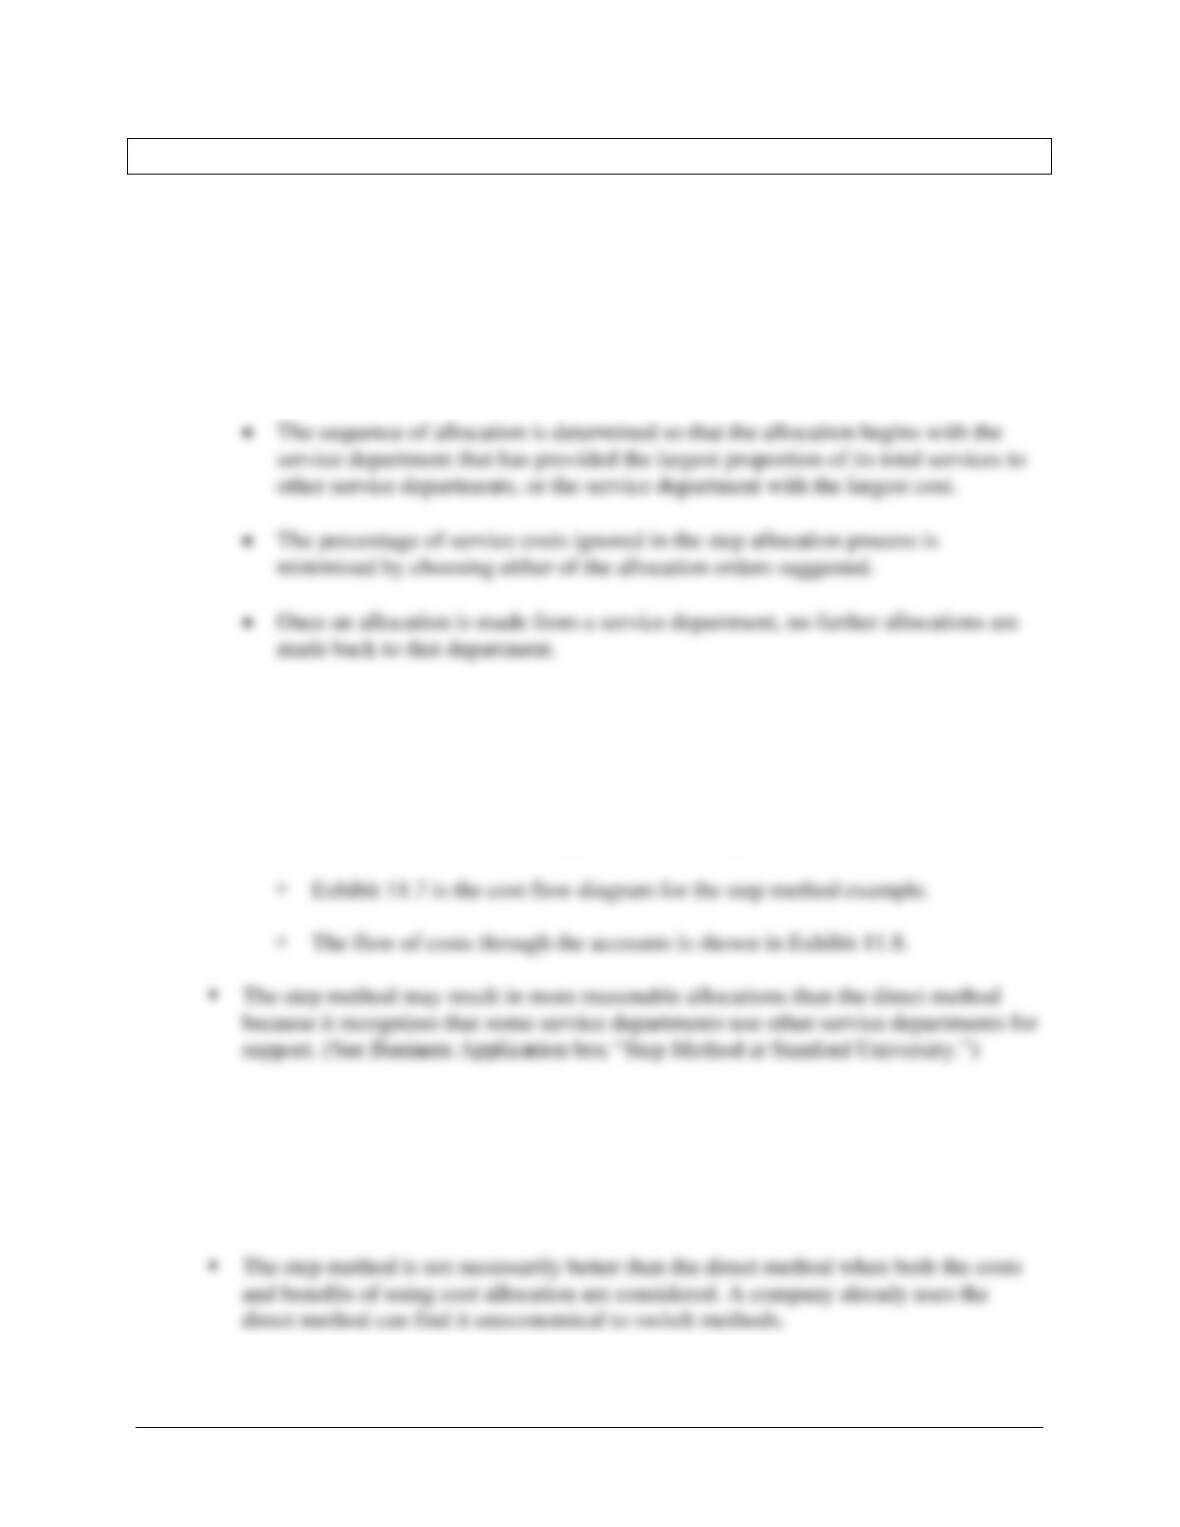
o The step method is the method of service department cost allocation that allocates some
service department costs to other service departments.
▪ The step method recognizes that some services are provided by one service
department to others.
▪ Allocate Service Department Costs
• A service department that provides services to, and receives services from,
another service department has only one of these two relationships recognized.
Exhibit 11.6 shows the computation of the step method.
See Demonstration Problem 2
o Limitations of the Step Method
▪ The step method does not recognize reciprocal services.
11–7
LO 11-4 Allocate service department costs using the reciprocal method.
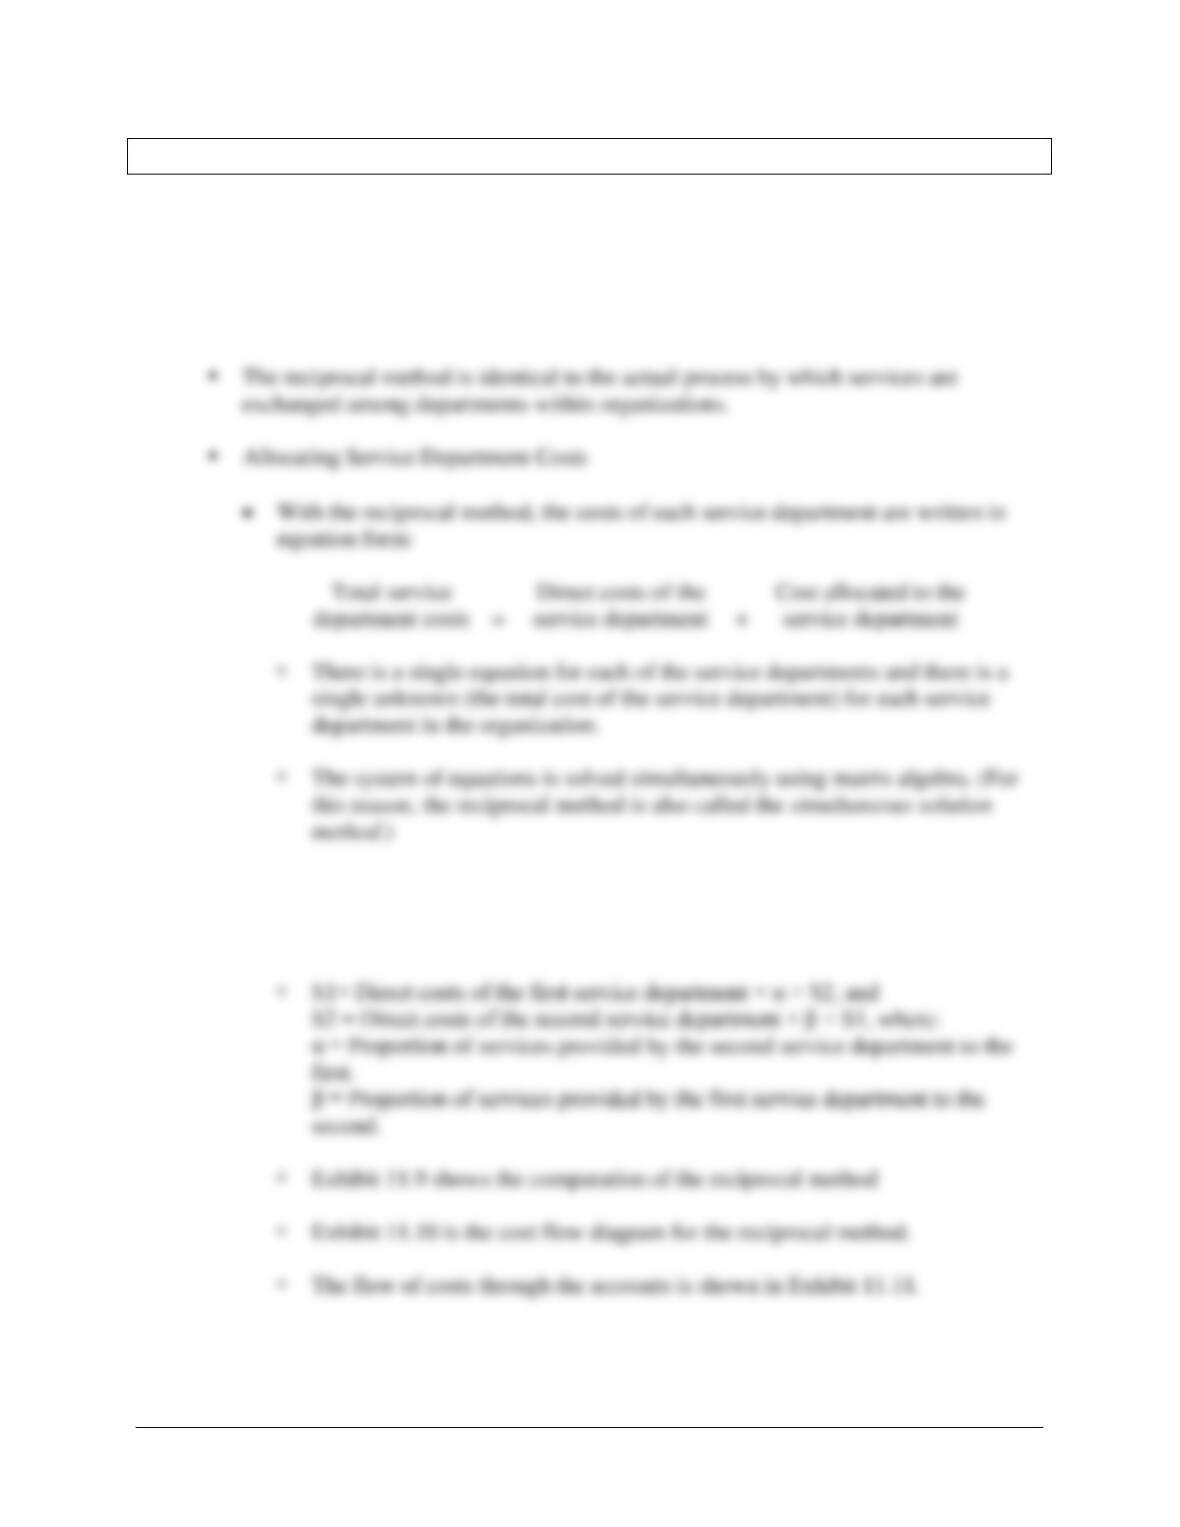
• Reciprocal Method
o The reciprocal method is the method to allocate service department costs that recognizes
all services provided by any service department, including services provided to other
service departments.
• In the case with two service departments, define the unknowns S1 and S2 to be
the total service department costs for the two service departments. Then the
simultaneous equations can be set up as:
11–8
▪ The reciprocal method accounts for cost flows in both directions among service
departments that provide services to each other.
See Demonstration Problem 3
• Comparison of Direct, Step, and Reciprocal Methods
o The three service department allocation methods can be compared in two ways.
▪ The first is to examine how each allocates costs to departments receiving services. As
shown in Exhibit 11.12, only the reciprocal method allocates costs to all departments
receiving services from other departments.
LO 11-5 Use the reciprocal method for outsourcing decisions.
• The Reciprocal Method and Decision Making
o The primary purpose of allocating service department costs to the production departments
11–9
▪ The cost savings will depend on how much an outside vendor will charge and how
much cost in the service departments can be eliminated if outsourced.
LO 11-6 Explain why joint costs are allocated.
ALLOCATION OF JOINT COSTS
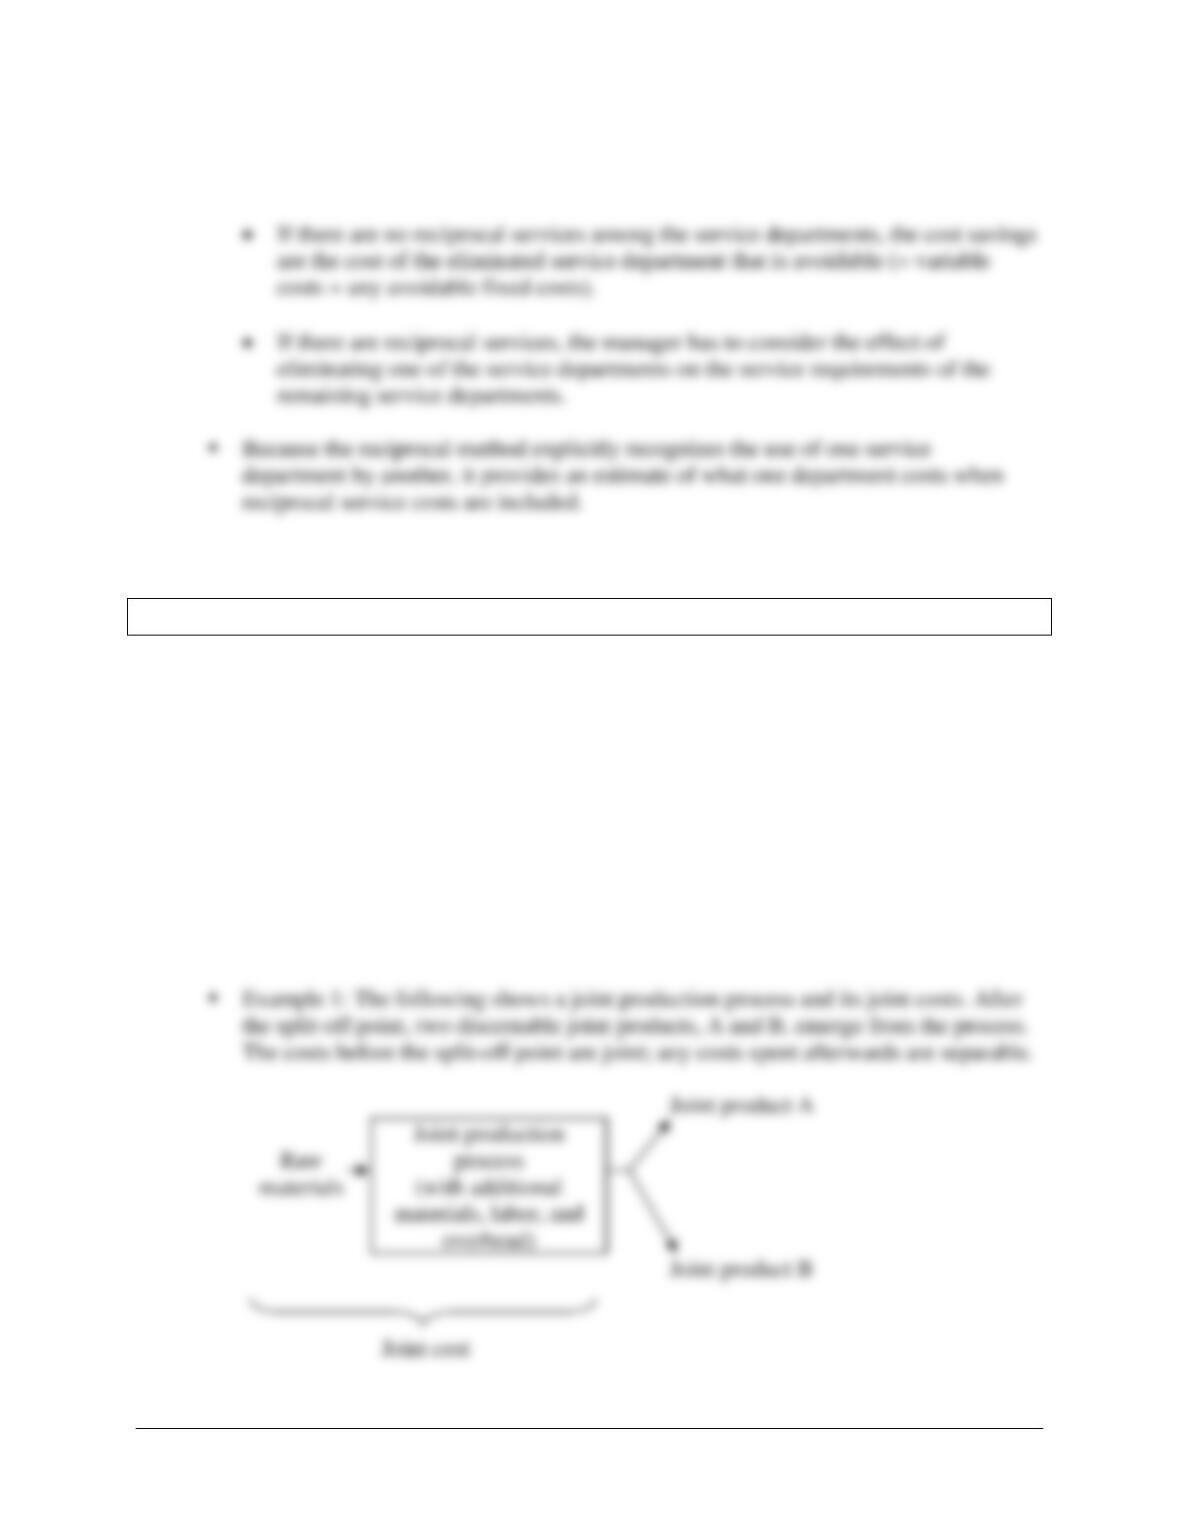
• Joint cost is a cost of a manufacturing process with two or more different outputs. Joint
products are such outputs from a common input and common production process.
o The problem is whether and how to allocate the joint cost of the input to the joint
products.
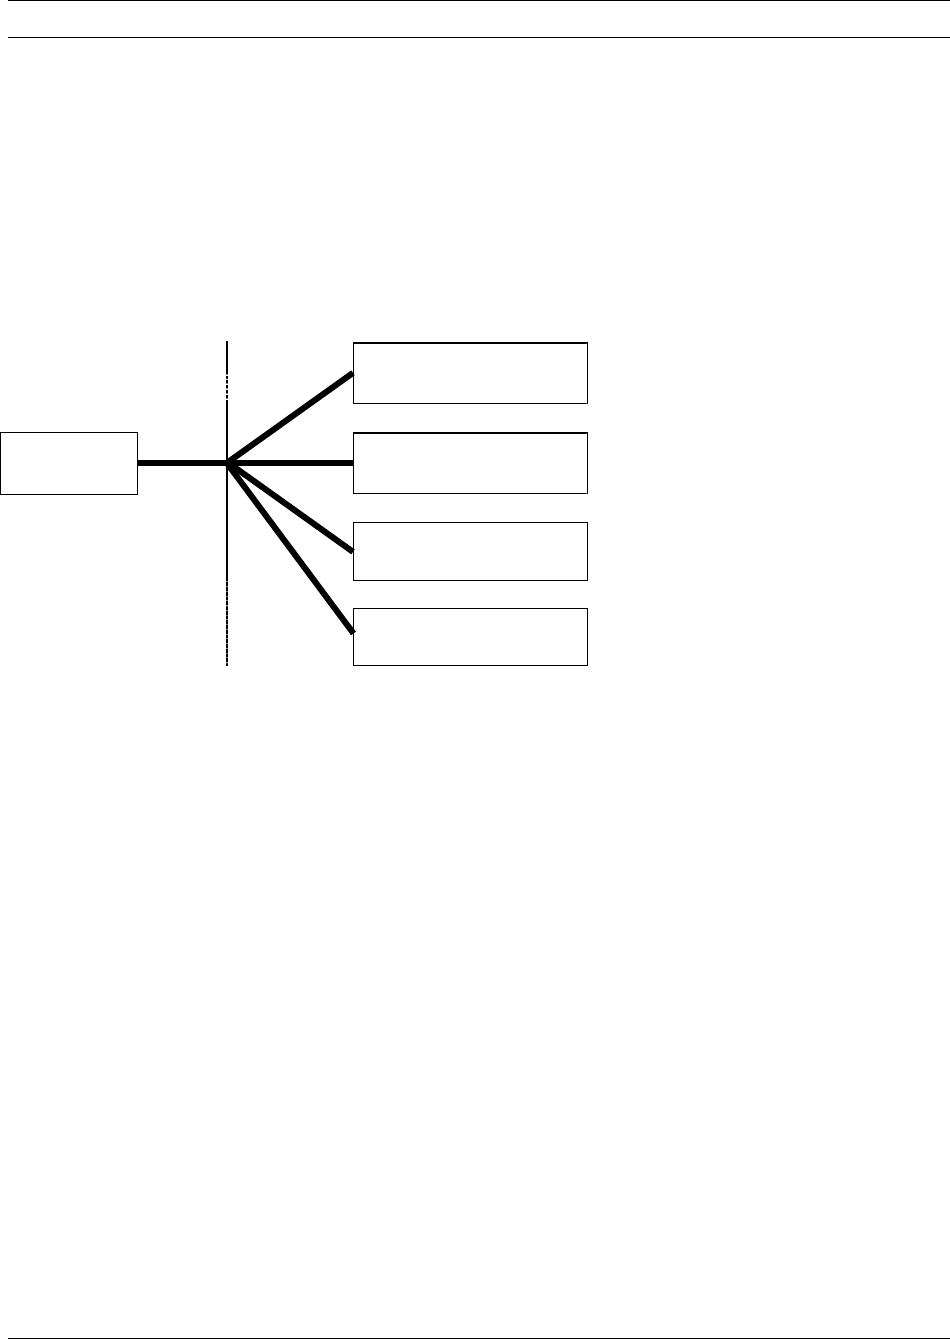
• Joint Costing Defined
o Exhibit 11.14 shows a diagram of joint cost flows.
11–10
• Reasons for Allocating Joint Costs
o Cost allocations are often used to determine departmental or division costs for measuring
executive performance.
LO 11-7 Allocate joint costs using the net realizable value method.
JOINT COST ALLOCATION METHODS
• The two major methods of allocating joint costs are the:
o Net realizable value method.
o Physical quantities method.
• Net Realizable Value Method
The estimated net realizable value is the sales price of a final product minus
additional processing costs necessary to prepare a product for sale.
Estimated net
realizable
value
=
Sales price of a
final product after
further processing
–
Additional processing costs
necessary to prepare a
product for sale
• The terms “net realizable value” and “estimated net realizable value” are used to
emphasize that we are attempting to determine the value of the products at the
split-off point.
The difference is that in the former case (net realizable value), we can sell the
product at the split-off point, so we do not have to estimate a value.
revenues generated by each output. See Demonstration Problem 5
o Estimation of Net Realizable Value
▪ See Exhibit 11.16 for a diagram of the process used by Carlyle Coal Company.
See Demonstration Problem 6
11–12
LO 11-8 Allocate joint costs using the physical quantities method.
• Physical Quantities Method
o The physical quantities method allocates joint costs based on measurement of the
volume, weight, or other physical measure of the joint products at the split-off point.
▪ The physical quantities method is used when:
▪ See Exhibit 11.18 for the allocation of joint costs using the physical quantities method.
See Demonstration Problem 7
• Evaluation of Joint Cost Methods
11–13
LO 11-9 Explain how cost data are used in the sell-or-process-further.
DECIDING WHETHER TO SELL GOODS NOW OR PROCESS THEM FURTHER
• Managers must decide whether it is more profitable to sell the output at an intermediate stage
or to process it further.
o The relevant data to be considered are the:
o It is important to note that the allocation of the joint costs is irrelevant for the current
decision. The only costs and revenues relevant to the decision are those that result from it.
▪ See Business Application box “Different Demands for Different Parts”
See Demonstration Problem 8
LO 11–10 Account for by-products.
DECIDING WHAT TO DO WITH BY-PRODUCTS
• By-products are outputs from a joint production process that are relatively minor in quantity
and/or value when compared to the main products.
o Two common methods of accounting for by-products are:
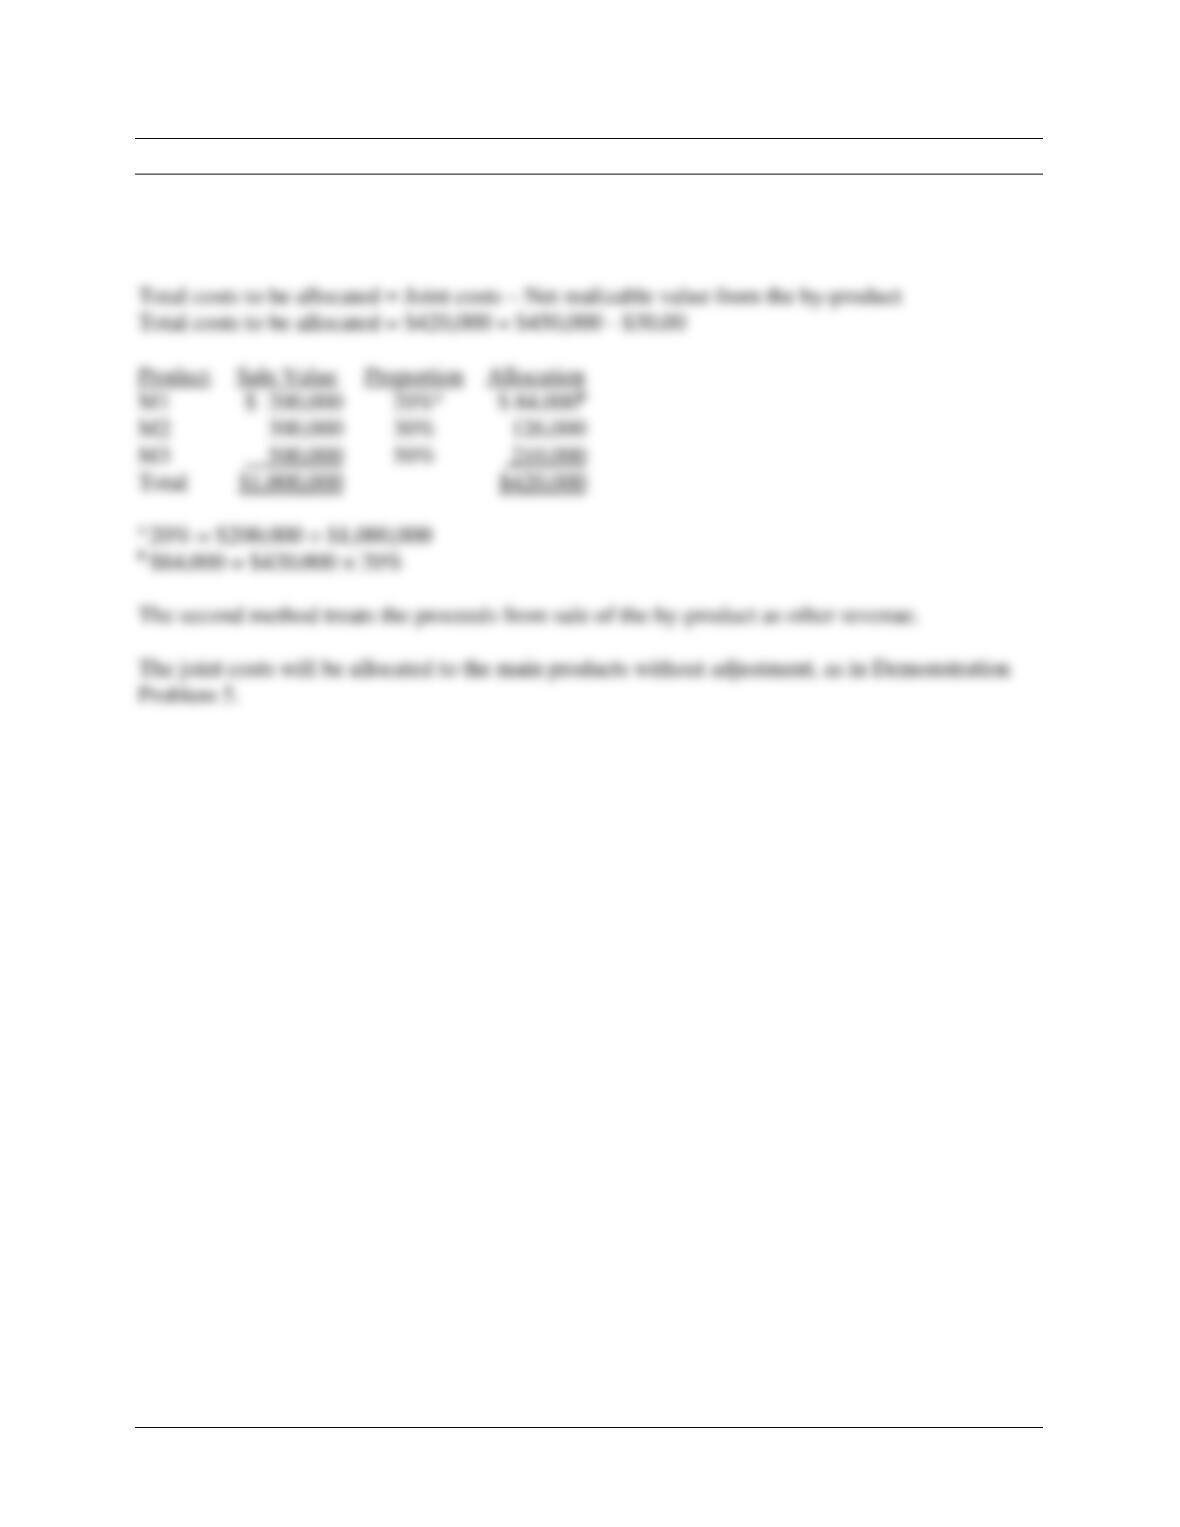
▪ Method 1: The net realizable value from sale of the by-products is deducted from the
joint cost of the main product(s). The remaining joint costs are allocated to the main
products.
11–15
LO 11–11 (Appendix) Use spreadsheets to solve reciprocal cost allocation
problems.
APPENDIX: CALCULATION OF THE RECIPROCAL METHOD USING COMPUTER
SPREADSHEETS
• The reciprocal method requires that cost relationships be written in equation form. The
method then solves the equations for the total costs to be allocated to each department.
• The set of equations can be rewritten and expressed in matrix form, and solved using the
matrix functions of a spreadsheet program such as Microsoft Excel.
o Exhibit 11.21 is a screenshot of the spreadsheet set up to solve the reciprocal cost
allocation problem.
▪ The process has three steps:

11–16
Matching
A.
By-products
H.
Net realizable value method
B.
Direct method
I.
Physical quantities method
C.
Estimated net realizable value
J.
Reciprocal method
D.
Final cost center
K.
Service department
E.
Intermediate cost center
L.
Split-off point
F.
Joint cost
M.
Step method
G.
Joint products
N.
User department
_____ 1. The method to allocate service department costs that recognizes all services provided
by any service department, including services provided to other service departments.
_____ 2. The stage of processing what separates two or more products.
_____ 3. Joint cost allocation based on measurement of the volume, weight, or other physical
measure of the joint products at the split-off point.
_____ 4. Outputs from joint production processes that are relatively minor in quantity and/or
value.
_____ 5. Sales price of a final product minus the additional processing costs necessary to
prepare a product for sale.
_____ 6. The method of service department cost allocation that allocates some service
department costs to other service departments.
_____ 7. A cost center, such as a production or marketing department, whose costs are not
allocated to another cost center.
_____ 8. Uses the functions of service departments.
_____ 9. A cost of a manufacturing process with two or more outputs.
_____ 10. A cost allocation method that charges costs of service departments to user
departments without making allocations between or among service departments.
_____ 11. Cost center whose costs are charged to other departments in the organization.
_____ 12. Provides services to other subunits in the organization.
_____ 13. Joint cost allocation based on the proportional values of the joint products at the split-
off point.
_____ 14. Outputs from a common input and common production process.
Matching Answers
1. J

11–18
Multiple Choice
1. Which of the following statements is incorrect?
a. Service departments provide services to other departments.
b. Service departments are not the same as user departments.
c. An intermediate cost center is any cost center whose costs are charged to other
departments.
d. A final cost center is any cost center whose costs are not allocated to other cost centers.
Use the following information to answer questions 2 through 6:
A company has two service departments (S1 and S2) and two manufacturing divisions (M1 and
M2). The following information is available.
Percent Allocable to
Costs
Incurred
Service
Department
S1
S2
M1
M2
$290,000
S1
–
20%
30%
50%
500,000
S2
50%
–
20%
30%
2. Using the direct method, what proportion of S1’s costs will be allocated to M2?
a. 20%
b. 37.5%
c. 50%
d. 62.5%
3. Using the direct method, how much of the service department costs will be allocated to M1?
a. $195,250
b. $205,750
c. $308,750
d. $326,450
4. Using the step method, how much of the service department costs will be allocated to M1?
a. $243,000
b. $265,700
c. $295,400
d. $302,500
5. Using the reciprocal method, how should the total service department costs of S1 be
expressed?
a. S1 = $290,000 + 0.5 × S2
b. S1 = $290,000 + 0.2 × S2
c. S1 = $290,000 + 0.3 × S2
d. S1 = $500,000 + 0.5 × S2

6. Using the reciprocal method, how much of the service department costs will be allocated to
M1?
a. $241,000
b. $286,000
c. $304,000
d. $403,000
Use the following information to answer questions 7 through 9:
A joint production process that cost $240,000 generated two main products. P1 has 15,000 units
and can be sold at the split-off point for $300,000. P2 has 25,000 units and can be sold at the
split-off point for $200,000. A by-product can be sold for $30,000.
7. Using the net realizable value method, how much of the joint costs would be allocated to P1?
a. $120,000
b. $144,000
c. $156,000
d. $183,000
8. Using the physical quantities method, how much of the joint costs would be allocated to P1?
a. $90,000
b. $120,000
c. $150,000
d. $180,000
9. If the sale value of the by-product is deducted from the joint costs of the main products, how
much is P1’s share of the total costs?
a. $126,000
b. $216,000
c. $105,000
d. $184,000
10. The relevant data for deciding whether to process further are:
a. Additional revenue after further processing.
b. Joint costs.
c. Additional costs of processing further.
d. Both a and c.
11. Which of the following is not a service department?
a. Human resources
b. Accounting
c. Mailroom
d. Production

11–20
12. Which of the following allocation methods does not consider any mutual support among
service departments?
a. Step method
b. Direct method
c. Reciprocal method
d. None of the above
11–21
Multiple Choice Answers
1. b (LO1)

11–22

11–23
Demonstration Problem 1
Kirby Industries has two service departments (S1 and S2) and three production departments (P1,
P2, and P3). The following table shows the costs incurred at the two service departments, as well
as the proportion of services provided by the two service departments to the other departments.
Costs
Incurred
Service
Department
Percent Allocable to
S1
S2
P1
P2
P3
$1,000,000
S1
–
20%
30%
40%
10%
260,000
S2
40%
–
20%
15%
25%
For example, service department S1 incurred $1,000,000 while providing 20 percent of its
services to service department S2, 30 percent to production department P1, 40 percent to
production department P2, and 10 percent to production department P3.
For simplicity, the direct costs incurred by the production departments are ignored.
The general manager of Kirby Industries wanted to know how the service department costs can
be allocated to the production departments in order to facilitate performance evaluation.
Required:
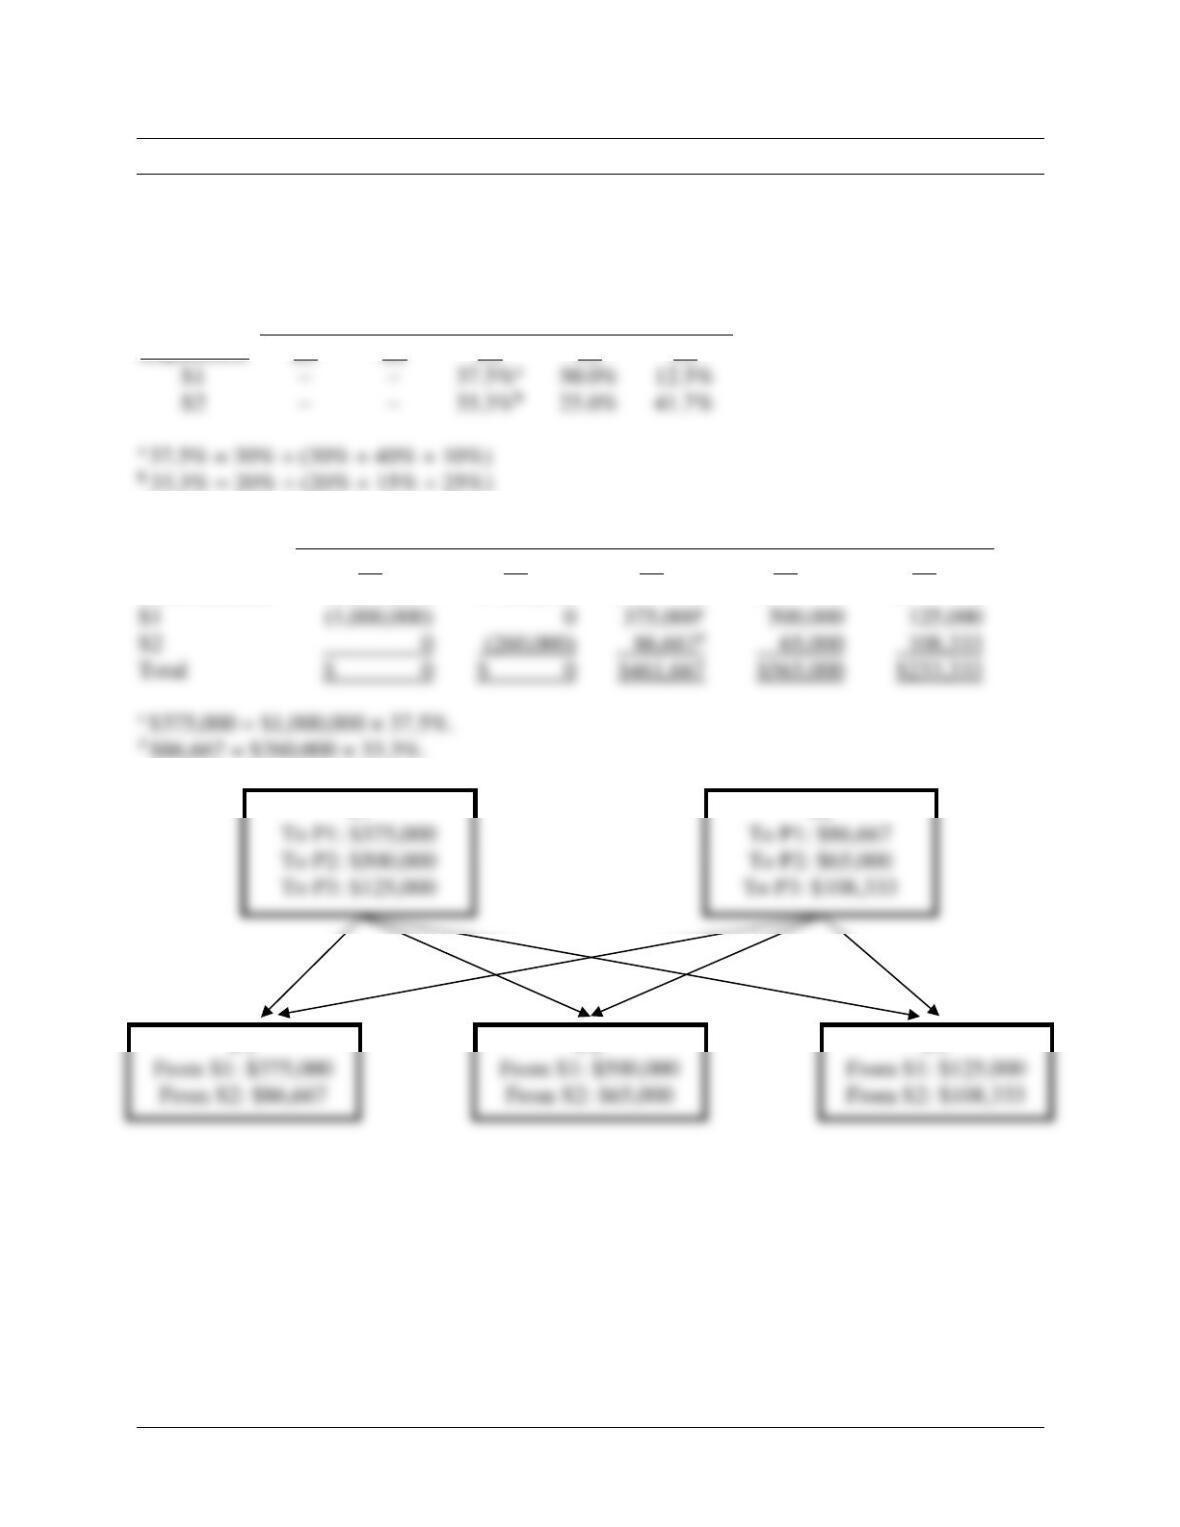
Allocate the service department costs to the production departments using the direct method.
11–24
Demonstration Problem 1 – Solution
The proportion of services to be allocated has to be revised since allocations between the two
service departments are not allowed under the direct method. These are relative usages that
ignore the mutual support between the service departments.
Service
Department
Percent Allocable to (Revised)
S1
S2
P1
P2
P3
Amount Allocable to
From:
S1
S2
P1
P2
P3
Costs incurred
$ 1,000,000
$ 260,000
$ 0
$ 0
$ 0
0
65,000
108,333
Total
$ 0
$ 0
$461,667
$565,000
$233,333
S1
S2
P1
P2
P3
S1
S2

11–25
Demonstration Problem 2
(Continued from Demonstration Problem 1; data were reproduced here.)
Kirby Industries has two service departments (S1 and S2) and three production departments (P1,
P2, and P3). The following table shows the costs incurred at the two service departments, as well
as the proportion of services provided by the two service departments to the other departments.
Costs
Incurred
Service
Department
Percent Allocable to
S1
S2
P1
P2
P3
$1,000,000
S1
–
20%
30%
40%
10%
260,000
S2
40%
–
20%
15%
25%
For example, service department S1 incurred $1,000,000 while providing 20 percent of its
services to service department S2, 30 percent to production department P1, 40 percent to
production department P2, and 10 percent to production department P3.
For simplicity, the direct costs incurred by the production departments are ignored.
The general manager of Kirby Industries wanted to know how the service department costs can
be allocated to the production departments in order to facilitate performance evaluation.
Required:
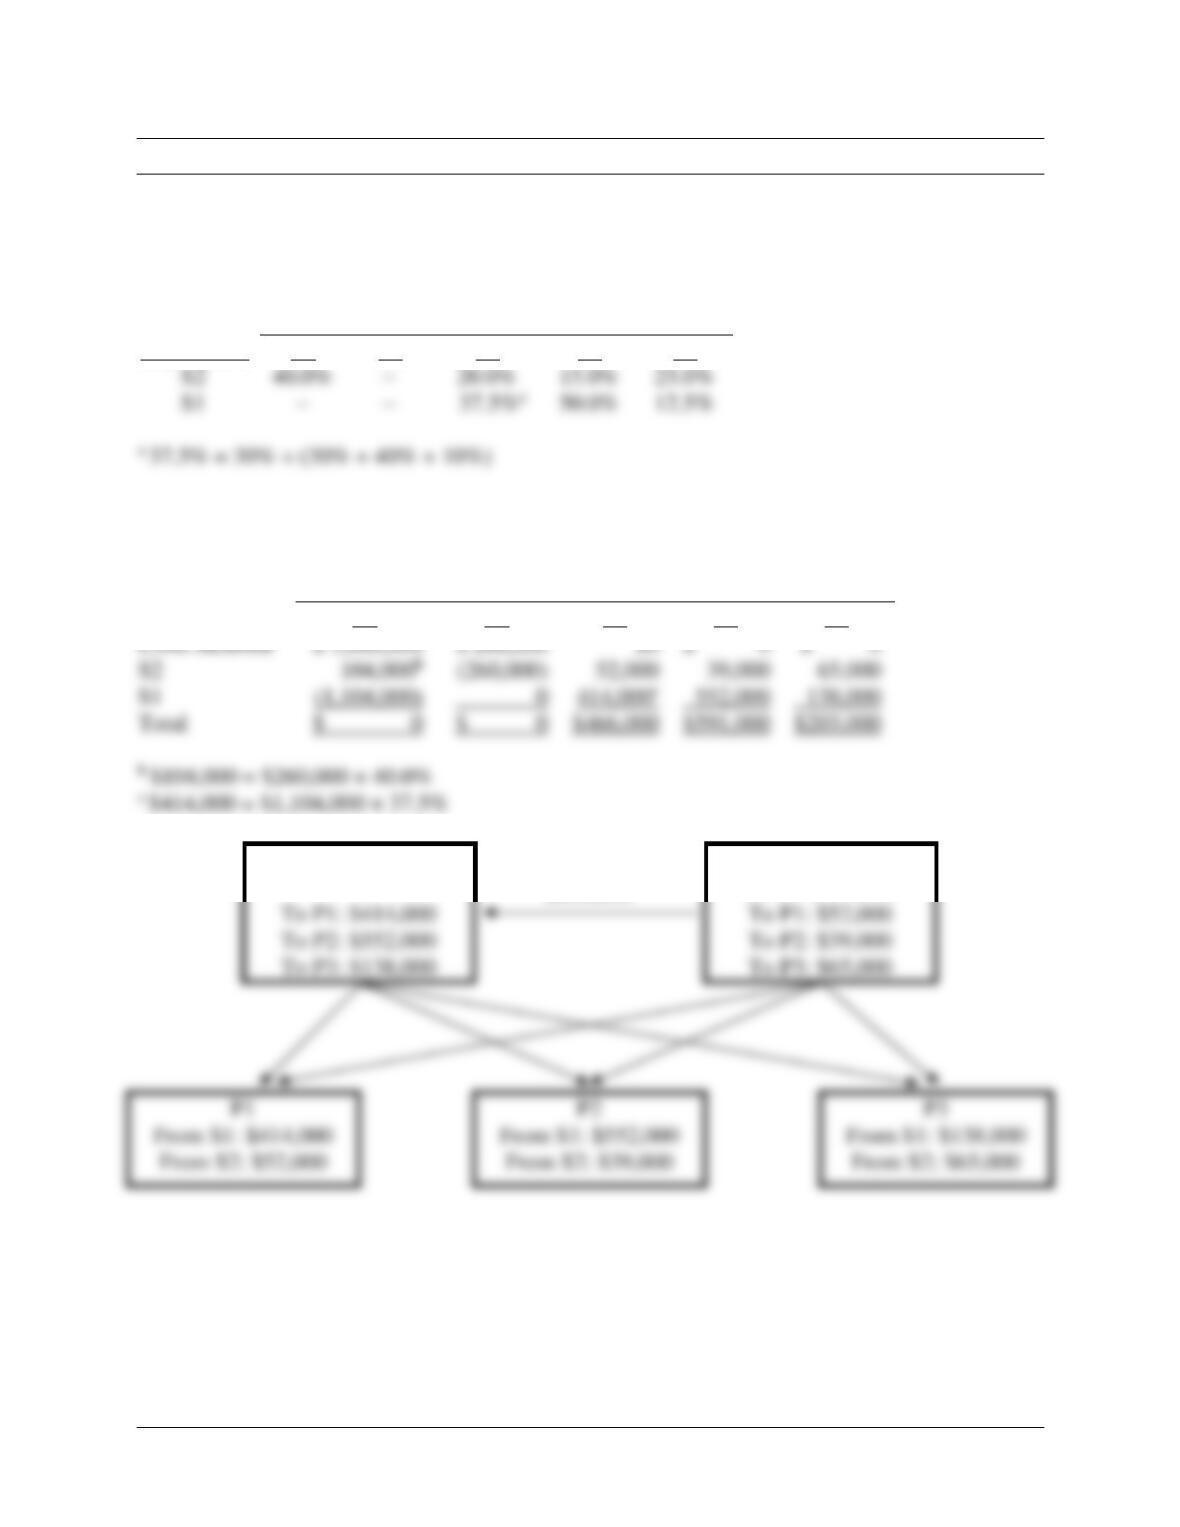
Allocate the service department costs to the production departments using the step method
(where the allocation begins with the service department that provides the largest proportion of
its total services to other service departments).
11–26
Demonstration Problem 2 – Solution
Since the service department S2 provides the largest proportion of its services to the other
service department (40 percent vs. S1’s 20 percent), S2’s costs would be allocated first to all
other departments. Once it is done, S1’s costs should not be allocated back to S2.
Service
Percent Allocable to (Revised)
Department
S1
S2
P1
P2
P3
S1’s total costs to be allocated include both the $1,000,000 incurred directly by S1 and the
$104,000 allocated from S2.
Amount Allocable to
From:
S1
S2
P1
P2
P3
Costs incurred
Total
S1
S2
To S1: $104,000
$104,000

11–27
Demonstration Problem 3
(Continued from Demonstration Problem 1; data were reproduced here.)
Kirby Industries has two service departments (S1 and S2) and three production departments (P1,
P2, and P3). The following table shows the costs incurred at the two service departments, as well
as the proportion of services provided by the two service departments to the other departments.
Costs
Incurred
Service
Department
Percent Allocable to
S1
S2
P1
P2
P3
$1,000,000
S1
–
20%
30%
40%
10%
260,000
S2
40%
–
20%
15%
25%
For example, service department S1 incurred $1,000,000 while providing 20 percent of its
services to service department S2, 30 percent to production department P1, 40 percent to
production department P2, and 10 percent to production department P3.
For simplicity, the direct costs incurred by the production departments are ignored.
The general manager of Kirby Industries wanted to know how the service department costs can
be allocated to the production departments in order to facilitate performance evaluation.
Required:
Allocate the service department costs to the production departments using the reciprocal method.
11–28
Demonstration Problem 3 – Solution
Define S1 and S2 to be the total service department costs for departments S1 and S2,
respectively.
Then,
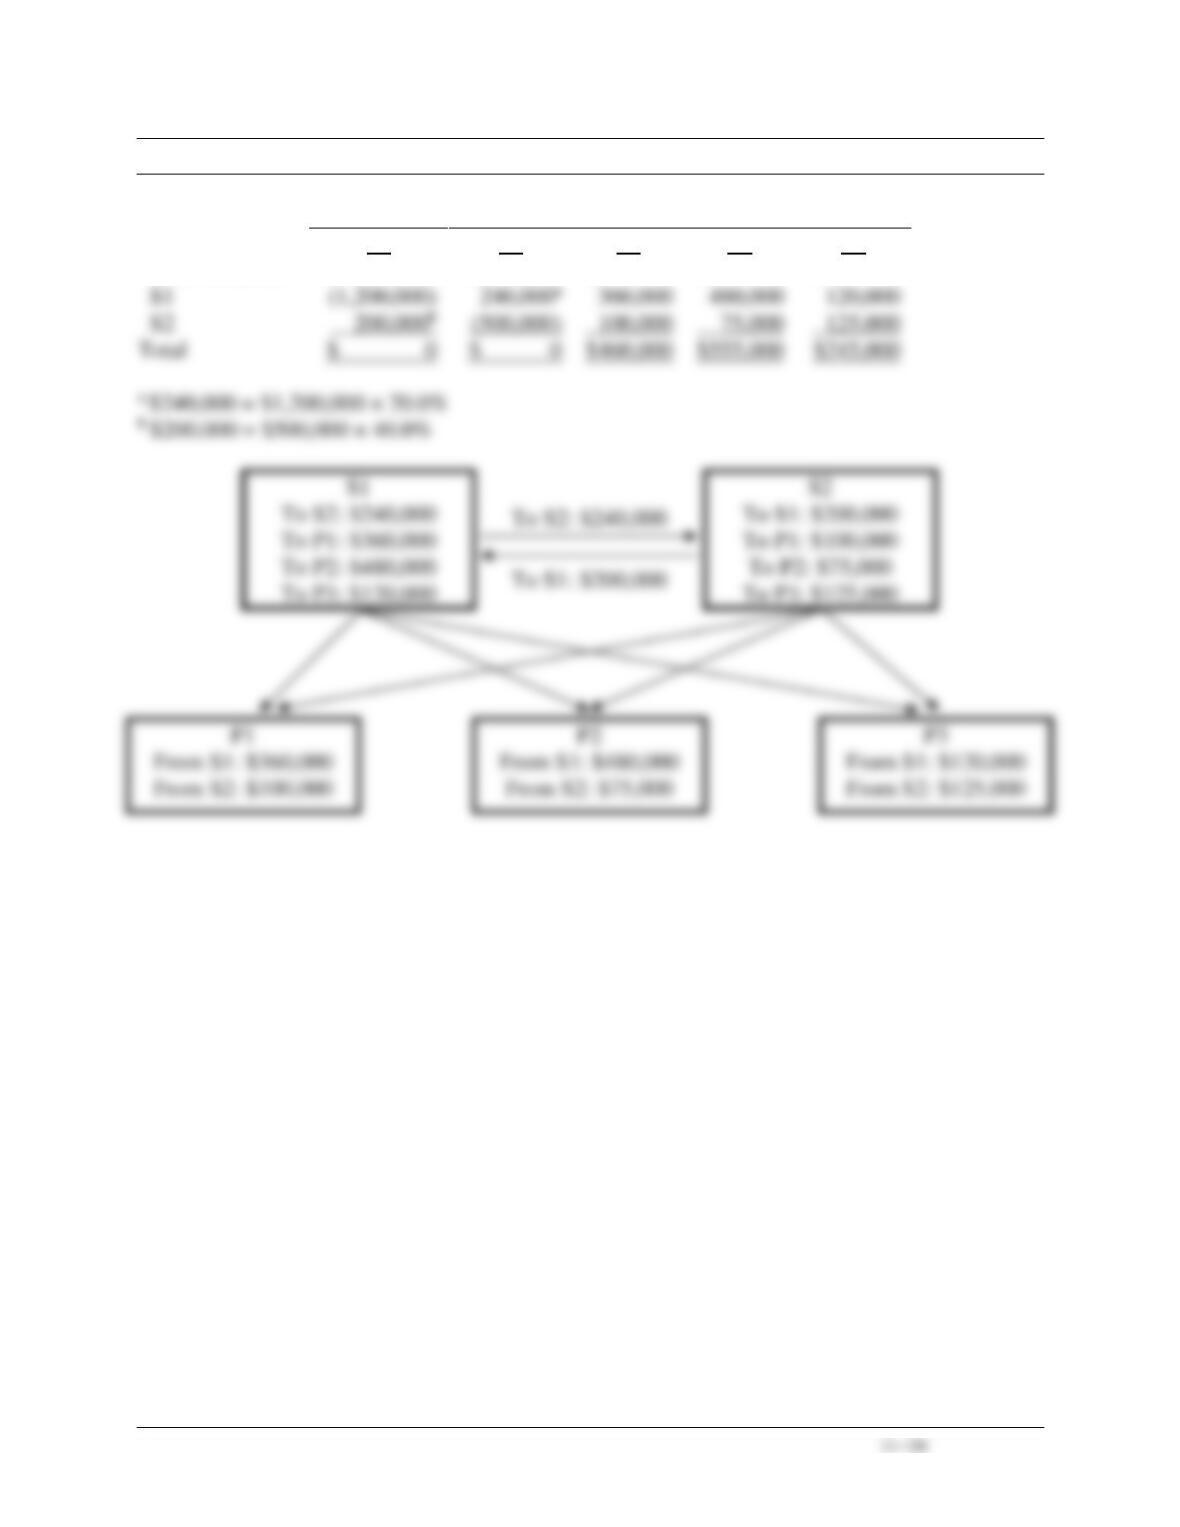
Demonstration Problem 3 – Solution, continued
Amount Allocable to
From:
S1
S2
P1
P2
P3
Costs incurred
$ 1,000,000
$ 260,000
$ 0
$ 0
$ 0
S1
S2
75,000
125,000
Total
$ 0
$ 0
$460,000
$555,000
$245,000

11–30
Demonstration Problem 4
(Revised from Demonstration Problem 3)
Kirby Industries is considering the possibility of outsourcing the activities of service department
S1. In order to evaluate the bids from qualified vendors, Kirby’s accountant provides the
following revised data that reflect only the variable costs incurred.
Variable
Costs
Incurred
Service
Department
Percent Allocable to
S1
S2
P1
P2
P3
$300,000
S1
–
20%
30%
40%
10%
104,000
S2
40%
–
20%
15%
25%
The avoidable fixed costs of running service department S1 are estimated to be $390,000.
Required:
Determine the possible cost savings from eliminating service department S1.
11–31
Demonstration Problem 4 – Solution
Define S1 and S2 to be the variable service department costs for departments S1 and S2,
respectively.
11–32
Demonstration Problem 5
Superior Refinery produces oil products in a joint production process. For the month of October,
$450,000 of materials, labor, and overhead were added to produce the three main products: M1,
M2, and M3. The sale values were available right after the split-off point. The following diagram
shows the process.
M1
Sales value $200,000
Joint costs
$450,000
M2
Sales value $300,000
M3
Sales value $500,000
Required:
1. Allocate the joint costs to the products using the net realizable value method.
2. Calculate the gross margin for each product. Comment on any observations that can be made
in this regard when the net realizable method is used.
Product
500,000
225,000
Total
$450,000
Demonstration Problem 5 – Solution
Part 1
The cost allocation follows the proportional distribution of net realizable values.
Part 2
M1
M2
M3
Total
Sales (a)
$200,000
$300,000
$500,000
$1,000,000
Allocated joint costs
90,000
135,000
225,000
Gross margin (b)
$110,000
$165,000
$275,000
$ 550,000
Gross margin percentage (a) ÷ (b)
11–34
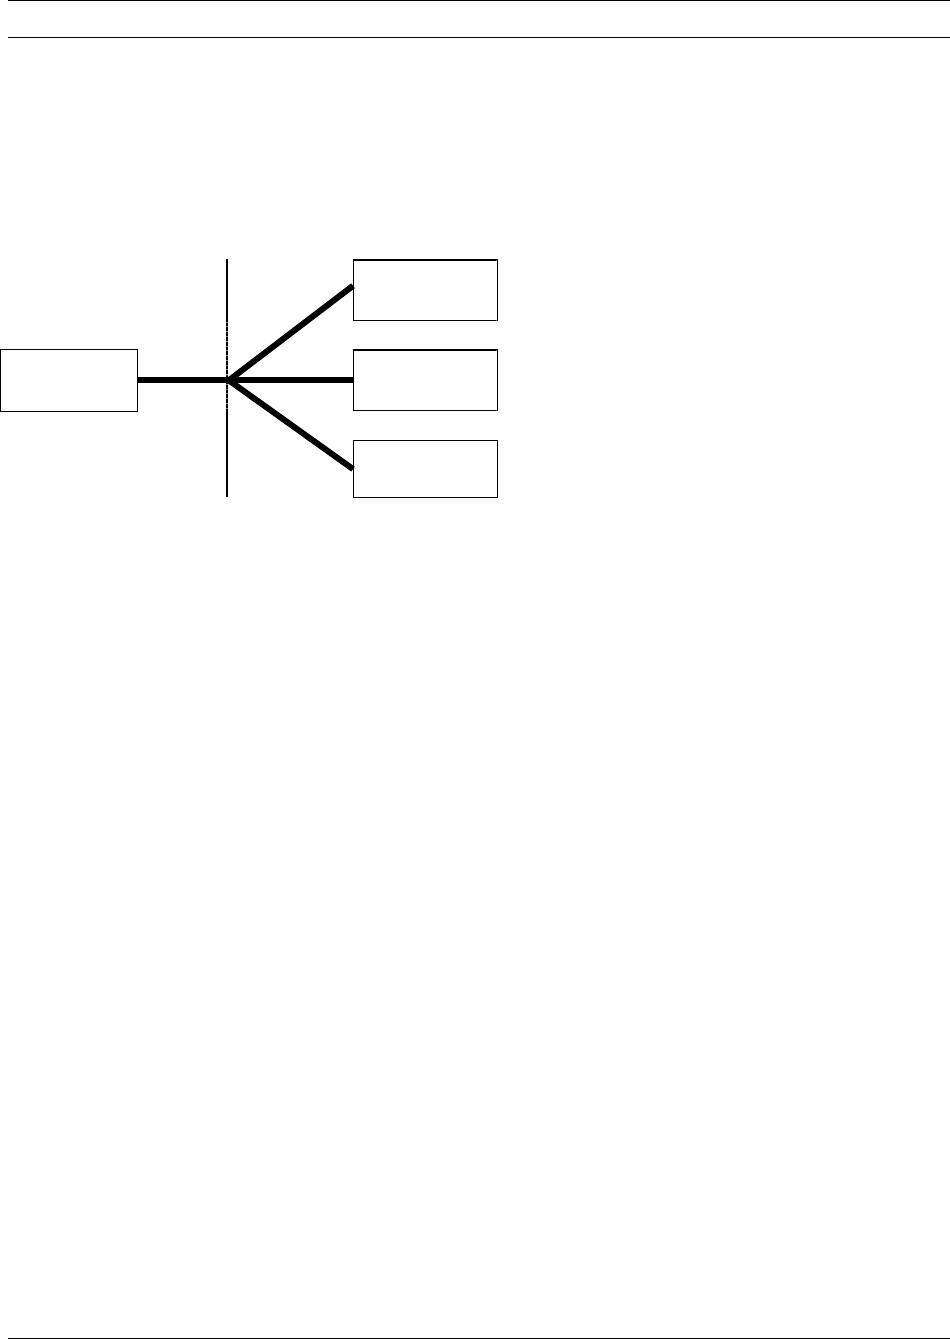
Demonstration Problem 6
(Continued from Demonstration Problem 5)
Products M1 and M2 needed further processing with additional costs before they could be
marketable. Product M3 was immediately available for sale. The following diagram shows the
process.
M1
Processing cost $120,000, Sales value $300,000
Joint costs
$450,000
M2
Processing cost $80,000, Sales value $400,000
M3
Sales value $500,000
Required:
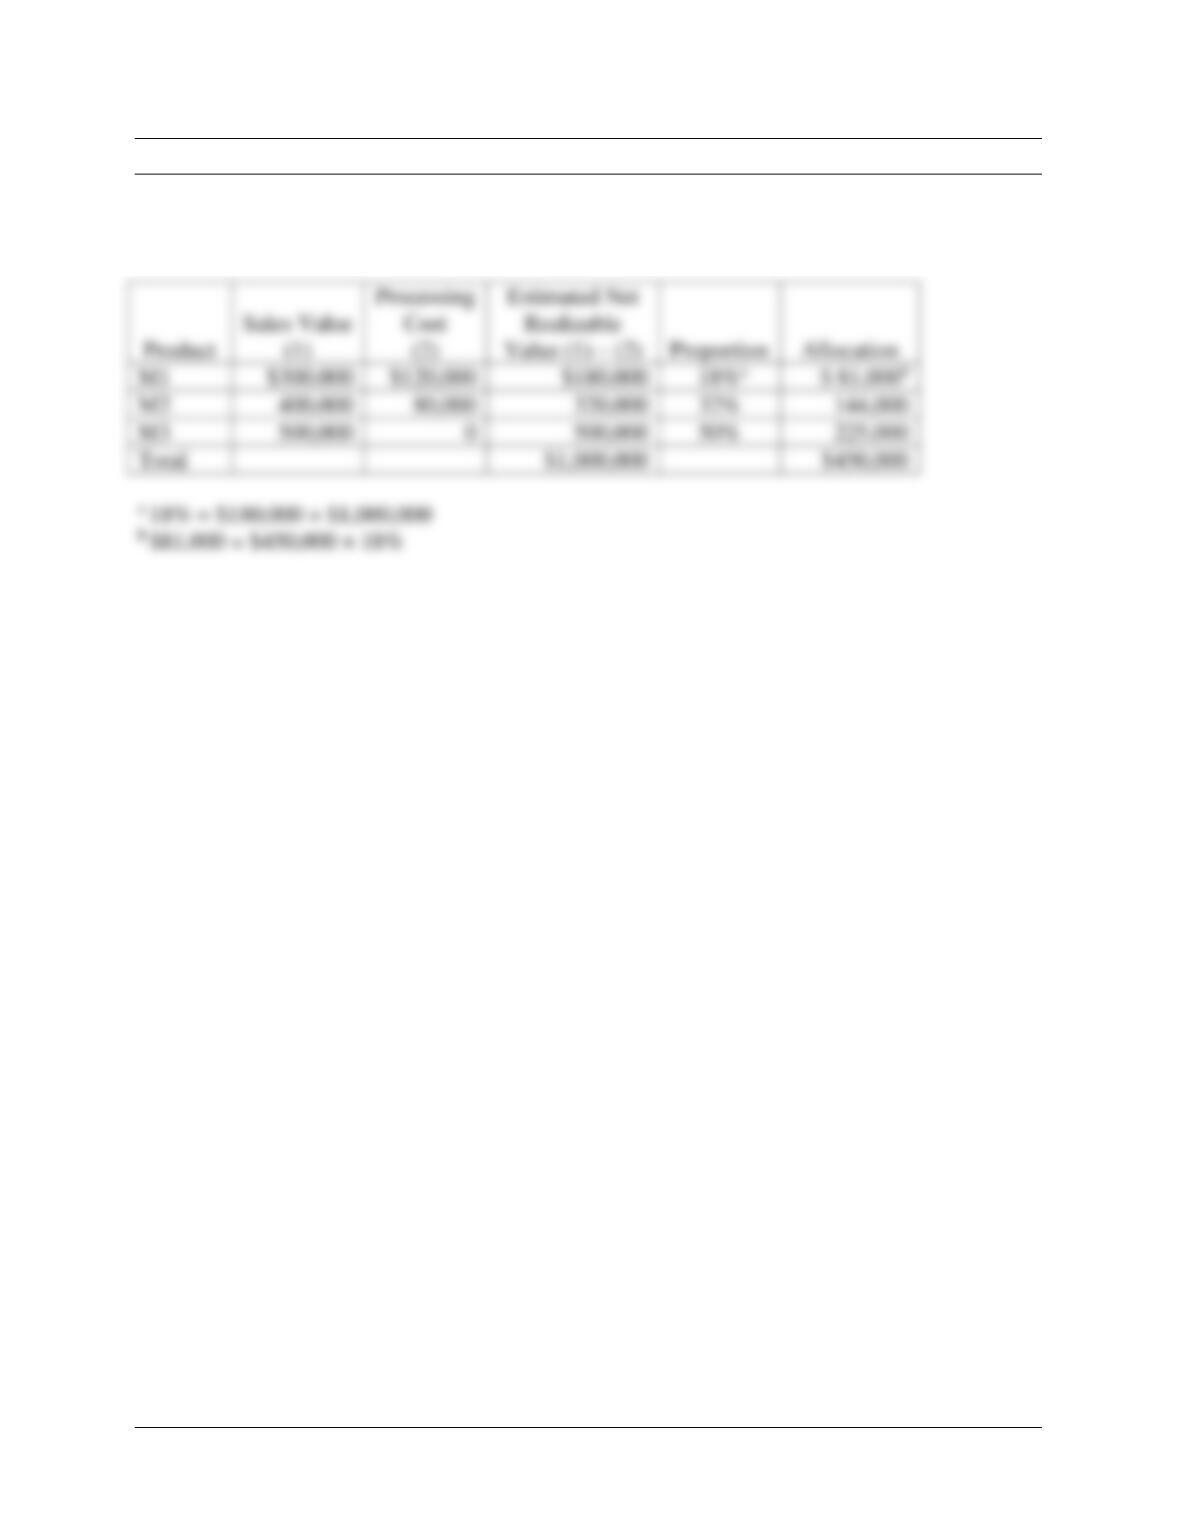
Allocate the joint costs to the products using the estimated net realizable value method.
11–35
Demonstration Problem 6 – Solution
The estimated net realizable value is used for joint cost allocation in the same way as an actual
market value at the split-off point.
11–36
Demonstration Problem 7
(Continued from Demonstration Problem 5)
Superior Refinery produces oil products in a joint production process. For the month of October,
$450,000 of materials, labor and overhead were added to produce the three main products: M1,
M2, and M3. The physical quantities of the outputs are considered relevant for cost allocation
purposes. The following diagram shows the process.
M1
15,000 units
Joint costs
$450,000
M2
20,000 units
M3
25,000 units
Required:
Allocate the joint costs to the products using the physical quantities method.
11–37
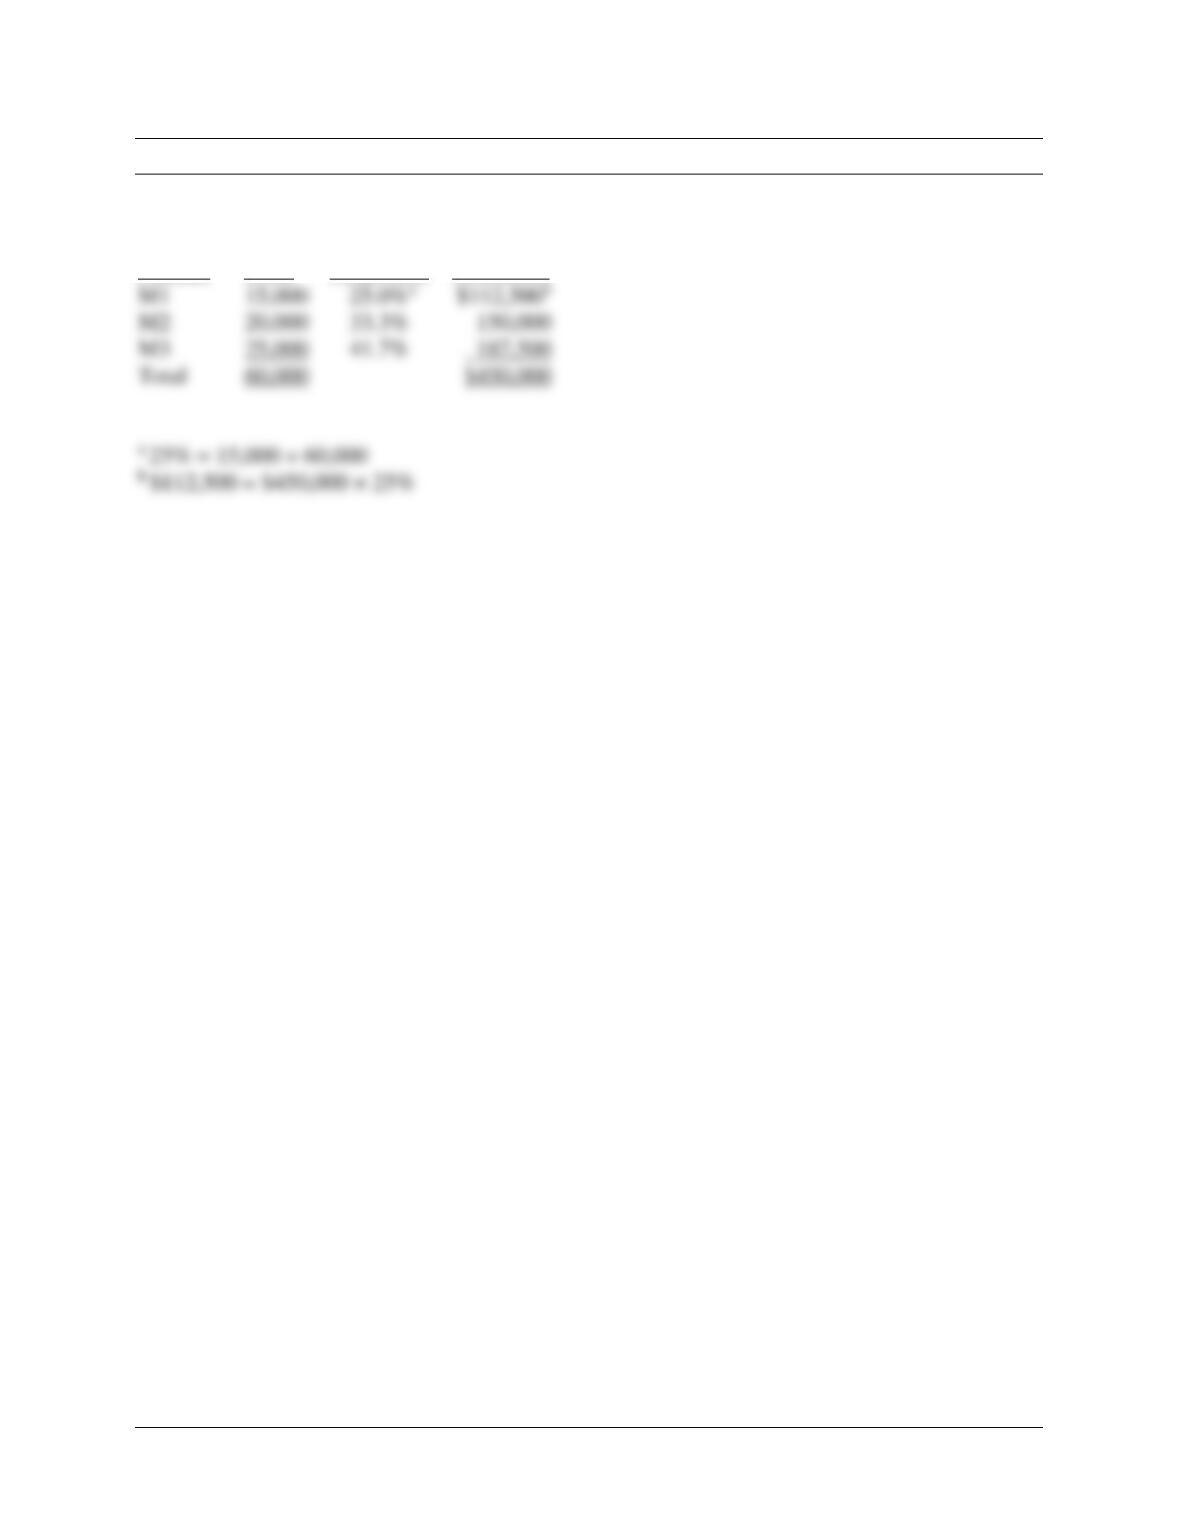
Demonstration Problem 7 – Solution
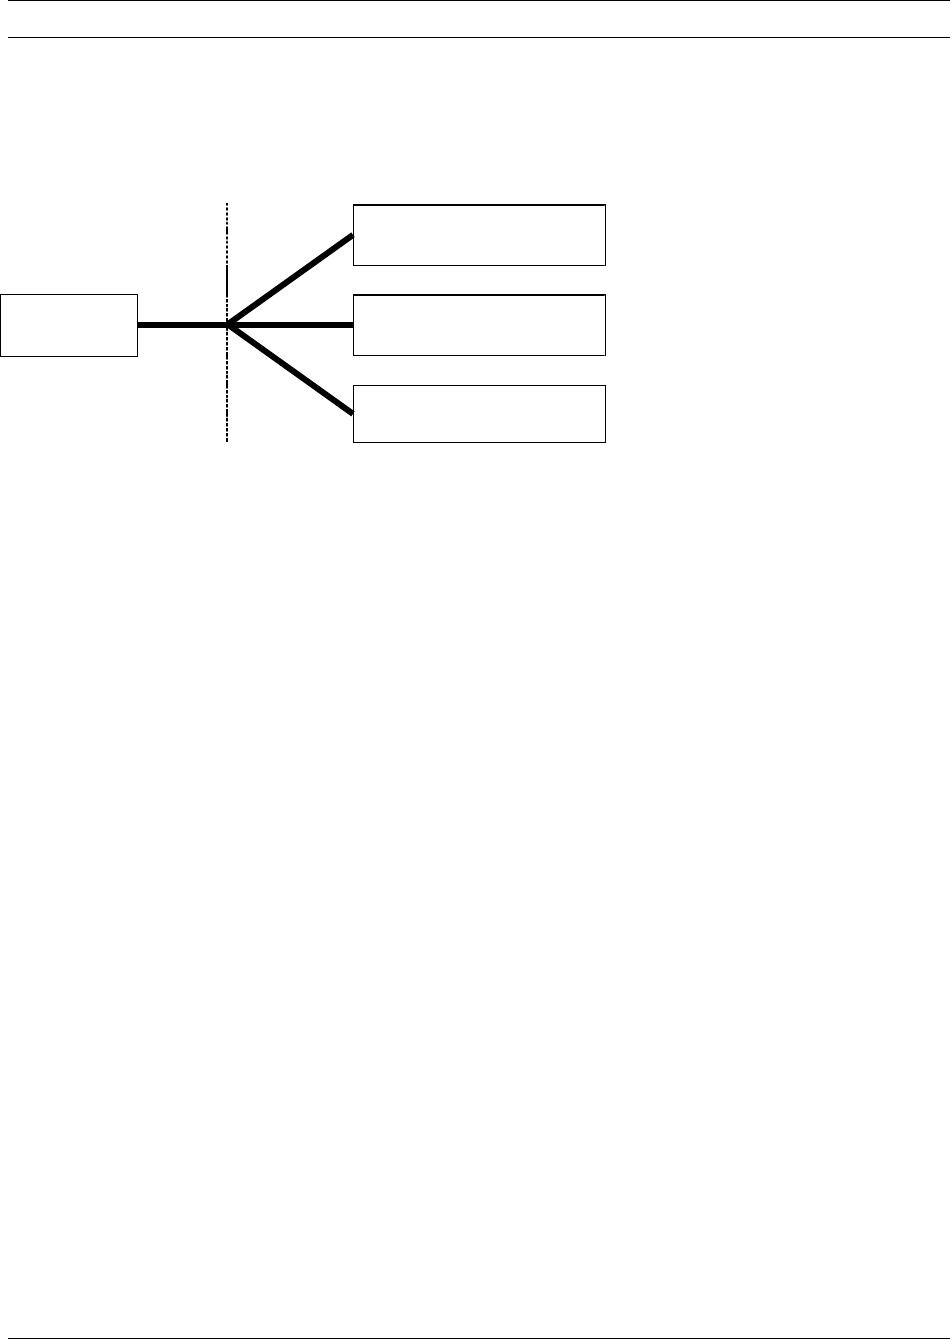
The allocation of joint costs is based on the physical units in this case.
Product
Units
Proportion
Allocation
15,000
20,000
25,000
187,500
Total
60,000
$450,000
11–38
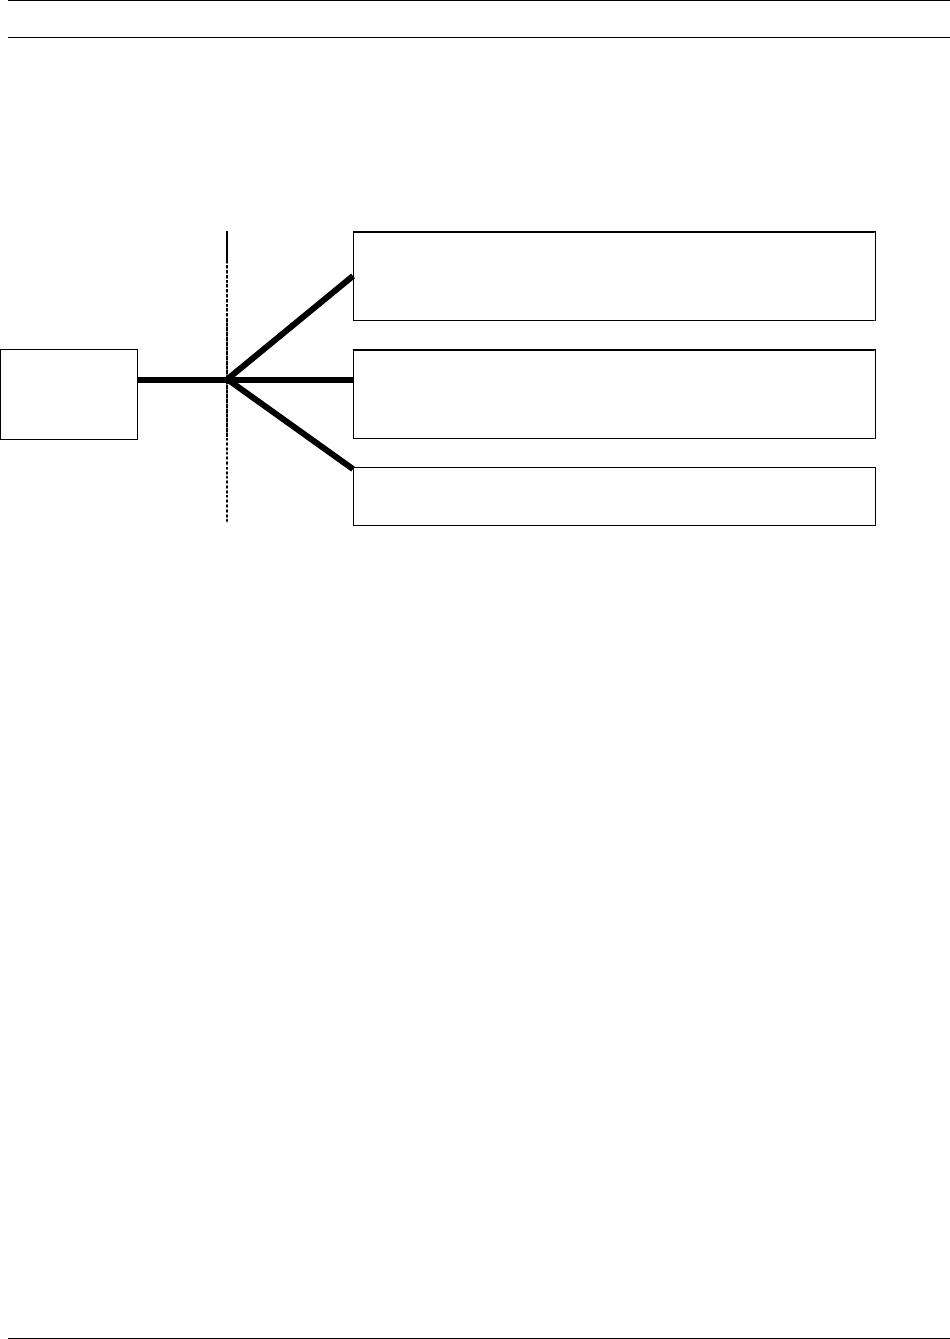
Demonstration Problem 8
(Continued from Demonstration Problems 5 and 6)
Products M1 and M2 can be sold immediately after the split-off point. They can also be
processed further and sold at higher prices. The following diagram shows the process.
M1
Sales value at the split-off point $200,000
Processing cost $120,000, New sale value $300,000
Joint costs
$450,000
M2
Sales value at the split-off point $300,000
Processing cost $80,000, New sale value $400,000
M3
Sales value $500,000
Required:
Determine whether to sell M1 and M2 right after the split-off point, or process them further to be
sold at higher prices.
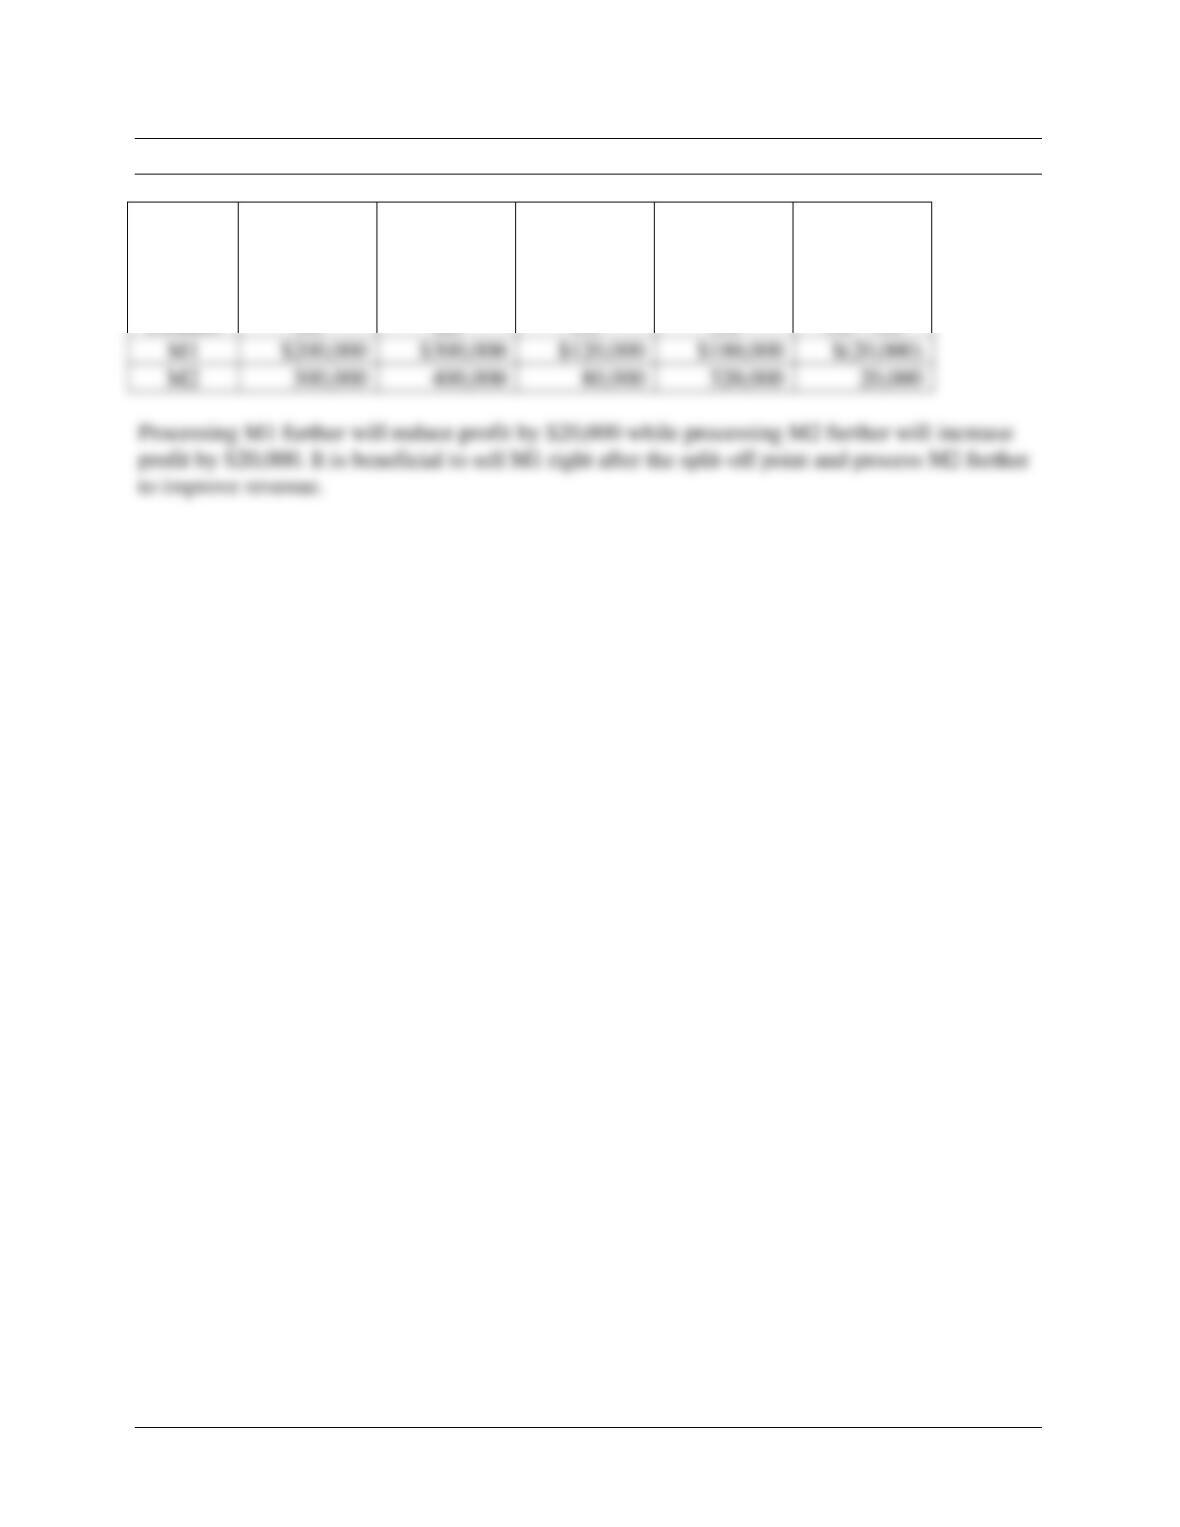
11–39
Demonstration Problem 8 – Solution
Product
Sales Value
At Split-Off
Point
(1)
Sales Value
After
Processing
(2)
Processing
Cost
(3)
Margin
(4) = (2) –
(3)
Additional
Profit From
Processing
Further
(4) – (1)
11–40
Demonstration Problem 9
(Continued from Demonstration Problem 5)
Superior Refinery produces oil products in a joint production process. For the month of October,
$450,000 of materials, labor, and overhead were added to produce the three main products: M1,
M2, and M3. The sale values were available right after the split-off point.
Superior Refinery also produced a by-product, B, in October that was sold for $30,000. The
following diagram shows the process.
M1
Sales value $200,000
Joint costs
$450,000
M2
Sales value $300,000
M3
Sales value $500,000
B
Sales value $30,000
Required:
Discuss the accounting treatments for the by-product.
11–41
Demonstration Problem 9 – Solution
There are two methods of accounting for by-products. The first method deducts the net realizable
value from sale of the by-products from the cost of the main products, as shown below.