CHAPTER 11
COST BEHAVIOR AND
COST-VOLUME-PROFIT ANALYSIS
CLASS DISCUSSION QUESTIONS
1. Total variable costs vary in direct proportion
to changes in the level of activity. Unit varia-
ble costs remain the same with changes in
the level of activity.
4. a. Fixed costs
b. Fixed costs
c. Fixed costs
5. Mixed costs are separated into their fixed
and variable cost components.
6. (b)
7. (a)
8. (b)
10. a. No impact on the contribution margin.
b. Income from operations would decrease.
11. A high contribution margin ratio, coupled
with idle capacity, indicates a potential for
sales promotion campaign should be con-
sidered in order to expand sales to maxi-
mum capacity and to take advantage of the
low ratio of variable costs to sales.
sales than did Cheddar Company. Such a
situation resulted in a lower break-even
point for Gouda Company.
15. CVP analysis depends on five primary as-
sumptions. They are (1) total sales and total
costs can be represented by straight lines;
(2) within the relevant range of operating ac-
tivity, the efficiency of operations does not
change; (3) costs can be accurately divided
These components are weighted by the
sales mix percentages.
17. Operating leverage measures the relative
mix of a business’s variable costs and fixed
costs. It is computed as follows:
332
EXERCISES
E11–1
1. Variable
2. Variable
9. Variable
10. Mixed
E11–2
a. Cost Graph Three
d. Cost Graph Two
E11–3
1. a
2. b
E11–4
1. g
2. d
3. f *
E11–5
a. Variable
b. Fixed
g. Variable
h. Variable
334
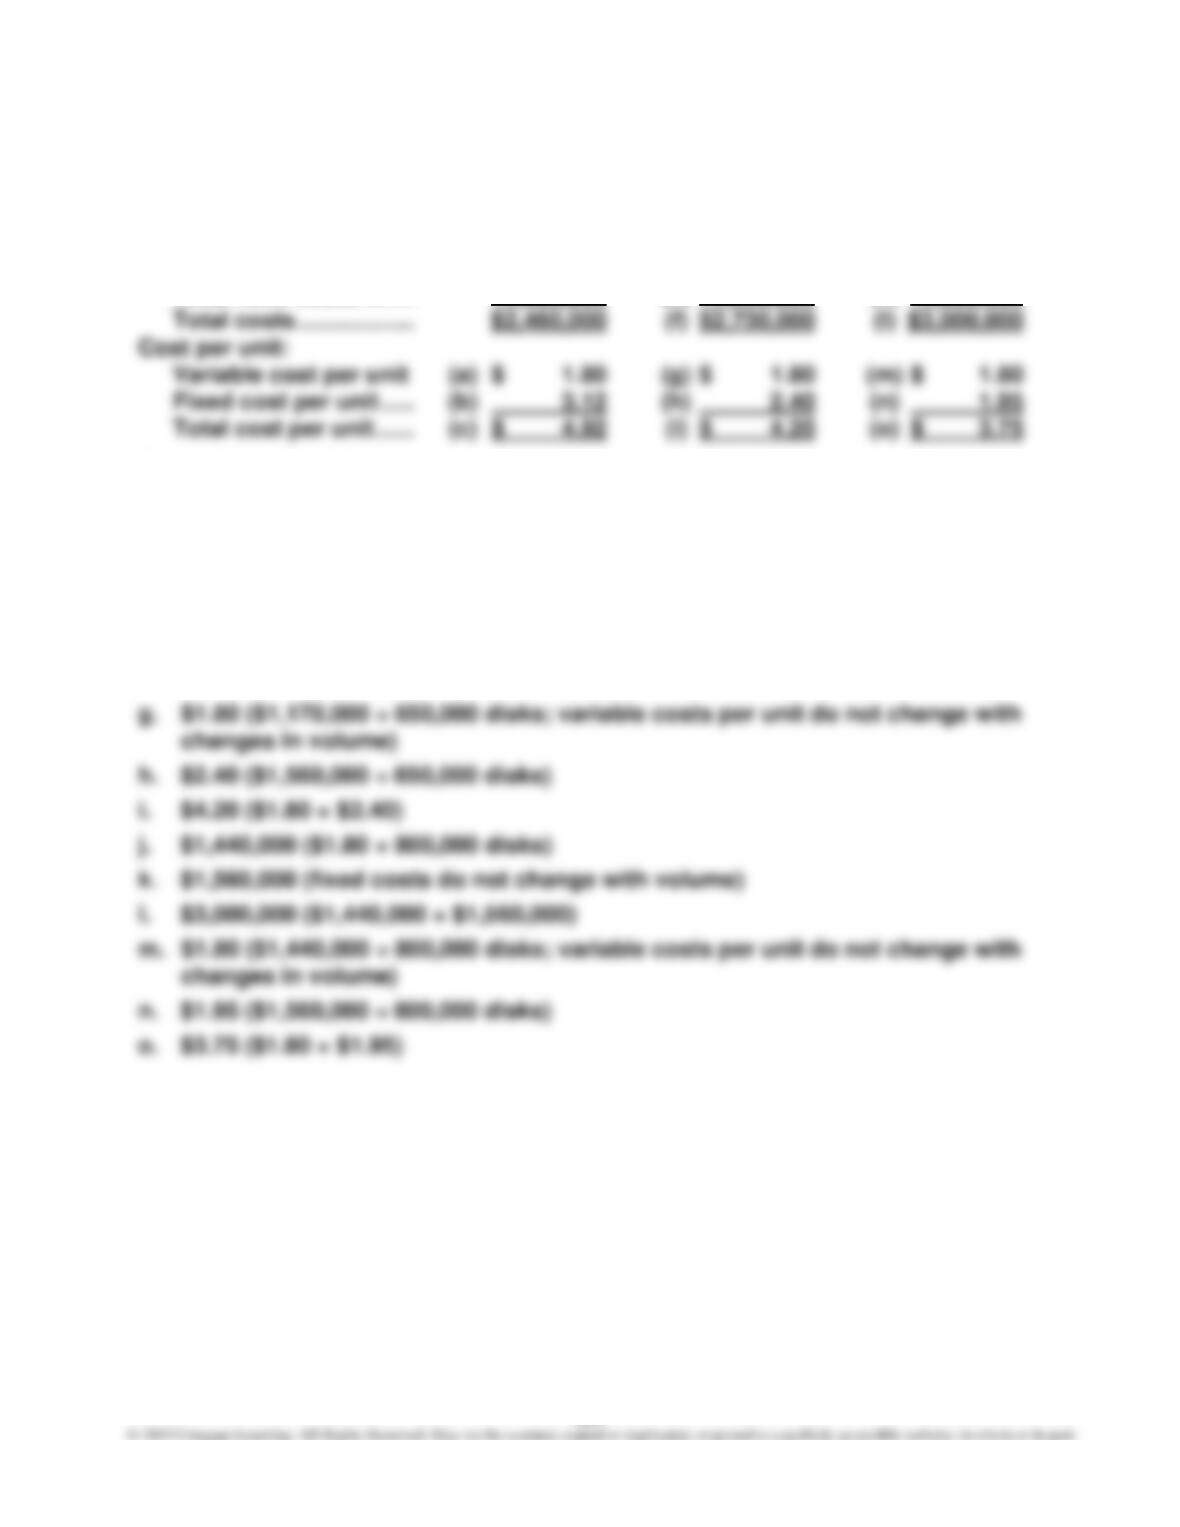
E11–6
Components produced … 500,000 650,000 800,000
Total costs:
Total variable costs … $ 900,000 (d) $1,170,000 (j) $1,440,000
Total fixed costs ……… 1,560,000 (e) 1,560,000 (k) 1,560,000
Supporting calculations:
a. $1.80 ($900,000 ÷ 500,000 disks)
b. $3.12 ($1,560,000 ÷ 500,000 disks)
c. $4.92 ($1.80 + $3.12)
d. $1,170,000 ($1.80 × 650,000 disks)
e. $1,560,000 (fixed costs do not change with volume)
f. $2,730,000 ($1,170,000 + $1,560,000)
E11–7
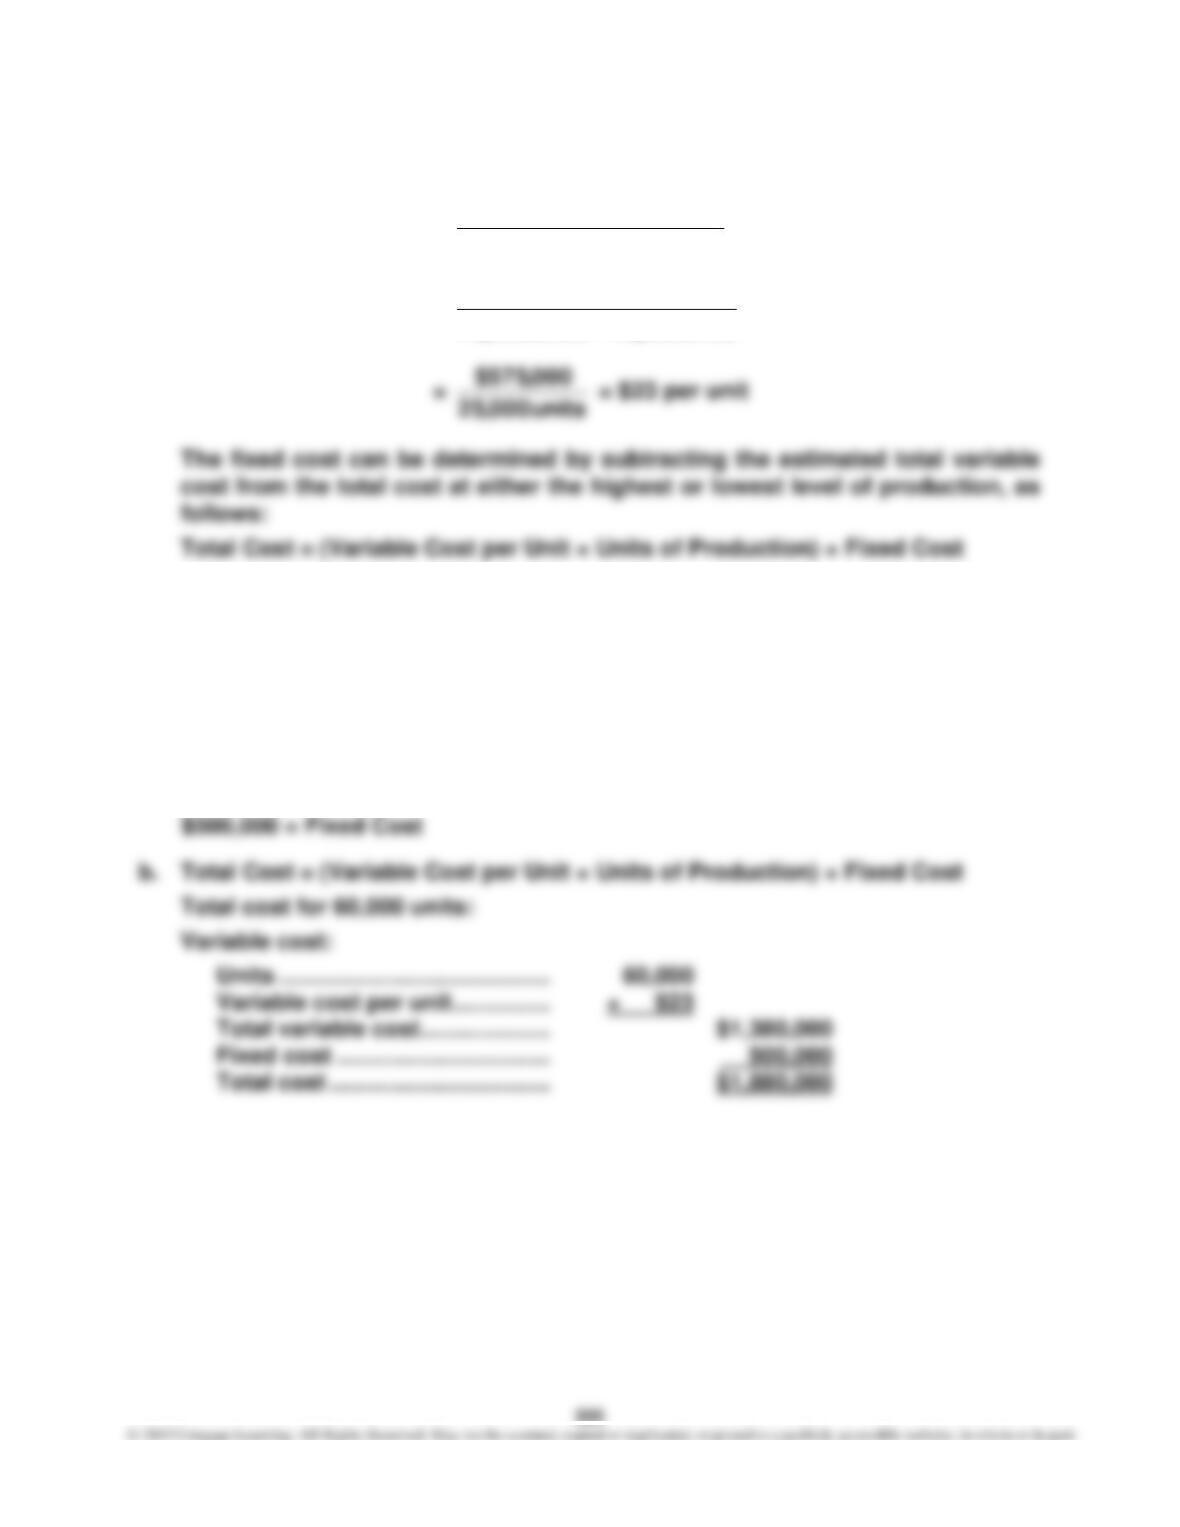
a. Variable Cost per Unit =
Production in Difference
Costs Total in Difference
=
units000,45 –– units 000,70
000,535,1$–– 000,110,2$
Highest level:
$2,110,000 = ($23 × 70,000 units) + Fixed Cost
$2,110,000 = $1,610,000 + Fixed Cost
$500,000 = Fixed Cost
Lowest level:
$1,535,000 = ($23 × 45,000 units) + Fixed Cost
$1,535,000 = $1,035,000 + Fixed Cost
336
E11–8
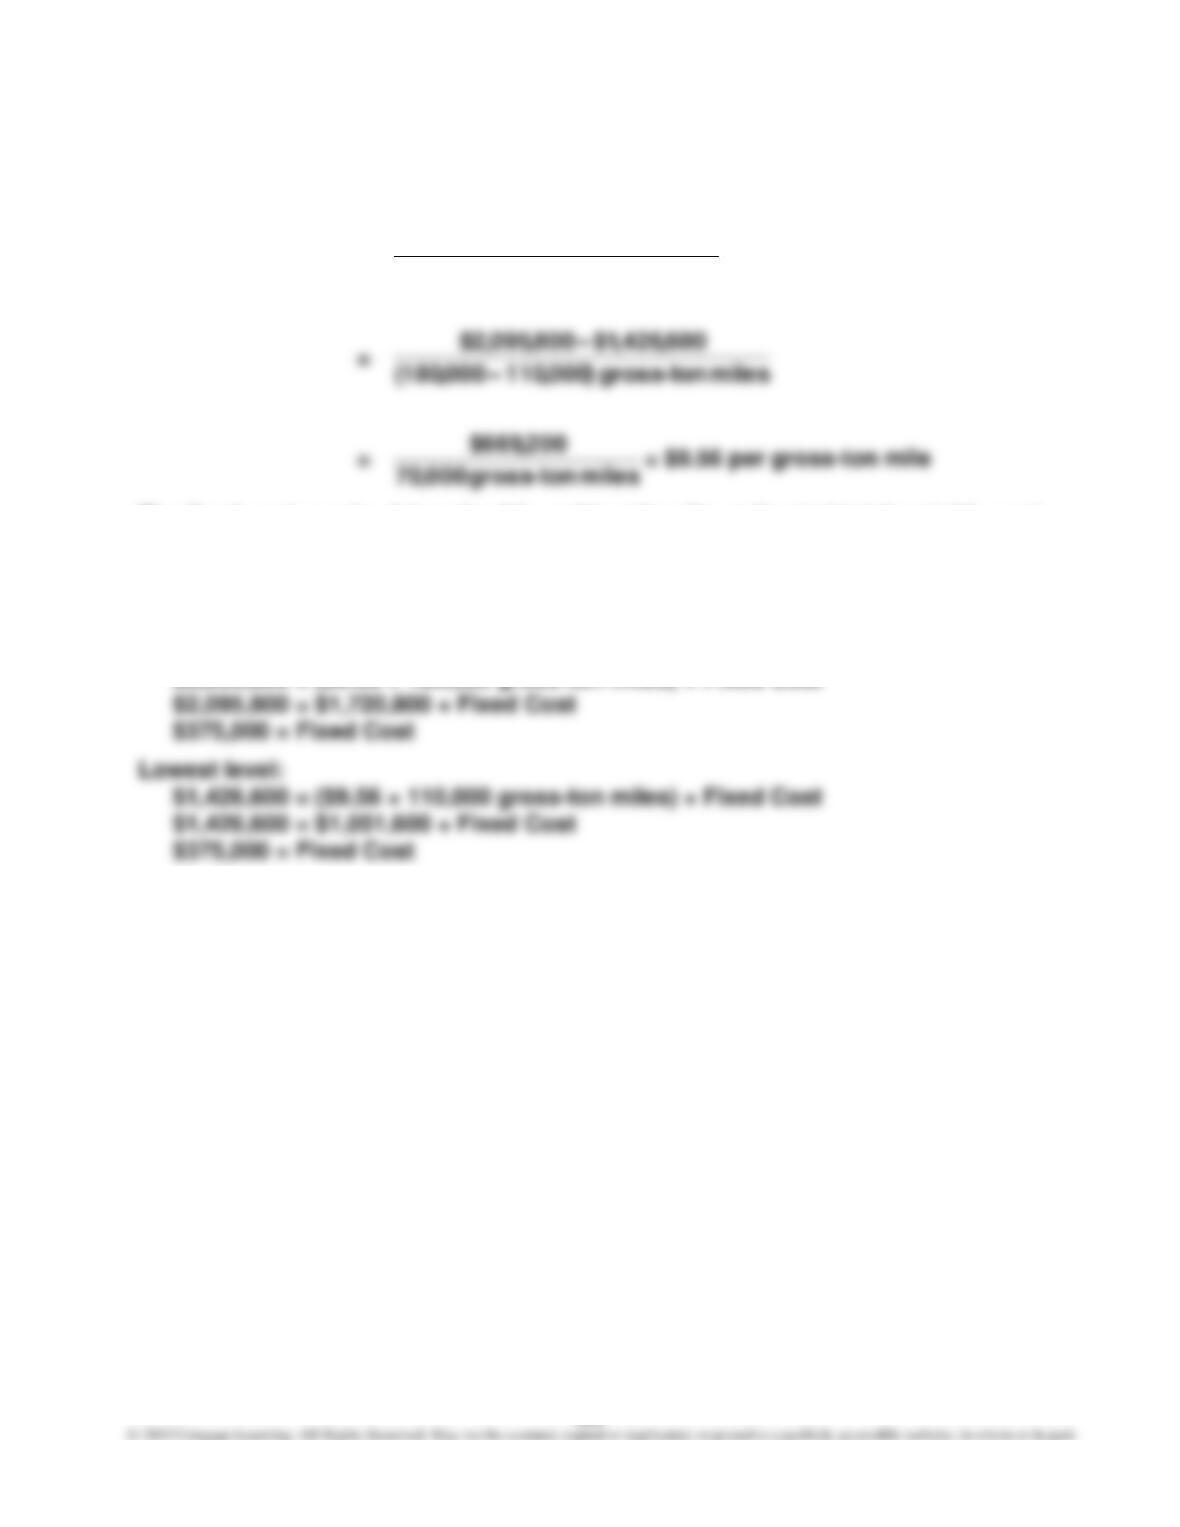
Gross-Ton Mile =
Miles Ton–Gross in Difference
Costs Total in Difference
The fixed cost can be determined by subtracting the estimated total variable cost
from the total cost at either the highest or lowest level of gross-ton miles, as fol-
lows:
Total Cost = (Variable Cost per Gross-Ton Mile × Gross-Ton Miles) + Fixed Cost
Highest level:
$2,095,800 = ($9.56 × 180,000 gross-ton miles) + Fixed Cost
Variable Cost per
E11–9
a.
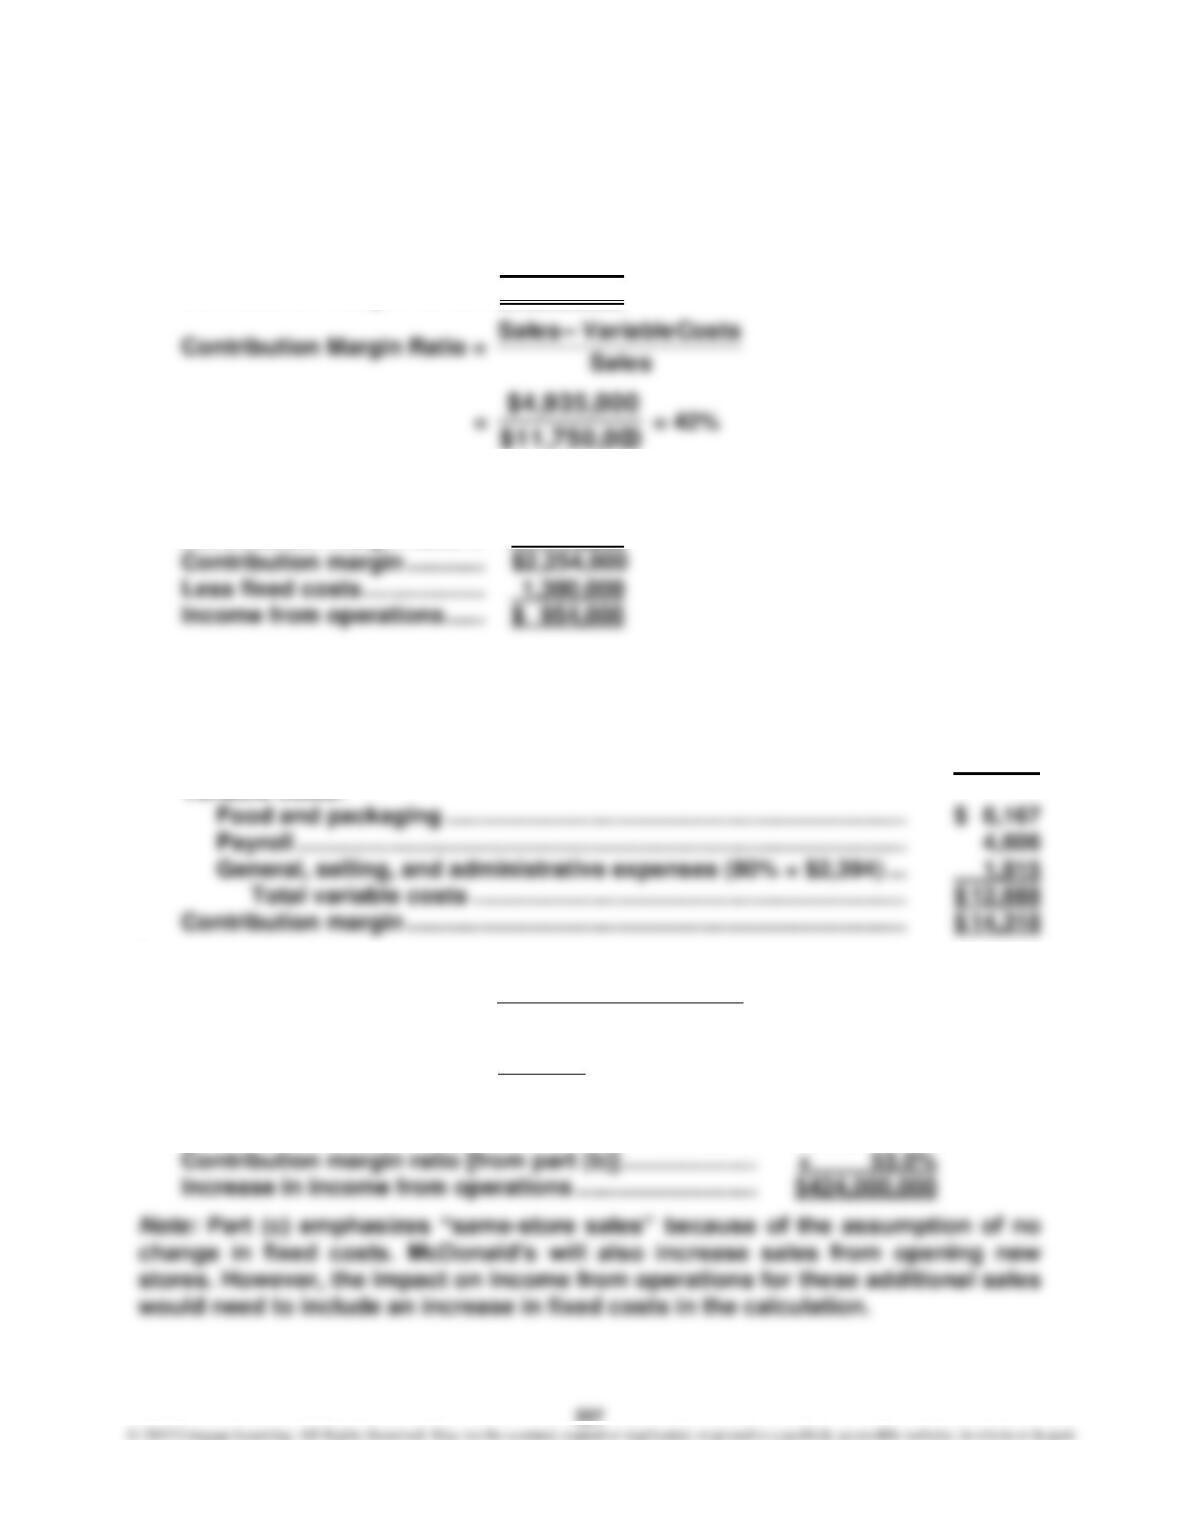
Sales ………………………………. $11,750,000
Variable costs …………………. 6,815,000
Contribution margin ………… $ 4,935,000
b.
Sales ………………………………. $6,440,000
Contribution margin ratio … × 35%
E11–10
a.
Sales ………………………………………………………………………………………… $ 27,006
Variable costs:
b.
Contribution Margin Ratio =
Sales Variable Costs
Sales
−
=
$27,006
$14,318
= 53.0%
c. Same-store sales increase …………………………………….. $800,000,000
338
E11–11
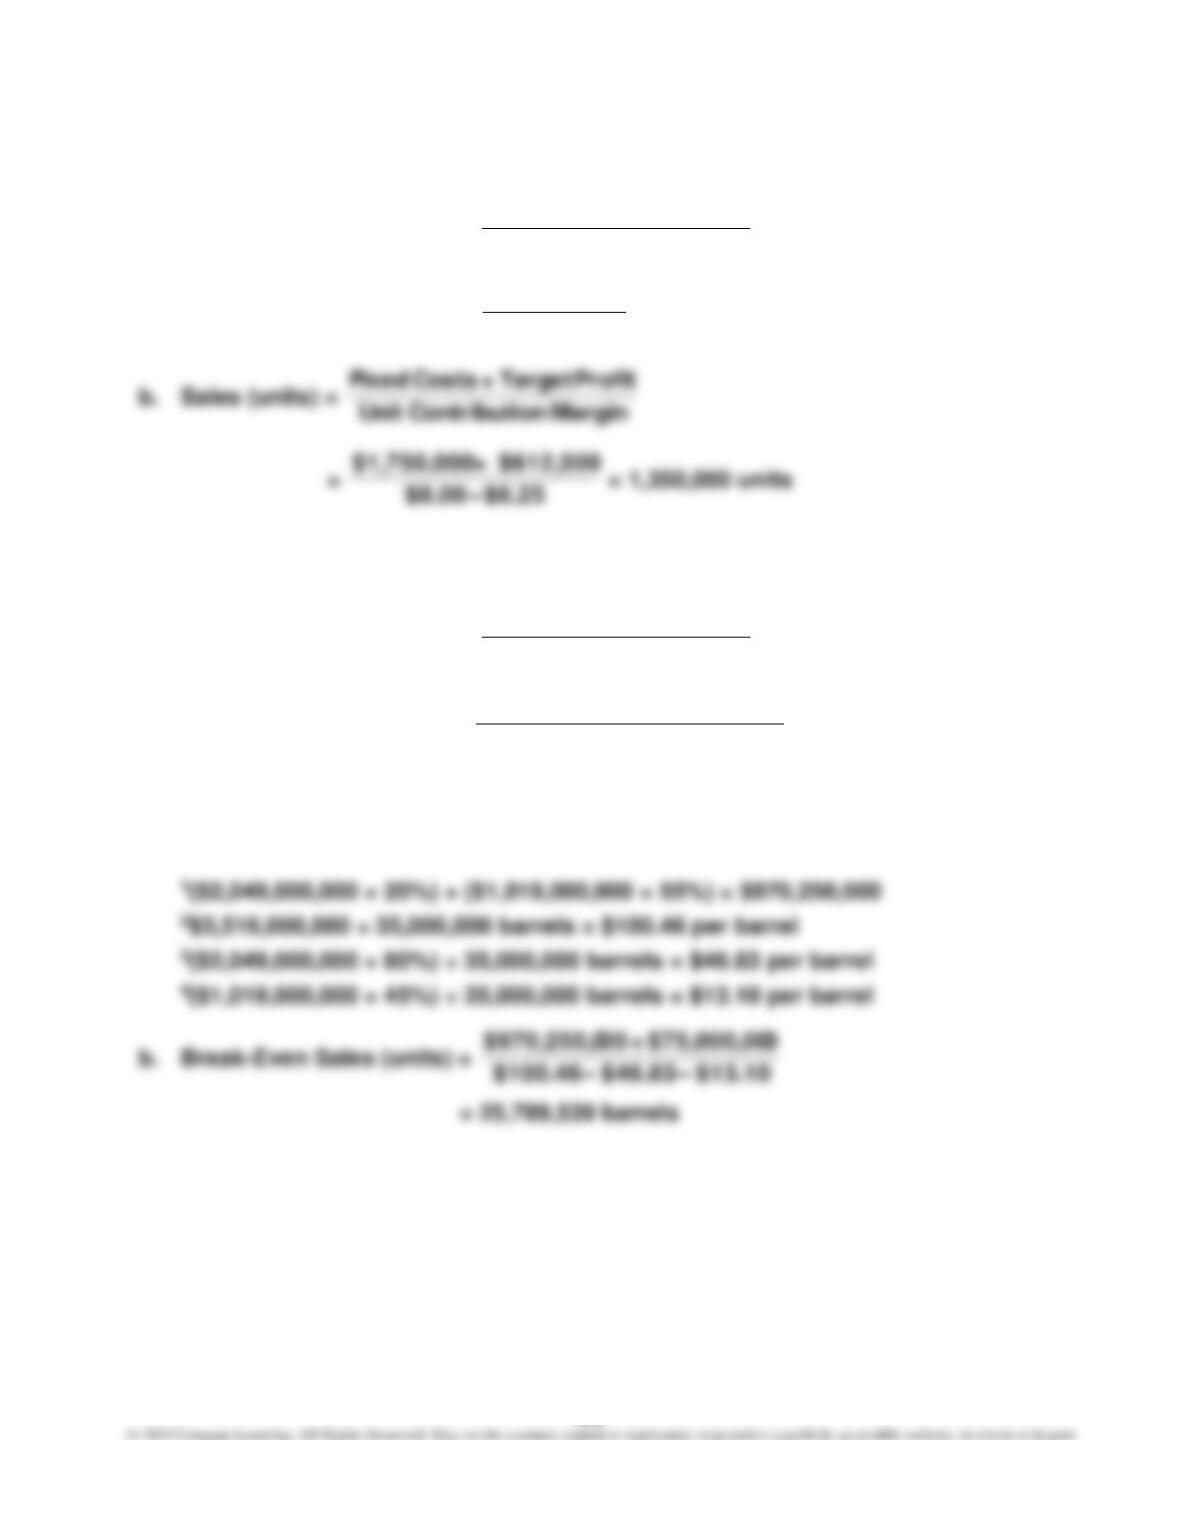
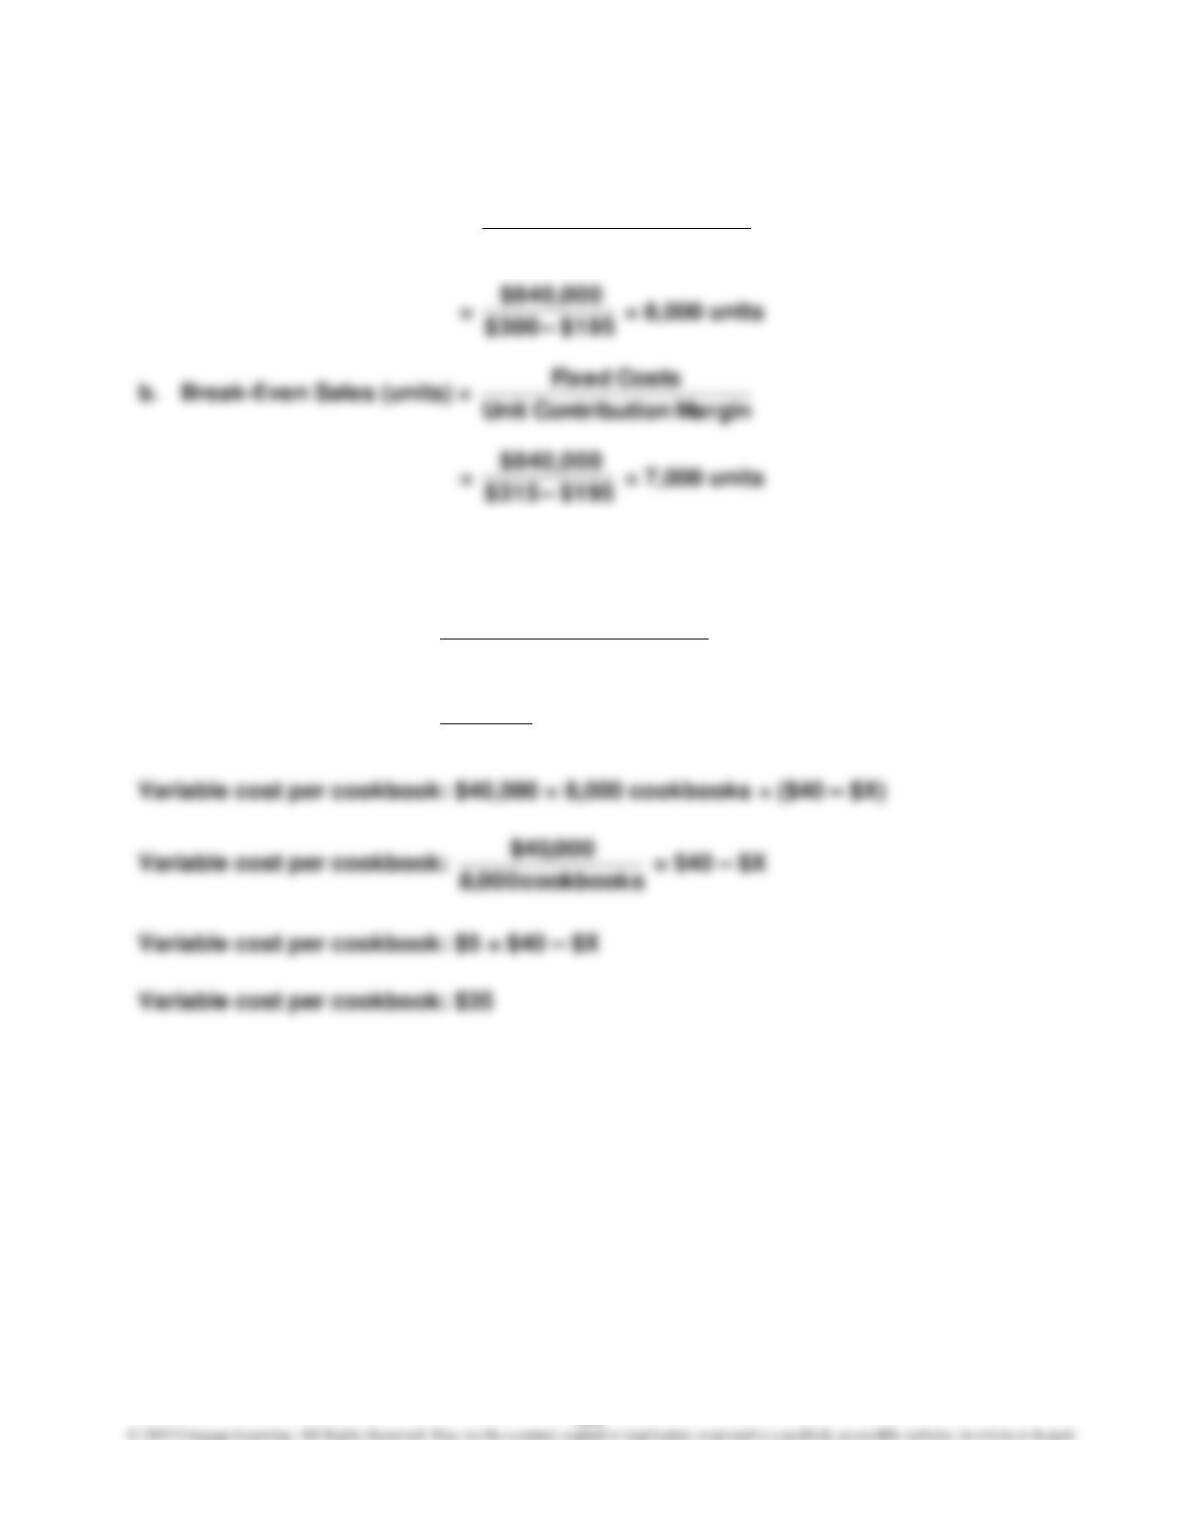
a. Break-Even Sales (units) =
Margin onContributiUnit
Costs Fixed
=
$6.25 –– $8.00
$1,750,000
= 1,000,000 units
E11–12
a. Break-Even Sales (units) =
Margin onContributiUnit
Costs Fixed
=
432
1
$13.10 –– $46.83 –– $100.46
00$970,250,0
= 23,939,057 barrels
The variable costs per unit are determined by multiplying the total amount of
each cost by the variable cost percentage (80% for production costs and 45%
for marketing and distribution costs), then dividing by the number of barrels.
339
E11–13
a. Break-Even Sales (units) =
arginM onContributiUnit
Costs Fixed
arginM onContributiUnit
Costs Fixed
E11–14
Break-Even Sales (units) =
arginM onContributiUnit
Costs Fixed
=
$X –– 40$
000,40$
= 8,000 cookbooks
340
E11–15
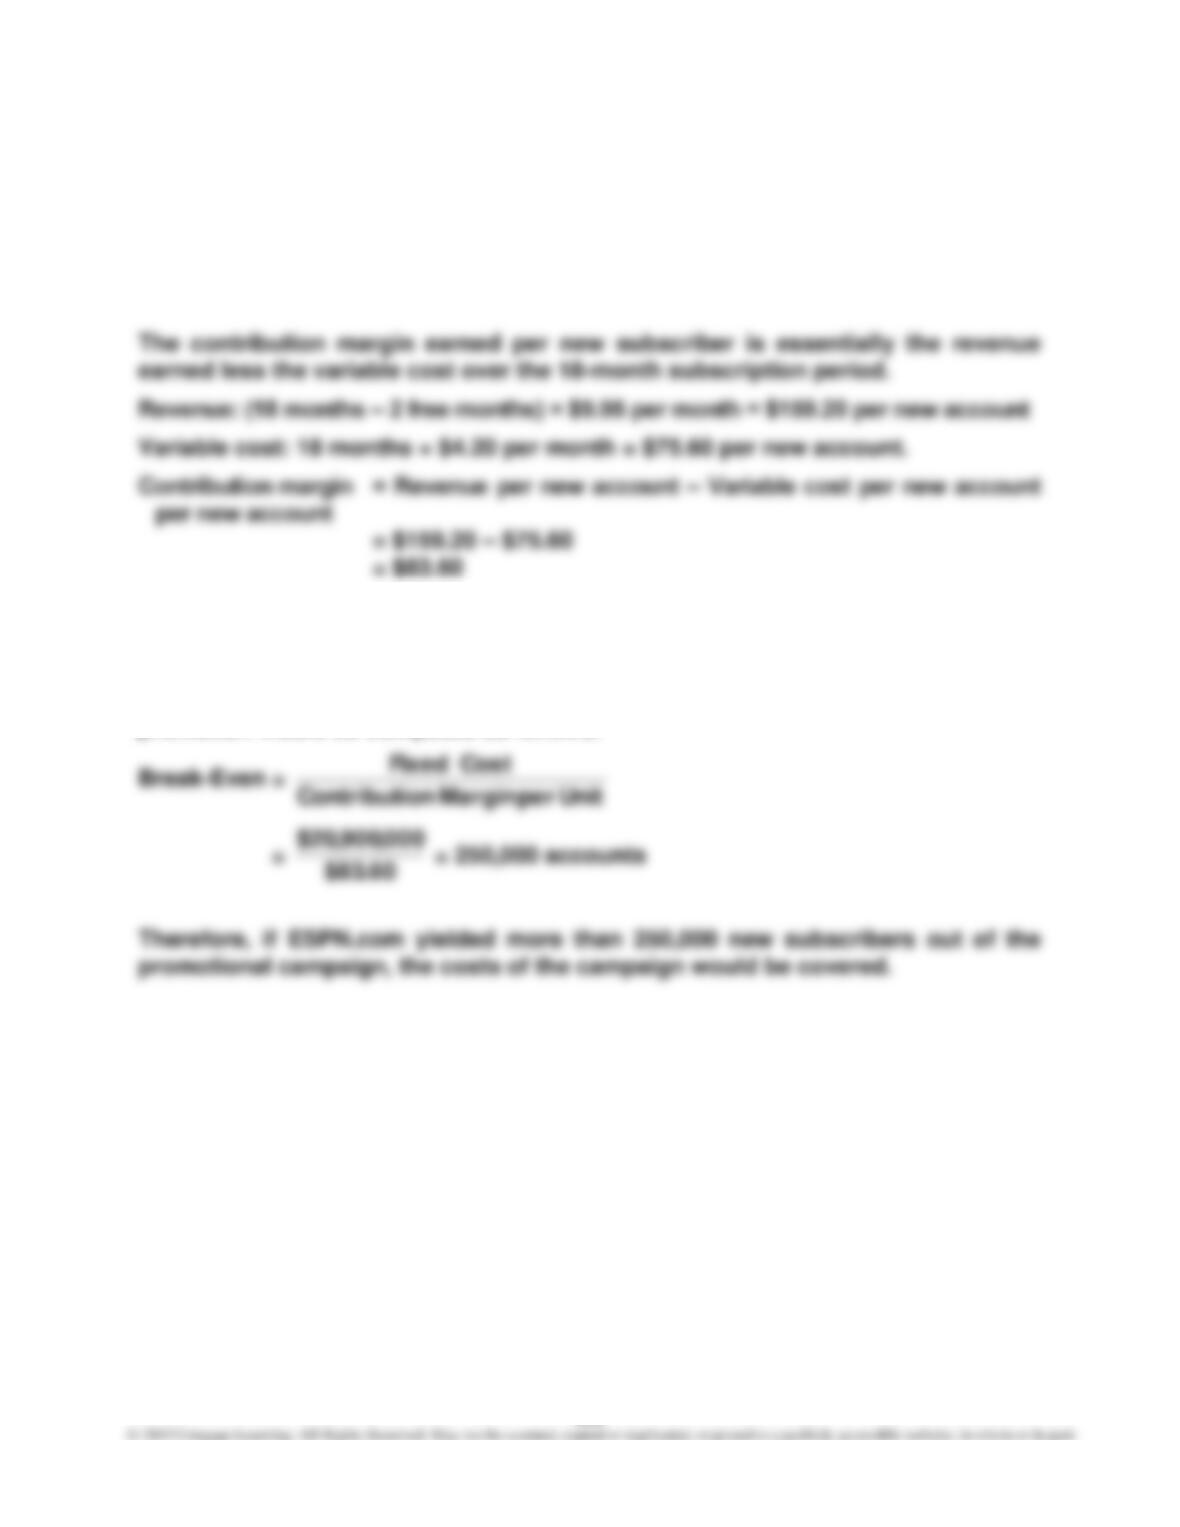
The cost of the promotion campaign is the fixed cost in this analysis, since we’re
trying to determine the break-even adoption rate of the campaign.
Promotional cost = $20,900,000
Note: The variable cost is for 18 months since the costs are incurred, even for the
2 free months.
The break-even number of subscribers necessary to cover the fixed cost of the
promotion would be computed as follows:
341
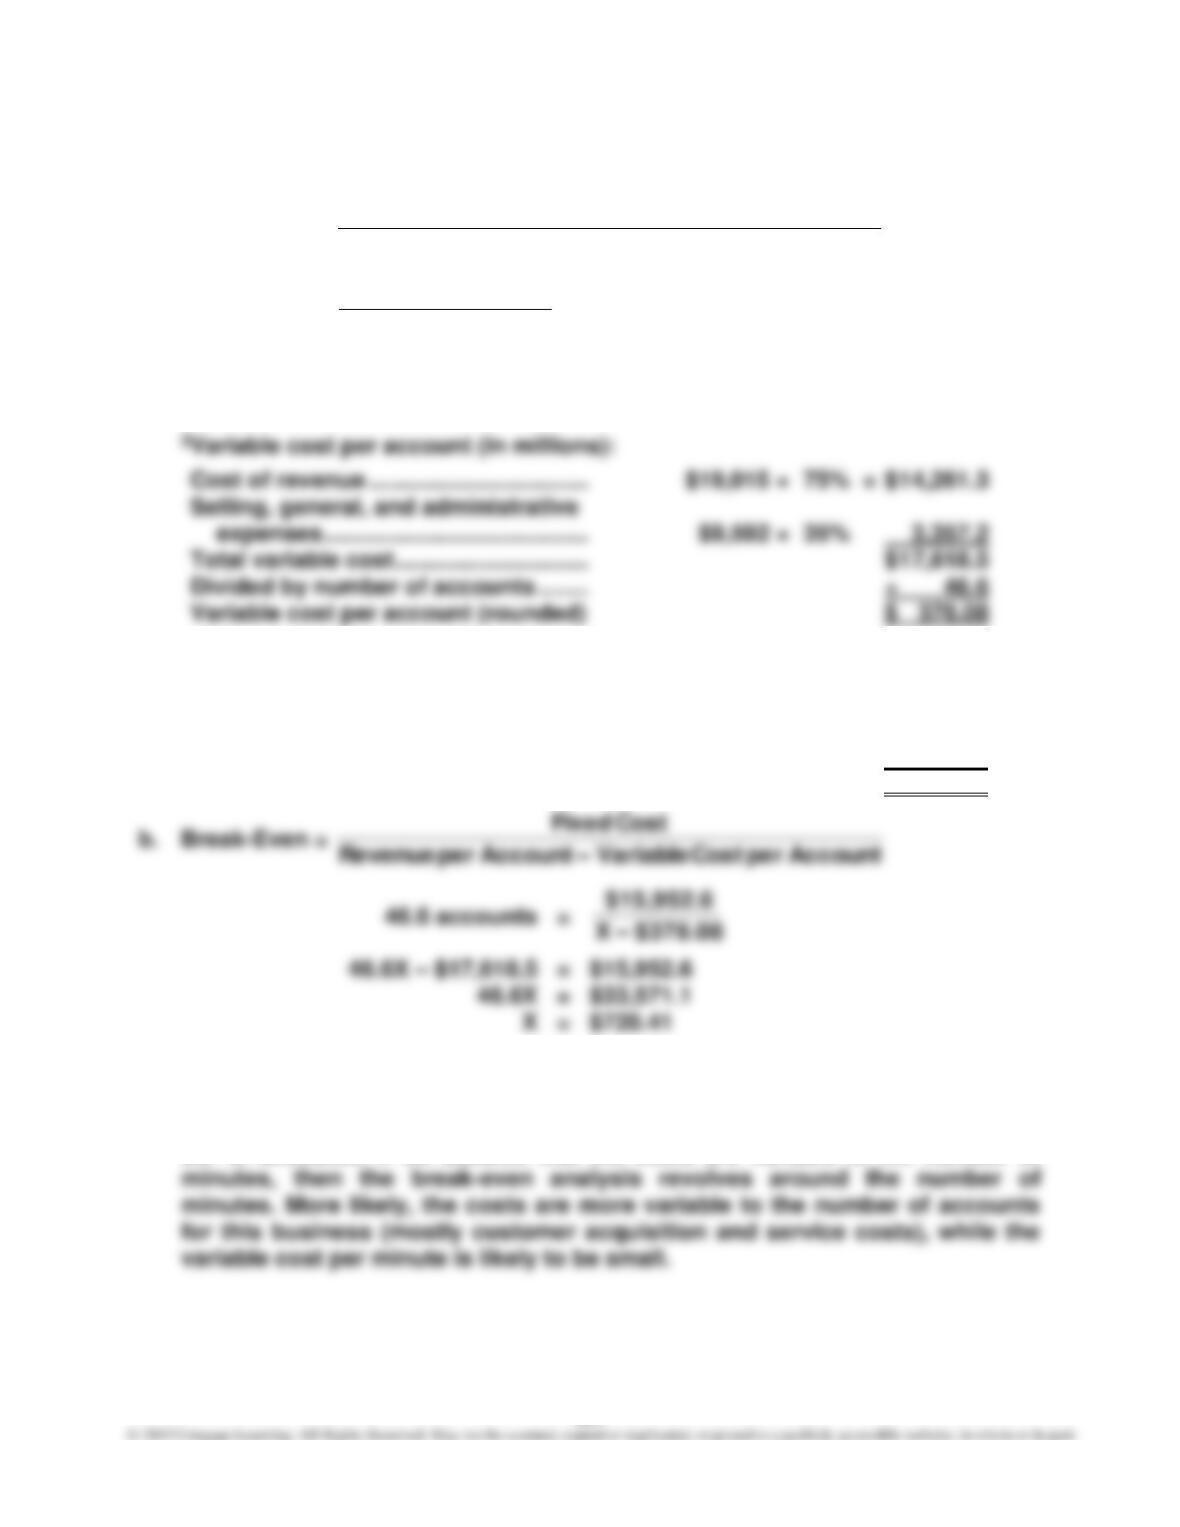
E11–16
a. Break-Even =
Accountper Cost Variable–– Accountper Revenue
Cost Fixed
=
21
3
$378.08 –– $722.73
$15,952.6
= 46.3 million (rounded) accounts
1Revenue per account (in millions):
$33,679 ÷ 46.6 = $722.73
3Fixed costs (in millions):
Cost of revenue ……………………………. $19,015 × 25% $ 4,753.8
Selling, general, and administrative
expenses ………………………………….. $9,592 × 65% 6,234.8
Depreciation ………………………………… $4,964 × 100% 4,964.0
Total fixed costs …………………………... $ 15,952.6
Accountper Cost Variable–– Accountper Revenue
Cost Fixed
Note to Instructors: The rate charged per minute and the number of average
minutes of digital service influence the revenue per account. An interesting
question is whether the costs are variable to the number of minutes or num-
ber of accounts. If we assume that the costs are variable to the number of
342
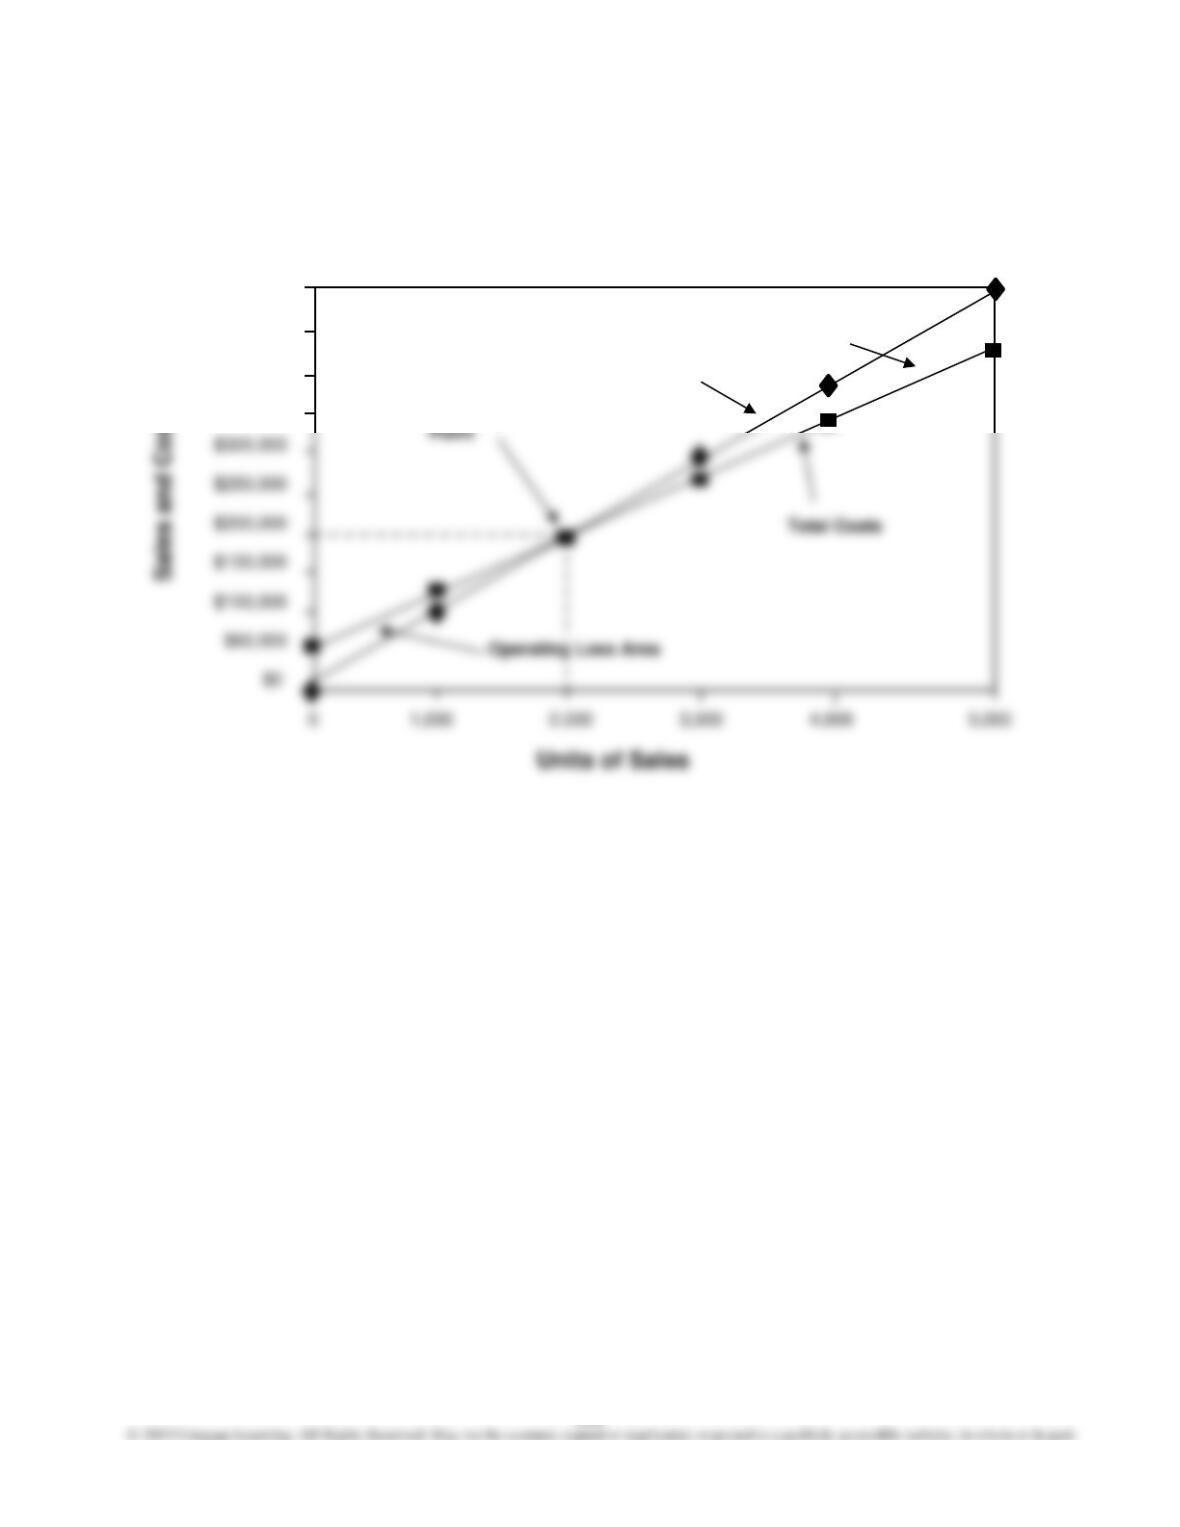
E11–17
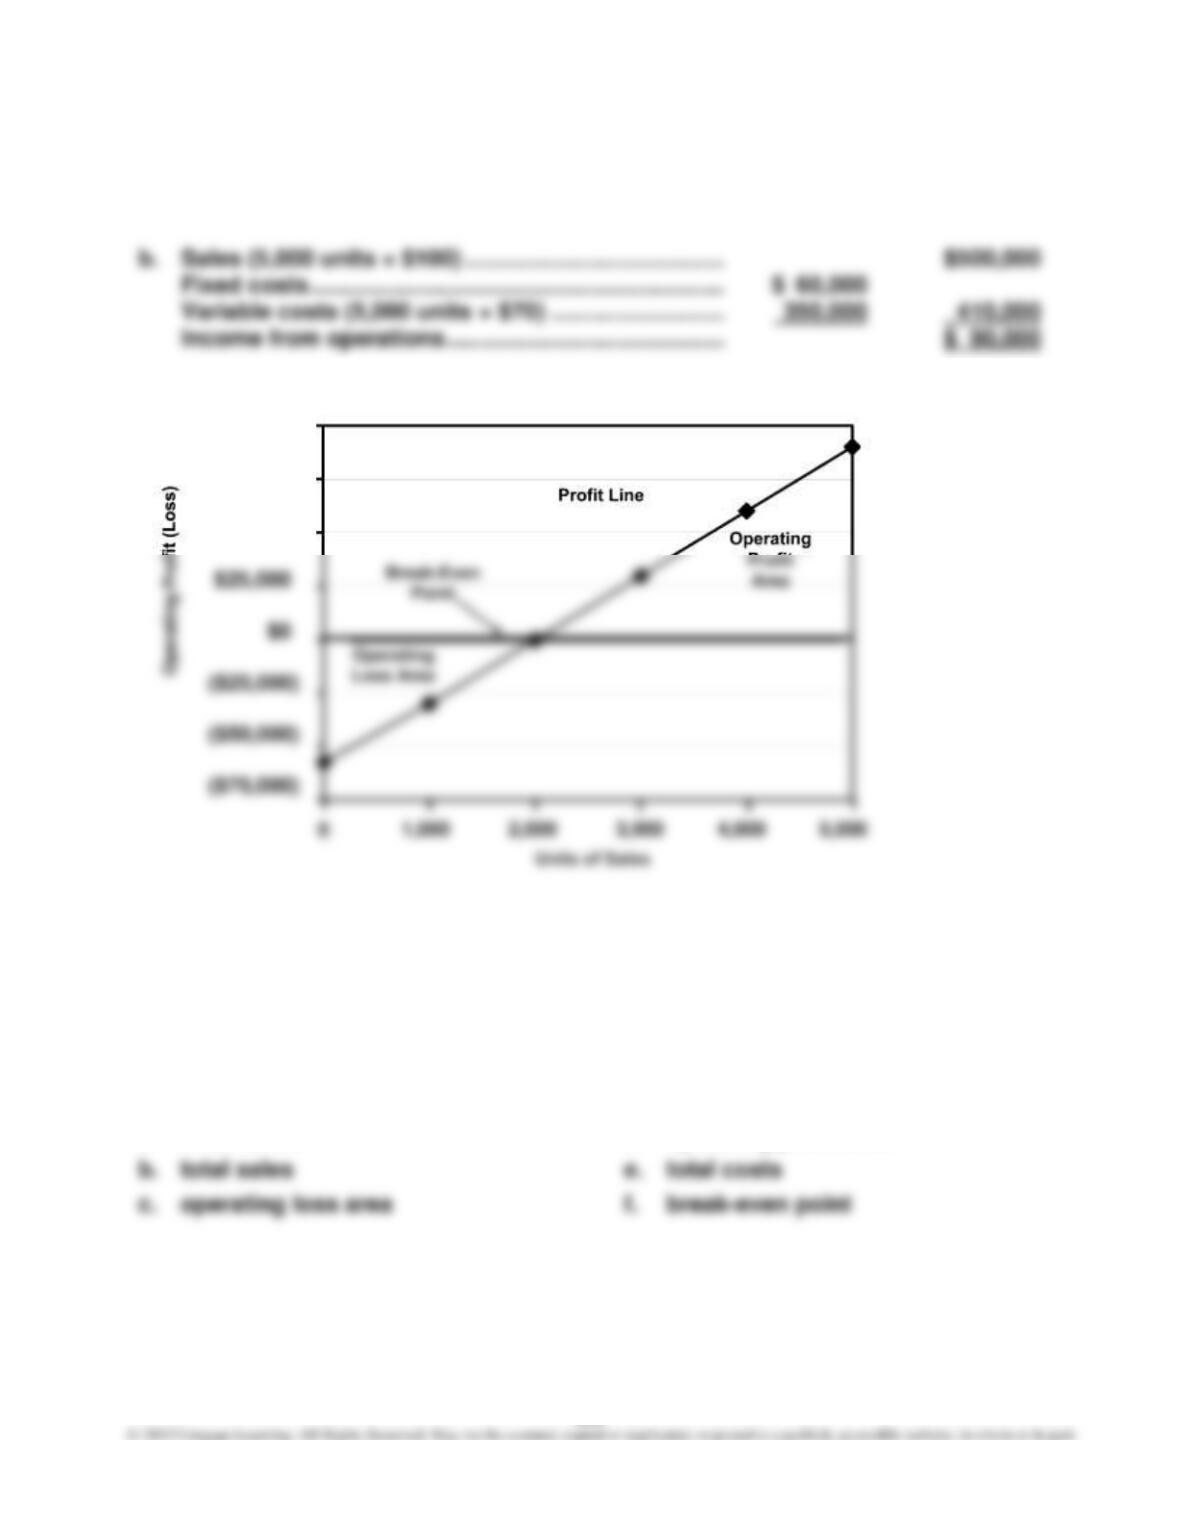
a.
b. $200,000 (the intersection of the total sales line and the total costs line)
c. The graphic format permits the user (management) to visually determine the
break-even point and the operating profit or loss for any given level of sales.
$500,000
$450,000
$400,000
$350,000
Break-Even
Total
Sales
Operating
Profit Area
343
E11–18
a. $60,000 (total fixed costs)
c.
d. 2,000 units (the intersection of the profit line and the horizontal axis)
E11–19
Cost-volume-profit chart
a. fixed costs
d. operating profit area
$100,000
$75,000
$50,000
344
E11–20
Profit-volume chart
a. fixed costs
b. operating profit area
E11–21
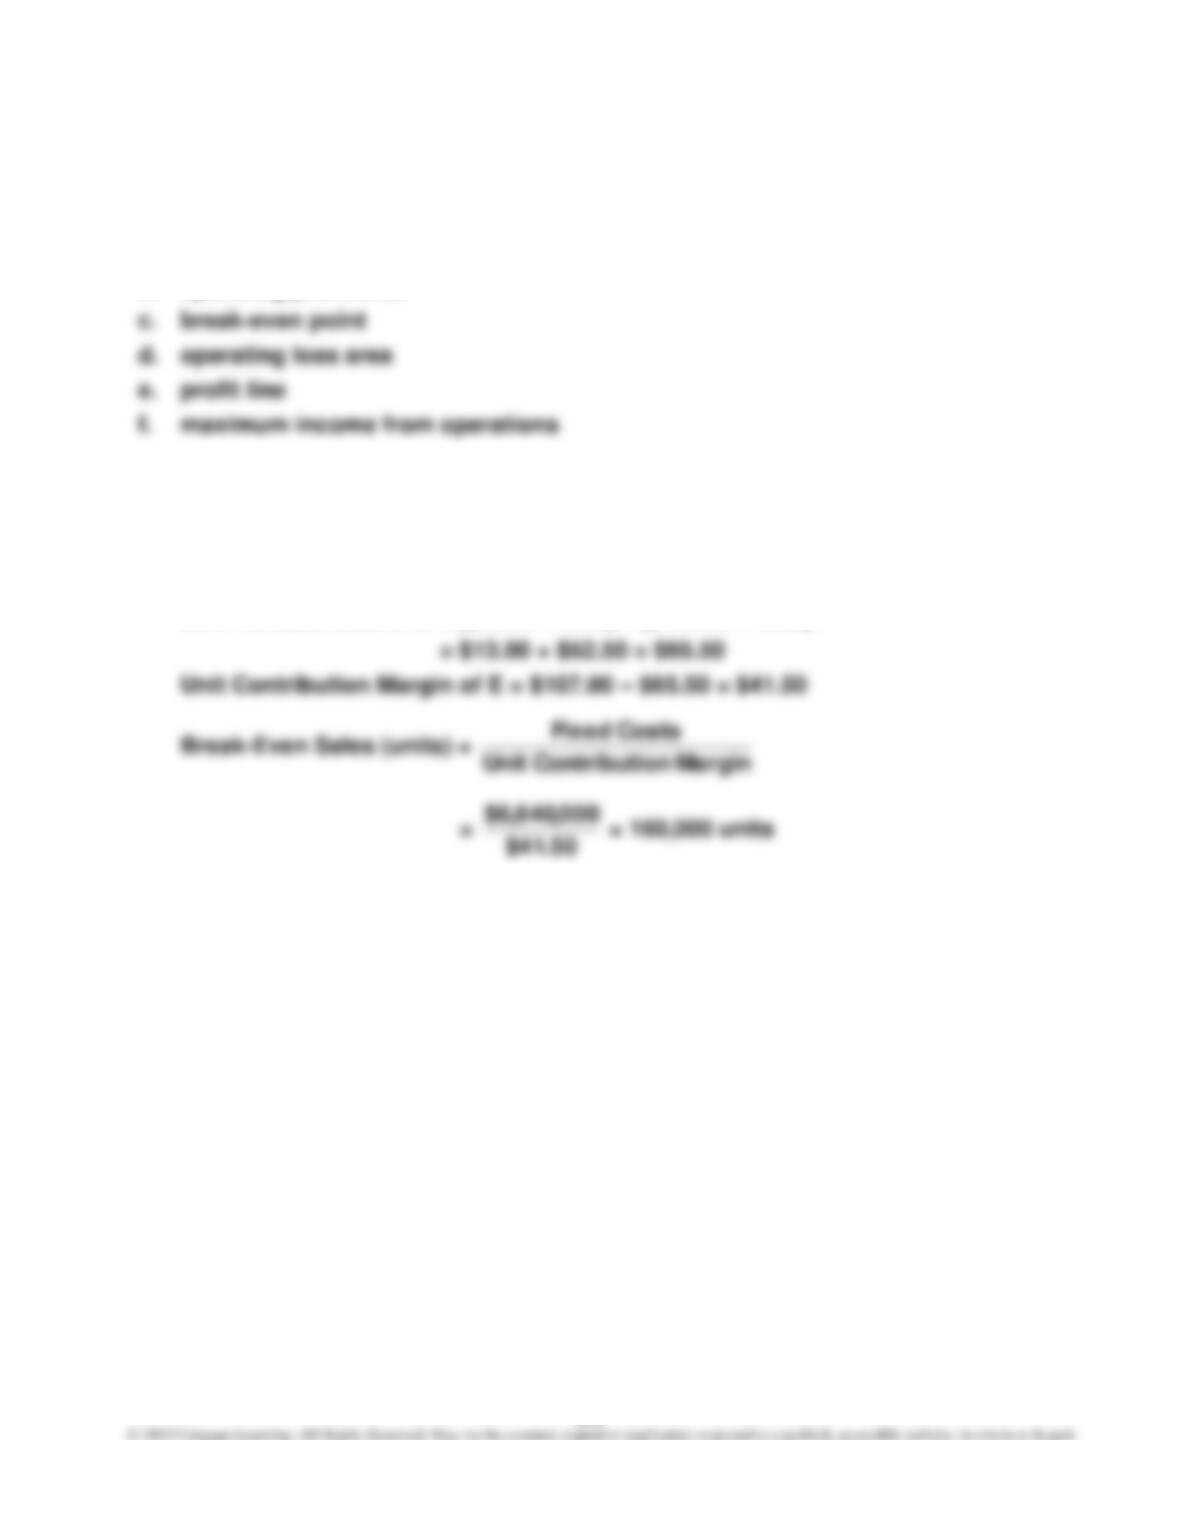
a. Unit Selling Price of E = ($30.00 × 0.65) + ($250.00 × 0.35)
= $19.50 + $87.50 = $107.00
Unit Variable Cost of E = ($20.00 × 0.65) + ($150.00 × 0.35)
b. 104,000 game players (160,000 units × 0.65)
56,000 tablets (160,000 units × 0.35)
E11–22
a. Unit contribution margin of overall product (E):
Unit selling price of E [(10% × $750) + (90% × $300)] ………………….. $345
Unit variable cost of E [(10% × $50) + (90% × $20)] …………………….. 23
Unit contribution margin of E ……………………………………………………. $322
E11–23
a. (1) $875,000 ($4,375,000 – $3,500,000)
(2) 20% ($875,000 ÷ $4,375,000)
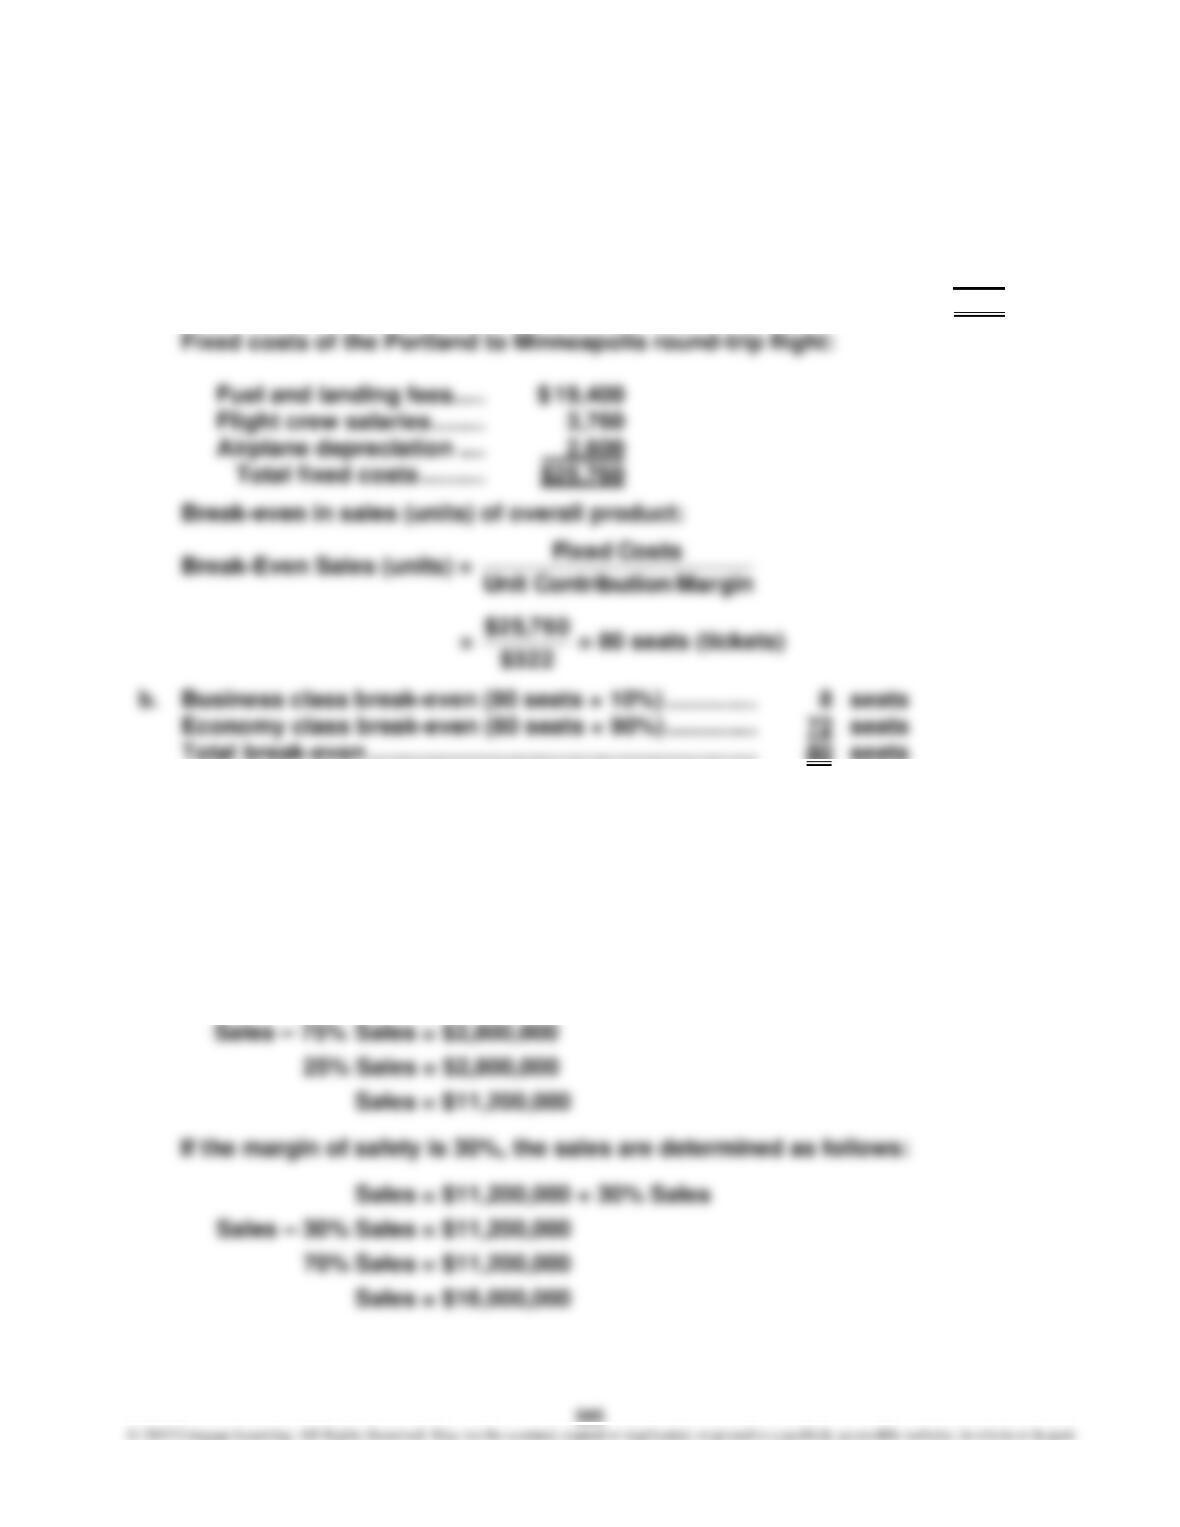
b. The break-even point (S) is determined as follows:
Sales = $2,800,000 + 75% Sales
346
E11–24
If 190,000 units were sold and sales at the break-even point are 215,000 units,
there is no margin of safety.
E11–25
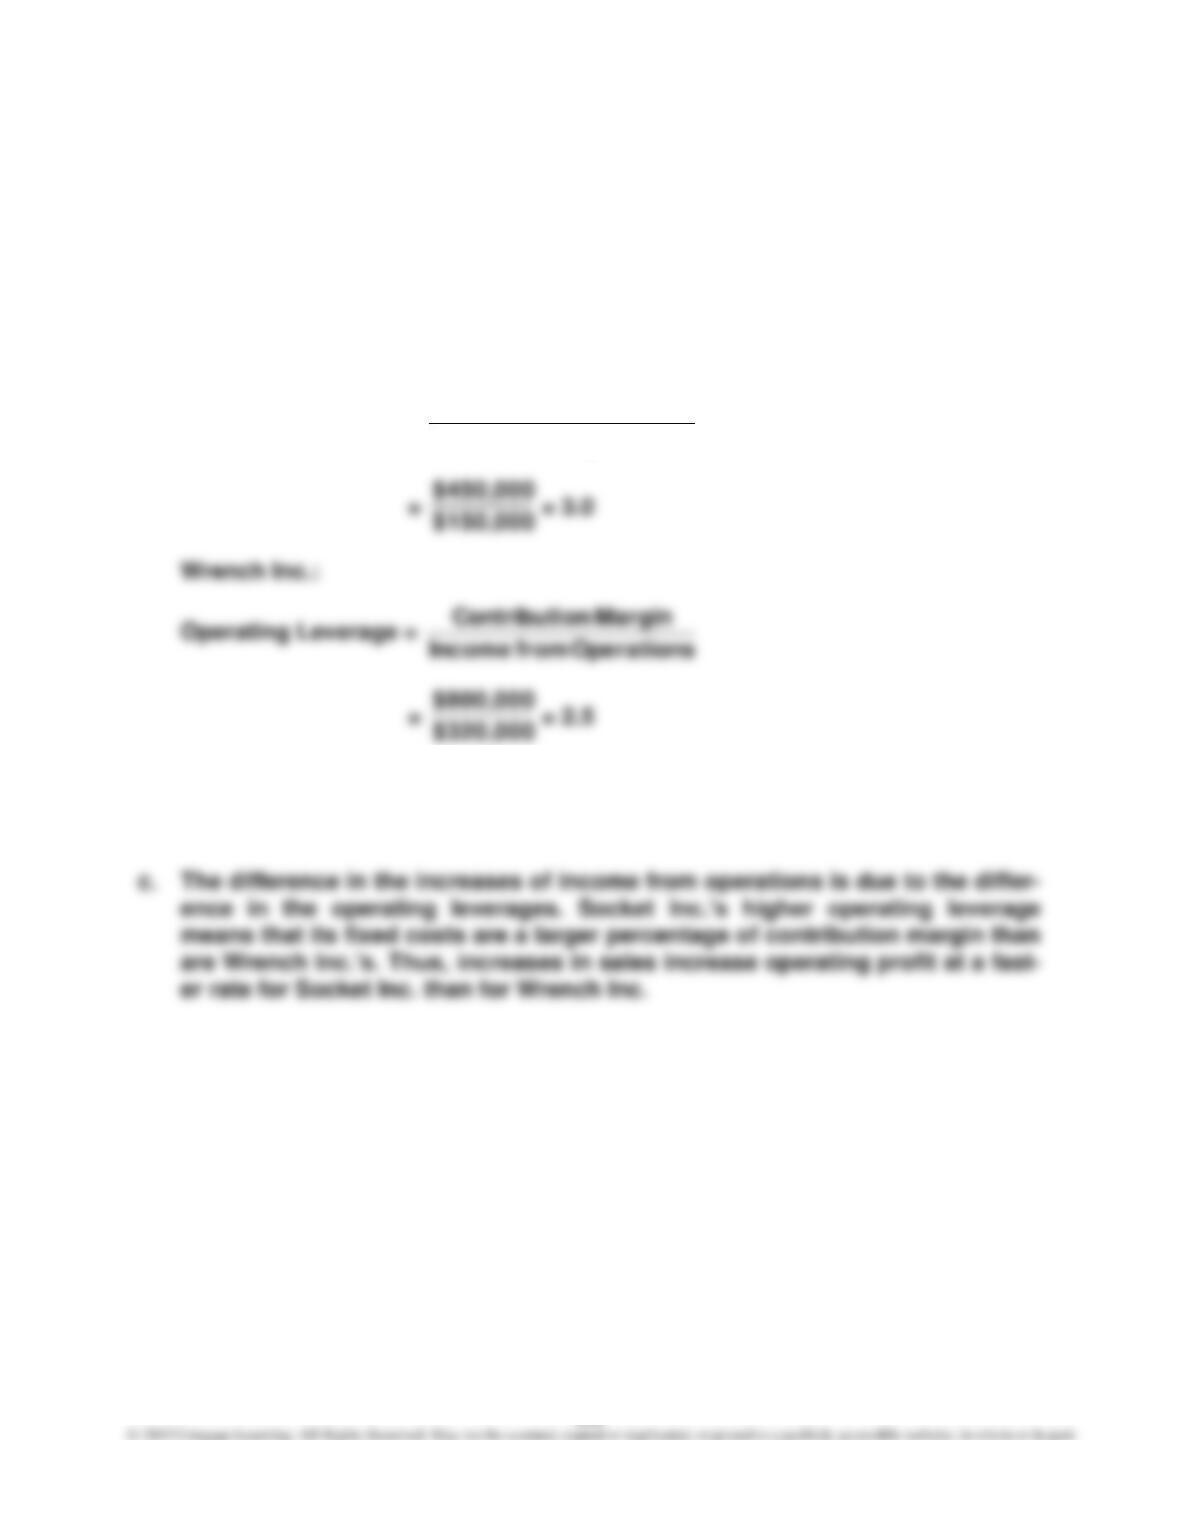
a. Socket Inc.:
Operating Leverage =
Operations from Income
Margin onContributi
Operations from Income
Margin onContributi
b. Socket Inc.’s income from operations would increase by 90% (3.0 × 30%), or
$135,000 (90% × $150,000), and Wrench Inc.’s income from operations would
increase by 75% (2.5 × 30%), or $240,000 (75% × $320,000).