
CHAPTER 11
STRATEGIC COST MANAGEMENT
DISCUSSION QUESTIONS
1. A competitive advantage is providing better
customer value for the same or lower cost or
equivalent value for lower cost. The cost
management system must provide infor-
mation that helps identify strategies that will
create a cost leadership position.
2. Customer value is the difference between
what a customer receives and what the
customer gives up (customer realization less
customer sacrifice). Cost leadership focuses
on minimizing customer sacrifice. A differen-
tiation strategy, on the other hand, focuses
on increasing customer realization, with the
goal of ensuring that the value added ex-
ceeds the costs of providing the differentia-
tion. Focusing selects the customers to
which value is to be delivered. Strategic
positioning is the choice of the mix of cost
leadership, differentiation, and focusing that
a company will emphasize.
3. External linkages describe the relationship
between a firm’s value chain and the value
chain of its suppliers and customers. Internal
linkages are relationships among the
activities within a firm’s value chain.
4. Organizational activities are activities that
determine the structure and business pro-
cesses of an organization. Operational activ-
ities are the day-to-day activities that result
from the structure and processes chosen by
an organization. Organizational cost drivers
are the structural and procedural factors that
determine a firm’s long–term cost structure.
Operational cost drivers are the factors that
drive the cost of the day-to-day activities.
5. A structural cost driver is a factor that drives
costs associated with the organization’s
structure, such as scale and scope factors.
Examples include number of plants and
management style. Executional cost drivers
are factors that determine the cost of activi-
ties related to a firm’s ability to execute
successfully. Examples include degree of
employee participation and plant layout
efficiency.
6. Value-chain analysis involves identifying
those internal and external linkages that
result in a firm achieving either a cost lead-
ership or differentiation strategy. Managing
organizational and operational cost drivers
to create long-term cost reductions is a key
element in the analysis. Value-chain analy-
sis is a form of strategic cost management.
It shares the same goal of creating a long–
term competitive advantage by using cost in-
formation.
7. An industrial value chain is the linked set of
value-creating activities from basic raw
materials to end-use customers. Knowing an
activity’s relative position in the value chain
is vital for strategic analysis. For example,
knowing the relative economic position in
the industrial chain may reveal a need to
backward or forward integrate in the chain.
A total quality control strategy also reveals
the importance of external linkages.
Suppliers, for example, create parts that are
used in products downstream in the value
chain. Producing defect-free parts depends
strongly on the quality of parts provided by
suppliers.
8. The three viewpoints of product life cycle are
the marketing viewpoint, the production
viewpoint, and the consumption viewpoint.
They differ by the nature of the stages and
the nature of the entity’s life being defined.
The marketing viewpoint has a revenue-
oriented viewpoint, the production viewpoint
is expense oriented, and the consumption
viewpoint is customer value oriented.
9. The four stages of the marketing life cycle
are introduction, growth, maturity, and de-
cline. The stages relate to the sales function
over the life of the product. The introduction
stage is slow growth, the growth stage is
rapid growth, the maturity stage is growth
but at a decreasing rate, and the decline
stage is characterized by decreasing sales.
10. Life-cycle costs are all costs associated with
the product for its entire life cycle. These
costs correspond to the costs of the activities
associated with the production life cycle: re-
search and development, production, and lo-
gistics.

11. The four stages of the consumption life cycle
are purchasing, operating, maintaining, and
disposal. Post-purchase costs are those
costs associated with operating, maintain-
ing, and disposing of a product. Knowing
these costs is important because a producer
can create a competitive advantage by offer-
ing products with lower post-purchase costs
than products offered by competitors.
12. Agree. According to evidence, ninety percent
of a product’s costs are committed during the
development stage. Furthermore, $1 spent
during this stage on preproduction activities
can save $8–$10 on production and postpro-
duction activities. Clearly, the time to manage
activities is during the development stage.
13. Target costing is the setting of a cost goal
needed to capture a given market share and
earn a certain level of profits. Actions are
then taken to achieve this goal—usually by
seeking ways to reduce costs to the point
where the plan becomes feasible (often by
seeking better product designs). This is con-
sistent with the cost reduction emphasis
found in life-cycle cost management.
14. Cells act as a “factory within a factory.” Each
cell is dedicated to the production of a single
product or subassembly. Costs associated
with the cell belong to the cell’s output. By
decentralizing services and redeploying
equipment and employees to the cell level,
the quantity of directly attributable costs in-
creases dramatically.
15. Backflush costing is a simplified approach to
accounting for manufacturing cost flows. It
uses trigger points to determine when costs
are assigned to inventory or temporary
accounts. In the purest form, the only trigger
point is when the goods are sold. In this var-
iation, the manufacturing costs are flushed
out of the system by debiting Cost of Goods
Sold and crediting Accounts Payable and
Conversion Cost Control. Other trigger
points are possible but entail more journal
entry activity and involve some inventory ac-
counts.
CORNERSTONE EXERCISES
Cornerstone Exercise 11.1
1. Material usage cost reduction
192,000($20 – $16) ………………………………….. $ 768,000
Labor usage cost reduction
3. Since each purchasing agent can process 5,000 orders, only two agents are
needed, saving an additional $45,000 of salary costs. Variable purchasing
Cornerstone Exercise 11.2
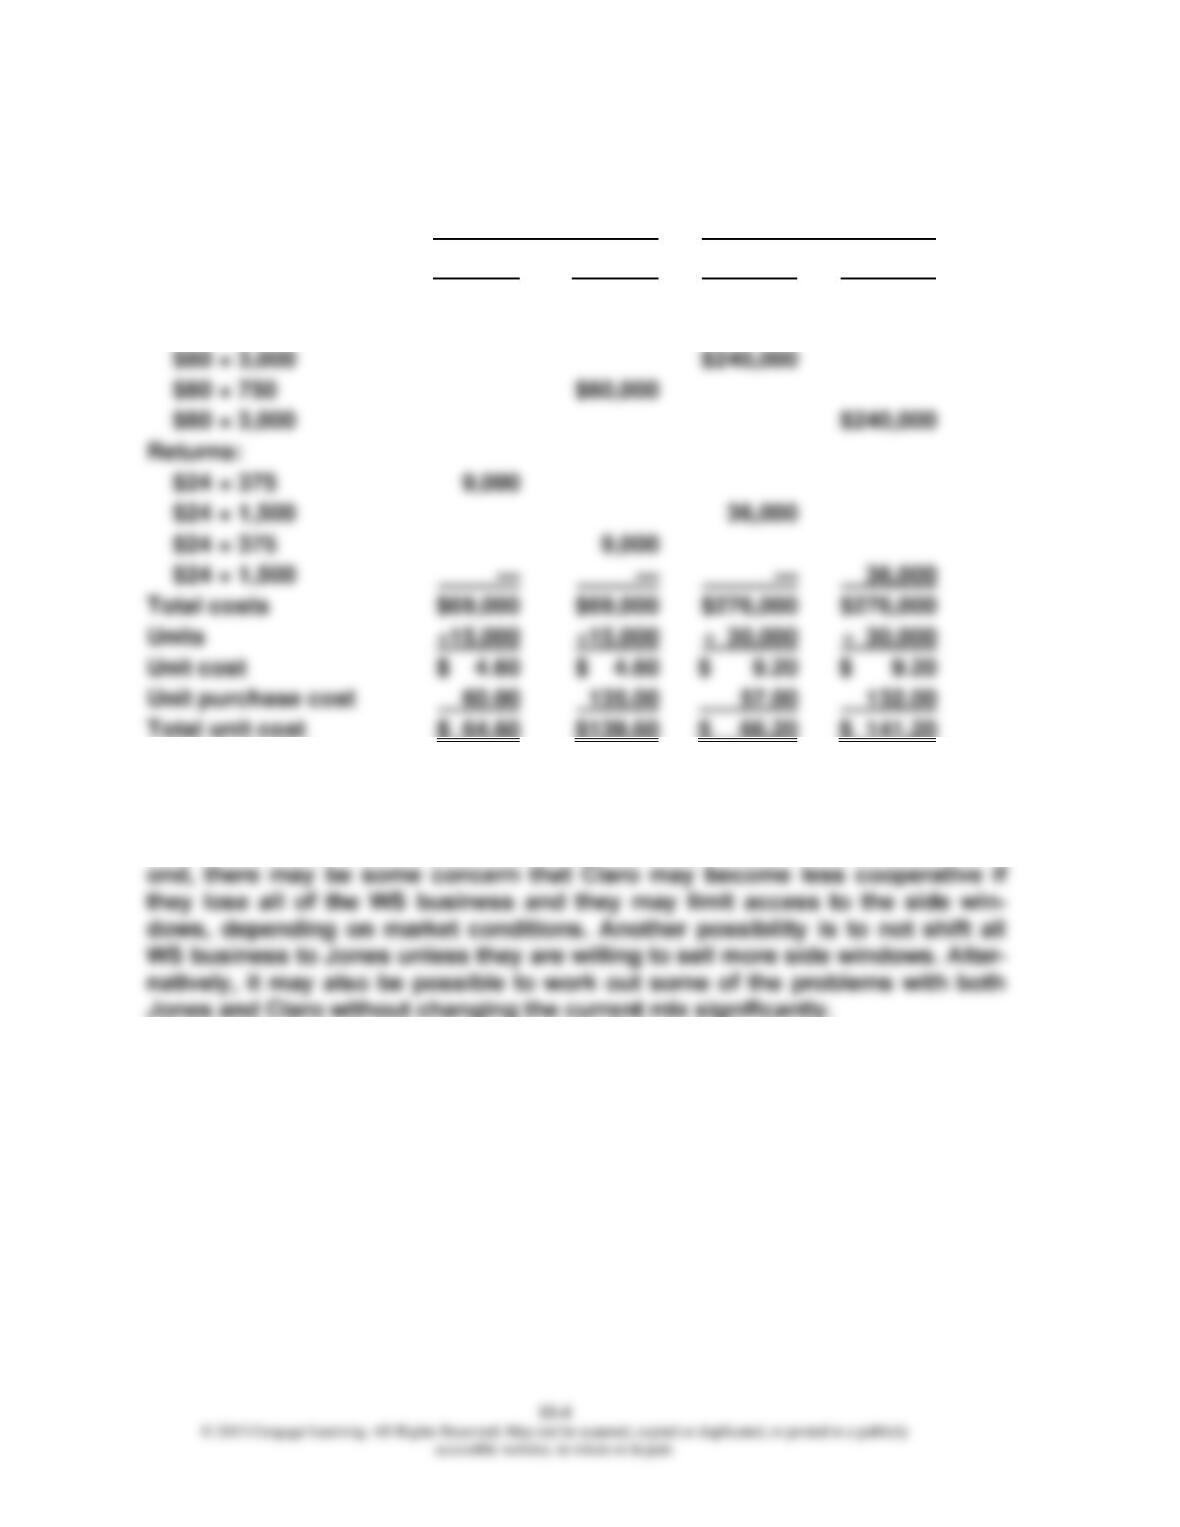
1. Adverse buying rate = $600,000/7,500* = $80 per adverse purchase
Cornerstone Exercise 11.2 (Concluded)
2.
22. Jones Glass Claro Glass
Side WS Side WS
Adverse purchases:
$80 × 750 $60,000
3. Based on lowest cost: Side Windows: 15,000 from Jones and 30,000 from Cla-
ro; WS: 45,000 from Jones and 0 from Claro. First, the better (low-cost) supplier
is Jones and yet it is not possible to buy more side windows from them. Sec-
Cornerstone Exercise 11.3
1. Ordering cost allocation for each customer category:
(350,000/700,000*) × $2,715,000 = $1,357,500
2. Order cost allocation for each customer category:
Frequently ordering: (35,000/38,500) × $2,715,000 = $2,468,182*
Less frequently ordering: (3,500/38,500) × $2,715,000 = $246,818*
3. Orders for 35 units = 350,000/35 = 10,000 (frequent order category)
Total orders = 10,000 + 3,500 = 13,500
Capacity (number of clerks or steps) = 13,500/1,000 = 13.5 = 14 steps
Cornerstone Exercise 11.4
1.
Design A Design B
Direct materialsa …………………………………. $ 6,000,000 $ 5,500,000
2.
Design A Design B
Direct materials ………………………………….. $ 6,000,000 $ 5,500,000
Direct labora ……………………………………….. 750,000 1,800,000
Machininga …………………………………………. 3,750,000 4,500,000
Purchasinga ……………………………………….. 300,000 225,000
3. The post-purchase cost is $250,000 ($10 × 25,000) for A and $1,000,000 for B
($40 × 25,000). Although this cost is not paid for by the firm, it makes the total
Cornerstone Exercise 11.5
1.
Transaction Traditional Journal Entries
1. Purchase of Materials Inventory ……………… 600,000
raw materials Accounts Payable …………… 600,000
2. Materials Work-in-Process Inventory ….. 600,000
issued to Materials Inventory …………. 600,000
production
Transaction Backflush Journal Entries: Variation 1
1. Purchase of Raw Materials
raw materials and In Process Inventory …… 600,000
Accounts Payable …………… 600,000
2. Materials
issued to No entry
production
Cornerstone Exercise 11.5 (Concluded)
Transaction Backflush Journal Entries: Variation 1
7. Goods are Cost of Goods Sold ……………… 1,275,000
sold Finished Goods Inventory .. 1,275,000
2. Entries 6 and 7 in Requirement 1 are replaced with the following entry:
3. (a) No entry for Transaction 1; Transaction 6 is replaced with the following
entry:
Finished Goods Inventory ……………………… 1,275,000
EXERCISES
Exercise 11.6
1. The total product consists of all tangible and intangible benefits. These in-
2. The Brand A company is pursuing a cost leadership strategy. It emphasizes
lower post-purchase costs for the same product, features, and reputation
3. Apparently, the post-purchase service component is worth more than the
$400 difference in post-purchase costs. All other product attributes are the
Exercise 11.7
1. The bank’s strategic position is defined by elements of all three general strat-
egies. Broadening the market and selecting customer segments are focusing
2. Cost management was useful in identifying the profitable customer segments
that were chosen to be emphasized. A key role for strategic cost management
is the identification of sources of profitability. The ABC customer profitability
Exercise 11.8
a. Structural
b. Operational
k. Executional
l. Operational
Exercise 11.9
Inspecting products, reworking products, and warranty work: These are all
quality-related activities. This suggests a strategic change in the organizational
activity, “providing quality,” (an executional activity). The associated executional
cost driver is quality approach. The cost of all three quality activities can be re-
Exercise 11.9 (Concluded)
Purchasing parts: This activity is driven by the number of different parts. This is a
driver that also relates to complexity, a structural activity. This suggests that re-
ducing complexity will reduce the number of different parts needed and the cost
Exercise 11.10
1. Supplier cost:
First, calculate the activity rates for assigning costs to suppliers:
Inspecting carburetors: $180,000/4,500 = $40 per sampling hour
Next, calculate the cost per component by supplier:
Supplier cost:
Harvey Curtis
Purchase cost:
$64 × 40,000 ……………………. $ 2,560,000
$57 × 120,000 ………………….. $ 6,840,000
Inspecting carburetors:
$40 × 90 ………………………….. 3,600
$40 × 4,410 ……………………… 176,400
*Rounded to the nearest cent.
The difference dramatically favors Harvey; furthermore, when the price con-
cession is considered, the difference is even greater, With the discount and
Exercise 11.10 (Concluded)
2. To assign the lost sales cost, it would be helpful to know the number of de-
fective units using the Harvey carburetor versus those using the Curtis car-
buretor. Warranty hours would act as a very good substitute driver. Using this
driver, the rate is $3,300,000/6,000 = $550 per warranty hour. The cost as-
signed to each component would be:
Harvey Curtis
Lost sales:
Exercise 11.11
1. Sales revenue = $1.05 × 44,100,000 = $46,305,000 for each customer type.
(Note: The total number of parts is the average order size times the number of
sales orders.) Thus, the total customer-related activity costs are split equally:
Exercise 11.11 (Concluded)
2. Activity-based customer costing:
First, calculate the activity rates for assigning costs to suppliers:
Processing sales orders: $2,310,000/23,100 = $100 per order
Scheduling production: $1,260,000/42,000 = $30 per scheduling hour
Next, assign the costs to the customers (those who place frequent orders and
those who place infrequent orders):
Frequent Infrequent
Processing sales orders:
$100 × 21,000 …………………….. $ 2,100,000
$100 × 2,100 ………………………. $ 210,000
Scheduling production:
Setting up equipment:
$120 × 26,250 …………………….. 3,150,000
$120 × 5,250 ………………………. 630,000
Inspecting batches:
Exercise 11.12
a. Marketing: Growth stage
b. Customer: Post-purchase costs
c. Marketing: Decline stage
d. Interactive: Production and customer viewpoints. The linkage between de-
Exercise 11.13
DA = Direct attribution (tracing)
DT = Driver tracing
AL = Allocation
Cost Item Before JIT After JIT
k. Depreciation on production equipment ………….. DT DA
l. Raw materials ……………………………………………….. DA DA
m. Salary of industrial engineer ………………………….. DT DAb
n. Parts for machinery ………………………………………. DT DA
o. Pencils and paper clips for production
Exercise 11.14
1. Maintenance cost per maintenance hour = $5,880,000/600,000
= $9.80 per maintenance hour
2. Wheels: $1,596,000/157,500 = $10.13* per unit
3. The JIT cost is more accurate because maintenance cost is directly traced to
Exercise 11.15
1. Materials Inventory ………………………………………. 243,000
Accounts Payable …………………………………… 243,000
Work-in-Process Inventory …………………………... 243,000
Exercise 11.15 (Concluded)
Finished Goods Inventory ……………………………. 506,250
Work-in-Process Inventory ……………………… 506,250
2. Raw Materials and In Process Inventory ……….. 243,000
Accounts Payable …………………………………… 243,000
Conversion Cost Control ……………………………… 243,000
Accounts Payable …………………………………… 202,250
Exercise 11.16
Raw Materials and In Process Inventory ……….. 243,000
Accounts Payable …………………………………… 243,000
Conversion Cost Control ……………………………… 243,000
Exercise 11.17
1. Conversion Cost Control …………………………..…. 243,000
Accounts Payable …………………………………… 202,500
Wages Payable ……………………………………….. 40,500
Exercise 11.17 (Concluded)
2. Conversion Cost Control ……………………………… 243,000
Accounts Payable …………………………………… 202,500
Wages Payable ………………………………………. 40,500
Exercise 11.18
1. Fabrication Assembly
Allocation ratio* …………………….. 0.25 0.75
Maintenance:
0.25 × $480,000 …………………. $ 120,000
0.75 × $480,000 …………………. $ 360,000
Direct overhead costs ……………. 720,000 204,000
Total …………………………………. $ 840,000 $ 564,000
*Allocation based on number of tests.