
11–36
Formatted: Normal1, Centered, Border: Top: (No border),
Tab stops: Not at 1″
Formatted: Font: 8 pt
Demonstration Problem 3
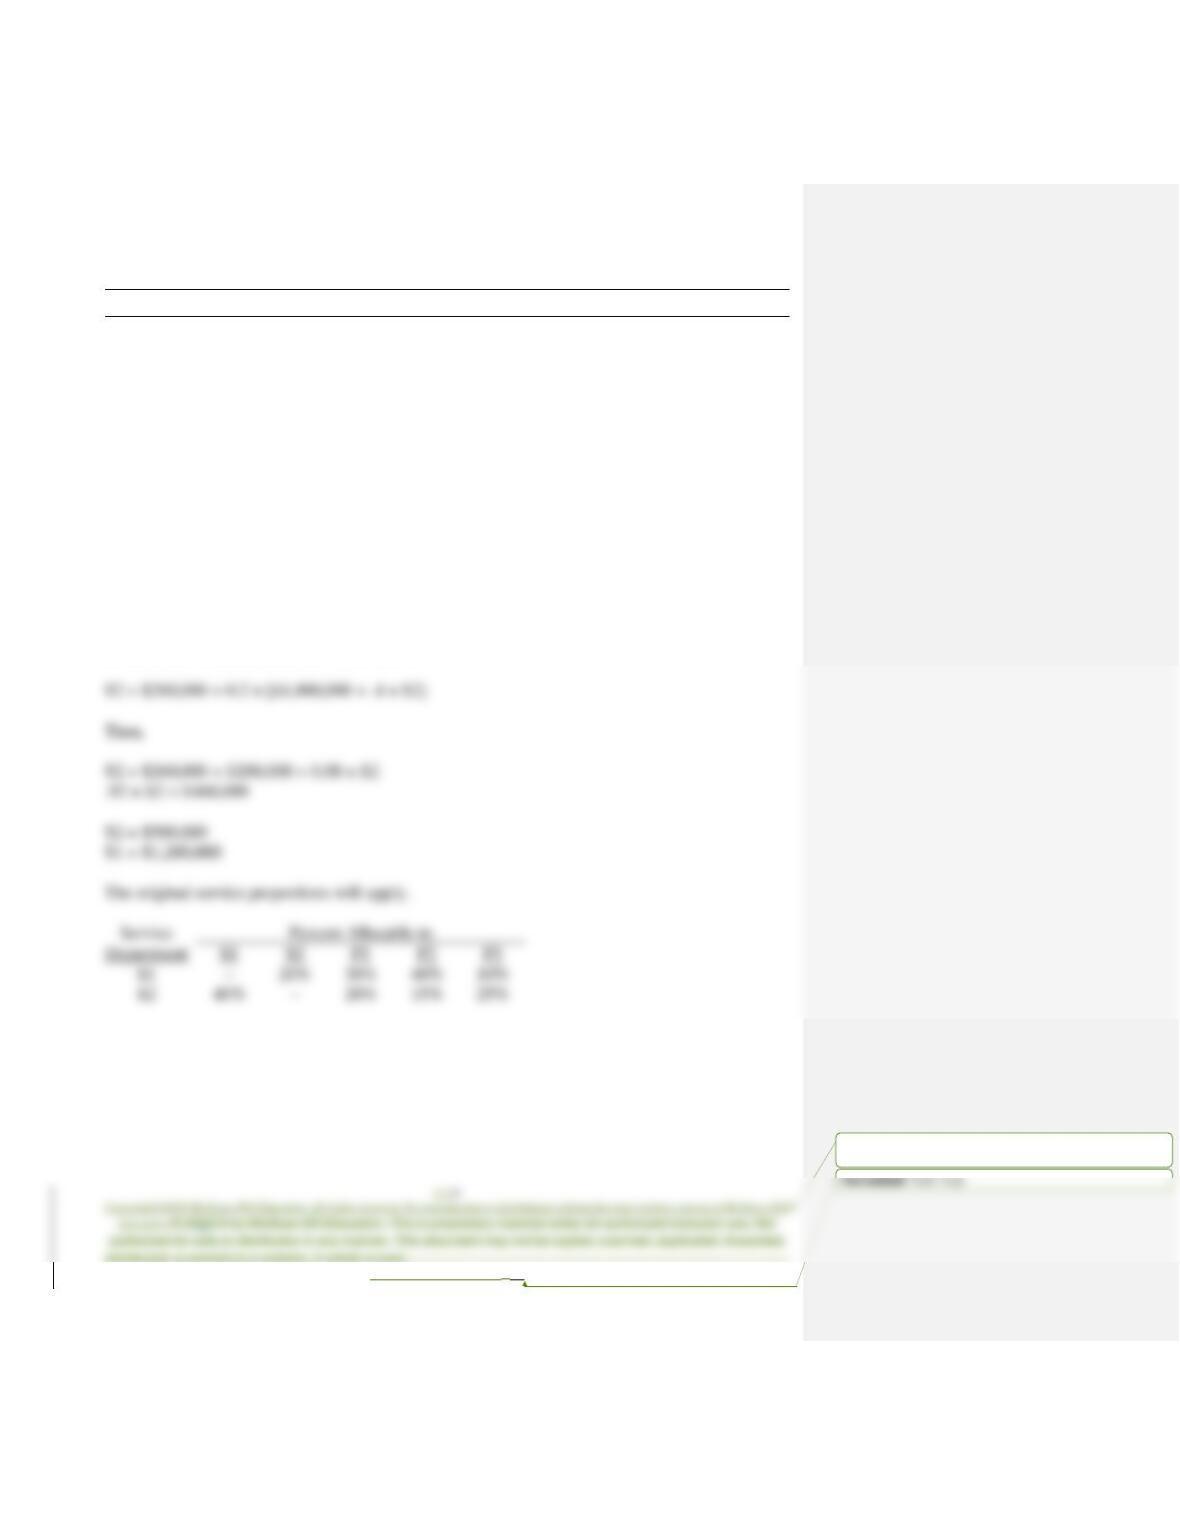
(Continued from Demonstration Problem 1; data were reproduced here.)
Kirby Industries has two service departments (S1 and S2) and three production departments (P1,
P2, and P3). The following table shows the costs incurred at the two service departments, as well
as the proportion of services provided by the two service departments to the other departments.
Costs
Incurred
Service
Department
Percent Allocable to
S1
S2
P1
P2
P3
$1,000,000
S1
–
20%
30%
40%
10%
260,000
S2
40%
–
20%
15%
25%
11–37
Formatted: Normal1, Centered, Border: Top: (No border),
Tab stops: Not at 1″
Demonstration Problem 3 – Solution
Define S1 and S2 to be the total service department costs for departments S1 and S2,
respectively.
The service department S1 incurred $1,000,000 for providing services to other departments. The
service department S2 provided 40 percent of its services to S1. Together, the total service
department costs for S1 can be expressed as:
S1 = $1,000,000 + 0.4 × S2
The service department S2 incurred $260,000 for providing services to other departments. The
service department S1 provided 20 percent of its services to S2. Together, the total service
department costs for S2 can be expressed as:
S2 = $260,000 + 0.2 × S1
Next, insert S1 information into S2. That is:
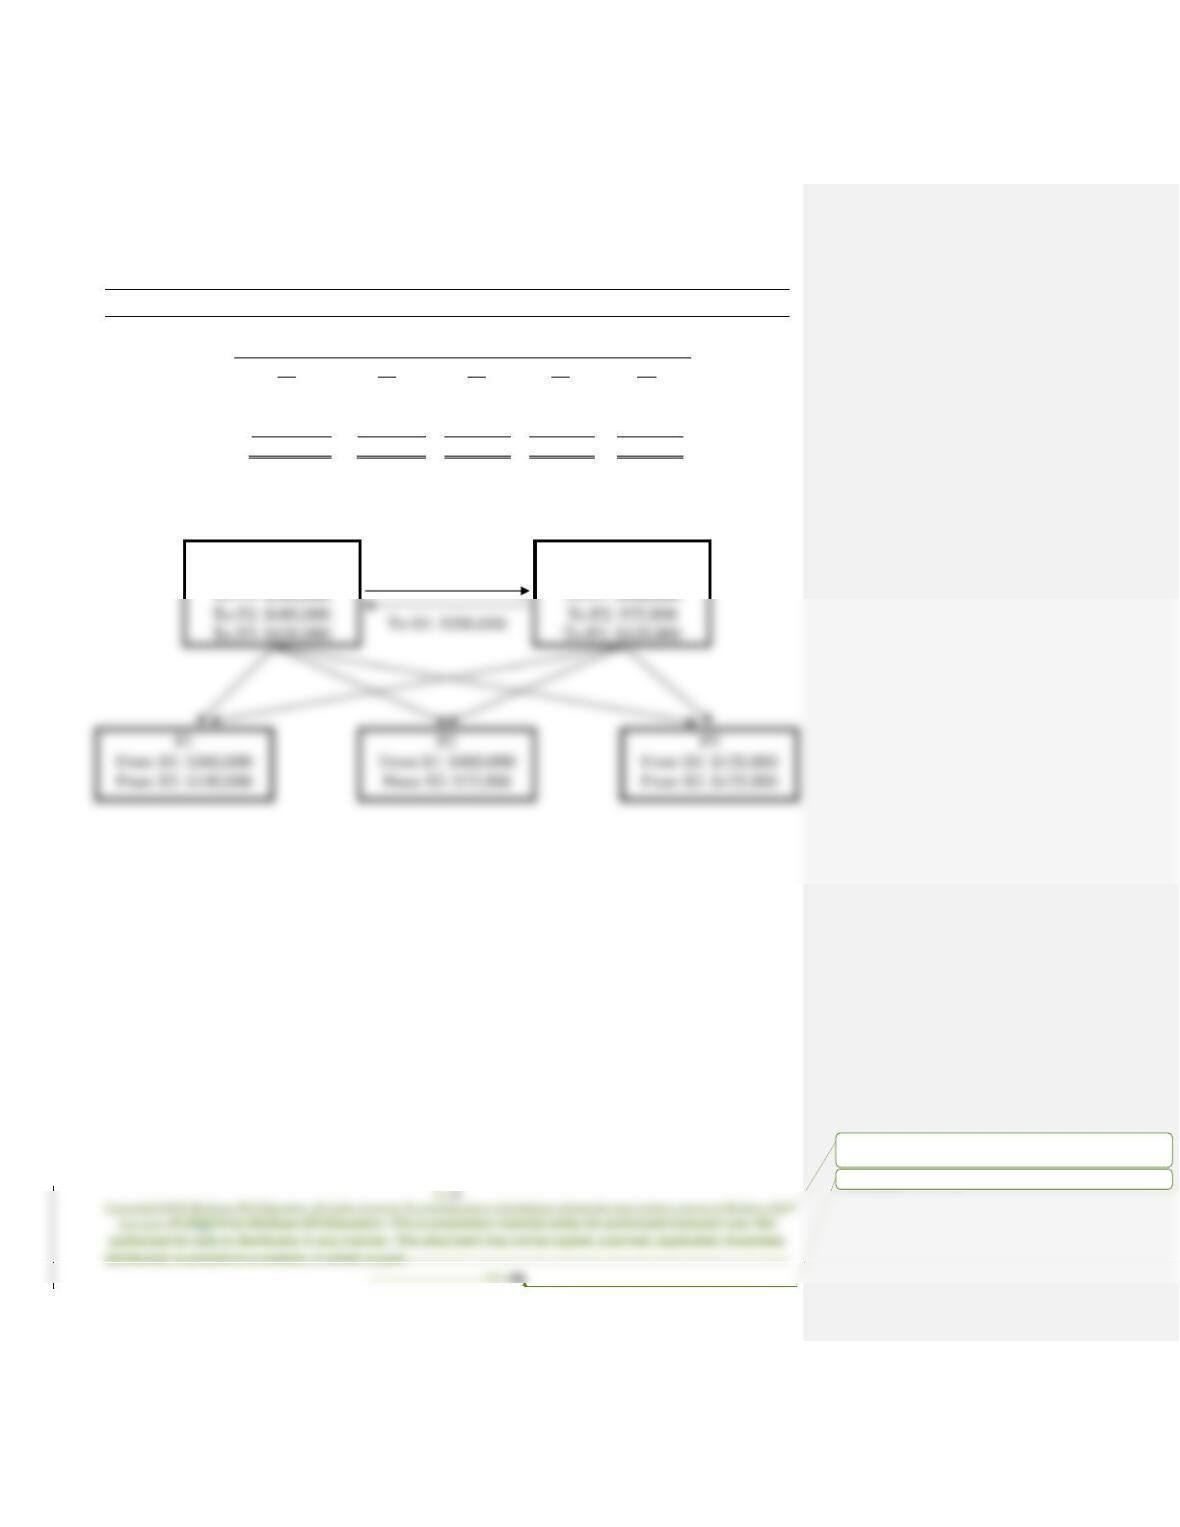
Formatted: Normal1, Centered, Border: Top: (No border),
Tab stops: Not at 1″
Formatted: Font: 8 pt
Demonstration Problem 3 – Solution, continued
Amount Allocable to
From:
S1
S2
P1
P2
P3
Costs incurred
$ 1,000,000
$ 260,000
$ 0
$ 0
$ 0
S1
(1,200,000)
240,000a
360,000
480,000
120,000
S2
200,000b
(500,000)
100,000
75,000
125,000
Total
$ 0
$ 0
$460,000
$555,000
$245,000
a $240,000 = $1,200,000 × 20.0%
b $200,000 = $500,000 × 40.0%
S1
To S2: $240,000
S2
To S1: $200,000
To S2: $240,000

11–39
Formatted: Normal1, Centered, Border: Top: (No border),
Tab stops: Not at 1″
Formatted: Font: 8 pt
Demonstration Problem 4
S1. In order to evaluate the bids from qualified vendors, Kirby’s accountant provides the
following revised data that reflect only the variable costs incurred.
Variable
Costs
Incurred
Service
Department
Percent Allocable to
S1
S2
P1
P2
P3
$300,000
S1
–
20%
30%
40%
10%
104,000
S2
40%
–
20%
15%
25%

11–40
Formatted: Normal1, Centered, Border: Top: (No border),
Tab stops: Not at 1″
Demonstration Problem 4 – Solution
Define S1 and S2 to be the variable service department costs for departments S1 and S2,
respectively.
The service department S1 incurred $300,000 for providing services to other departments. The
service department S2 provided 40 percent of its services to S1. Together, the total service
department costs for S1 can be expressed as:
S1 = $300,000 + 0.4 × S2
Then:
S2 = $104,000 + $60,000 + 0.08 × S2
0.92 × S2 = $164,000
S2 = $178,261
S1 = $371,304
The total variable cost of service department S1 is $371,304. This figure includes S1’s direct cost
($300,000) and 40 percent of S2’s cost ($71,304 = $178,261 × 40%).
11–41
Demonstration Problem 5
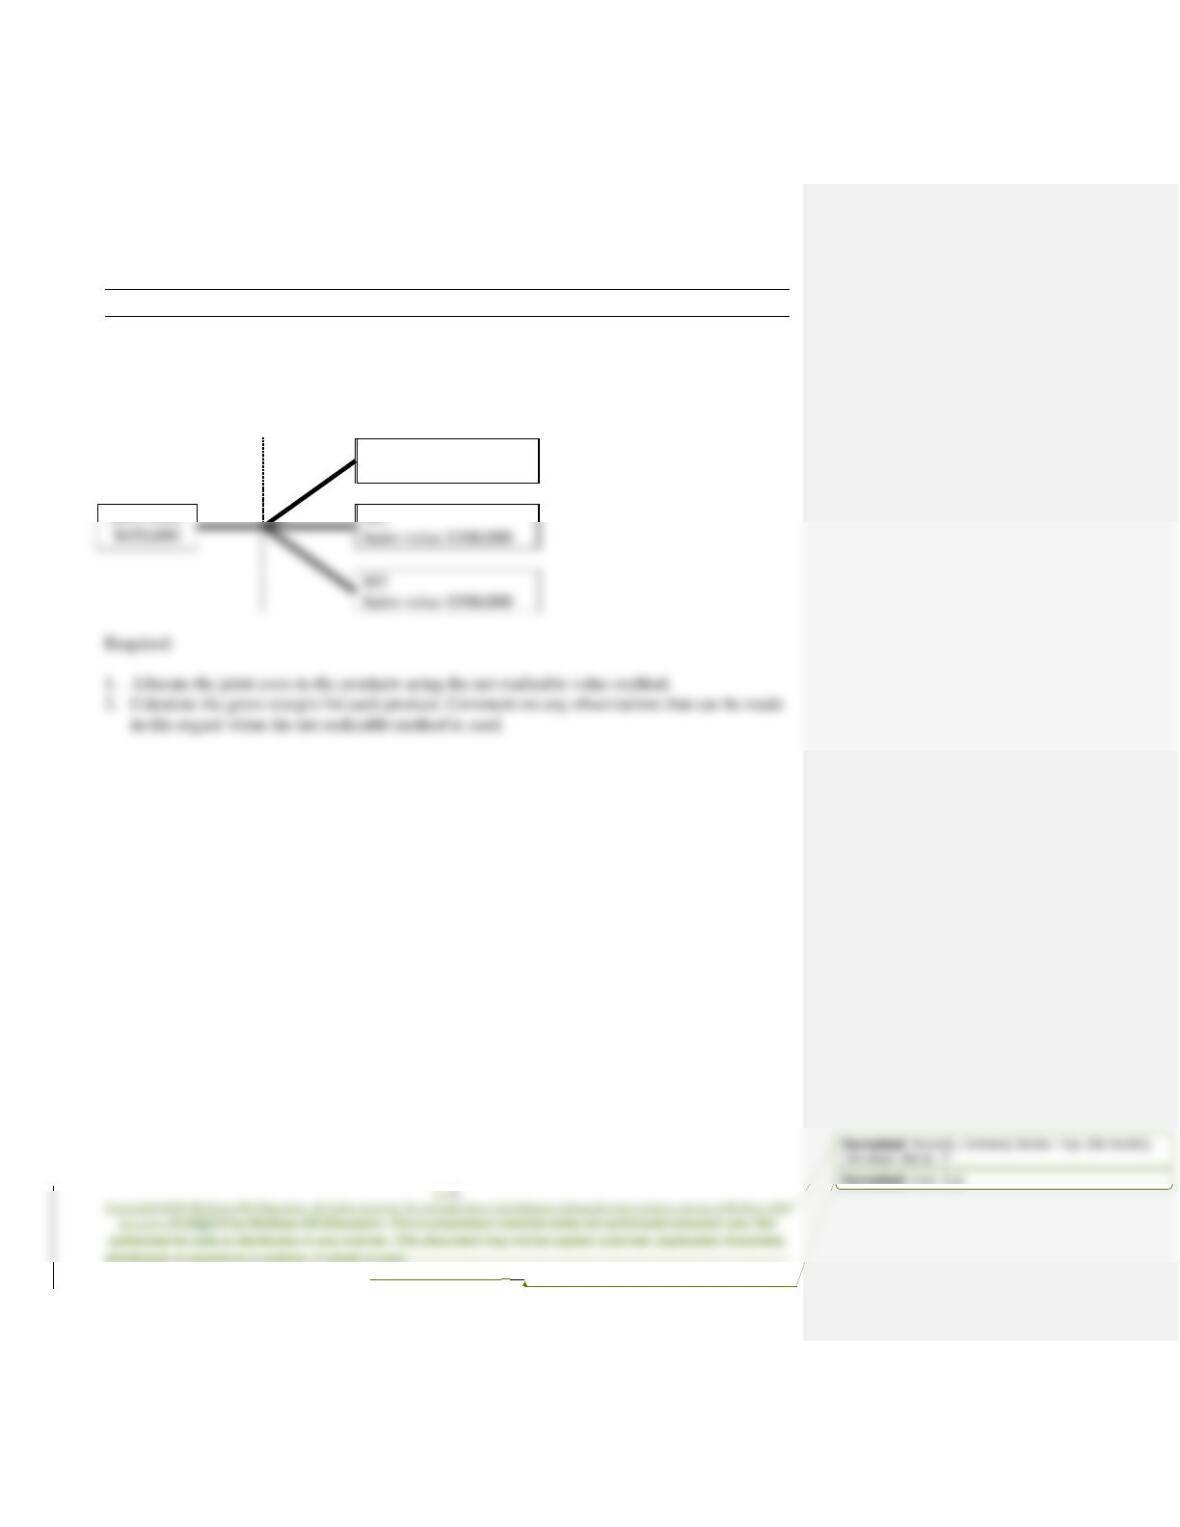
Superior Refinery produces oil products in a joint production process. For the month of October,
$450,000 of materials, labor, and overhead were added to produce the three main products: M1,
M2, and M3. The sale values were available right after the split-off point. The following diagram
shows the process.
M1
Sales value $200,000
Sales value $300,000

11–42
Formatted: Normal1, Centered, Border: Top: (No border),
Tab stops: Not at 1″
Demonstration Problem 5 – Solution
Part 1
The cost allocation follows the proportional distribution of net realizable values.
Product
Sales Value
Proportion
Allocation
M1
$ 200,000
20%a
$90,000b
M3
500,000
225,000
Total
$450,000
Part 2
M1
M2
M3
Total
Sales (a)
$200,000
$300,000
$500,000
$1,000,000
Allocated joint costs
90,000
135,000
225,000
450,000
Gross margin (b)
Gross margin percentage (a) ÷ (b)
11–43
Formatted: Normal1, Centered, Border: Top: (No border),
Tab stops: Not at 1″
Demonstration Problem 6
(Continued from Demonstration Problem 5)
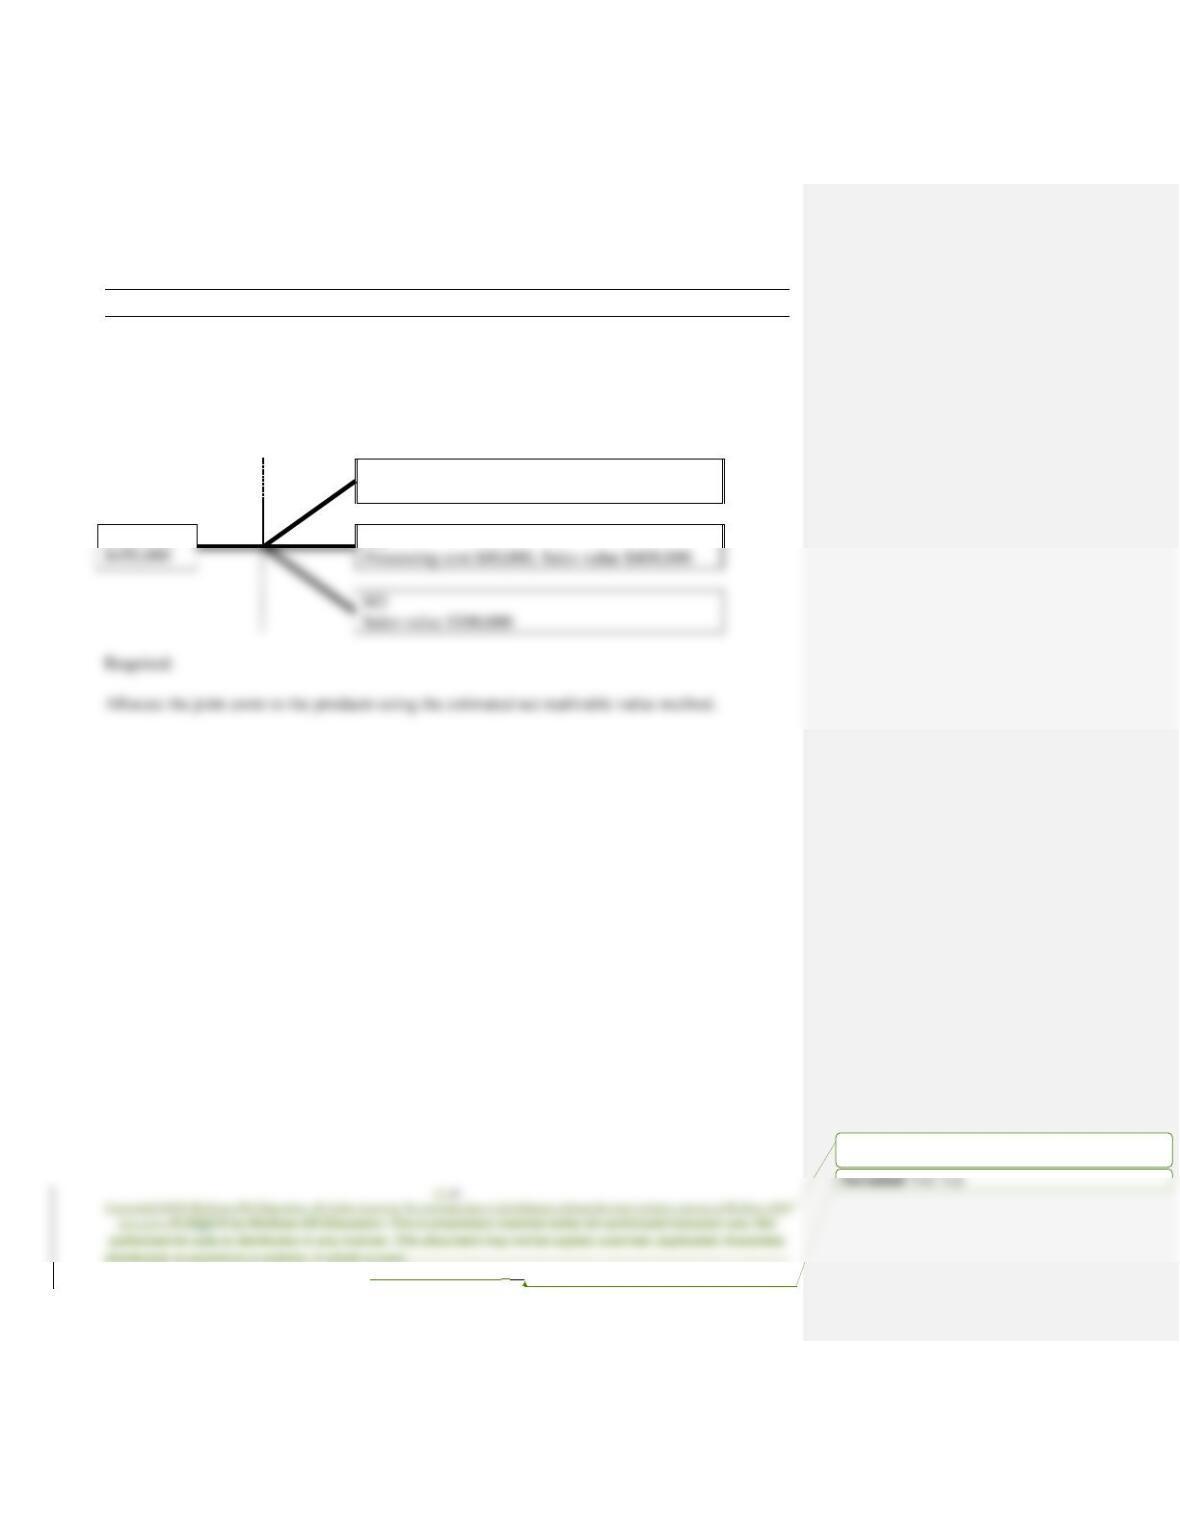
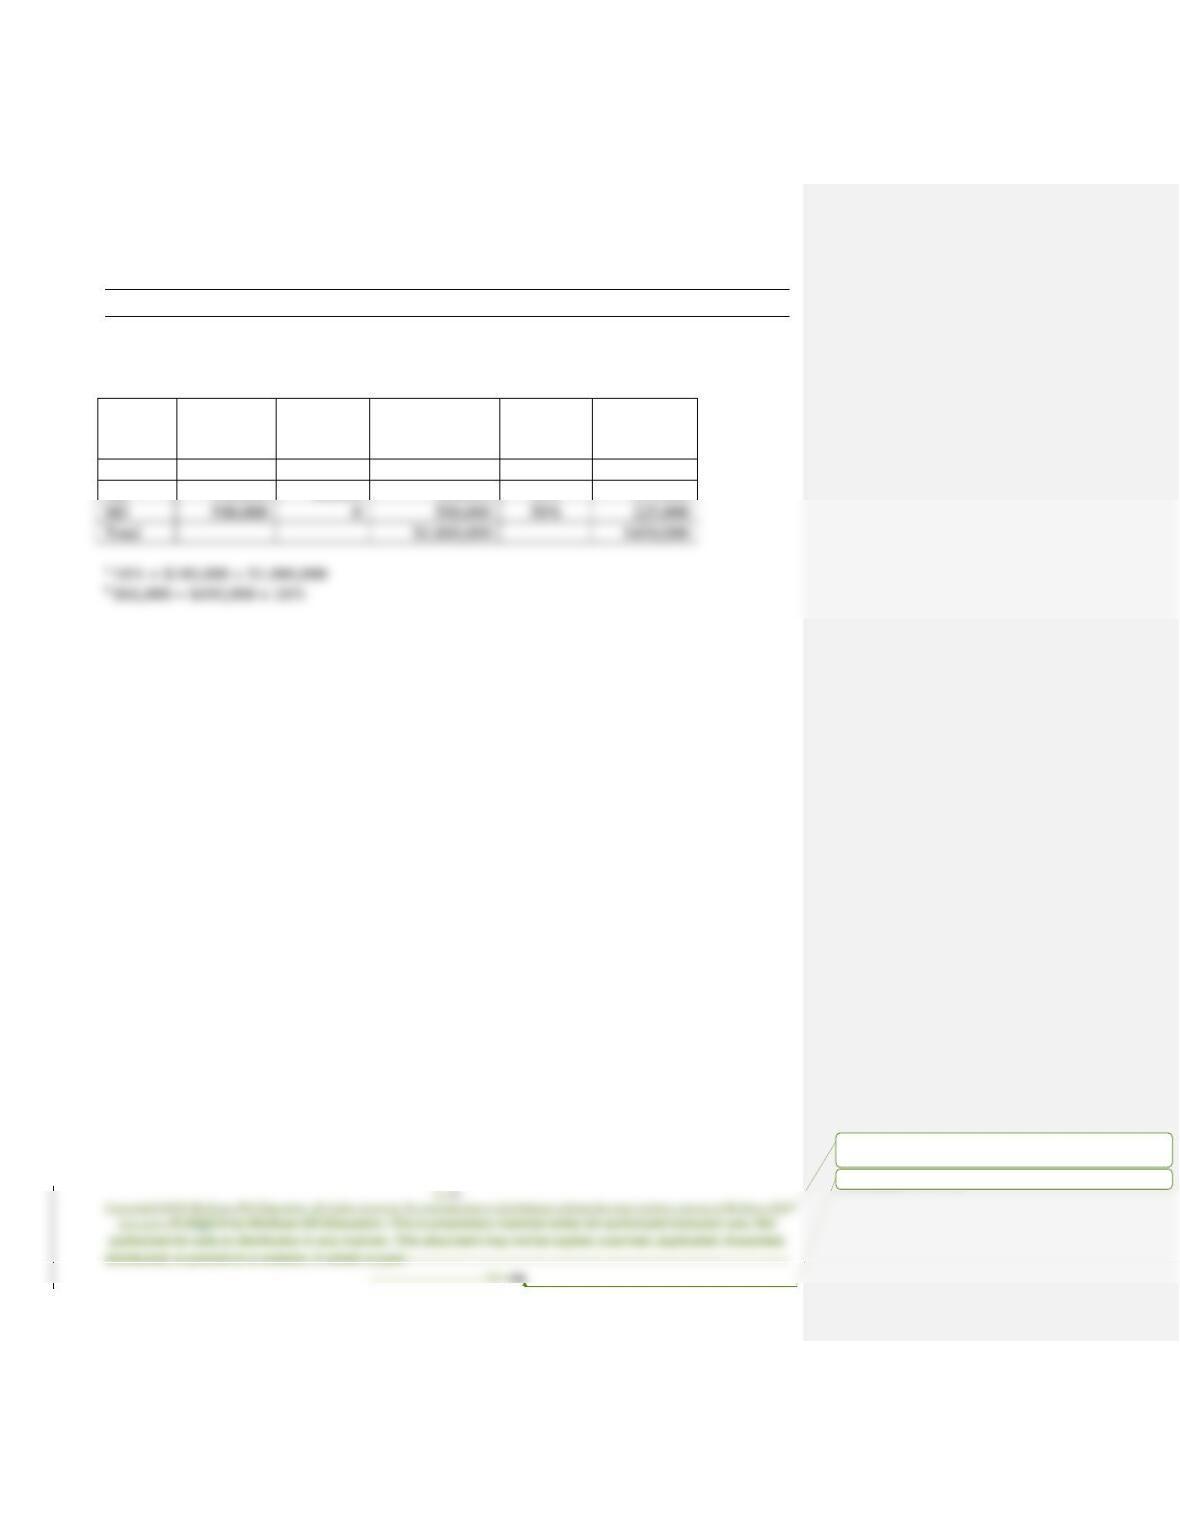
Products M1 and M2 needed further processing with additional costs before they could be
marketable. Product M3 was immediately available for sale. The following diagram shows the
process.
M1
Processing cost $120,000, Sales value $300,000
Joint costs
Processing cost $80,000, Sales value $400,000
M2
Formatted: Normal1, Centered, Border: Top: (No border),
Tab stops: Not at 1″
Formatted: Font: 8 pt
Demonstration Problem 6 – Solution
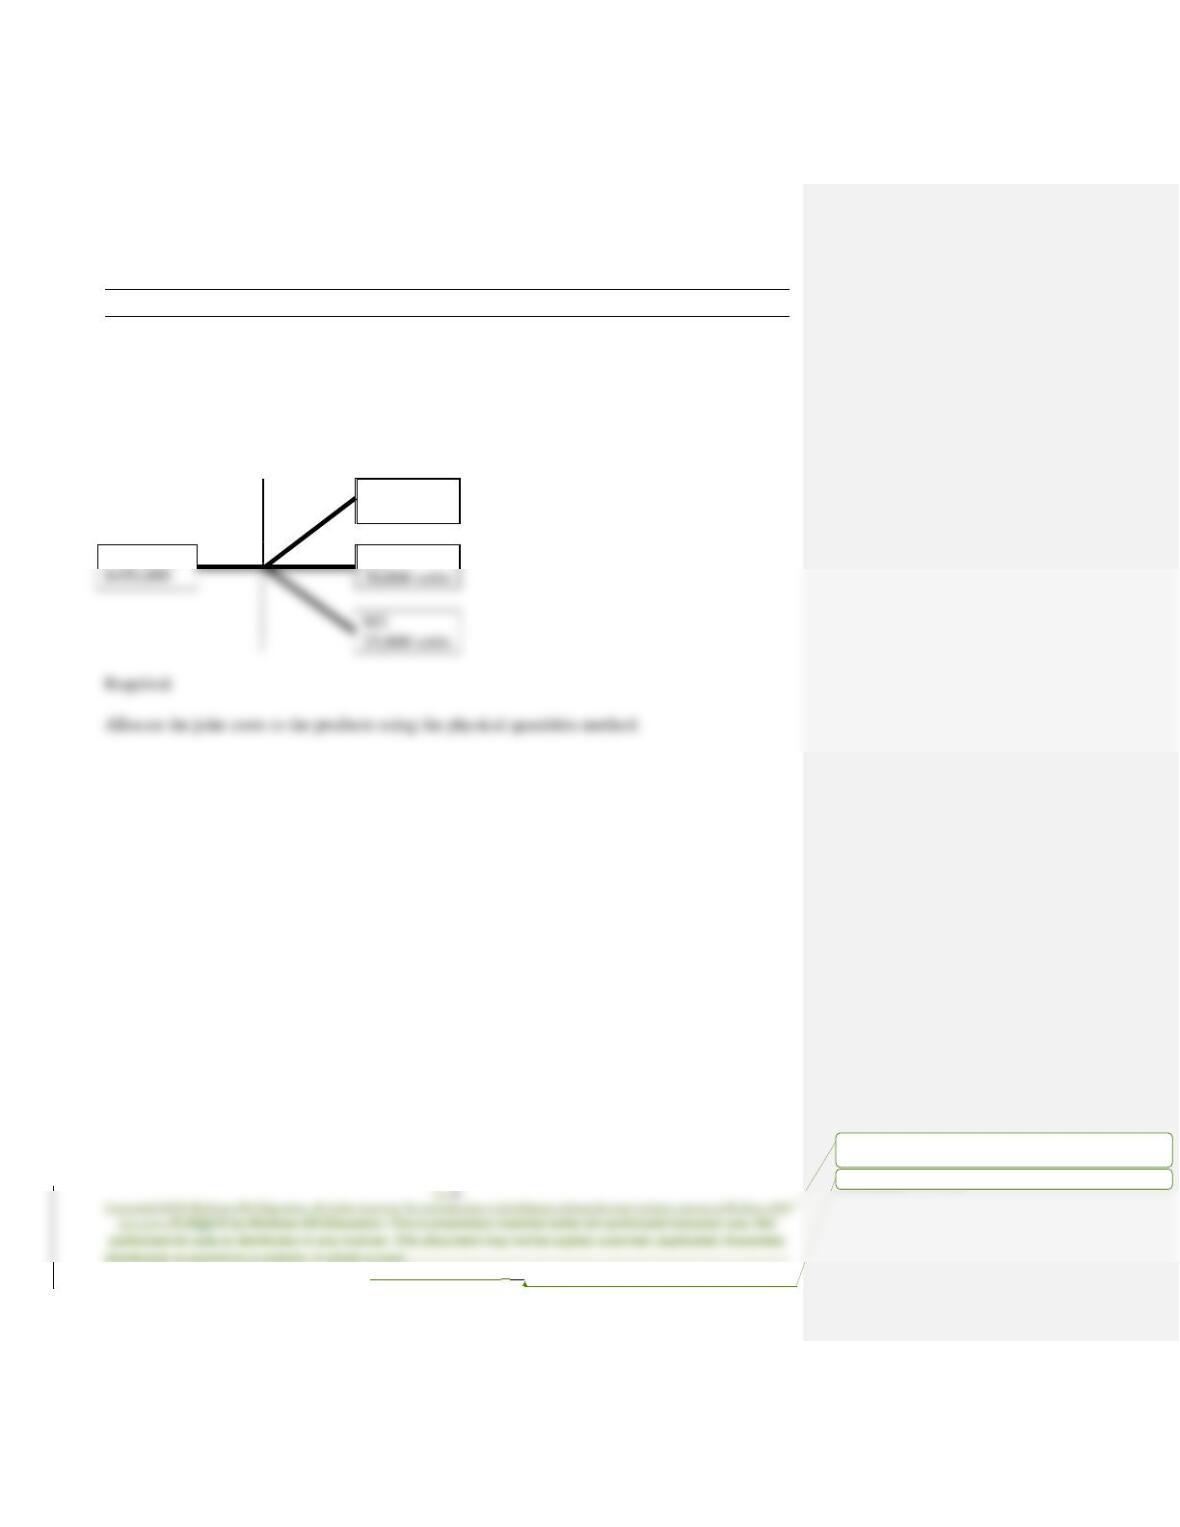
The estimated net realizable value is used for joint cost allocation in the same way as an actual
market value at the split-off point.
Product
Sales Value
(1)
Processing
Cost
(2)
Estimated Net
Realizable
Value (1) – (2)
Proportion
Allocation
M1
$300,000
$120,000
$180,000
18%a
$ 81,000b
M2
11–45
Formatted: Normal1, Centered, Border: Top: (No border),
Tab stops: Not at 1″
Formatted: Font: 8 pt
Demonstration Problem 7
(Continued from Demonstration Problem 5)
Superior Refinery produces oil products in a joint production process. For the month of October,
$450,000 of materials, labor and overhead were added to produce the three main products: M1,
M2, and M3. The physical quantities of the outputs are considered relevant for cost allocation
purposes. The following diagram shows the process.
M1
15,000 units
Joint costs
M2

11–46
Formatted: Normal1, Centered, Border: Top: (No border),
Tab stops: Not at 1″
Demonstration Problem 7 – Solution
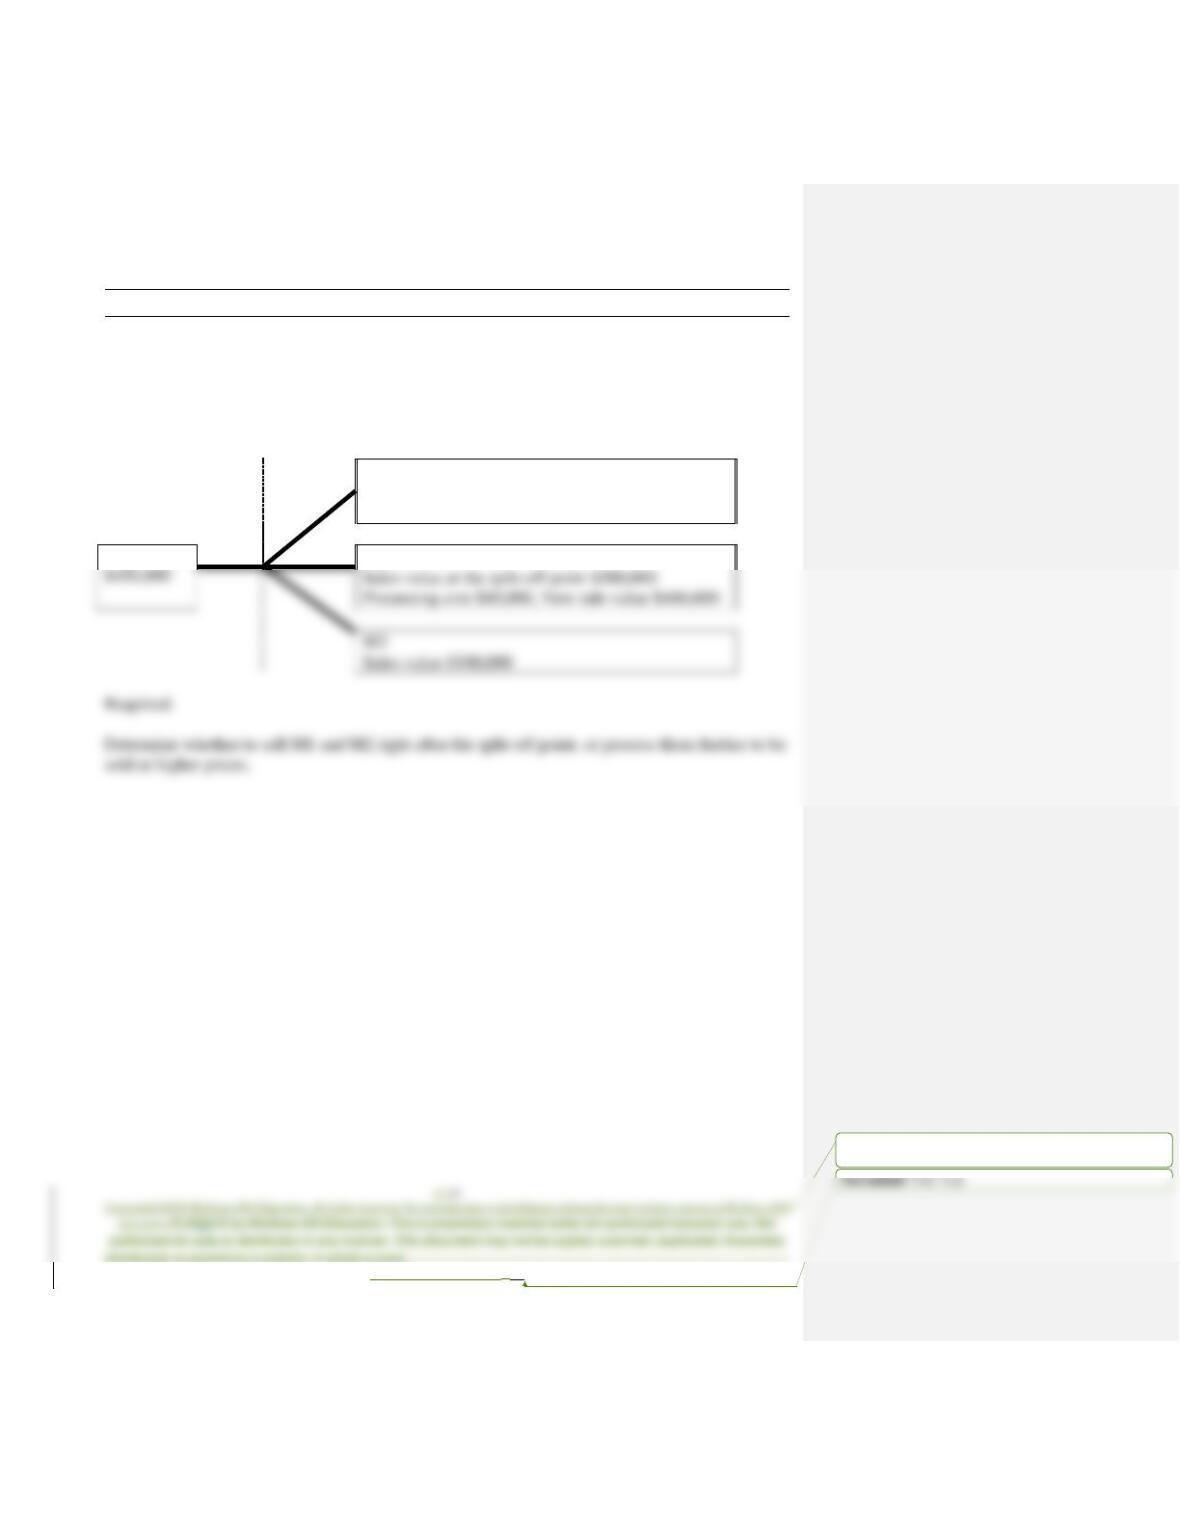
The allocation of joint costs is based on the physical units in this case.
Product
Units
Proportion
Allocation
M1
15,000
25.0%a
$112,500b
11–47
Formatted: Normal1, Centered, Border: Top: (No border),
Tab stops: Not at 1″
Demonstration Problem 8
(Continued from Demonstration Problems 5 and 6)
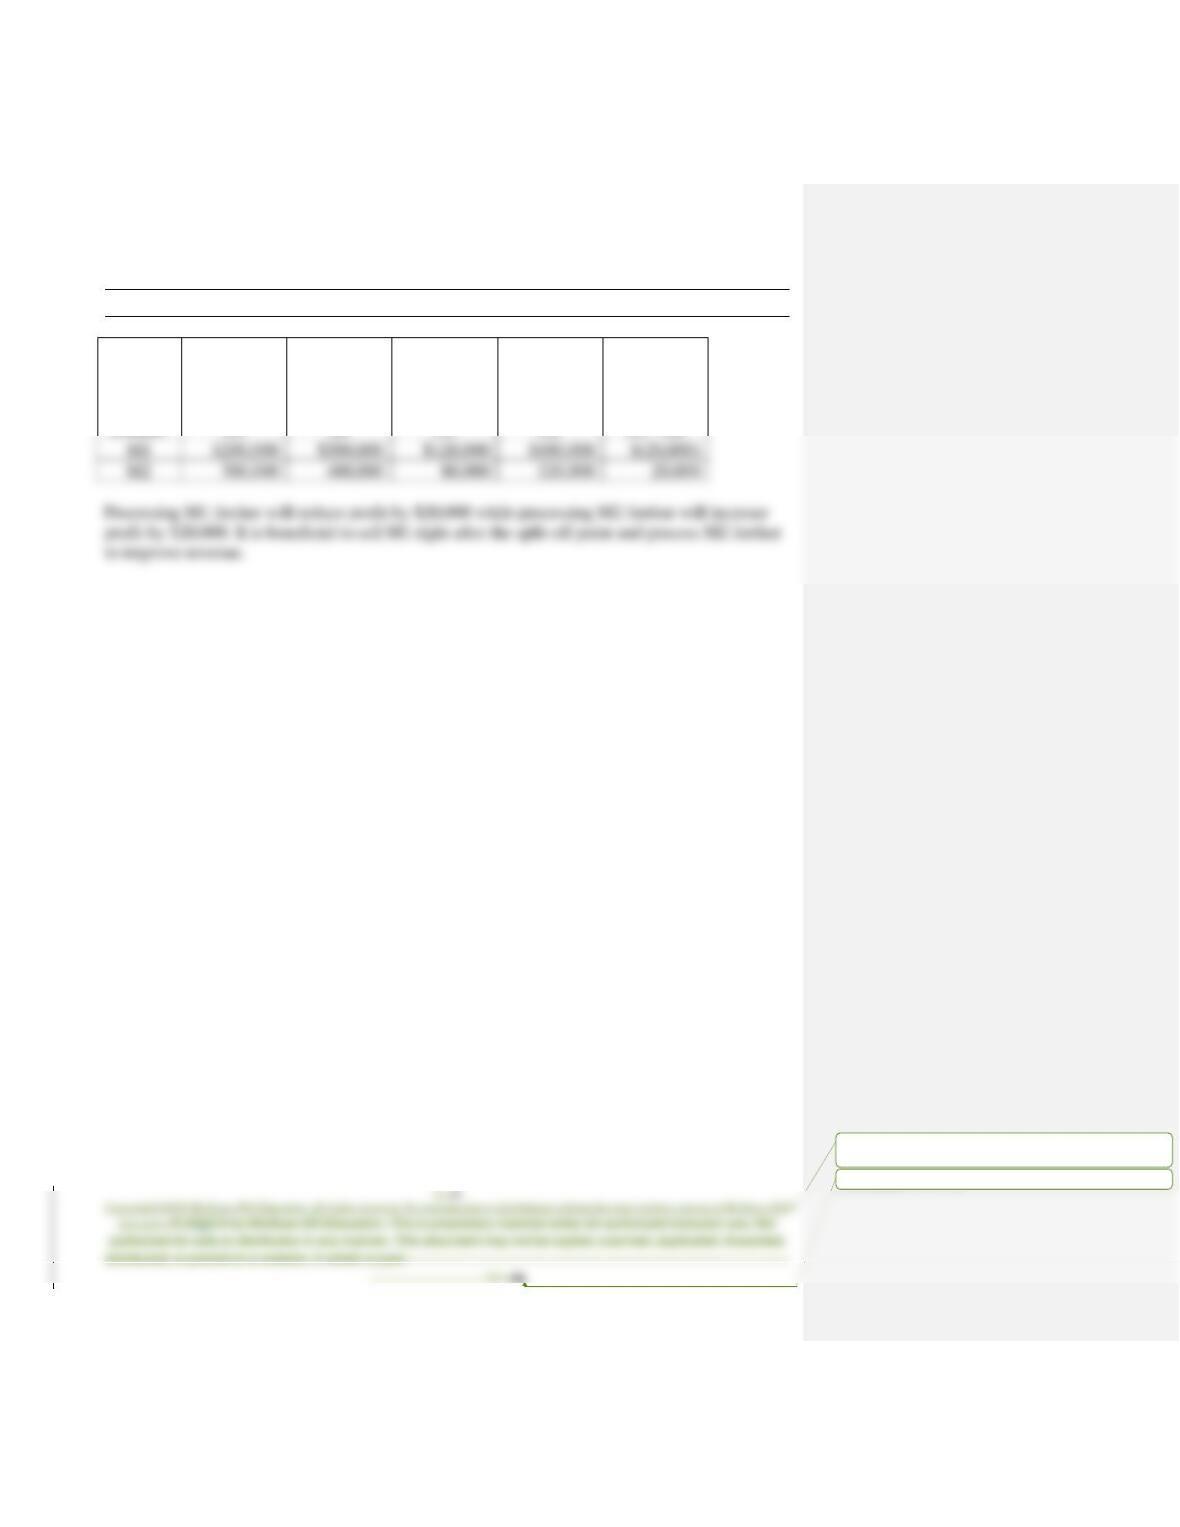
Products M1 and M2 can be sold immediately after the split-off point. They can also be
processed further and sold at higher prices. The following diagram shows the process.
M1
Sales value at the split-off point $200,000
Processing cost $120,000, New sale value $300,000
Joint costs
Sales value at the split-off point $300,000
Processing cost $80,000, New sale value $400,000
M2
Formatted: Normal1, Centered, Border: Top: (No border),
Tab stops: Not at 1″
Formatted: Font: 8 pt
Demonstration Problem 8 – Solution
Sales Value
At Split-Off
Point
Sales Value
After
Processing
Processing
Cost
Margin
(4) = (2) –
Additional
Profit From
Processing
Further
11–49
Formatted: Normal1, Centered, Border: Top: (No border),
Tab stops: Not at 1″
Formatted: Font: 8 pt
Demonstration Problem 9
(Continued from Demonstration Problem 5)
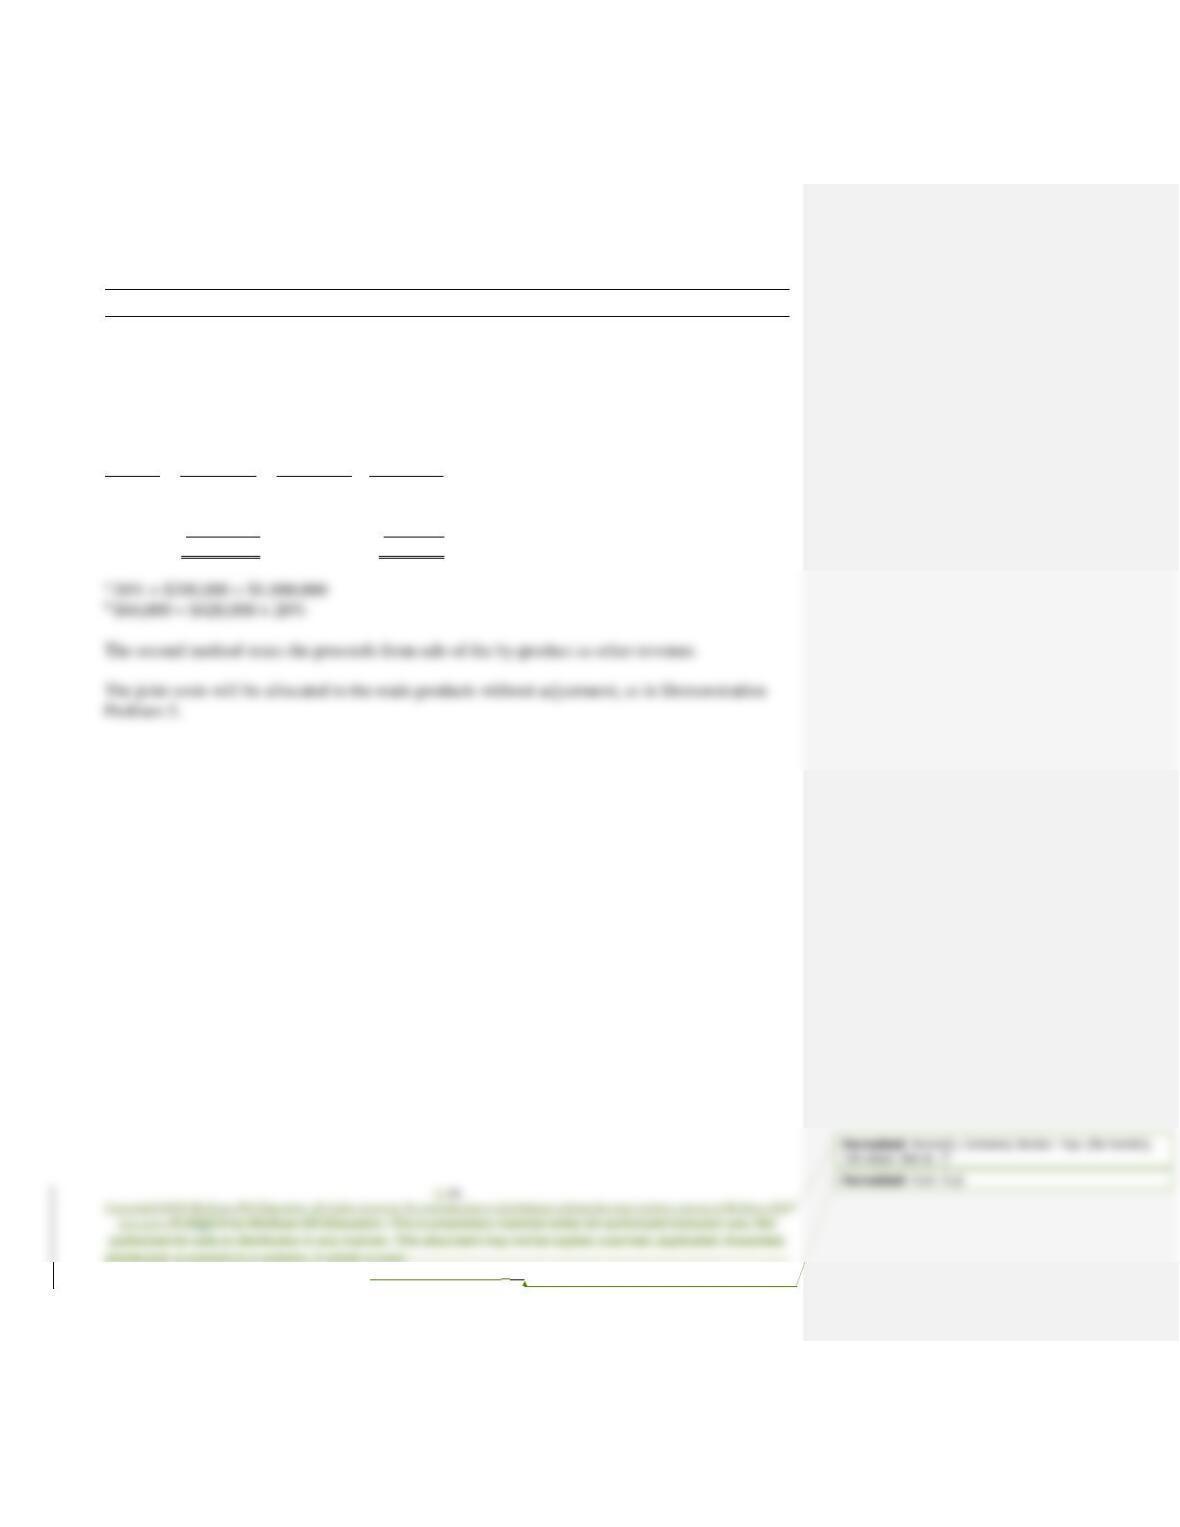
Superior Refinery also produced a by-product, B, in October that was sold for $30,000. The
following diagram shows the process.
M1
Sales value $200,000
Joint costs
$450,000
M2
Sales value $300,000
M3
Sales value $500,000
B
Sales value $30,000
Required:
11–50
Demonstration Problem 9 – Solution
There are two methods of accounting for by-products. The first method deducts the net realizable
value from sale of the by-products from the cost of the main products, as shown below.
Total costs to be allocated = Joint costs – Net realizable value from the by-product
Total costs to be allocated = $420,000 = $450,000 – $30,00
Product
Sale Value
Proportion
Allocation
M1
$ 200,000
20%a
$ 84,000b
M2
300,000
30%
126,000
M3
500,000
50%
210,000
Total
$1,000,000
$420,000