267
CHAPTER 10
Analysis of Financing Activities
THINKING BEYOND THE QUESTION
How do we finance our business?
Financial leverage is appropriate when it is likely that a company will be
able to meet its principal and interest requirements. A company with sta-
QUESTIONS
Q10-1 Capital structure is the way a company chooses to finance its assets and
operating activities. A corporation’s capital structure includes common
stock and retained earnings. In addition, it may include preferred stock,
long-term debt, and short-term obligations. Capital structures differ be-
268 Chapter 10
Q10-2 The primary benefit of return on equity is that it allows investors (and
others) to make reliable comparisons across many different companies.
Return on equity measures the earning power of each dollar of stock-
holders’ equity. In other words, it measures how hard each dollar of
Q10-3 The most likely situation is that the two firms operate in very different en-
vironments and that the choice management has made in each case is
most appropriate to that firm. For example, Company X may operate in a
mature industry where revenues and expenses are highly stable. Growth
Q10-4 Both return on assets and return on equity are measures of company per-
formance. Return on equity, however, is more directly related to the inter-
ests of stockholders. Equity is their ownership interest in the firm and it
Q10-5 The use of financial leverage in the capital structure of a firm causes an
additional liability to arise each period in the form of interest payable. Un-
Analysis of Financing Activities 269
Q10-6 Holders of common stock have the potential to receive a return on in-
vestment in two different ways. One way is through dividends, and many
Q10-7 With the information given there is no way to determine which company
is more highly leveraged. Financial leverage is based on the relative
Q10-8 The debt to equity ratio is 0.25. Use the balance sheet equation of A = L +
Q10-9 Financial leverage does not always have a favorable impact. Financial
leverage merely magnifies what the underlying financial results were. So,
Q10-10 Financial leverage magnifies a company’s results. If the company is prof-
itable to begin with, financial leverage increases the degree of profitabil-
ity. If the company is unprofitable, financial leverage magnifies that loss.
Therefore, the range of possible outcomes is greater and the company is
270 Chapter 10
Q10-11 Restrictions protect creditors by limiting the amount of new debt a
company can issue and by limiting payments that can be made to
Q10-12 Issuing debt and equity is not necessarily a sign of poor financial condi-
tion. A high-growth company with excellent opportunities for expansion
of products or markets will often need to raise new capital to finance
Q10-13 The amount of dividends a company pays depends partially on its in-
vestment opportunities. Companies with good investment opportunities
are likely to pay lower dividends. They use their cash instead to acquire
additional assets. These companies usually are high-growth companies.
Q10-14 The market-to–book-value ratio reveals the difference between the cost of
a company’s net assets (assets minus liabilities) and the market value at-
tached to them by the securities market. In a way, this ratio reveals the
“value added by management.” If management has deployed the compa-
Analysis of Financing Activities 271
Q10-15 There is not necessarily a relationship between the level of financial lev-
erage used by a company and its market–to–book-value ratio. A high-
leverage company might have a high market-to–book-value ratio or a low
EXERCISES
E10-1 Definitions of all terms are listed in the glossary.
E10-2 a. Increases the equity portion.
b. Increases the long-term liability portion.
c. No effect on capital structure.
E10-3 a. The company’s capital structure is comprised of approximately 66%
272 Chapter 10
E10-4 Return on equity expresses a company’s earnings relative to its stock-
holders’ equity. Therefore, the performances of companies of different
sizes and capital structures can be compared. A large company should
have higher net income than a small company if other conditions are the
E10-5 a. The income statement information appears positive. Sales are in-
2008 = 12.7% $7 net income ÷ $55 stockholders’ equity
c. Based on the new information, the company does not seem so attrac-
tive. Even though net sales and net income have been increasing, the
d. An evaluation cannot focus on just one factor. For example, it’s easy
to focus only on net income because it is readily available. If one
Analysis of Financing Activities 273
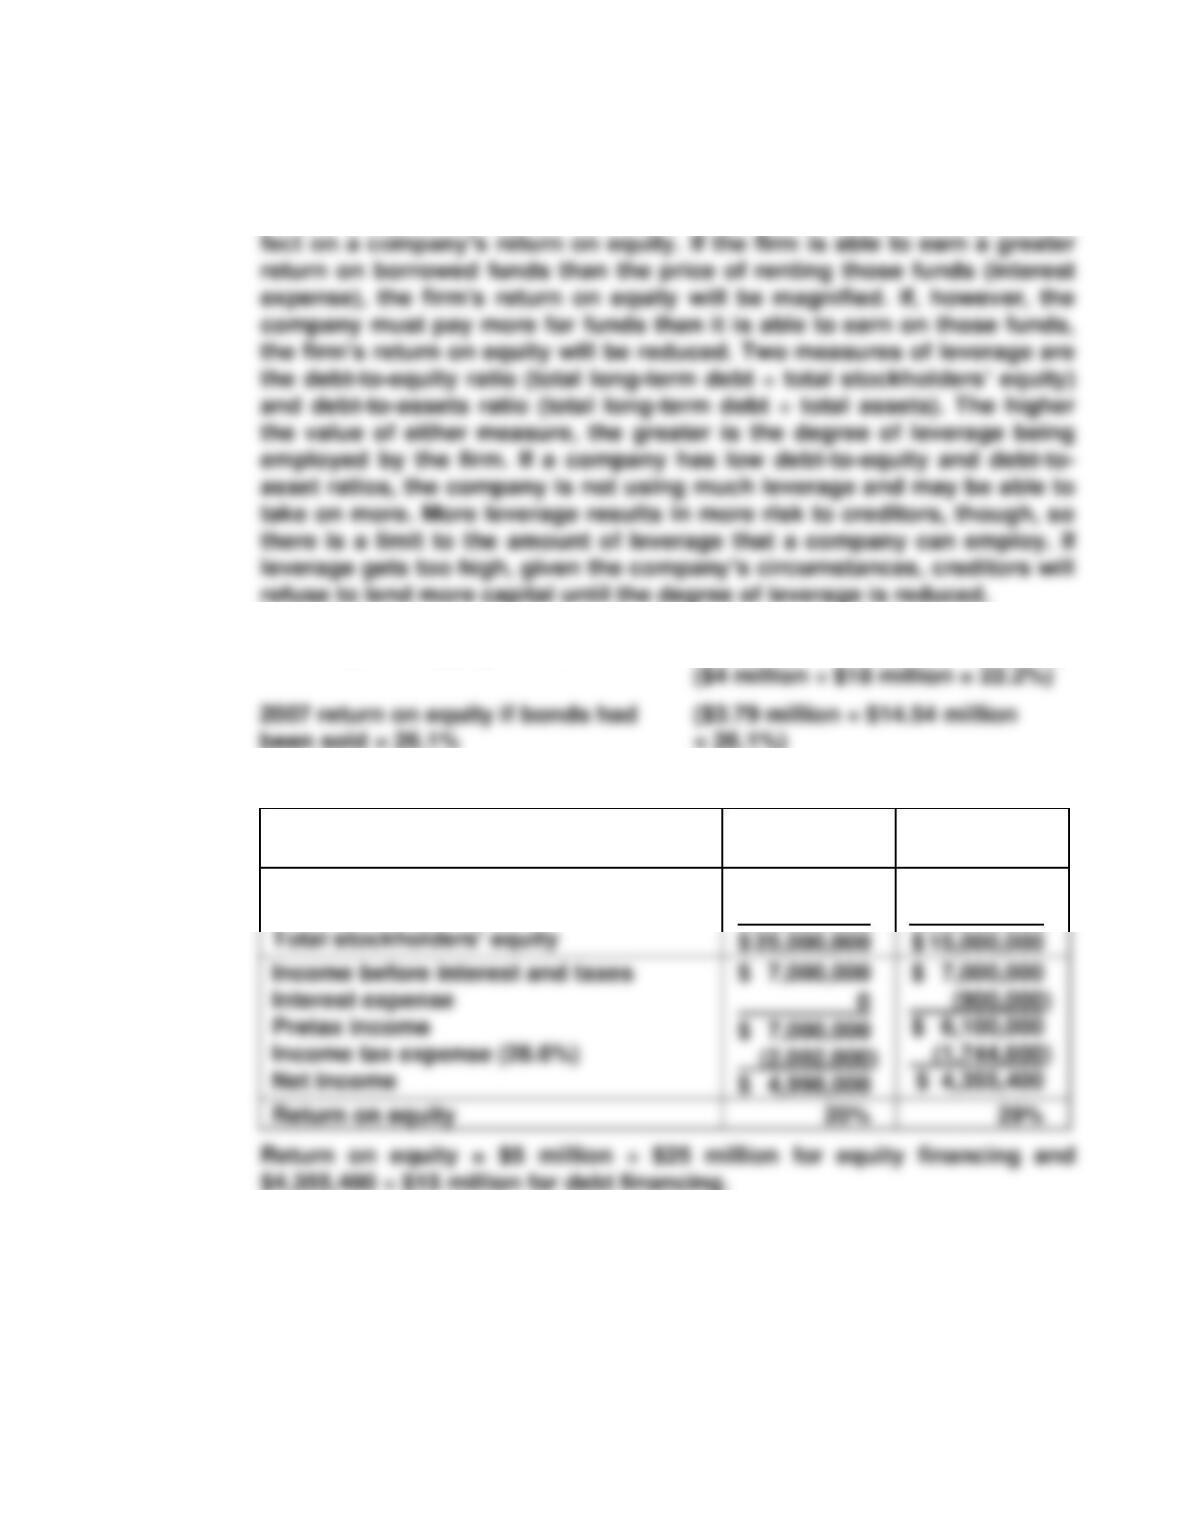
E10-6 Leverage is the use of long-term debt in the capital structure. A company
usually has some combination of both long-term debt and equity in its
capital structure. The larger the proportion of long-term debt, the greater
is its leverage. Leverage can have either a positive effect or a negative ef-
E10-7 2007 return on equity = 22.2% Net income ÷ stockholders’ equity
E10-8
All Equity
Financing
Some Debt
Financing
$ 6,100,000
Total assets
Total liabilities
$ 25,000,000
(0)
$ 25,000,000
(10,000,000)
274 Chapter 10
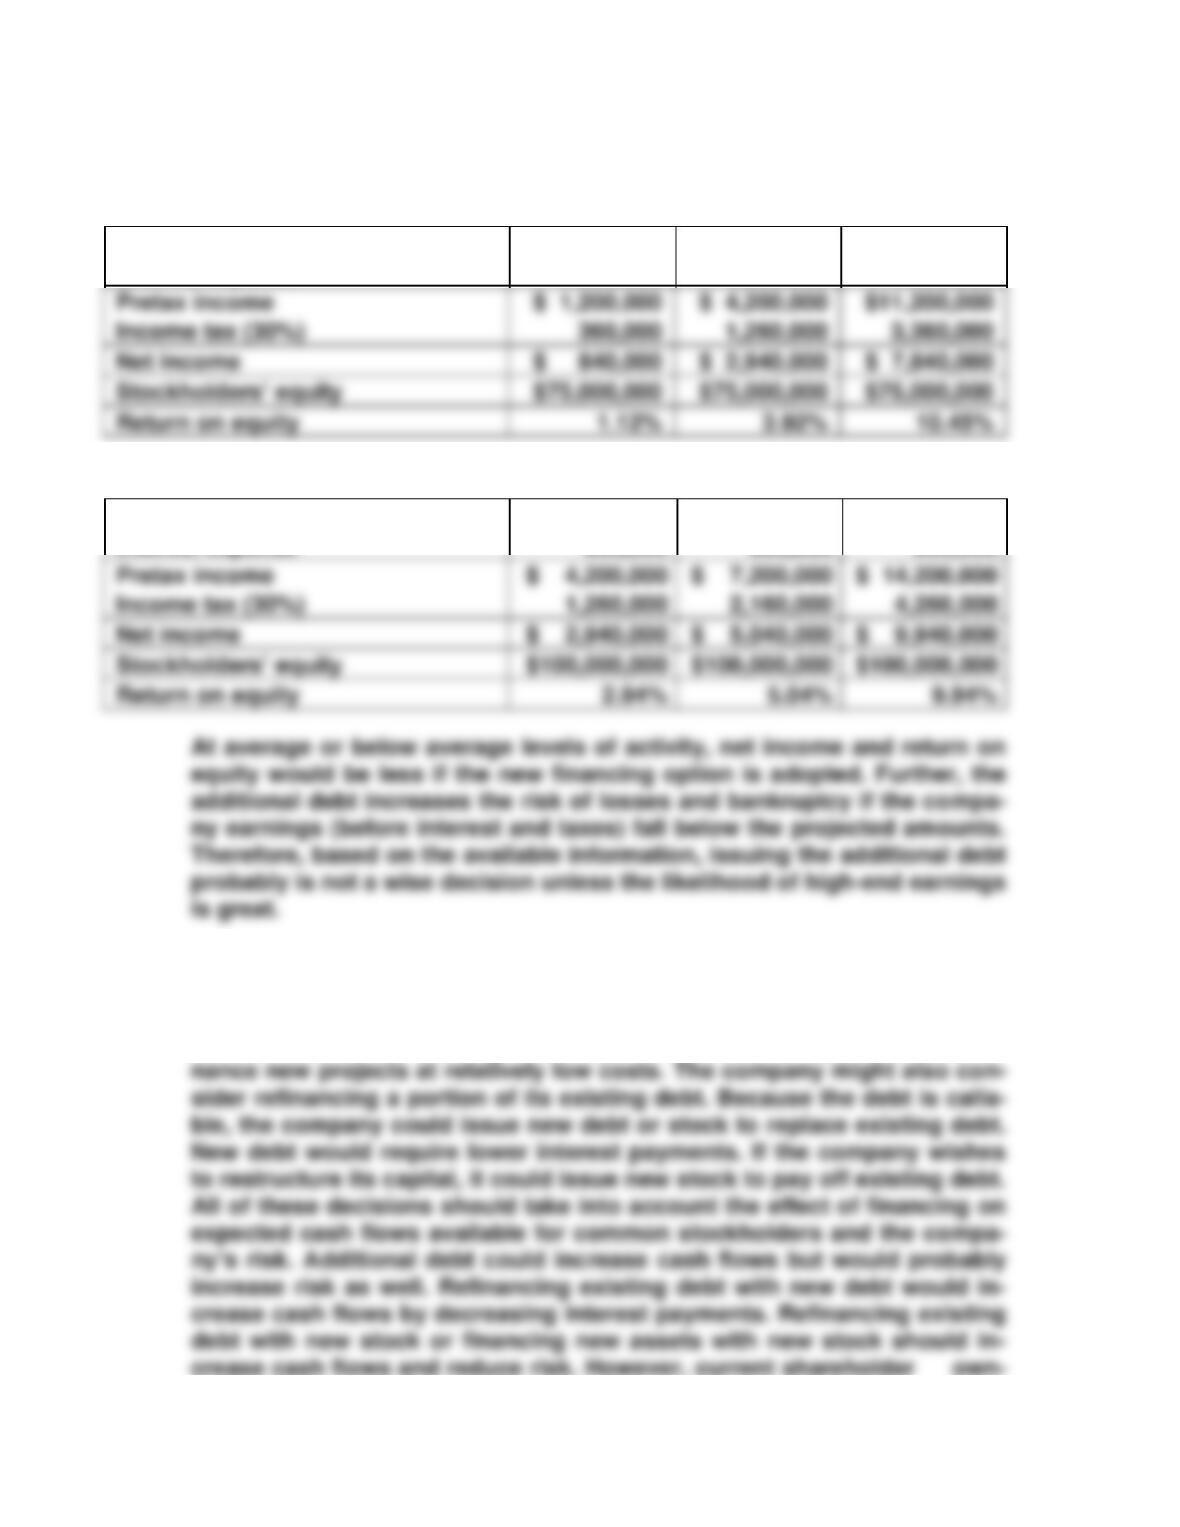
E10-9 One approach to this exercise is to compute the expected net income and
return on equity under each option.
Projected results with additional financing:
Earnings before interest and taxes
Interest expense
$ 5,000,000
3,800,000
$ 8,000,000
3,800,000
$15,000,000
3,800,000
Projected results without additional financing:
Earnings before interest and taxes
Interest expense
$ 5,000,000
800,000
$ 8,000,000
800,000
$ 15,000,000
800,000
Pretax income
Income tax (30%)
Net income
Return on equity
E10-10 Linfield should consider its investment opportunities. If the company has
the opportunity to invest in new projects that are expected to yield re-
turns in excess of its cost to raise capital, it should consider expansion.
Low interest costs and high stock prices provide an opportunity to fi-
Pretax income
Income tax (30%)
$ 1,200,000
$ 4,200,000
1,260,000
$11,200,000
3,360,000
Net income
Return on equity
Analysis of Financing Activities 275
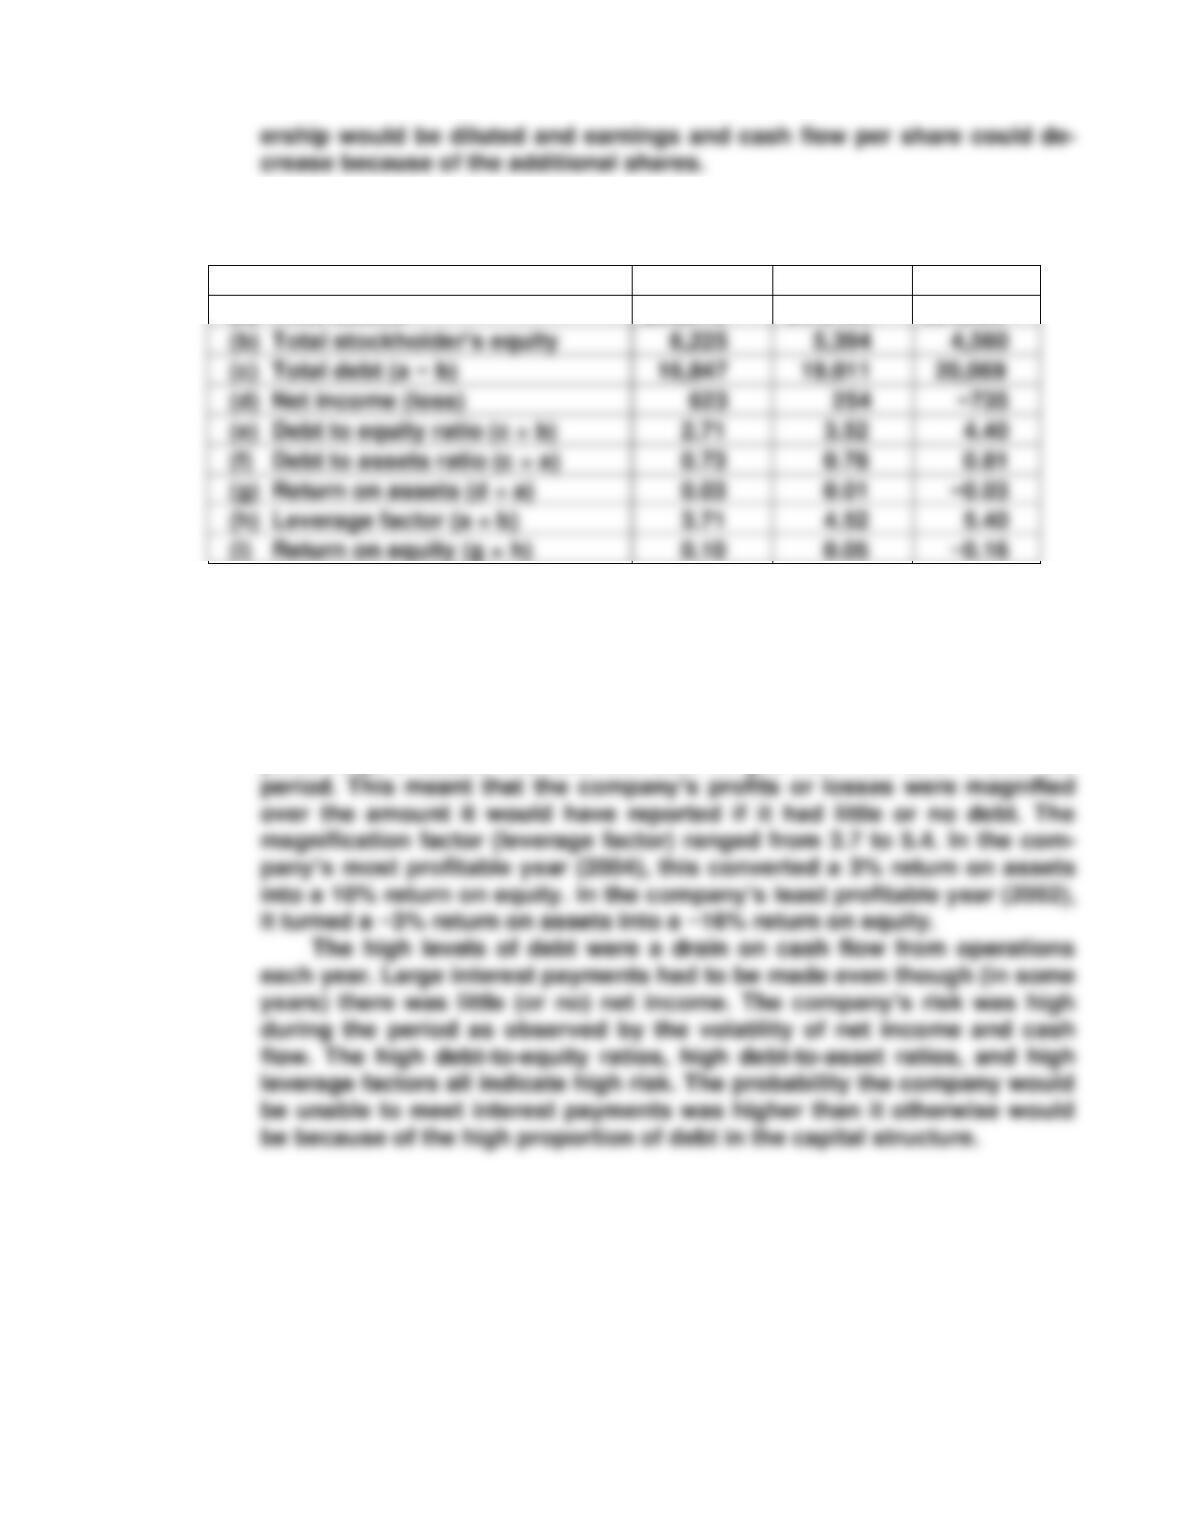
E10-11 Information useful for evaluating the effects of Georgia–Pacific’s capital
structure on profitability, cash flow, and risk includes the following:
(In millions)
2004
2003
2002
(a) Total assets
$23,072
$ 24,405
$24,629
4,560
16,847
19,011
20,069
(d) Net income (loss)
623
(e) Debt to equity ratio (c ÷ b)
2.71
3.52
4.40
(g) Return on assets (d ÷ a)
0.03
0.01
(h) Leverage factor (a ÷ b)
3.71
4.52
5.40
(i) Return on equity (g × h)
0.10
0.05
Note: ROE calculated as (g × h) may differ from ROE calculated as (d ÷ b)
because of rounding to two decimal places in Excel.
The debt-to-equity ratio, debt-to-assets ratio, and the leverage factor all
point out that Georgia-Pacific was highly leveraged over the three-year
period, but the amount of leverage decreased each year. For example, the
percentage of assets financed with debt ranged from 73% to 81% over the
276 Chapter 10
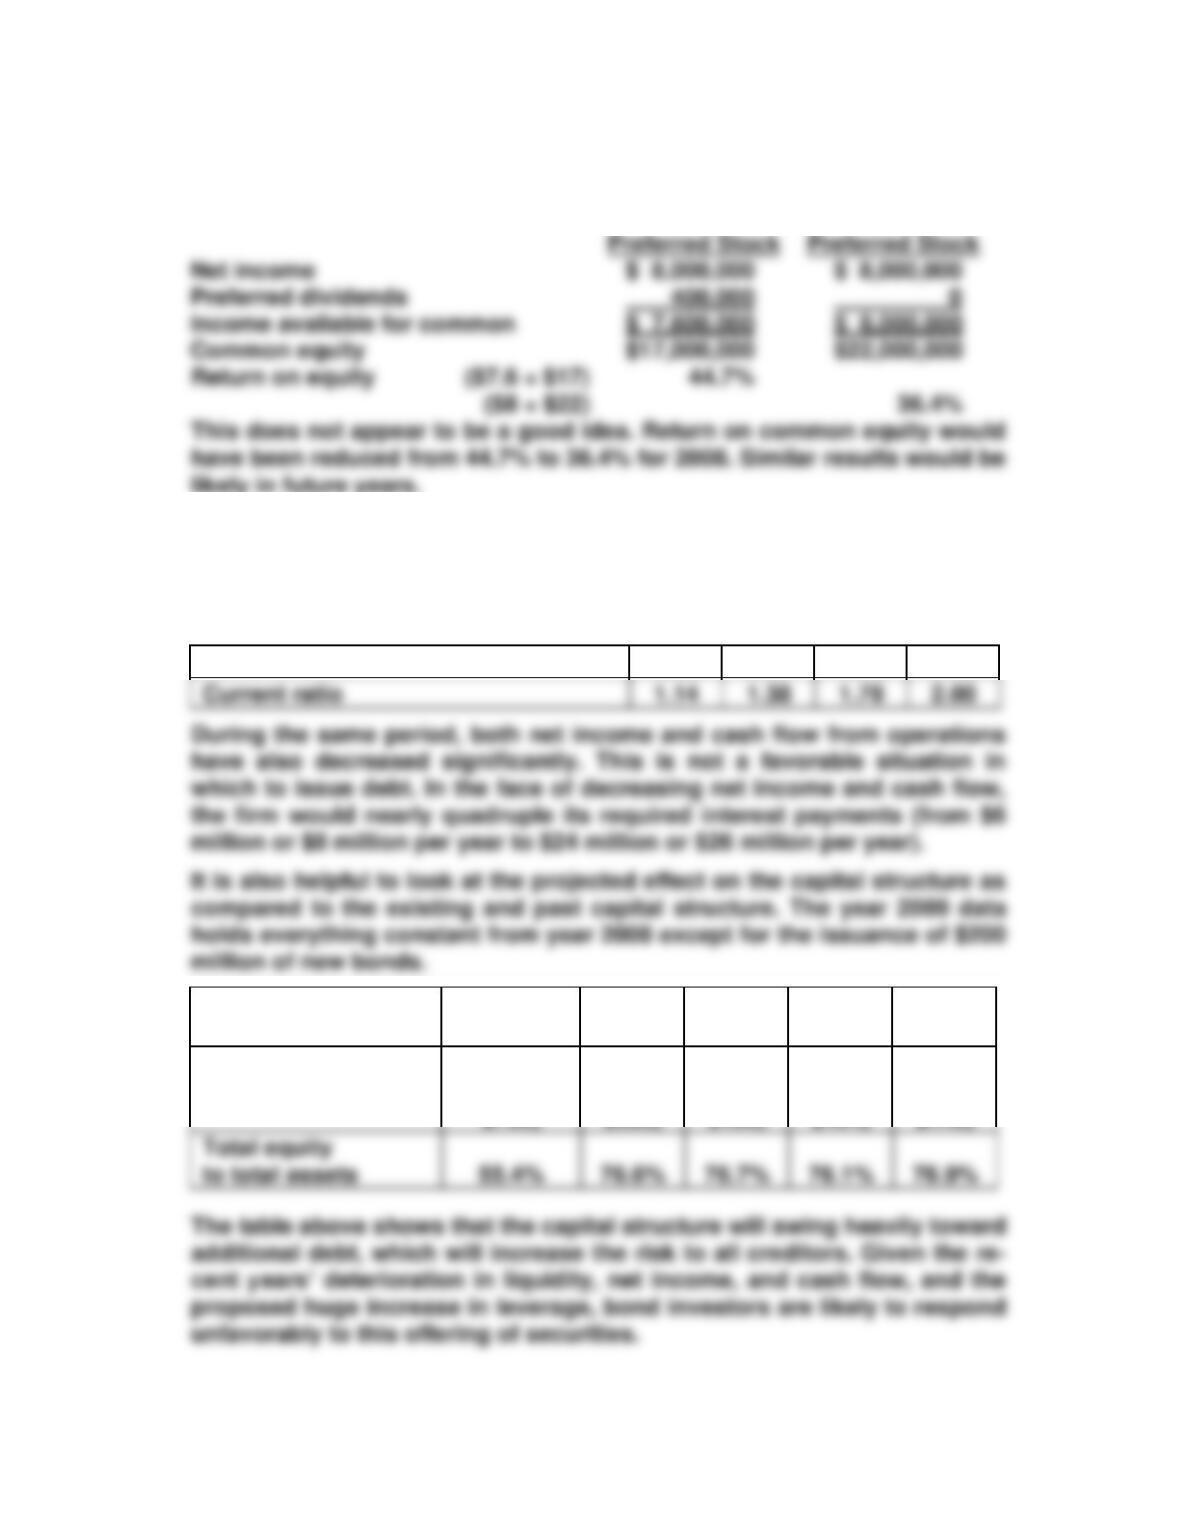
E10-12 a. Return on equity = 44.7% (proof below)
b. Return on equity = 36.4% (proof below)
(a.) (b.)
With Without
E10-13 It is likely that the financial market will respond negatively to the pro-
posed issue of bonds. The liquidity of the firm has decreased significant-
ly over the previous four years. The current ratio for the four years has
been as follows:
2008
2007
2006
2005
Pro-forma
2009
2008
2007
2006
2005
Total liabilities
to total assets
44.6%
($322 ÷
$722)
23.4%
($122 ÷
$522)
23.3%
($116 ÷
$498)
23.9%
($118 ÷
$494)
23.1%
($102 ÷
$442)
Analysis of Financing Activities 277
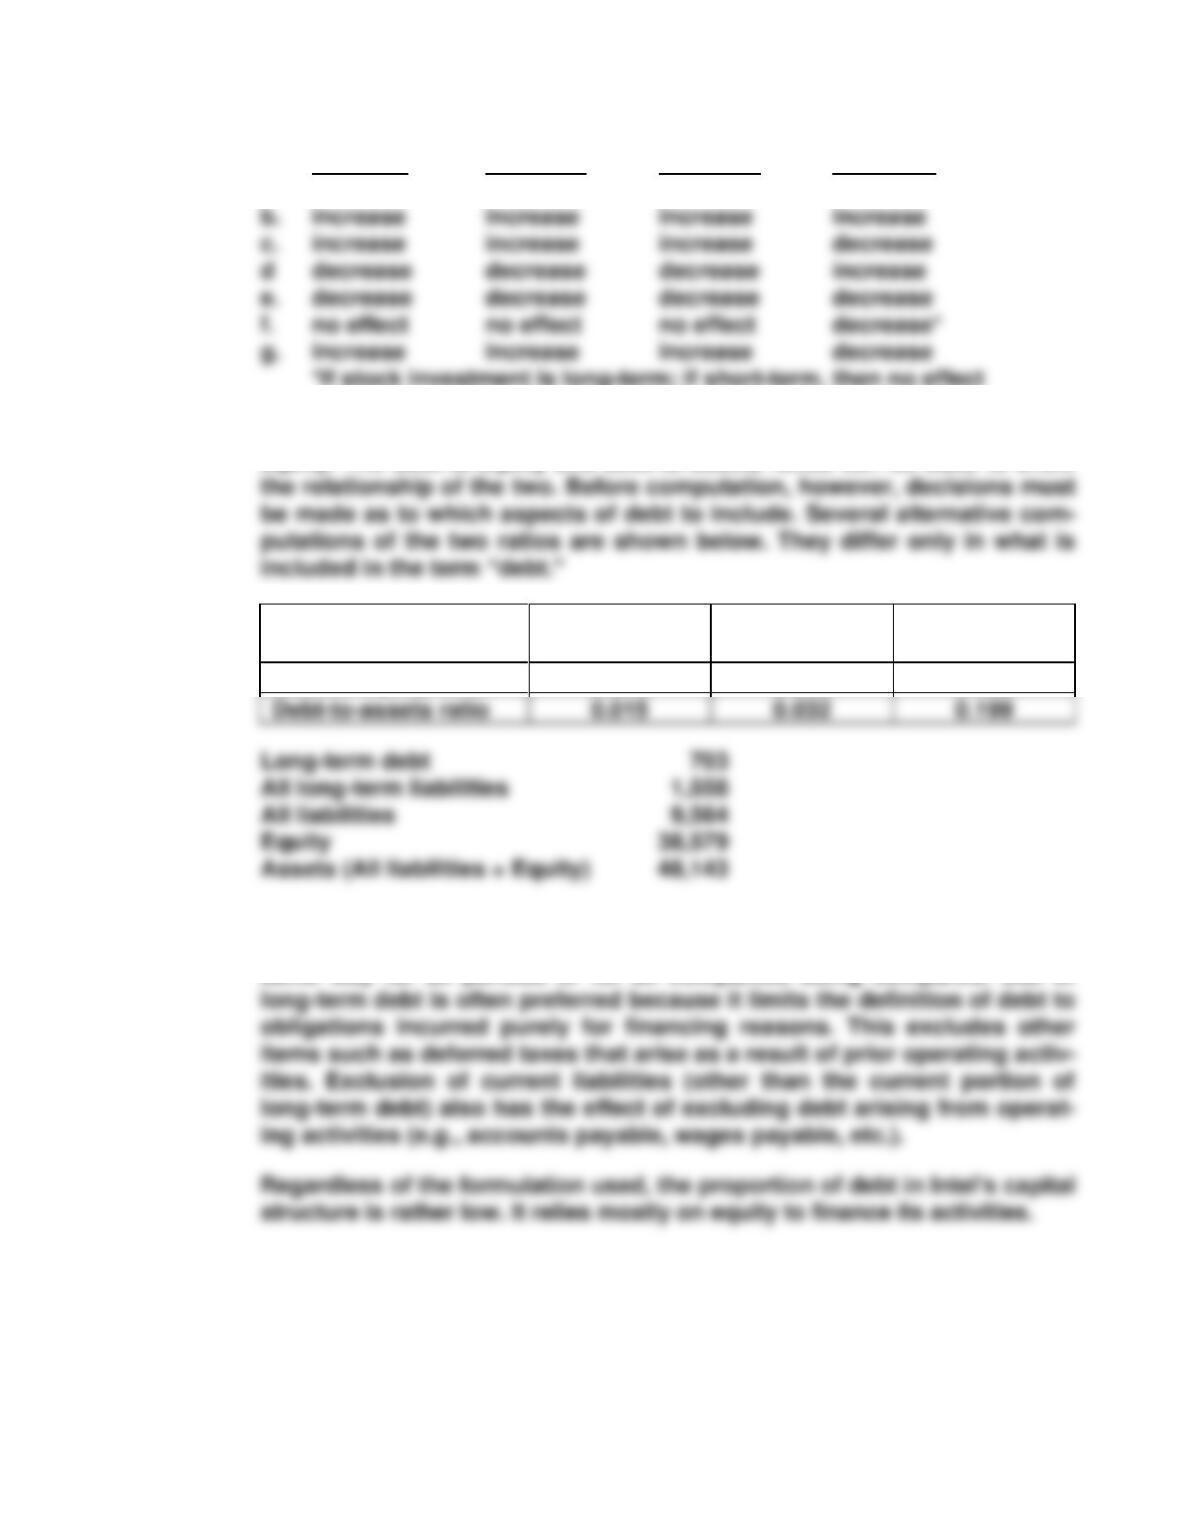
E10-14 Debt to Debt to Financial Current
Equity Assets Leverage Ratio
a. decrease decrease decrease increase
E10-15 Intel’s capital structure consists of liabilities and common stockholders’
equity. The debt-to-equity and debt-to-assets ratios can be used to show
Long-Term
Debt Only
All Long-Term
Liabilities
All
Liabilities
Debt-to-equity ratio
0.018
0.040
0.248
Which items to include in debt is somewhat a matter of the analyst’s per-
sonal preference. The most important issue is that it be computed the
same way for all periods or for all companies being compared. Use of
278 Chapter 10
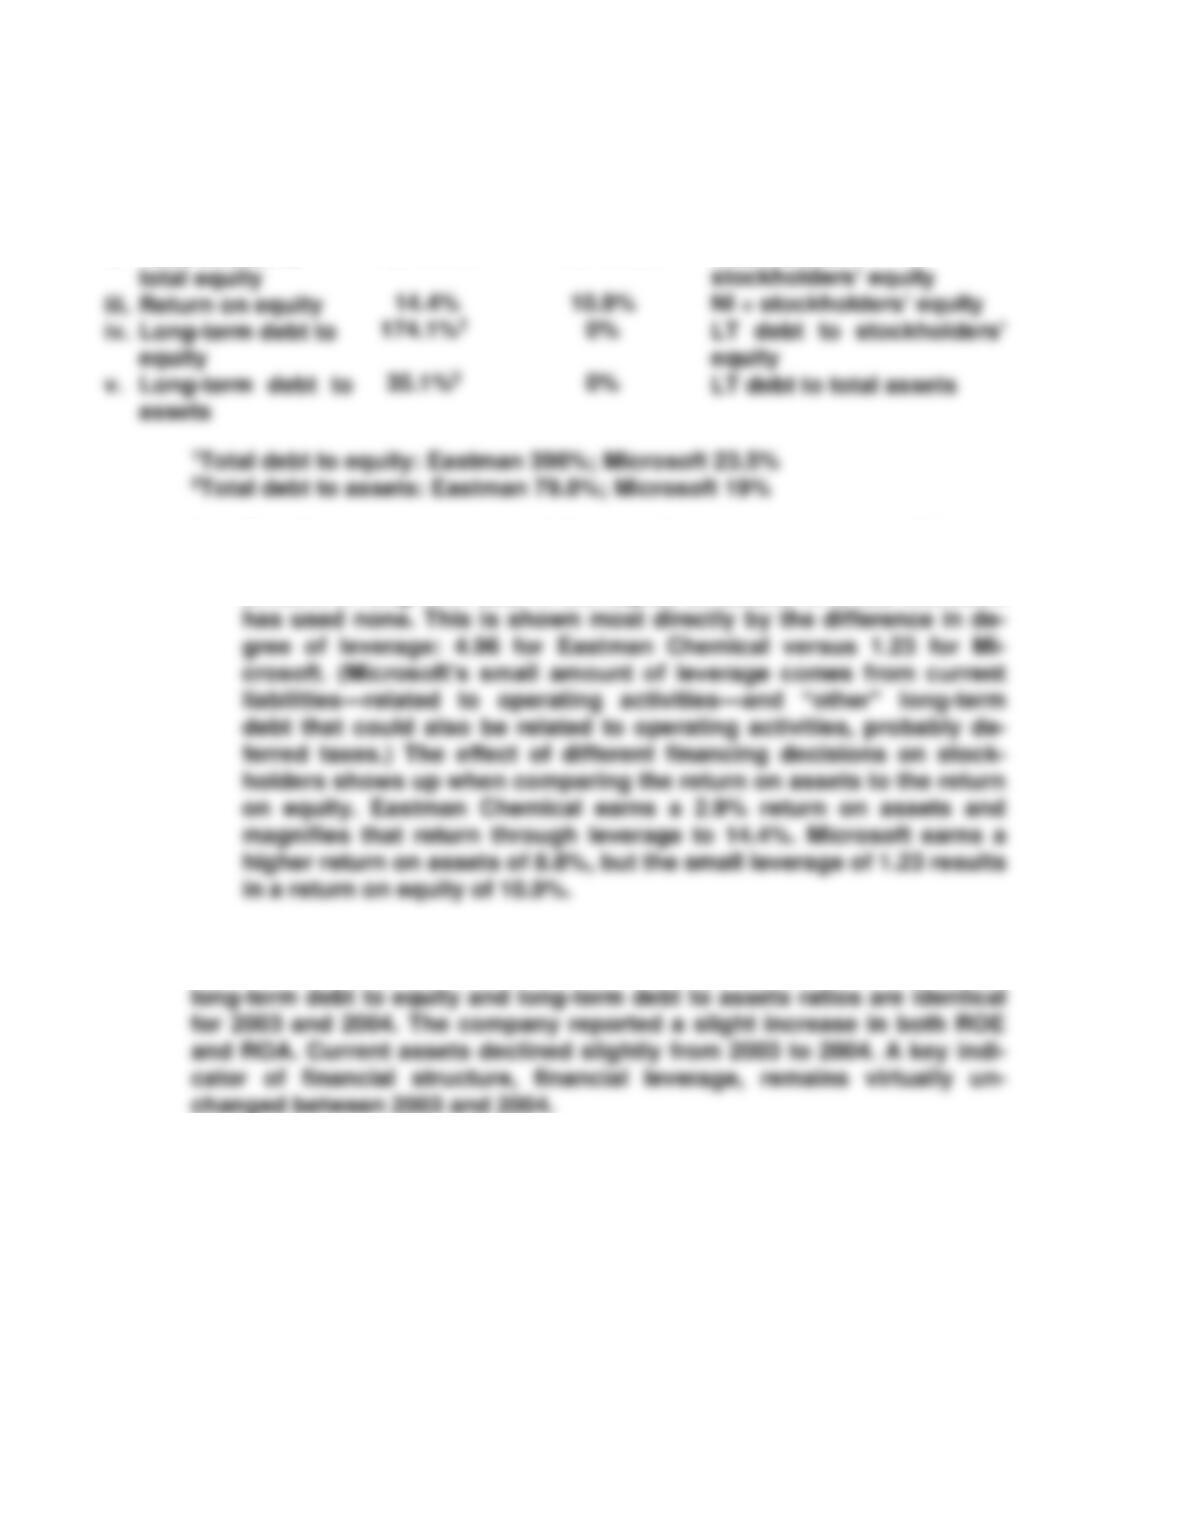
E10-16 a.
Eastman
Chemical
Microsoft
Formula
i. Return on assets
ii. Total assets to
2.9%
4.96 times
8.8%
1.23 times
NI ÷ total assets
Total assets ÷
b. The financing strategies of the two firms have been very different.
Eastman Chemical has adopted a strategy of using a significant
amount of long-term debt in the capital structure, whereas Microsoft
E10-17 The overall impression from reviewing the financial ratios of Wal-Mart is
that the company’s financial structure is very stable. For example, the
Analysis of Financing Activities 279
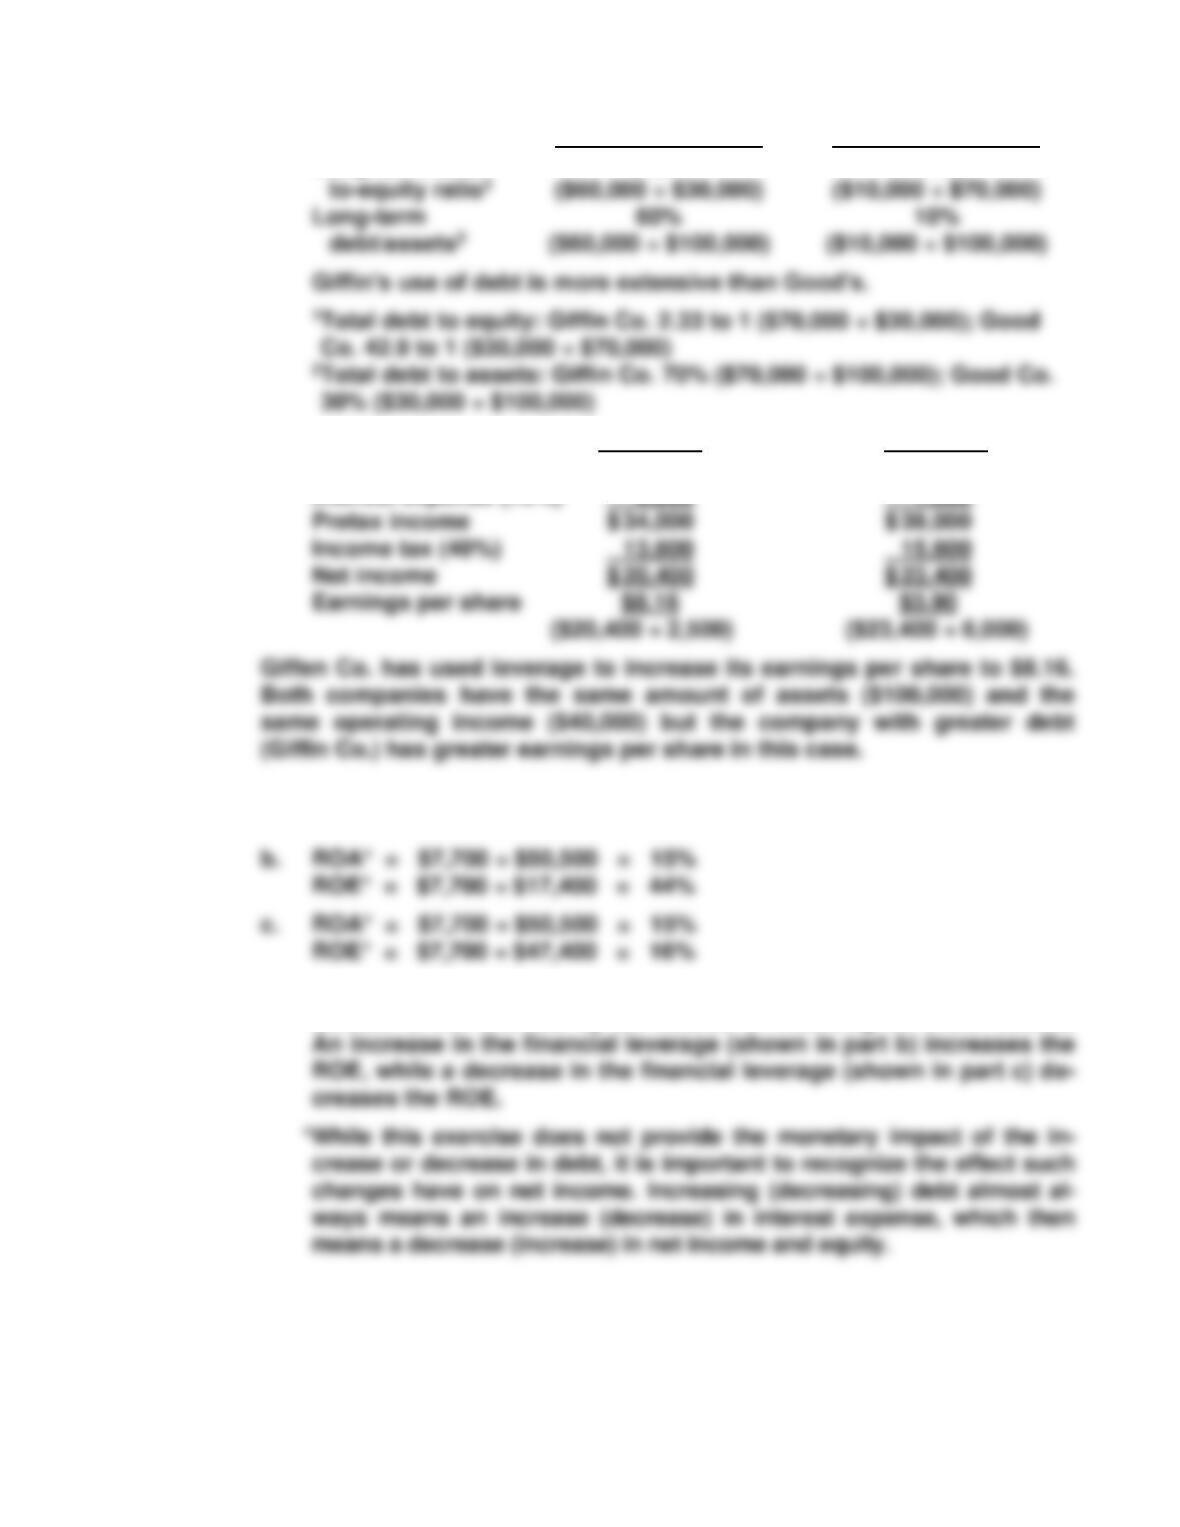
E10-18 a. Giffin Co. Good Co.
Long-term debt- 2 to 1 0.14 to 1
b. Giffin Co. Good Co.
Operating income $ 40,000 $ 40,000
Interest expense (10%) 6,000 1,000
E10-19 a. ROA = $7,700 ÷ $50,500 = 15%
ROE = $7,700 ÷ $35,400 = 22%
d. Financial leverage does not affect ROA because the total asset
amount is not affected by the source of financing for those assets.
280 Chapter 10
E10-20 It is helpful to compute the two companies’ dividend payout ratios (divi-
dends ÷ net income).
Dividend payout ratio
2004
2003
2002
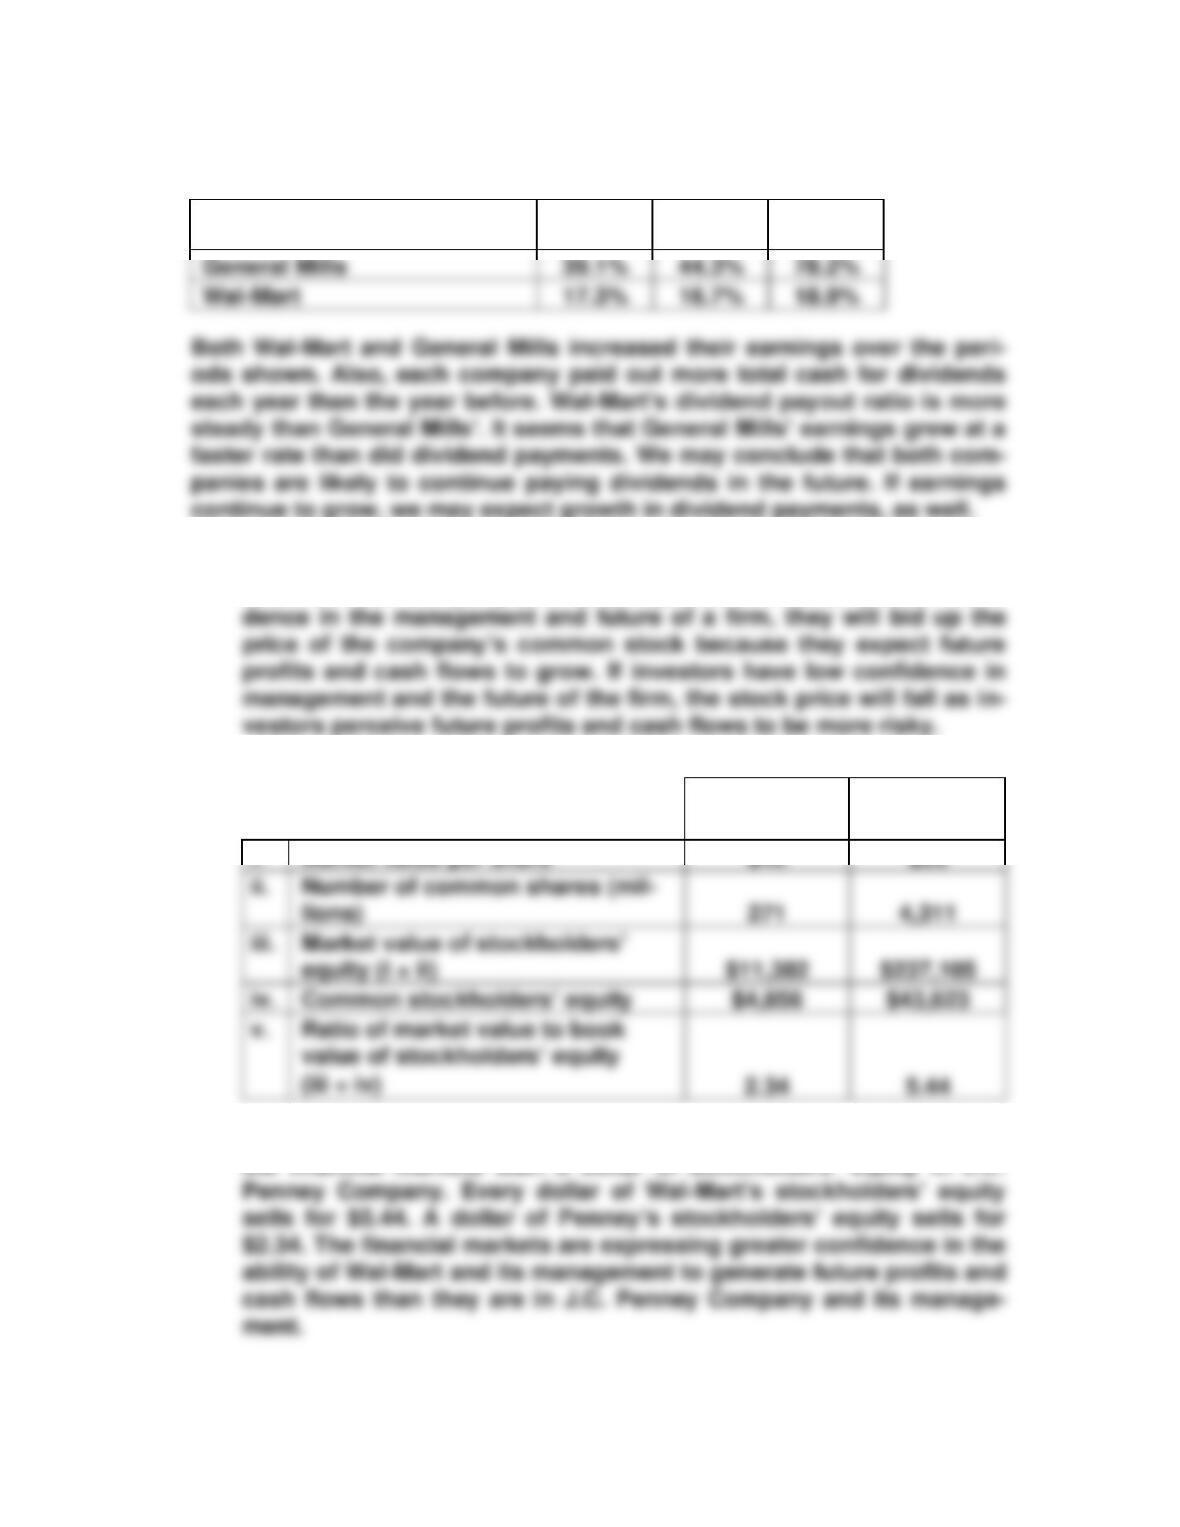
E10-21 a. The market-to–book-value ratio is a measure of how favorably inves-
tors view the company and its prospects. If investors have confi-
b.
J.C. Penney
Company
Wal-Mart
c. A dollar of stockholders’ equity in Wal-Mart is valued more highly by
the financial markets than a dollar of stockholders’ equity in J.C.
Analysis of Financing Activities 281
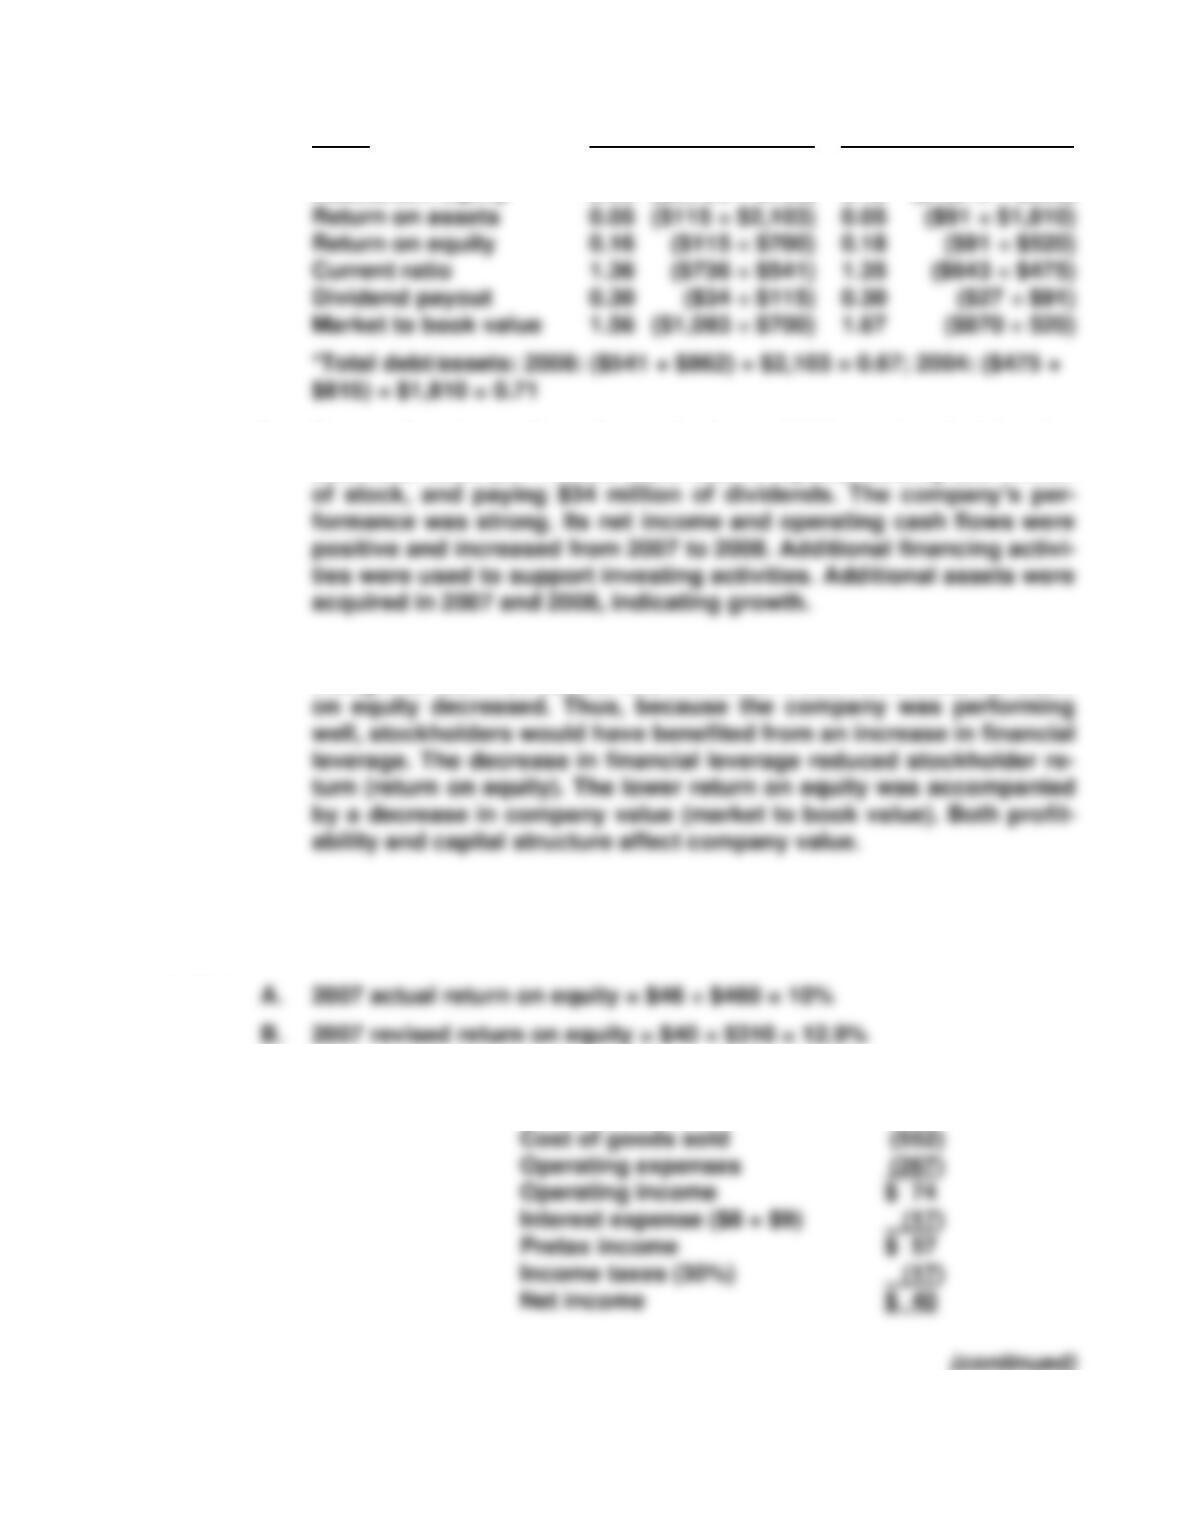
E10-22 a. Ratio 2008 2007
Long-term debt/assets* 0.41 ($862 ÷ $2,103) 0.45 ($815 ÷ $1,810)
Assets/stk. equity 3.00 ($2,103 ÷ $700) 3.48 ($1,810 ÷ $520)
b. Register’s primary financing activities in 2008 consisted of issuing
additional debt ($31 million more than it repaid), issuing $85 million
c. Register’s financial leverage decreased during 2008. Therefore,
though its return on assets was the same in 2007 and 2008, its return
PROBLEMS
P10-1
Proof: Revised 2007 income statement (in millions):
Sales $ 893
282 Chapter 10
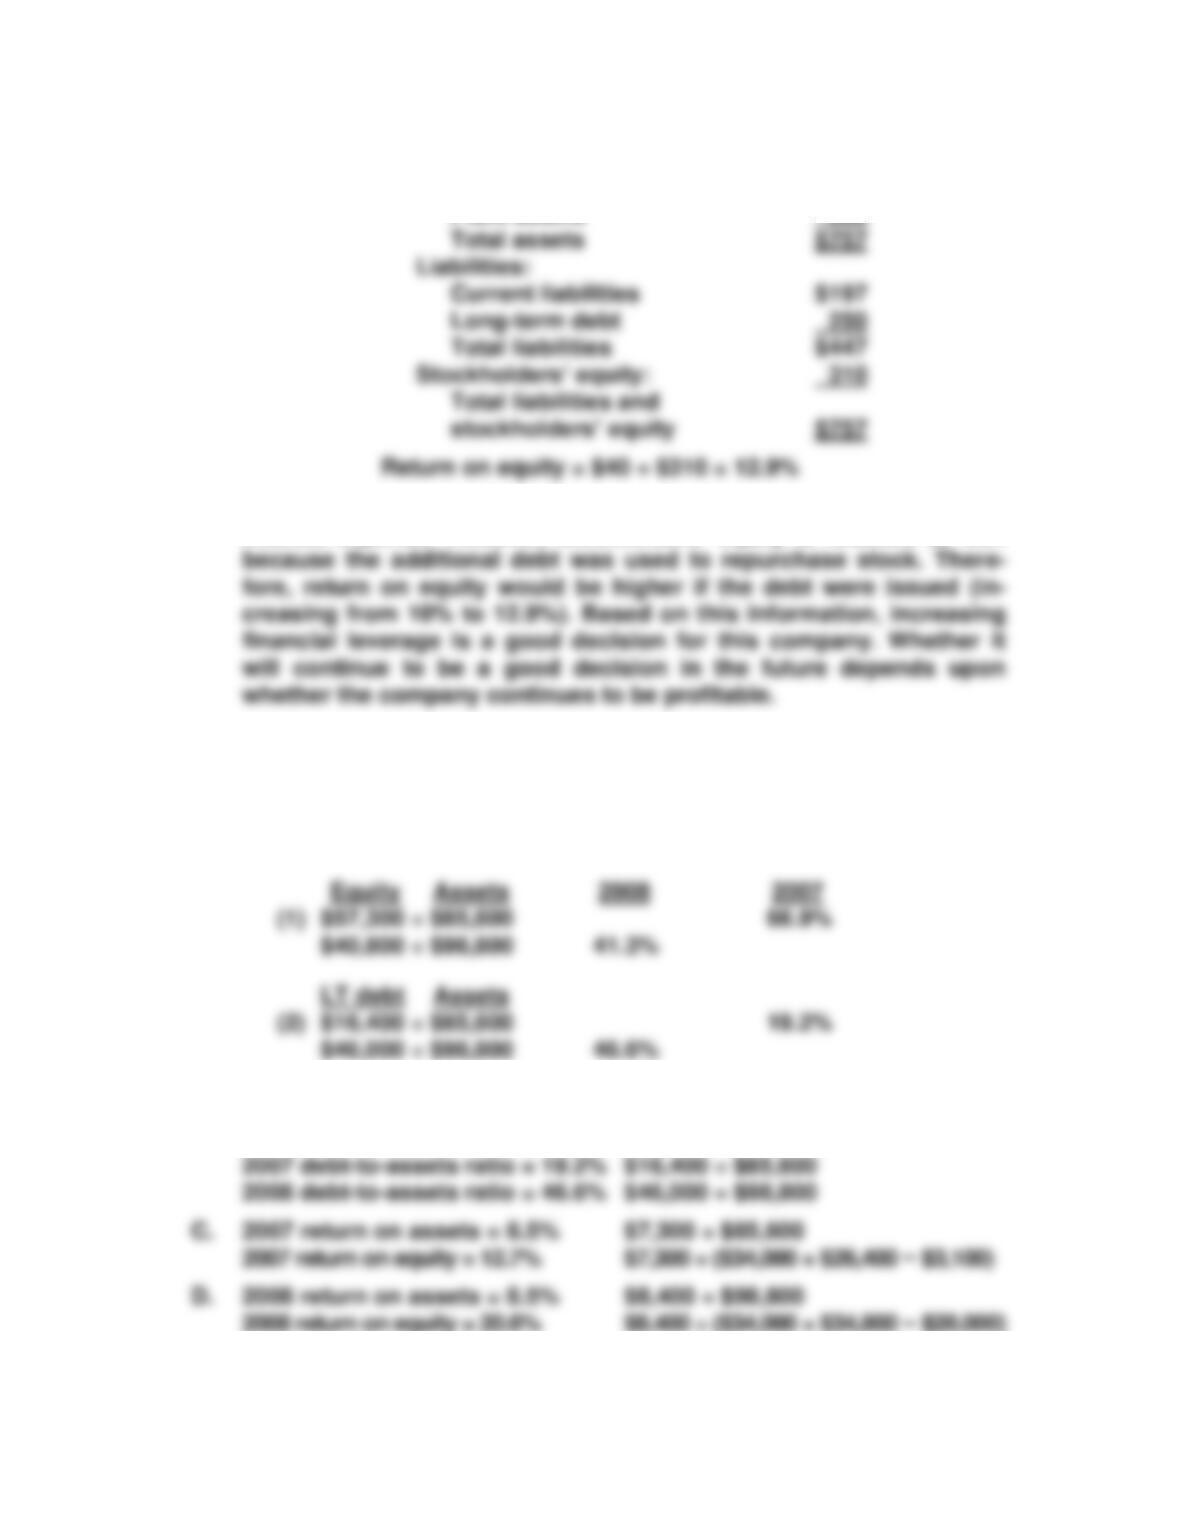
Revised year-end 2007 balance sheet (in millions):
Assets:
Current assets $ 252
Plant assets 505
C. Issuing additional debt reduces net income because of the additional
interest expense. However, stockholders’ equity is reduced as well
P10-2
A. There was a significant change in capital structure during 2008. The
portion of capital provided by equity (1) was decreased and the por-
tion provided by long-term debt (2) was increased.
B. 2007 debt–to–equity ratio = 28.6% $16,400 ÷ ($34,000 + $26,400 − $3,100)
2008 debt–to–equity ratio = 112.7% $46,000 ÷ ($34,000 + $34,800 − $28,000)
Analysis of Financing Activities 283
E. The change in capital structure increased financial leverage by a
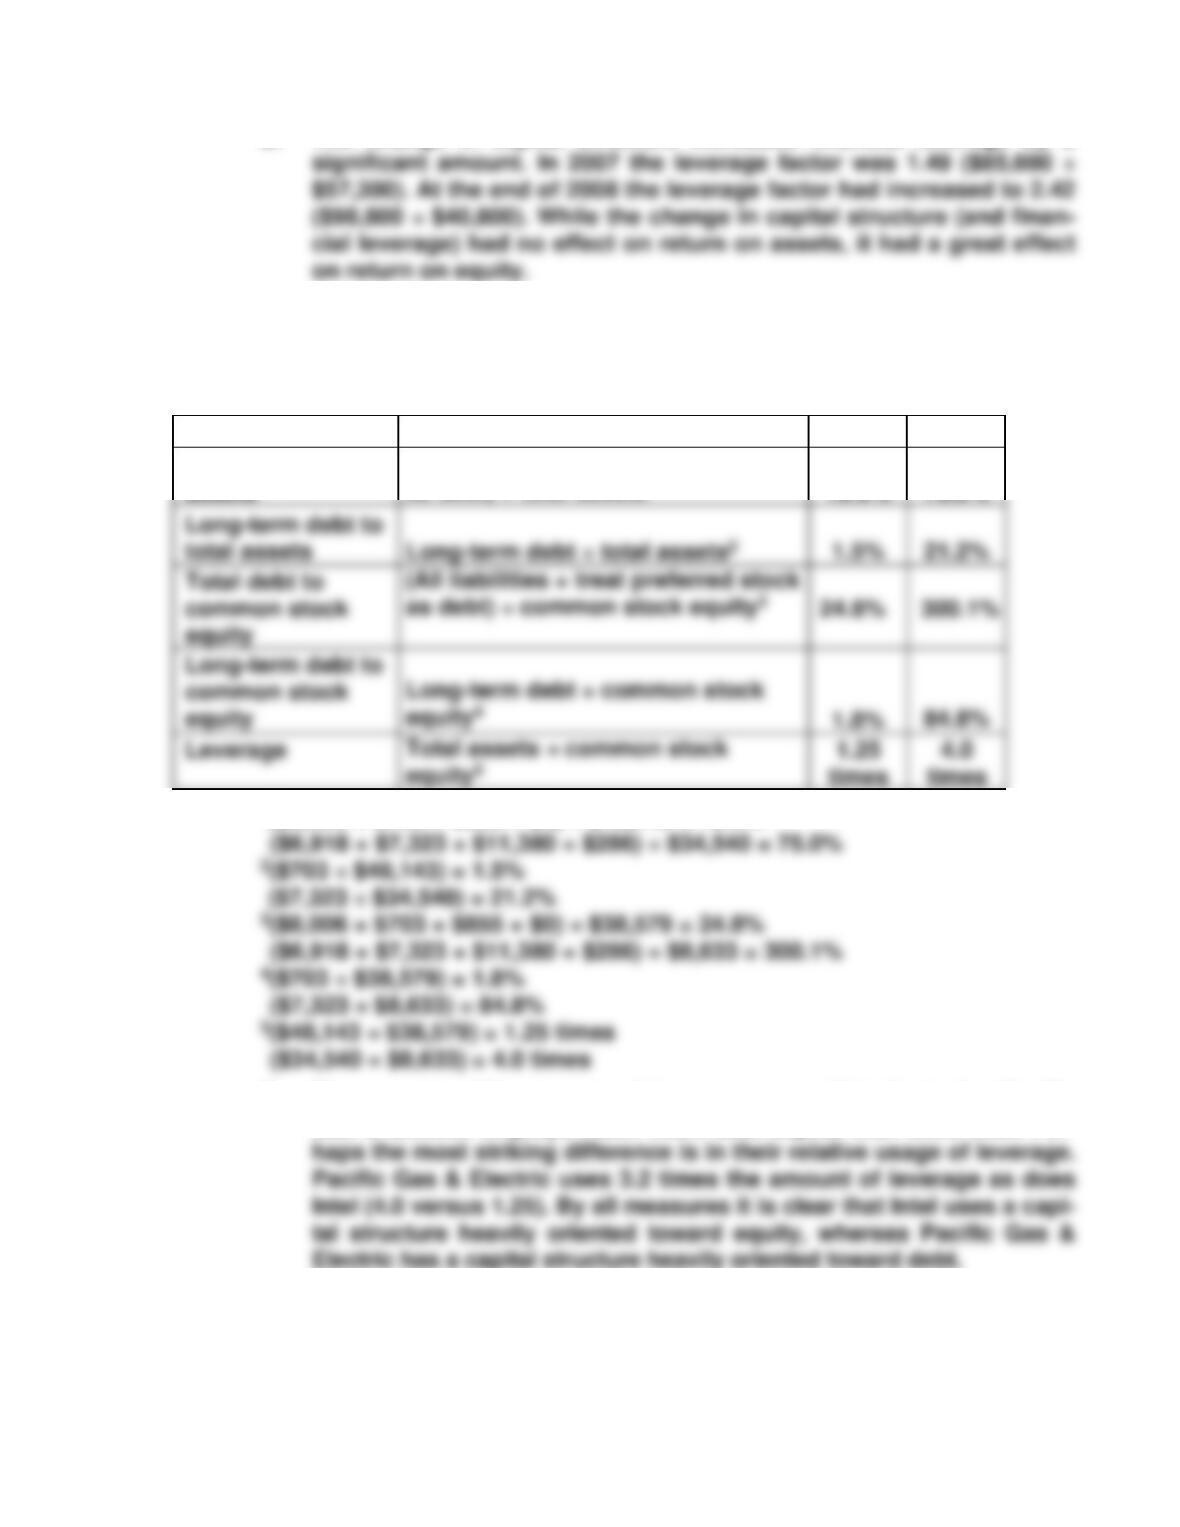
P10-3 A. The following measures (only three were required) can be used to
compare capital structure among companies. Their values, using the
data given, are as follows:
Ratio
Calculation
Intel
PG&E
Total debt to total
assets
(All liabilities + treat preferred stock
as debt) ÷ total assets1
19.9%
75.0%
1($8,006 + $703 + $855 + $0) ÷ $48,143 = 19.9%
B. There are big differences in all four measures. All indicate that Pacific
Gas & Electric employs much more debt capital than does Intel. Per-
C. The companies are in very different industries. Pacific Gas & Electric
is in a stable, somewhat regulated industry. A fairly stable source of
revenues permits it to support a high amount of financial leverage.
284 Chapter 10
(continued)
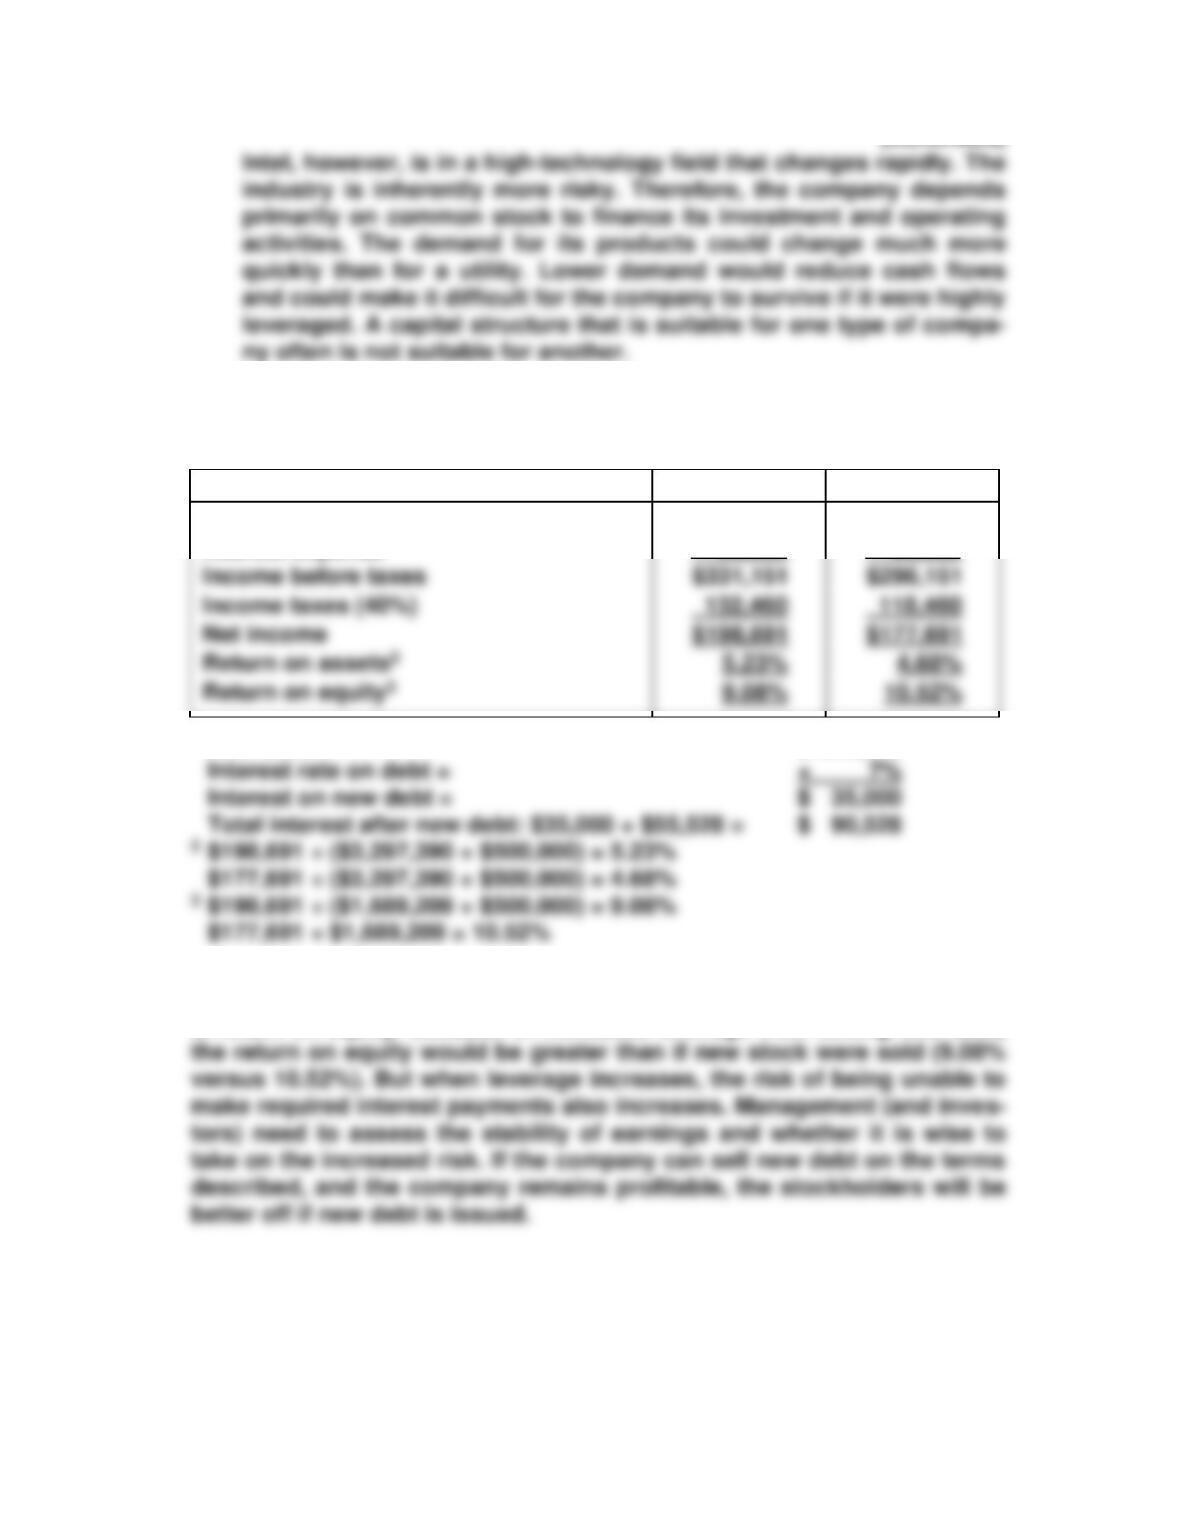
P10-4 Baker Mountain Company
Pro Forma Income Statement
Dollars in thousands
Equity
Debt
Operating income
$386,679
$386,679
Interest expense
55,528
90,5281
Income before taxes
$331,151
$296,151
Income taxes (40%)
132,460
118,460
Net income
$198,691
$177,691
5.23%
4.68%
1 New debt = $ 500,000
If new stock were sold, the return on assets would be greater than if new
debt were sold (5.23% versus 4.68%). The preferable measure, however,
is return on equity. Because of increased leverage from selling new debt,