CHAPTER 24 (FIN MAN); CHAPTER 10 (MAN)
EVALUATING DECENTRALIZED OPERATIONS
DISCUSSION QUESTIONS
1. In a centralized operation, all major planning and operating decisions are made by top management.
In a decentralized operation, managers of separate divisions or units are delegated operating
responsibility. The division (unit) managers are responsible for planning and controlling the
operations of their divisions. Divisions are often structured around products, customers, or regions.
5. A division of a decentralized company could be considered the least profitable, even though it
earned the largest amount of operating income, when its return on investment is the lowest. In
this situation, the division would be considered the least profitable per dollar invested in the
division because it generated less profit out of each dollar of assets invested.
6. By dividing operating income by the amount of invested assets, each division is placed on
a comparable basis of operating income per dollar invested.
7. (a) Although a new investment’s rate of return exceeds the minimum acceptable for the company as
a whole, a divisional manager might reject the investment if it would decrease the manager’s current
rate of return. (b) The use of residual income as a performance measure can overcome this
disadvantage of the return on investment.
CHAPTER 24 (FIN MAN); CHAPTER 10 (MAN) Evaluating Decentralized Operations
BASIC EXERCISES
BE 24–1 (FIN MAN); BE 10–1 (MAN)
$81,000 under budget ($36,000 + $45,000)
BE 24–2 (FIN MAN); BE 10–2 (MAN)
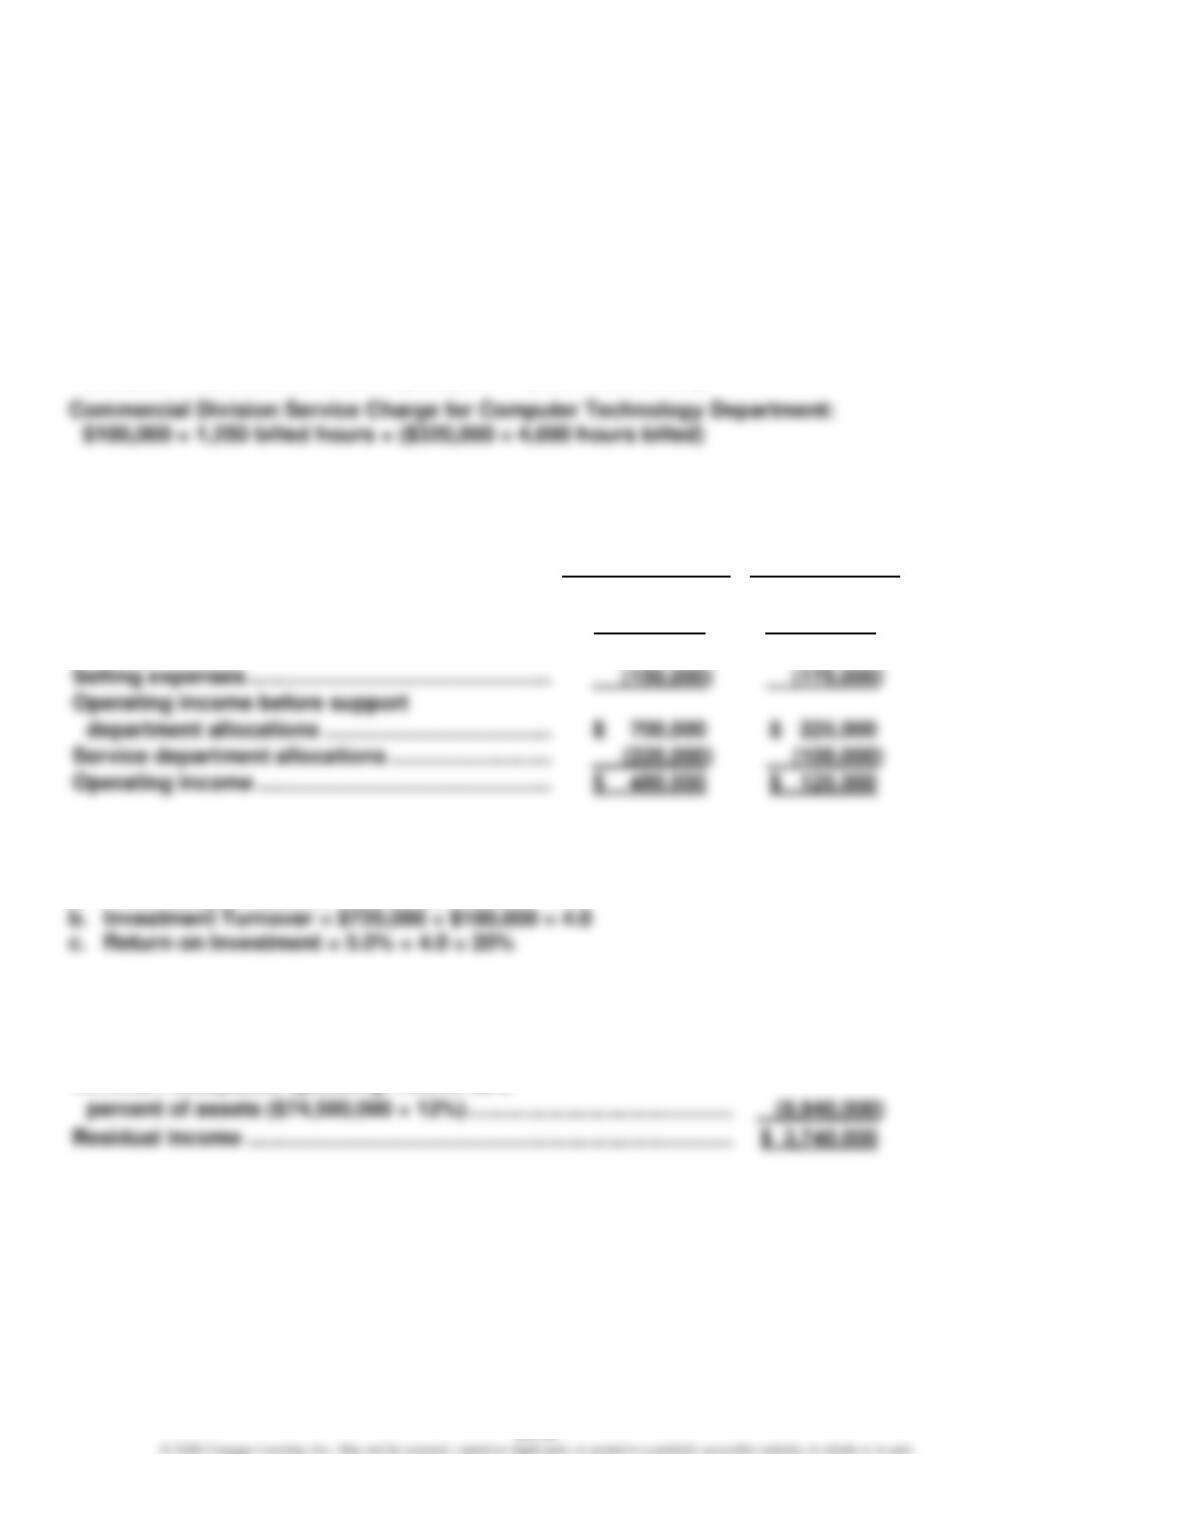
Retail Division Service Charge for Computer Technology Department:
$220,000 = 2,750 billed hours × ($320,000 ÷ 4,000 hours billed)
BE 24–3 (FIN MAN); BE 10–3 (MAN)
Retail
Commercial
Division
Division
Sales …………………………………………………………….
$ 2,150,000
$1,200,000
Cost of goods sold ………………………………………..
(1,300,000)
(800,000)
Gross profit …………………………………………………..
$ 850,000
$ 400,000
Selling expenses ……………………………………………
Operating income before support
Service department allocations ………………………
BE 24–4 (FIN MAN); BE 10–4 (MAN)
a. Profit Margin = $36,000 ÷ $720,000 = 5.0%
BE 24–5 (FIN MAN); BE 10–5 (MAN)
Operating income …………………………………………………………………….
$12,680,000
Minimum acceptable operating income as a

CHAPTER 24 (FIN MAN); CHAPTER 10 (MAN) Evaluating Decentralized Operations
BE 24–6 (FIN MAN); BE 10–6 (MAN)
Increase in Pembroke (Supplying)
Division’s Operating Income
=
(Transfer Price – Variable Cost per Unit)
× Units Transferred
=
($82 – $75) × 15,000 units = $105,000
Division’s Operating Income
=
× Units Transferred
CHAPTER 24 (FIN MAN); CHAPTER 10 (MAN) Evaluating Decentralized Operations
EXERCISES
Ex. 24–1 (FIN MAN); Ex. 10–1 (MAN)
a.
(a)
$4,300,000
(g)
$8,515,000
(b)
$4,000,000
(h)
$8,200,000
(c)
$300,000
(i)
$315,000
(d)
$8,515,000
(j)
$18,890,000
(f)
$375,000
(l)
$315,000
Schedules of supporting calculations (answers in italics; the solution requires working
from the department level, up to the plant level, then to the vice president of production
level):
Delmar Company
Budget Performance Report—Vice President, Production
For the Month Ended June 30
Plant
Actual
Budget
Over
Budget
(Under)
Budget
Eastern Region
$ 4,200,000
$ 4,250,000
$(50,000)
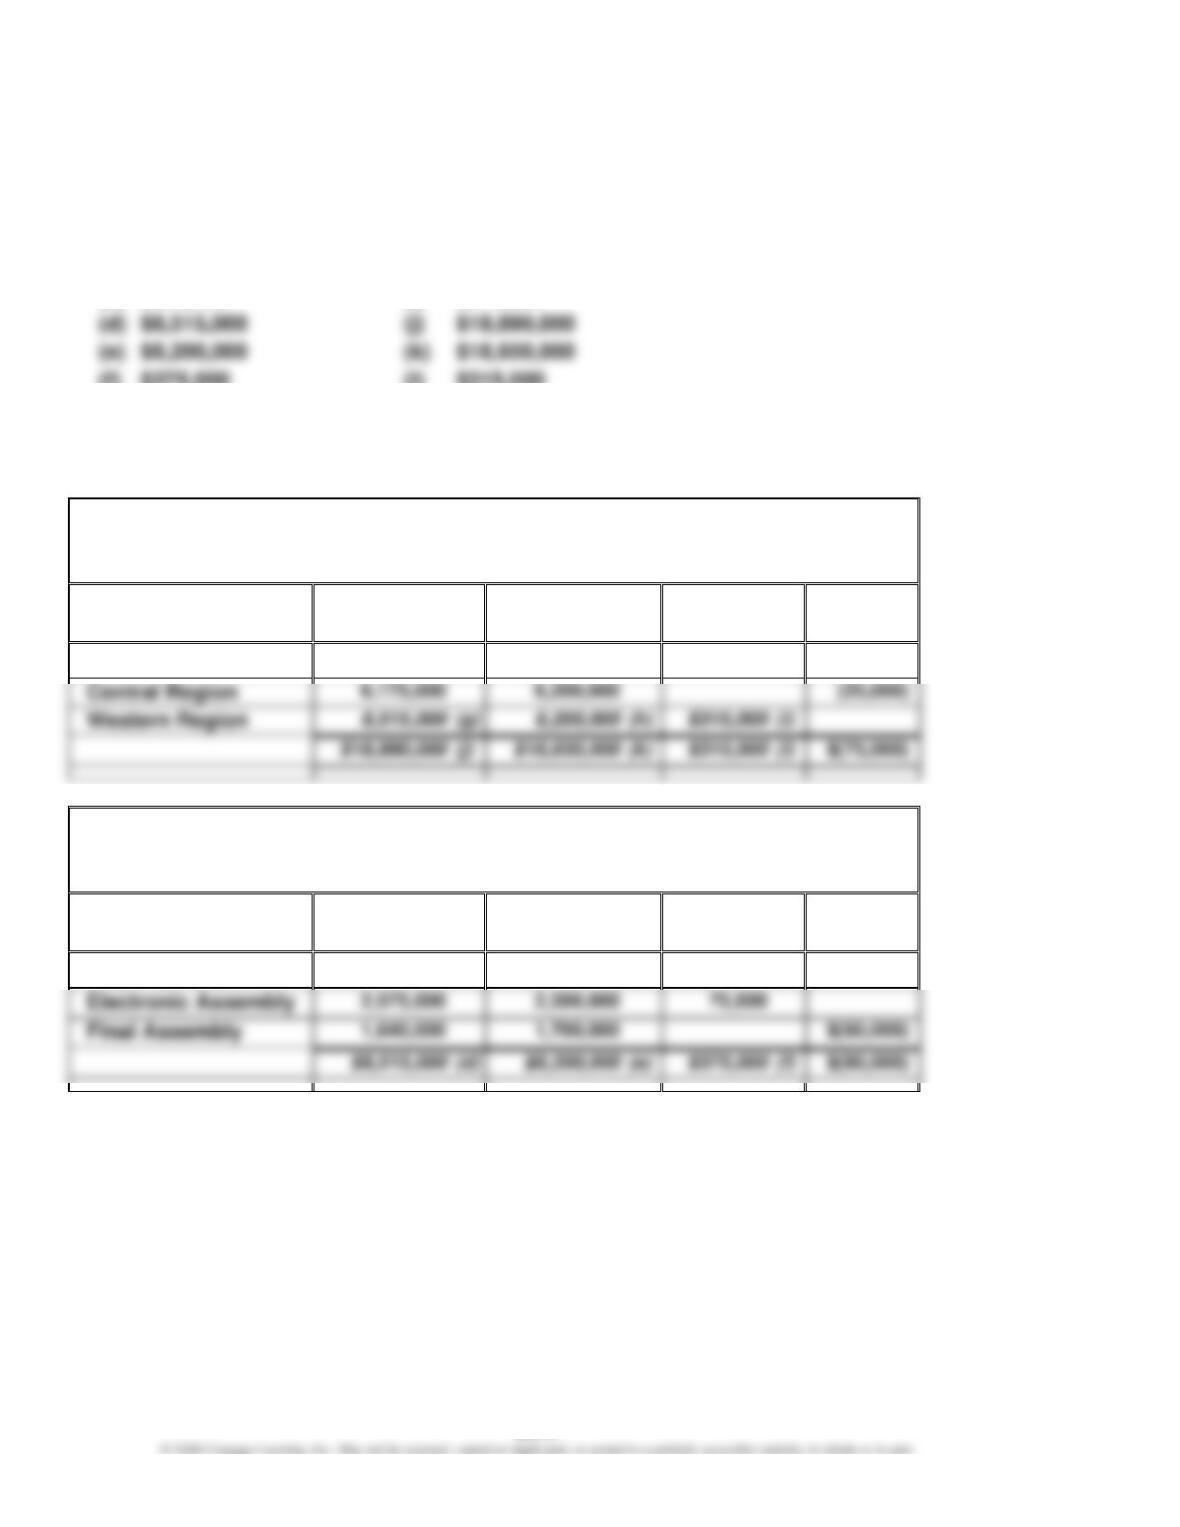
Delmar Company
Budget Performance Report—Manager, Western Region Plant
For the Month Ended June 30
Department
Actual
Budget
Over
Budget
(Under)
Budget
Chip Fabrication
$4,300,000
(a)
$4,000,000
(b)
$300,000
(c)
CHAPTER 24 (FIN MAN); CHAPTER 10 (MAN) Evaluating Decentralized Operations
Ex. 24–1 (FIN MAN); Ex. 10–1 (MAN) (Concluded)
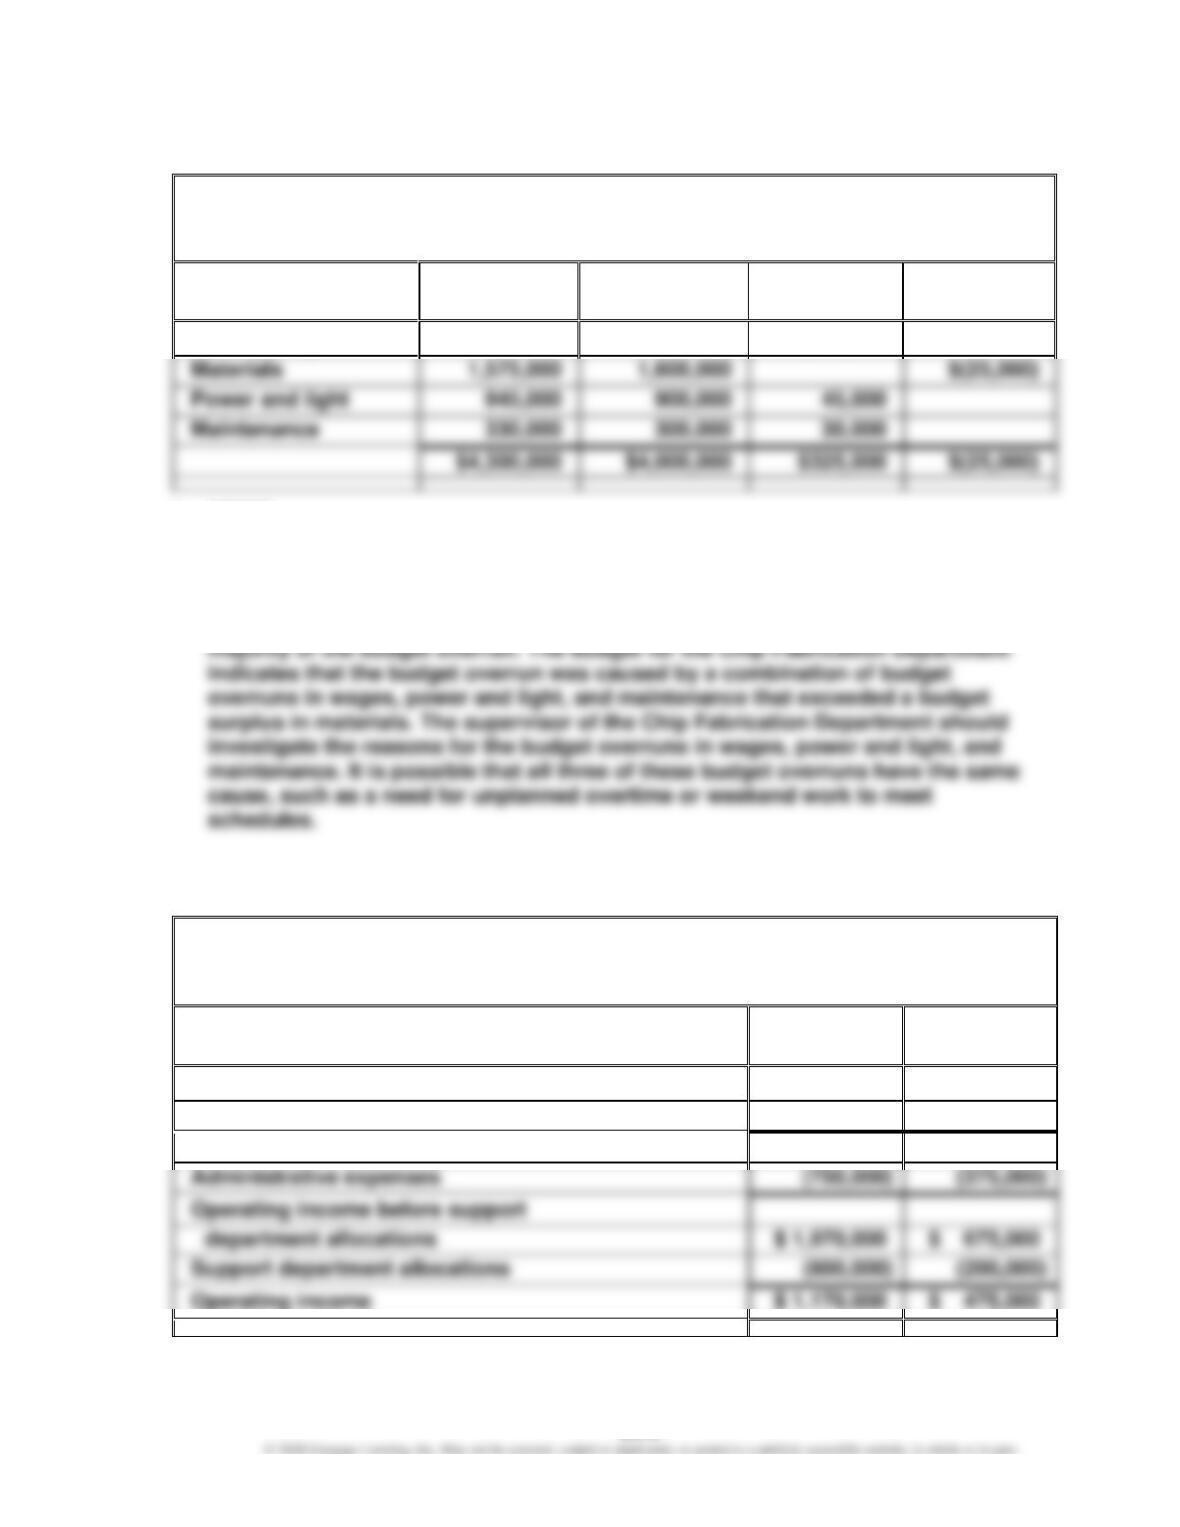
Delmar Company
Budget Performance Report—Supervisor, Chip Fabrication
For the Month Ended June 30
Cost
Actual
Budget
Over
Budget
(Under)
Budget
Factory wages
$1,450,000
$1,200,000
$250,000
Power and light
b. MEMO
To: Randi Wilkes, Vice President of Production
The Western Region plant has experienced a budget overrun, while the Eastern
and Central region plants have experienced a budget surplus. The budget of the
Western Region plant reveals that the Chip Fabrication Department caused the
Ex. 24–2 (FIN MAN); Ex. 10–2 (MAN)
Ruiz Industries Inc.
Divisional Income Statements
For the Year Ended November 30, 20Y8
Commercial
Division
Residential
Division
Sales
$ 6,120,000
$ 2,850,000
Cost of goods sold
(3,400,000)
(1,800,000)
Gross profit
$ 2,720,000
$ 1,050,000
Administrative expenses
Operating income before support
Support department allocations
CHAPTER 24 (FIN MAN); CHAPTER 10 (MAN) Evaluating Decentralized Operations
Ex. 24–3 (FIN MAN); Ex. 10–3 (MAN)
Support Department Costs
Cost Driver
a.
Legal
Number of hours of legal service
b.
Duplication services
Number of pages copied
c.
Electronic data processing
Central processing unit (CPU) time, number of
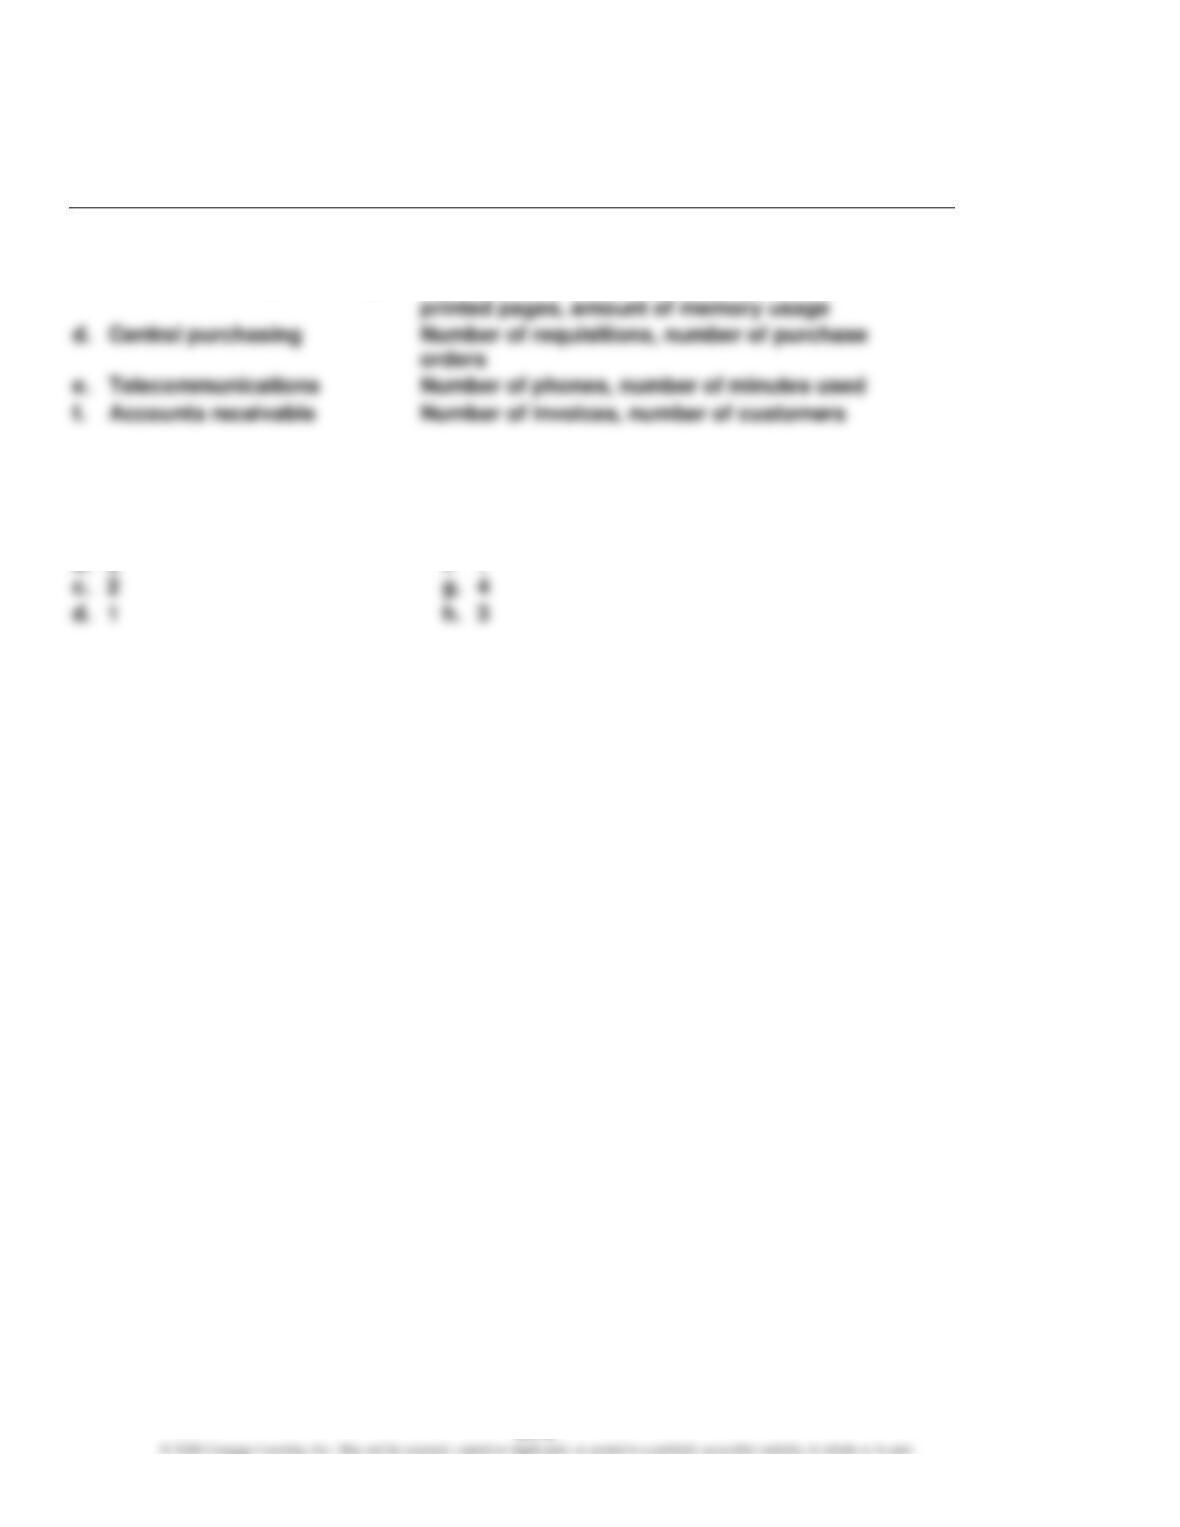
Central purchasing
Number of requisitions, number of purchase
e.
Number of phones, number of minutes used
Ex. 24–4 (FIN MAN); Ex. 10–4 (MAN)
a.
6
e.
8
CHAPTER 24 (FIN MAN); CHAPTER 10 (MAN) Evaluating Decentralized Operations
Ex. 24–5 (FIN MAN); Ex. 10–5 (MAN)
a.
Government
Residential
Commercial
Contract
Total
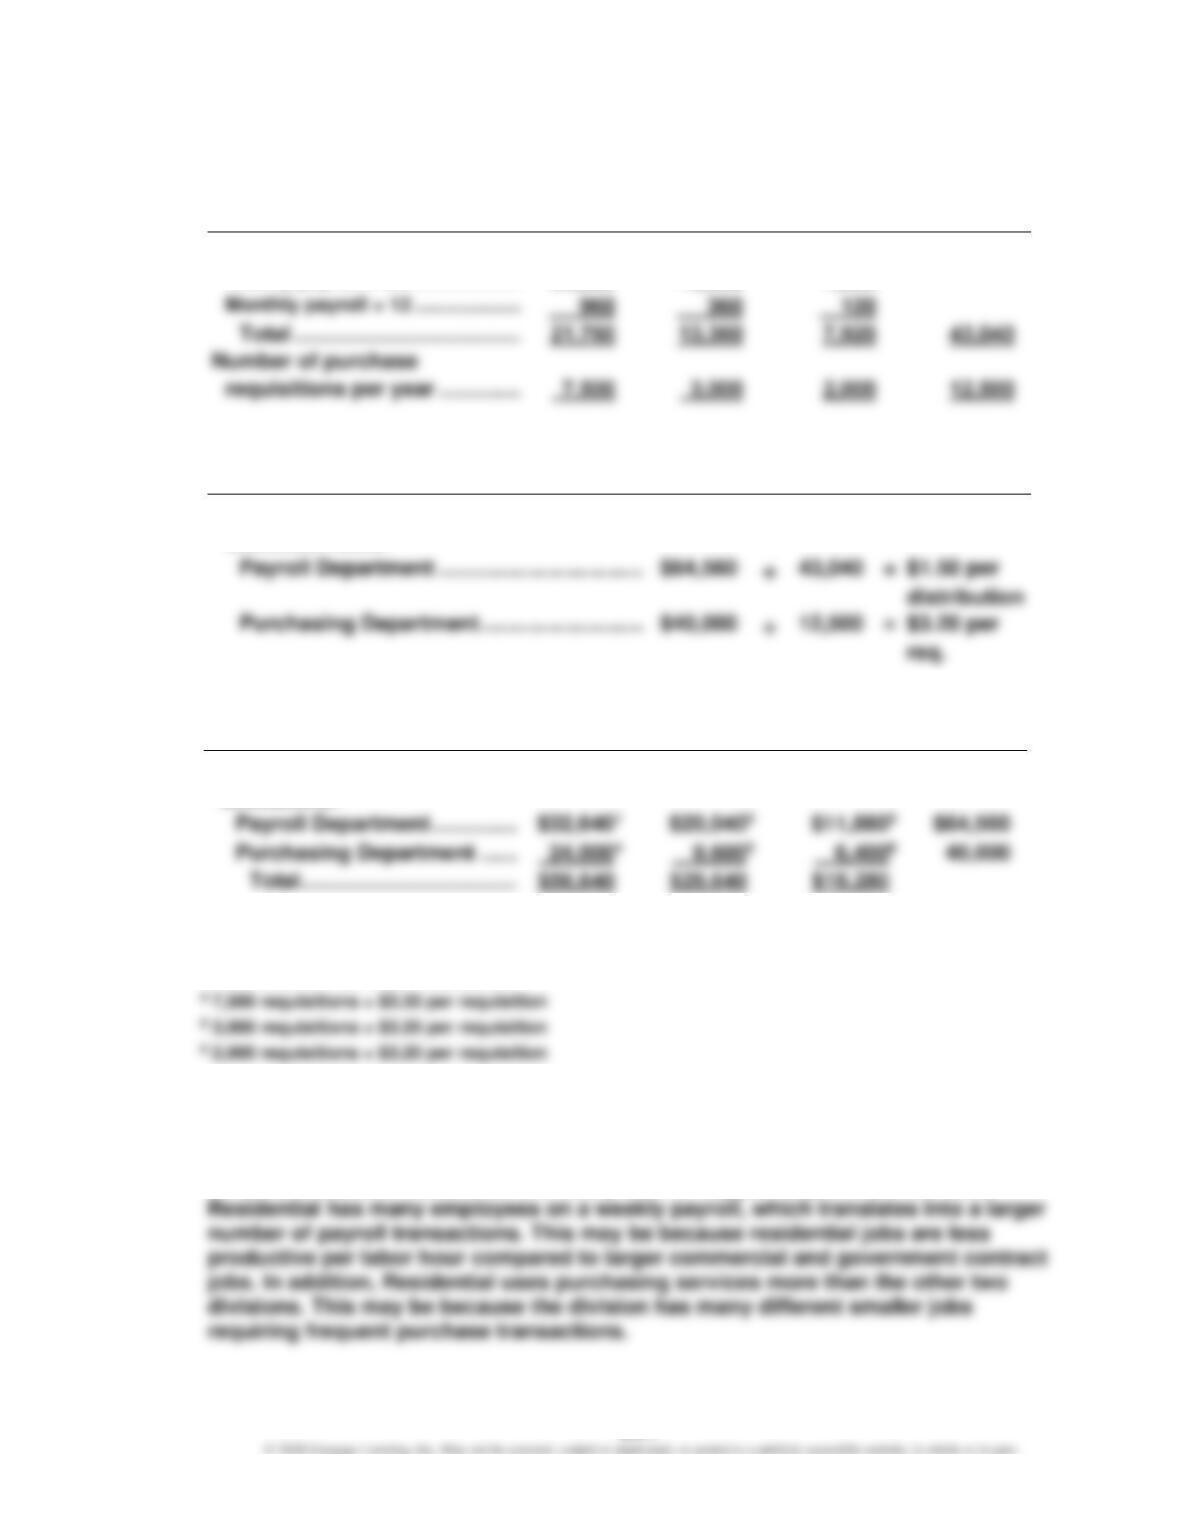
Number of payroll checks:
Monthly payroll × 12 ………………..
Weekly payroll × 52………………….
b.
Service
Cost
Allocation
Dept. Cost
÷
Driver
=
Rate
Support department
÷
÷
allocation rates:
Government
Residential
Commercial
Contract
Total
Support department
1 21,760 checks × $1.50 per distribution
2 13,360 checks × $1.50 per distribution
3 7,920 checks × $1.50 per distribution
The support department allocations are determined by multiplying the support
department allocation rate by the cost driver for each division.
c. Residential’s support department allocations are higher than the other two
divisions because Residential is a heavy user of support department services.
CHAPTER 24 (FIN MAN); CHAPTER 10 (MAN) Evaluating Decentralized Operations
Ex. 24–6 (FIN MAN); Ex. 10–6 (MAN)
a.
$90,000
Help desk : = $25 per call
3,600calls
$120,000
Network center : = $80 per device monitored
1,500devices
$160,000
Electronic mail: =
5,000accounts $32 per user or email account
$72,000
Smartphone support : = $18 per smartphone issued
4,000smartphones
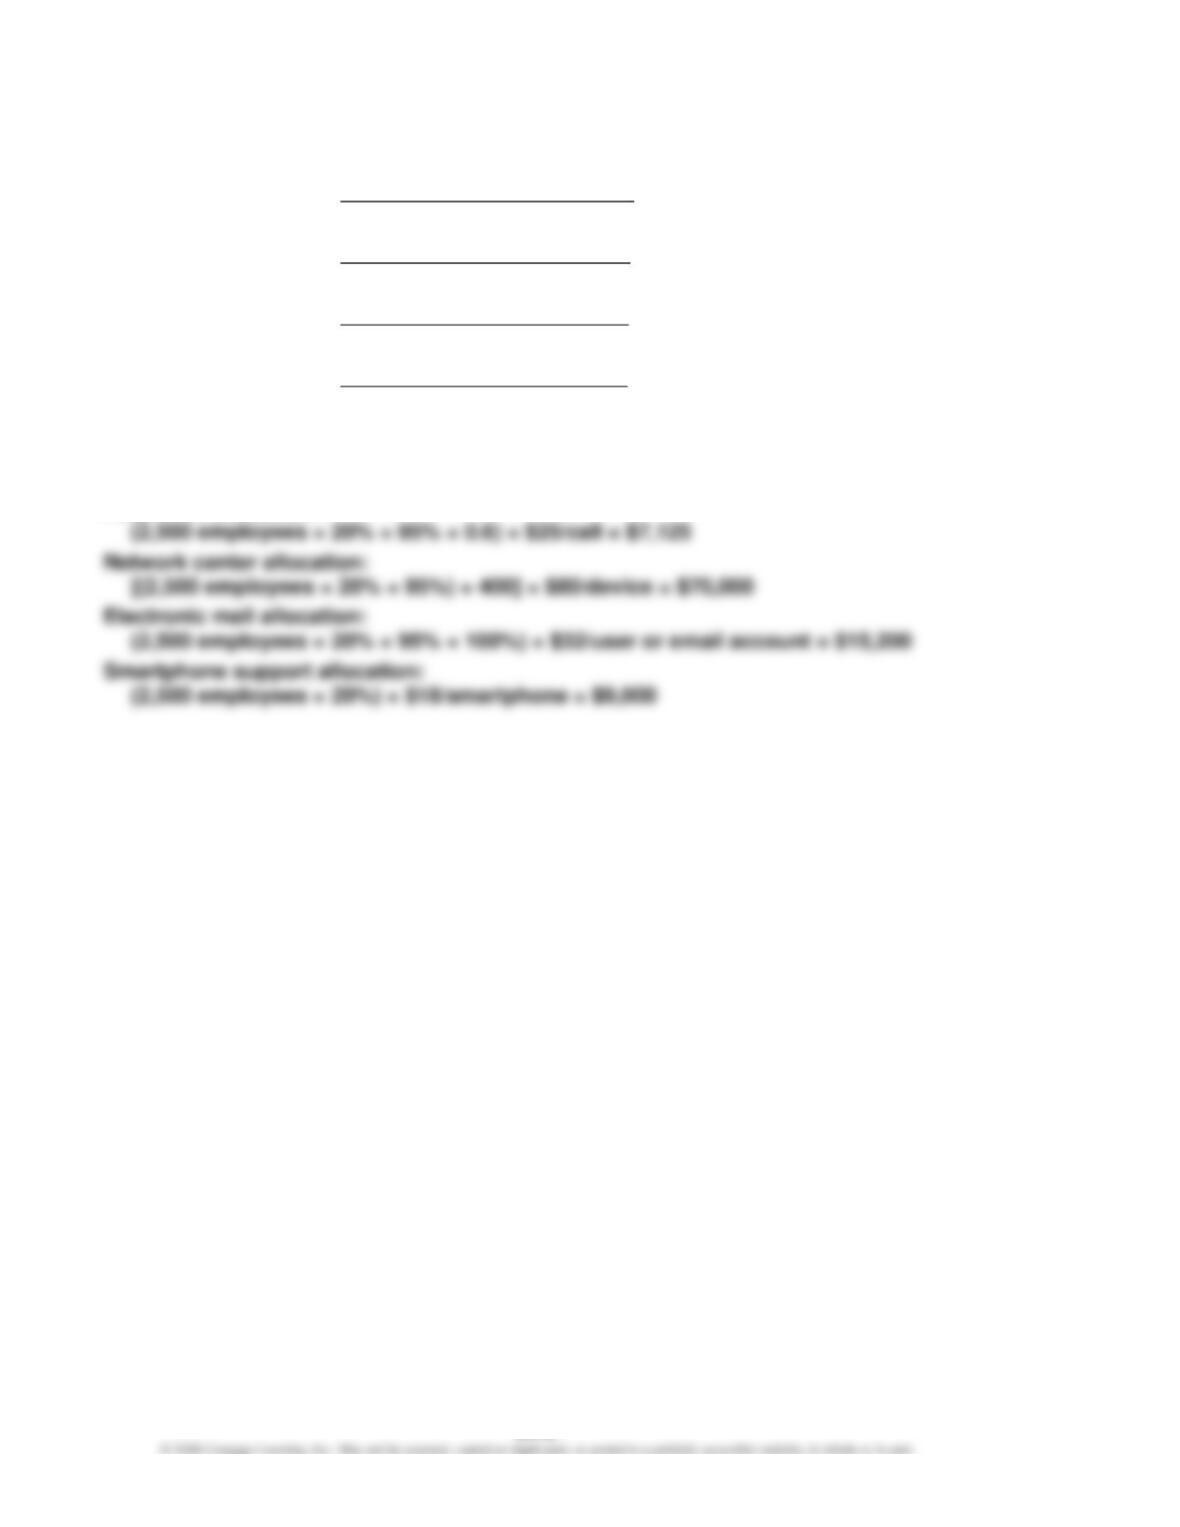
b. August allocations to the COMM:
Help desk allocation:
CHAPTER 24 (FIN MAN); CHAPTER 10 (MAN) Evaluating Decentralized Operations
Ex. 24–7 (FIN MAN); Ex. 10–7 (MAN)
Horton Technology
Divisional Income Statements
For the Year Ended December 31, 20Y7
Consumer
Division
Commercial
Division
Revenues
$ 15,500,000
$ 33,250,000
Cost of goods sold
(10,000,000)
(15,800,000)
Gross profit
$ 5,500,000
$ 17,450,000
Operating expenses
(3,000,000)
(1,750,000)
Operating income before
$ 15,700,000
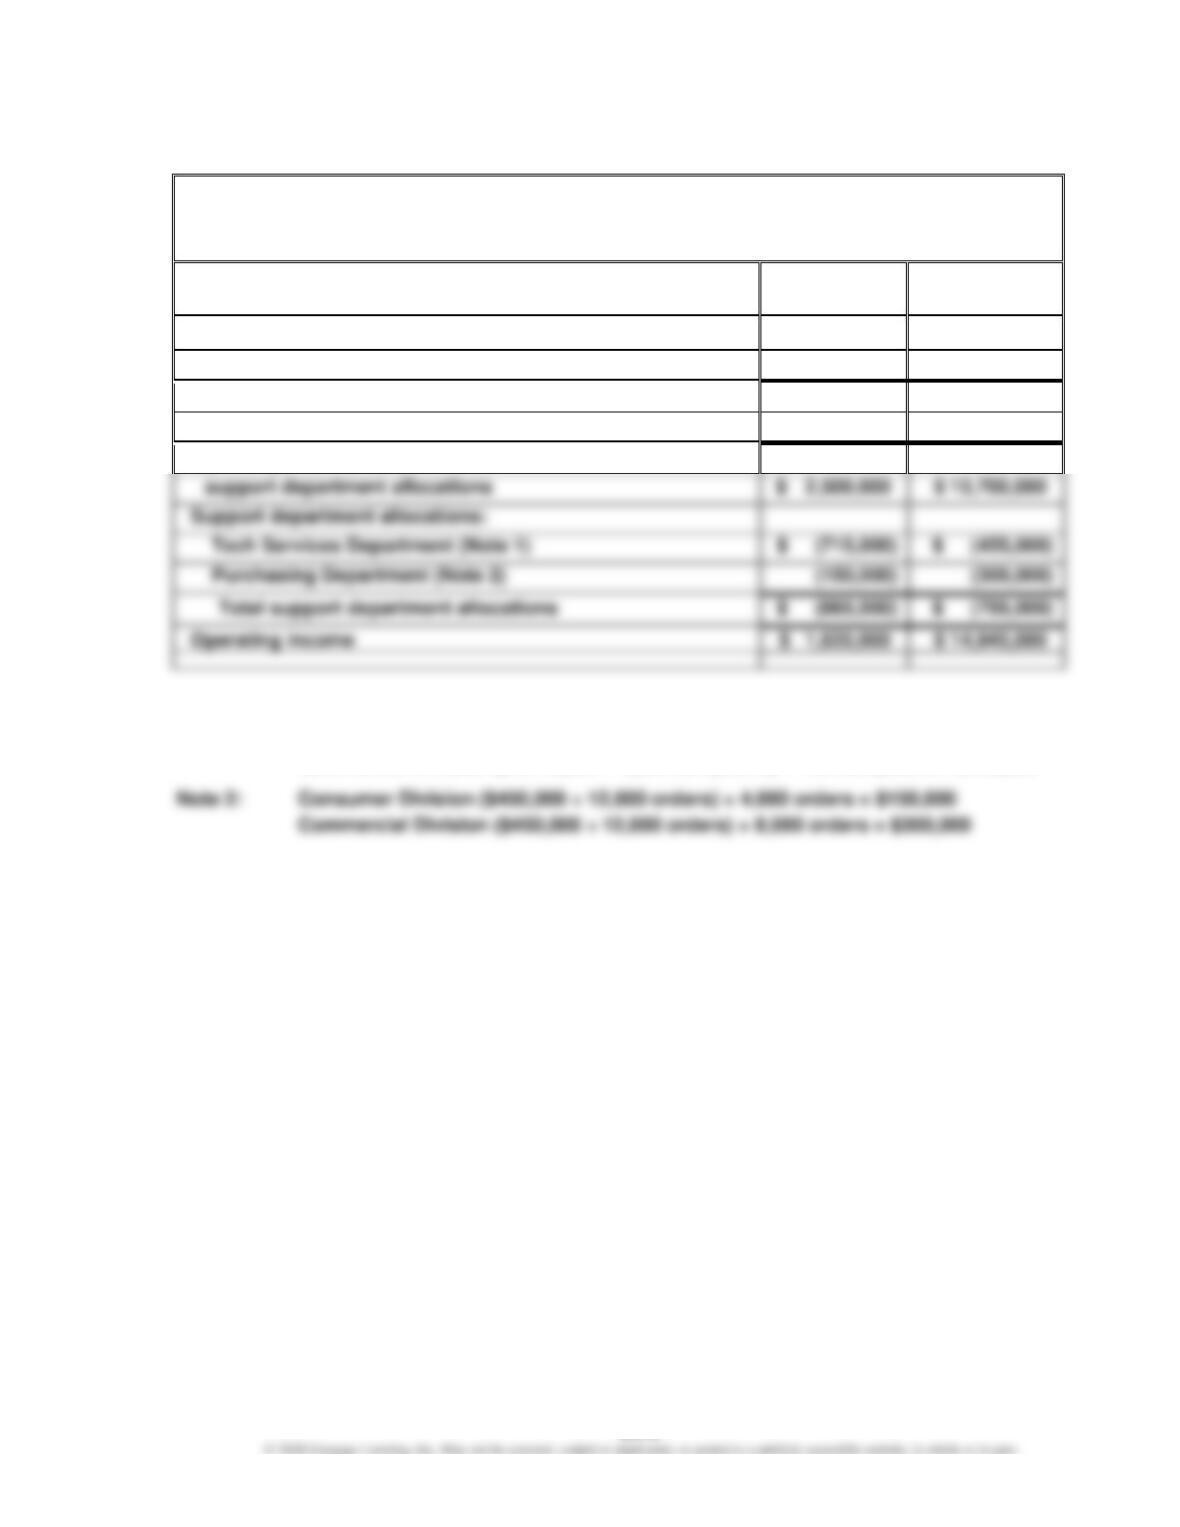
Support department allocations:
Supporting calculations for controllable support department allocations:
Note 1:
Consumer Division ($1,170,000 ÷ 1,800 computers) × 1,100 computers = $715,000
Commercial Division ($1,170,000 ÷ 1,800 computers) × 700 computers = $455,000
CHAPTER 24 (FIN MAN); CHAPTER 10 (MAN) Evaluating Decentralized Operations
Ex. 24–8 (FIN MAN); Ex. 10–8 (MAN)
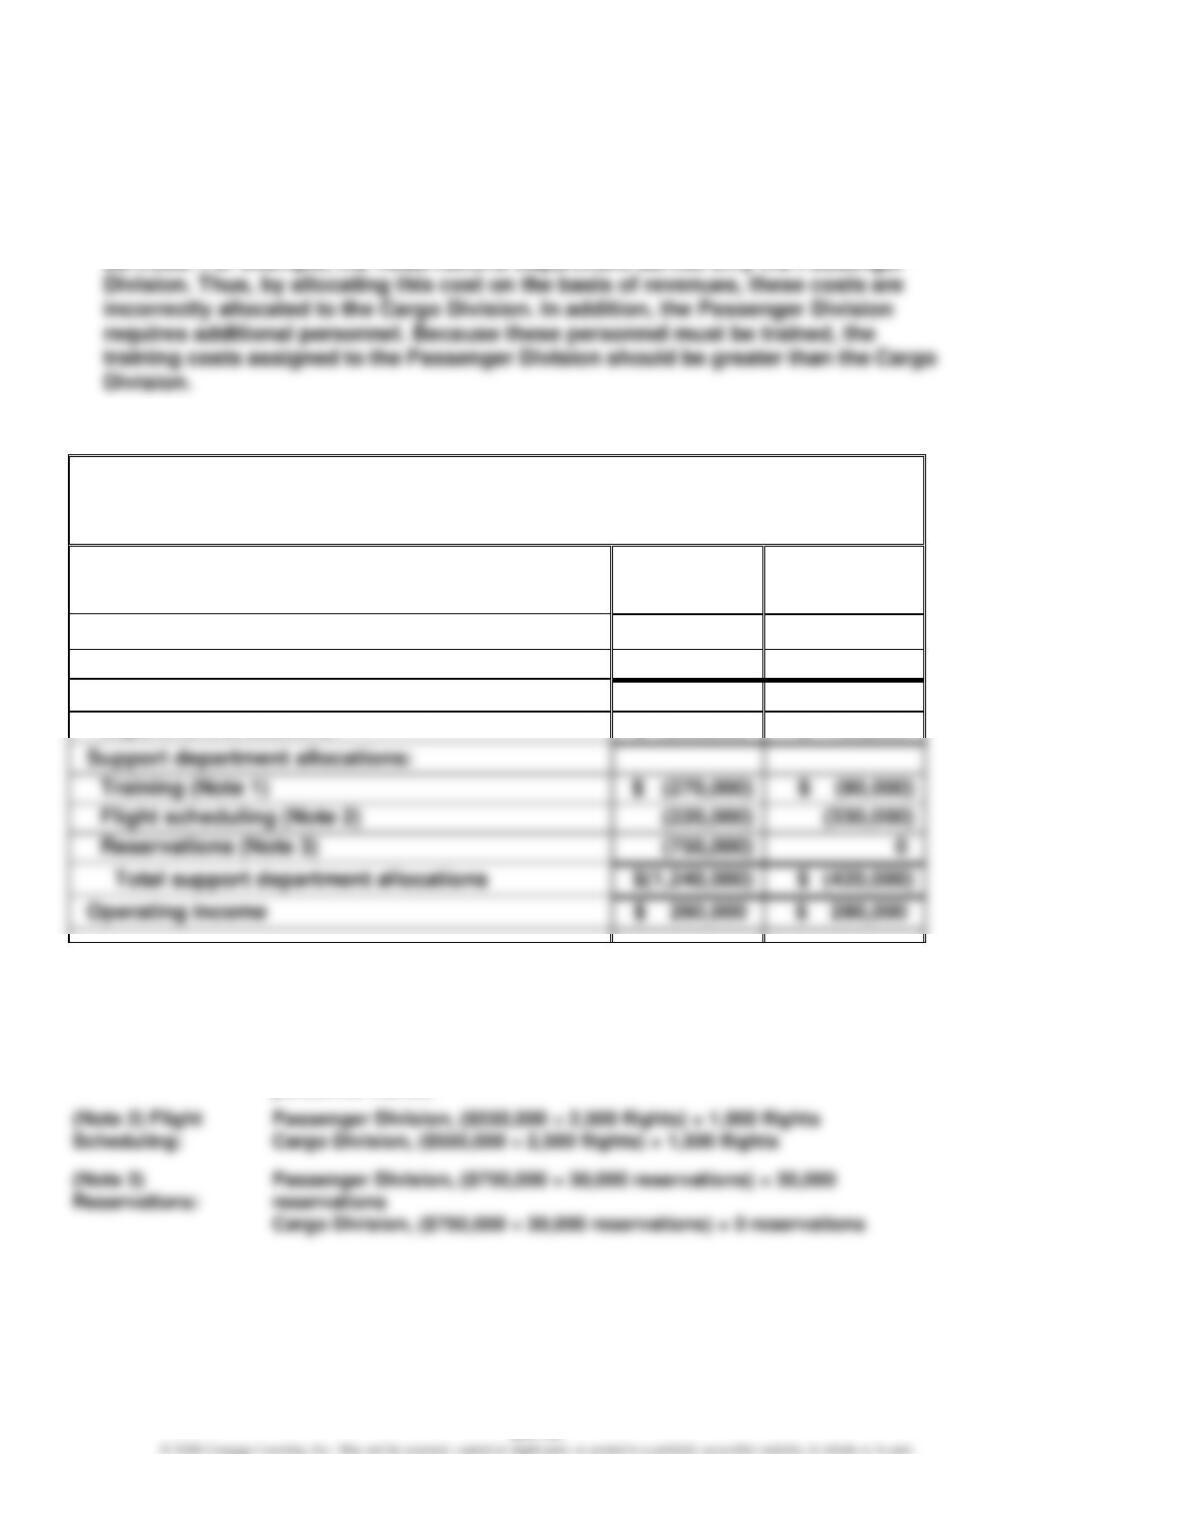
a. The reported operating income does not accurately measure performance because
the support department allocations are based on revenues. Revenues are not
associated with the profit center manager’s use of the support department
b.
Rocky Mountain Airlines Inc.
Divisional Income Statements
For the Year Ended December 31, 20Y9
Passenger
Division
Cargo
Division
Revenues
$ 4,200,000
$ 4,200,000
Operating expenses
(2,700,000)
(3,500,000)
Operating income before support
department allocations:
$ 1,500,000
$ 700,000
Support department allocations:
Flight scheduling (Note 2)
Reservations (Note 3)
Supporting calculations for controllable support department allocations:
(Note 1) Training:
Passenger Division, ($360,000 ÷ 800 personnel trained) × 600
personnel trained
Cargo Division, ($360,000 ÷ 800 personnel trained) × 200
(Note 2) Flight
Passenger Division, ($550,000 ÷ 2,500 flights) × 1,000 flights
(Note 3)
Passenger Division, ($750,000 ÷ 30,000 reservations) × 30,000
personnel trained
CHAPTER 24 (FIN MAN); CHAPTER 10 (MAN) Evaluating Decentralized Operations
Ex. 24–9 (FIN MAN); Ex. 10–9 (MAN)
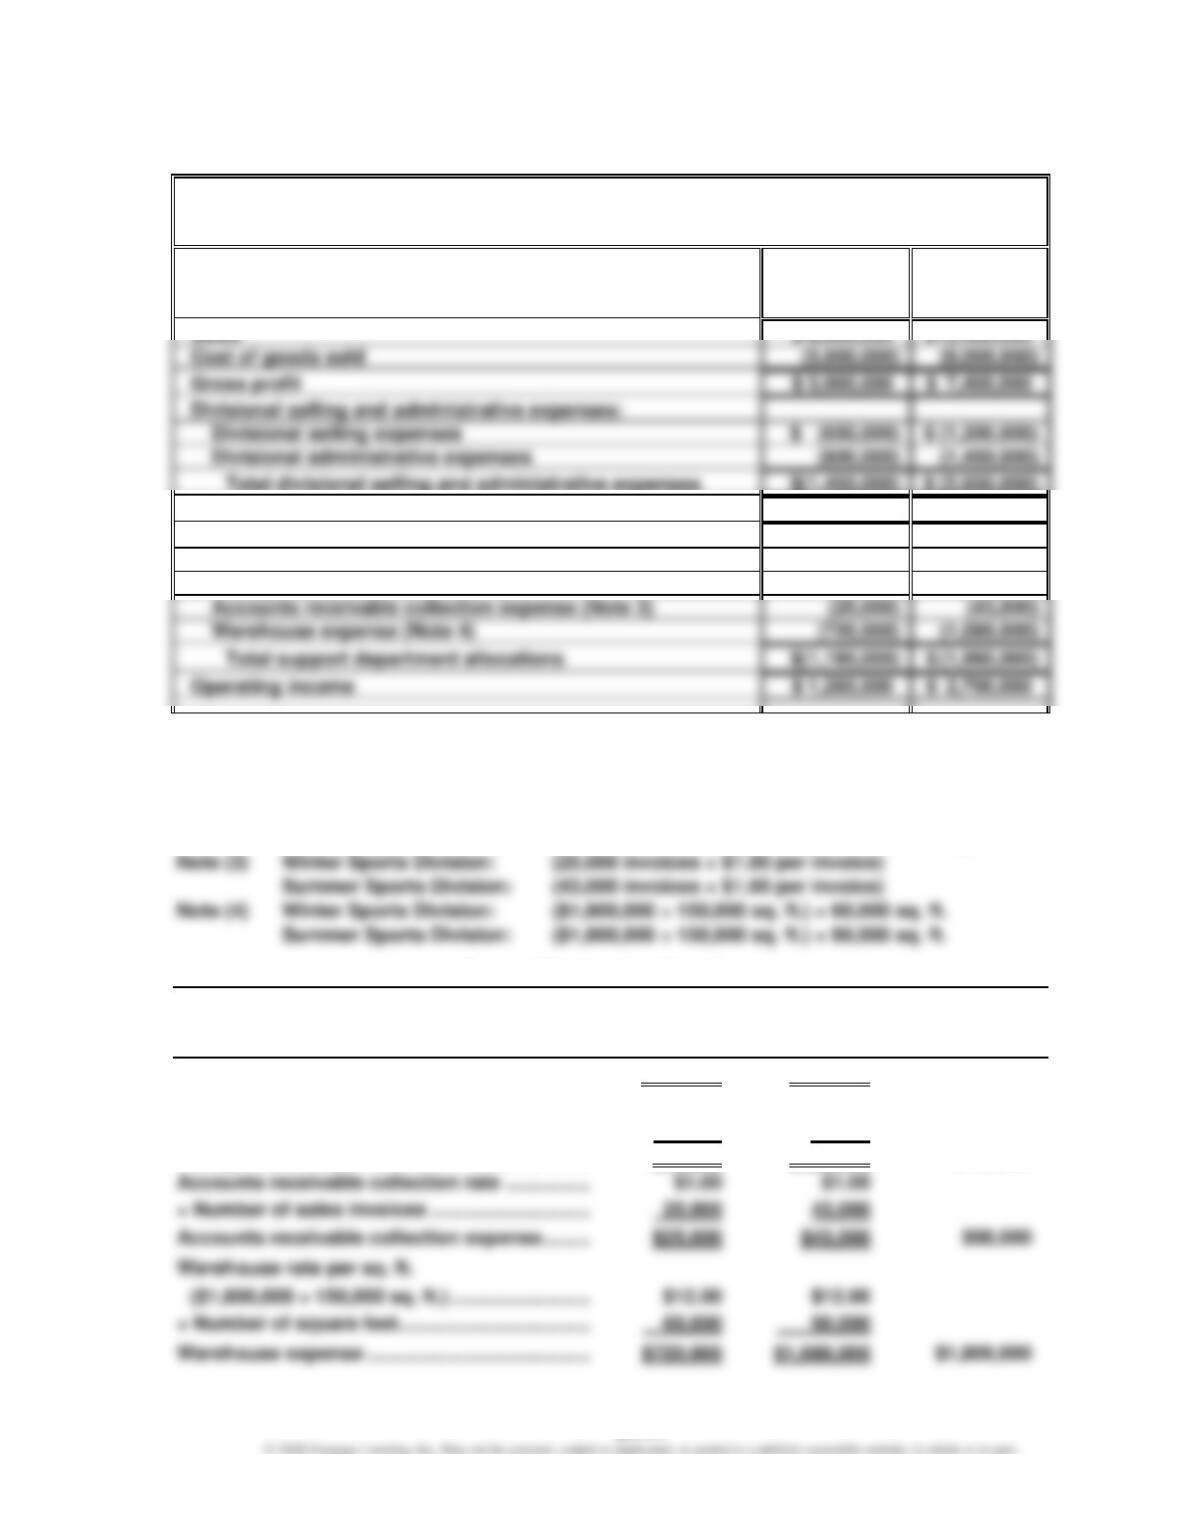
Championship Sports Inc.
Divisional Income Statements
For the Year Ended December 31, 20Y9
Winter
Summer
Sports
Sports
Division
Division
$ 8,900,000
Cost of goods sold
Gross profit
$ 3,900,000
$ 7,400,000
Divisional selling and administrative expenses:
Divisional selling expenses
$ (1,200,000)
Divisional administrative expenses
Total divisional selling and administrative expenses
$(1,450,000)
$ (2,650,000)
Operating income before support department allocations
$ 2,450,000
$ 4,750,000
Support department allocations:
Advertising expense (Note 1)
$ (375,000)
$ (715,000)
Transportation expense (Note 2)
(70,000)
(122,000)
Accounts receivable collection expense (Note 3)
(25,000)
Warehouse expense (Note 4)
Operating income
$ 1,260,000
$ 2,790,000
Supporting calculations:
Note (1)
Winter Sports Division:
$375,000
Summer Sports Division:
$715,000
Note (2)
Winter Sports Division:
(17,500 bills of lading × $4.00 per bill of lading)
Summer Sports Division:
(30,500 bills of lading × $4.00 per bill of lading)
Note (3)
Winter Sports Division:
(25,000 invoices × $1.00 per invoice)
Summer Sports Division:
(43,000 invoices × $1.00 per invoice)
Note (4)
Winter Sports Division:
($1,800,000 ÷ 150,000 sq. ft.) × 60,000 sq. ft.
Summer Sports Division:
($1,800,000 ÷ 150,000 sq. ft.) × 90,000 sq. ft.
Support Department Allocations
Winter
Summer
Sports
Sports
Division
Division
Total
Advertising expense ……………………………………
$375,000
$715,000
$1,090,000
Transportation rate per bill of lading ……………
$4.00
$4.00
× Number of bills of lading …………………………..
17,500
30,500
Transportation expense ………………………………
$70,000
$122,000
$192,000
× Number of sales invoices …………………………
25,000
43,000
$12.00
CHAPTER 24 (FIN MAN); CHAPTER 10 (MAN) Evaluating Decentralized Operations
Ex. 24–10 (FIN MAN); Ex. 10–10 (MAN)
a.
Retail Division:
24% ($9,600,000 ÷ $40,000,000)
b.
Retail Division
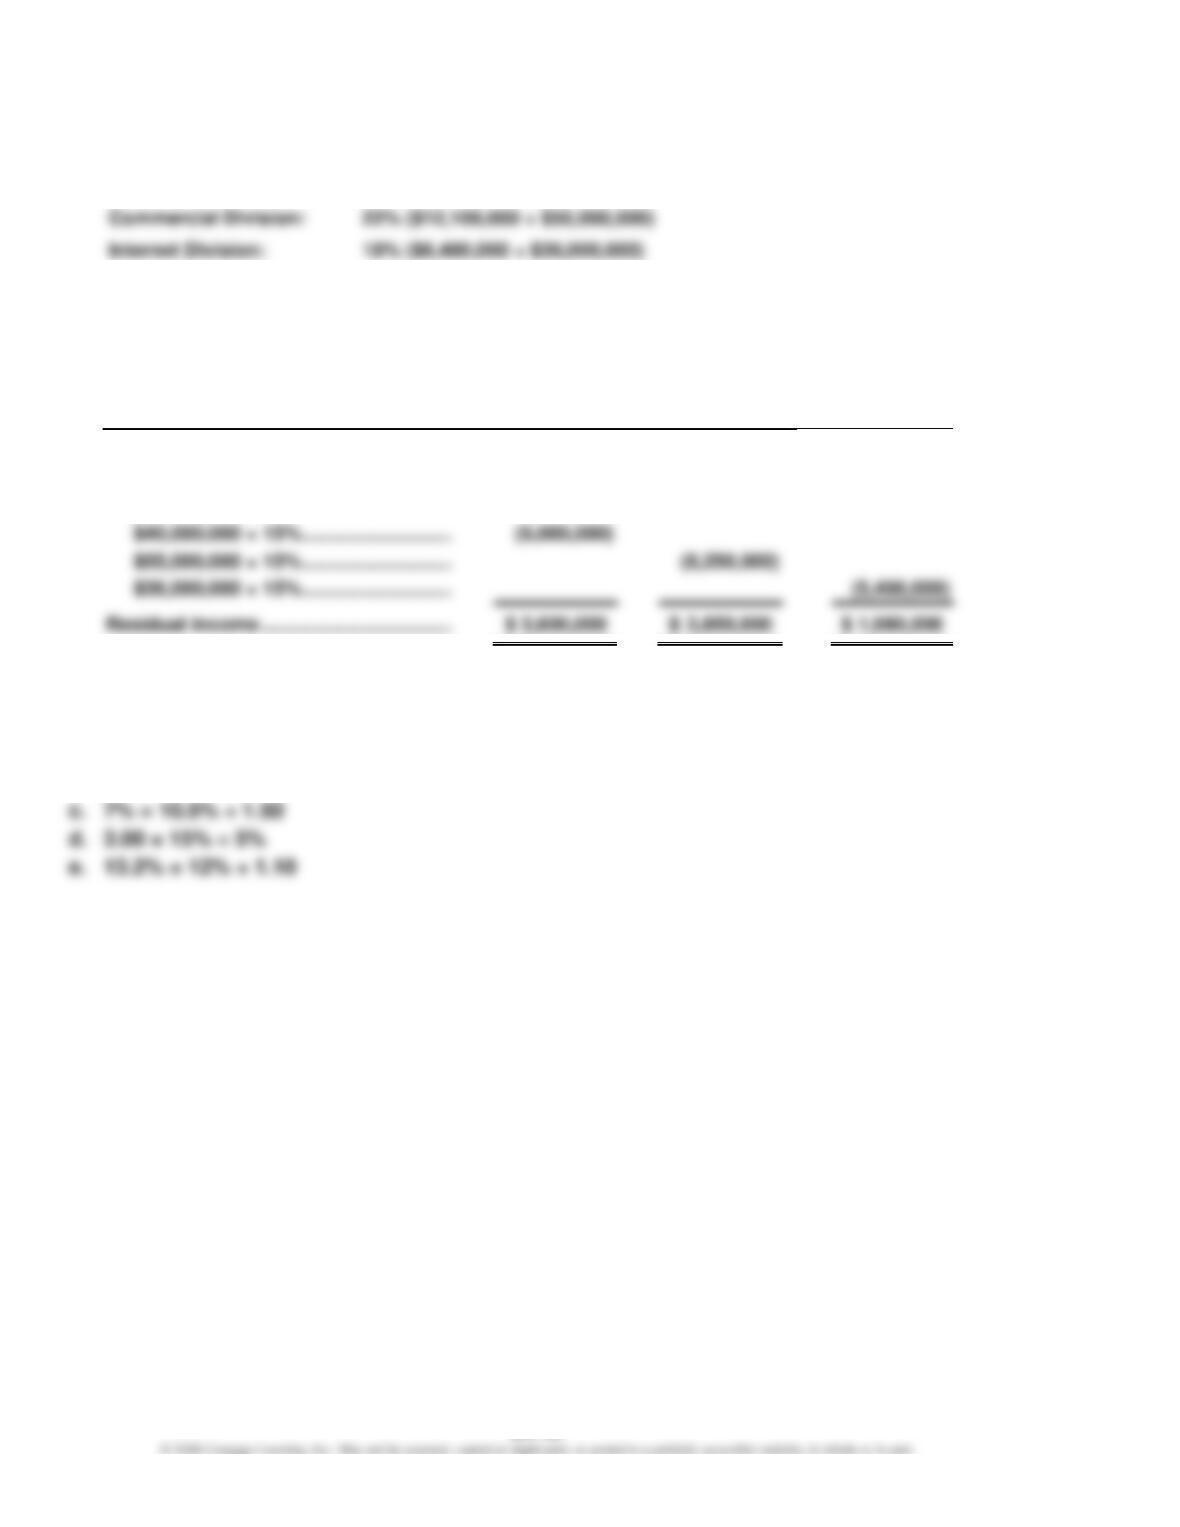
Ex. 24–11 (FIN MAN); Ex. 10–11 (MAN)
a.
Retail
Commercial
Internet
Division
Division
Division
Operating income …………………………….
$ 9,600,000
$12,100,000
$ 6,480,000
Minimum amount of
operating income:
b. Commercial Division
Ex. 24–12 (FIN MAN); Ex. 10–12 (MAN)
a. 2.20 = 13.2% ÷ 6%
b. 18% = 10% × 1.80
CHAPTER 24 (FIN MAN); CHAPTER 10 (MAN) Evaluating Decentralized Operations
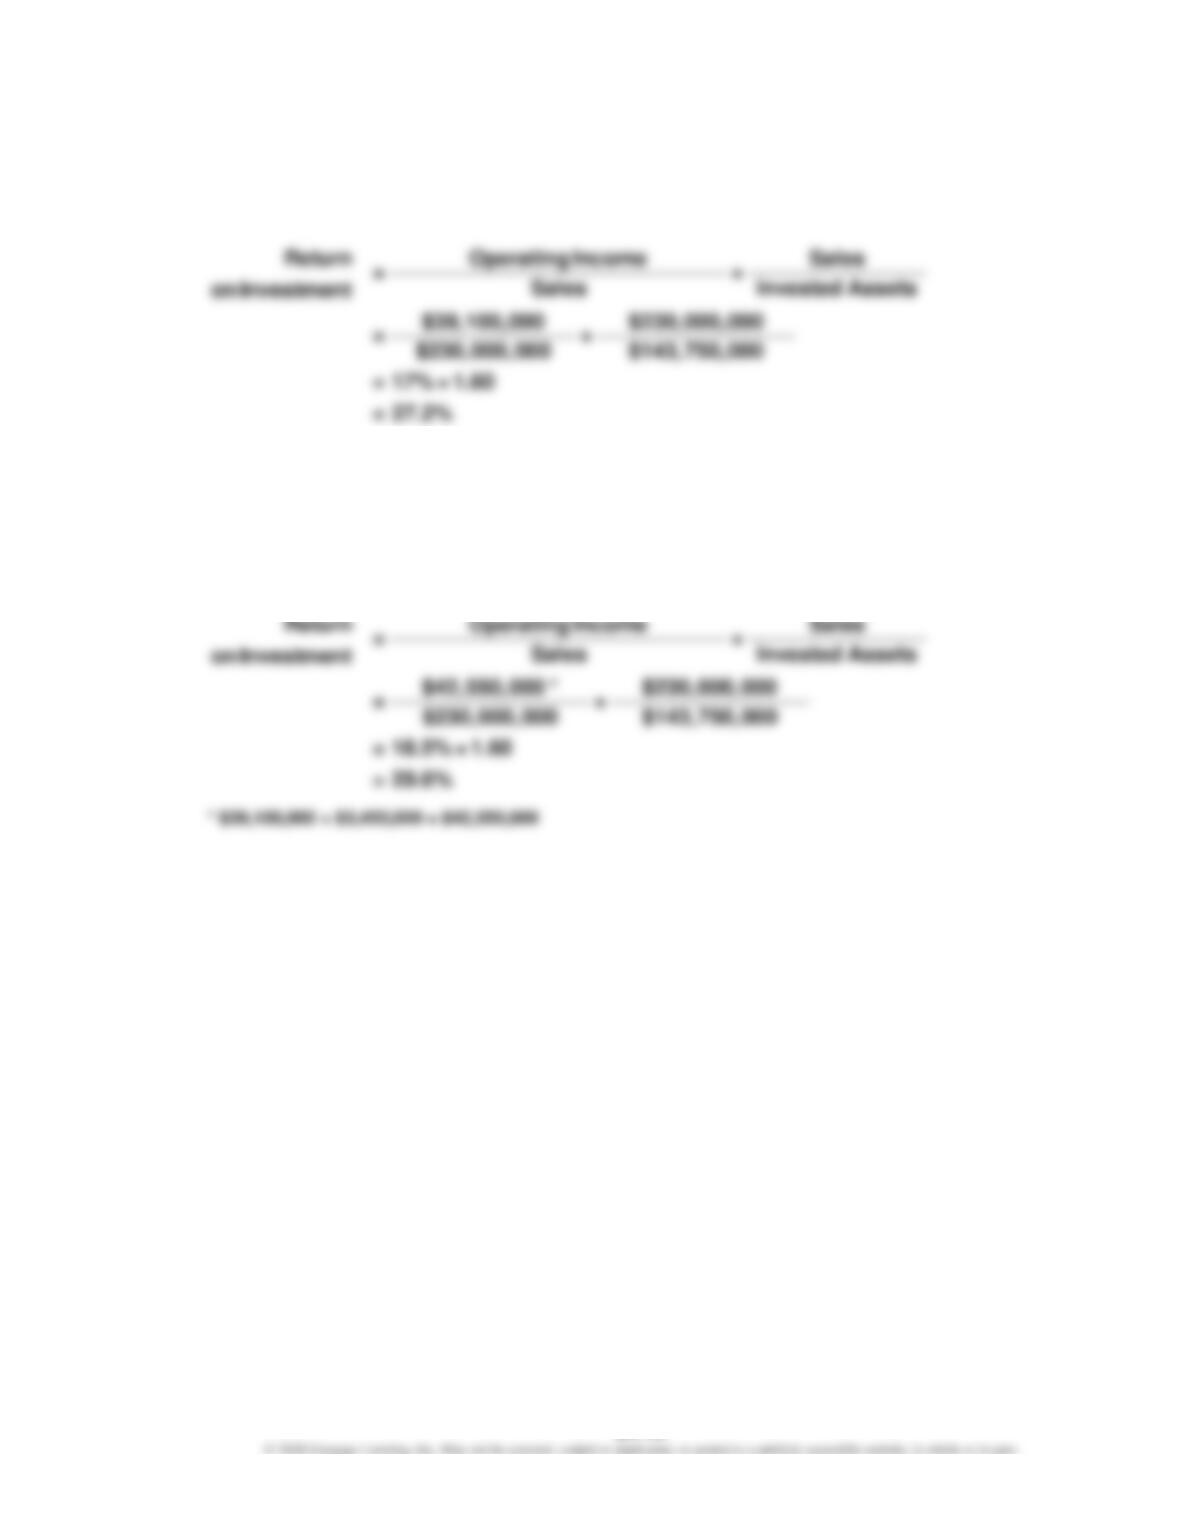
Ex. 24–13 (FIN MAN); Ex. 10–13 (MAN)
a.
Return
on Investment
=
Profit Margin × Investment Turnover
b. The profit margin would increase from 17% to 18.5%, the investment turnover
would remain unchanged, and the return on investment would increase from
27.2% to 29.6%, as shown below.
Return
on
Investment
=
Profit Margin × Investment Turnover
CHAPTER 24 (FIN MAN); CHAPTER 10 (MAN) Evaluating Decentralized Operations
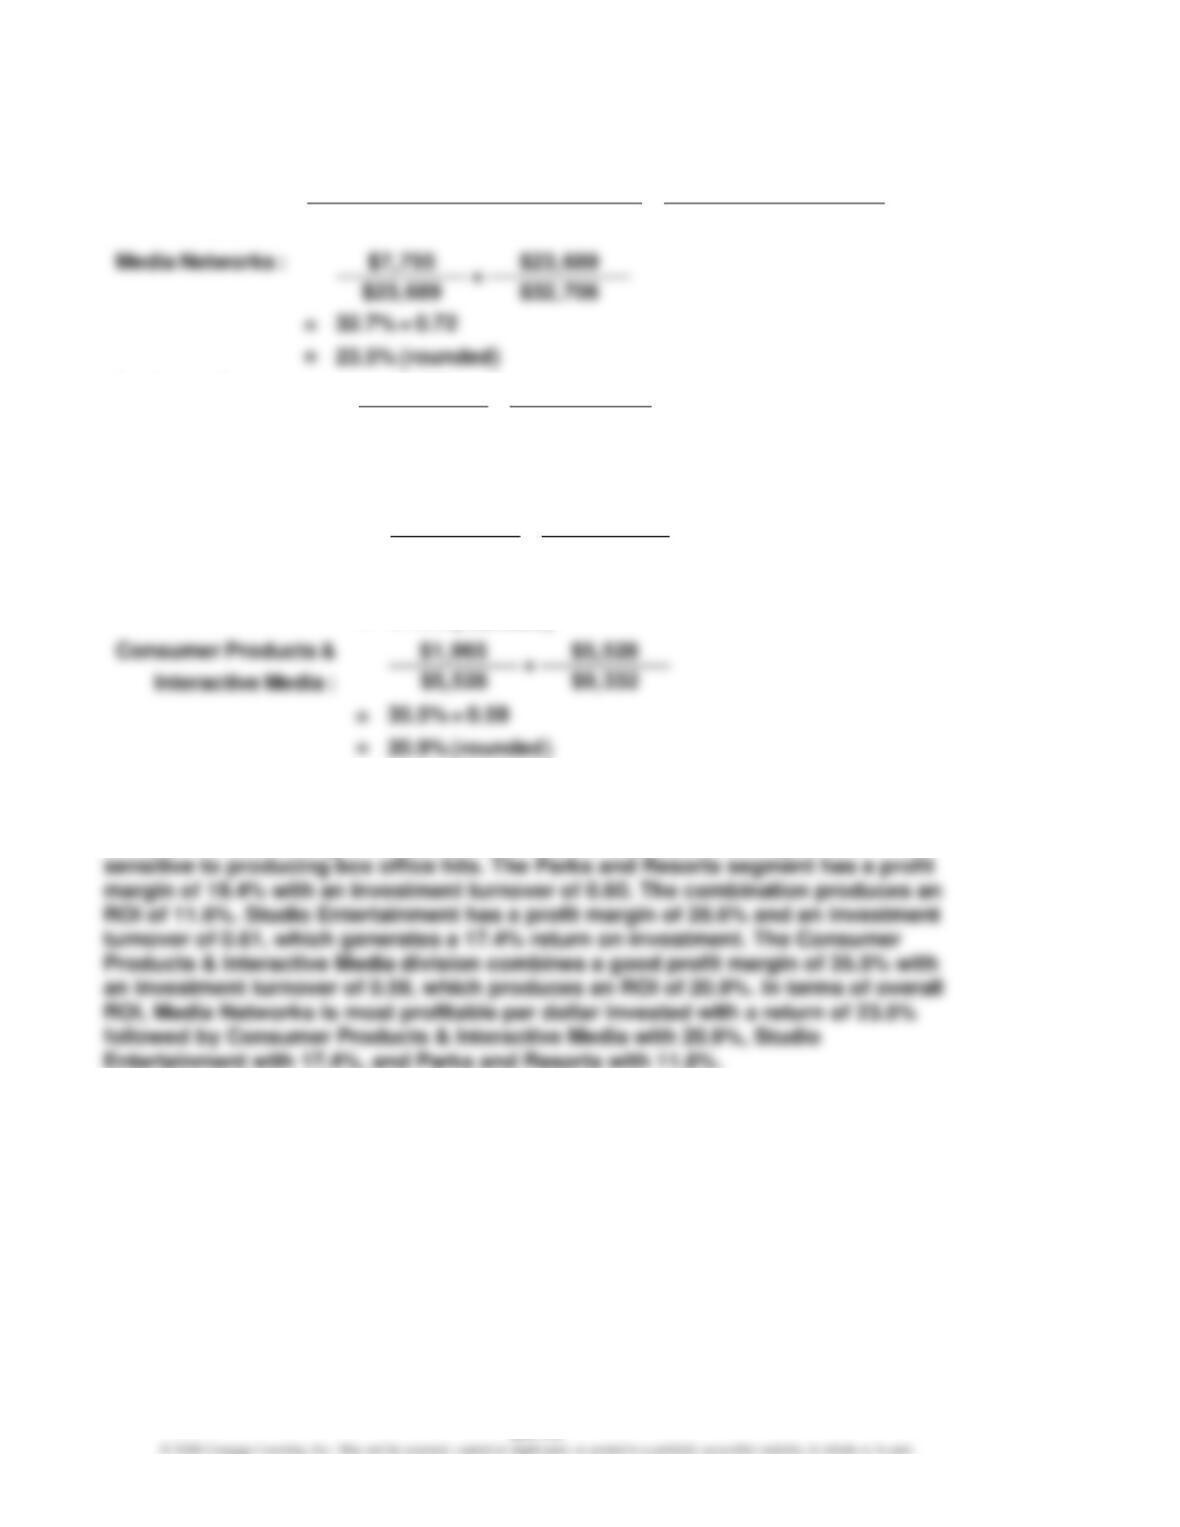
Ex. 24–14 (FIN MAN); Ex. 10–14 (MAN)
a.
Return on O perating Incom e R e v e n u e s
=×
Revenues Invested Assets
Investm ent
( )
Parks and Resorts : $3,298 $16,974
×
$16,974 $28,275
= 19.4% × 0.60
=11.6% rounded
Studio Entertainment : $2,703 $9,441
×
$9,441 $15,359
= 28.6% × 0.61
=17.4% rounded
b. The four segments are different from each other. Media Networks combines a good
profit margin of 32.7% with an investment turnover of 0.72. Media Networks is
sensitive to advertising revenue, while the Studio Entertainment segment is
CHAPTER 24 (FIN MAN); CHAPTER 10 (MAN) Evaluating Decentralized Operations
Ex. 24–15 (FIN MAN); Ex. 10–15 (MAN)
a.
16.5% ($198,000 ÷ $1,200,000)
g.
$105,000 ($750,000 × 14%)
b.
$144,000 ($1,200,000 × 12%)
h.
12.0% ($90,000 ÷ $750,000)
c.
$54,000 ($198,000 – $144,000)
i.
$15,000 ($105,000 – $90,000)
$160,000 ($120,000 + $40,000)
24.5% ($441,000 ÷ $1,800,000)
e.
20.0% ($160,000 ÷ $800,000)
k.
$270,000 ($1,800,000 × 15%)
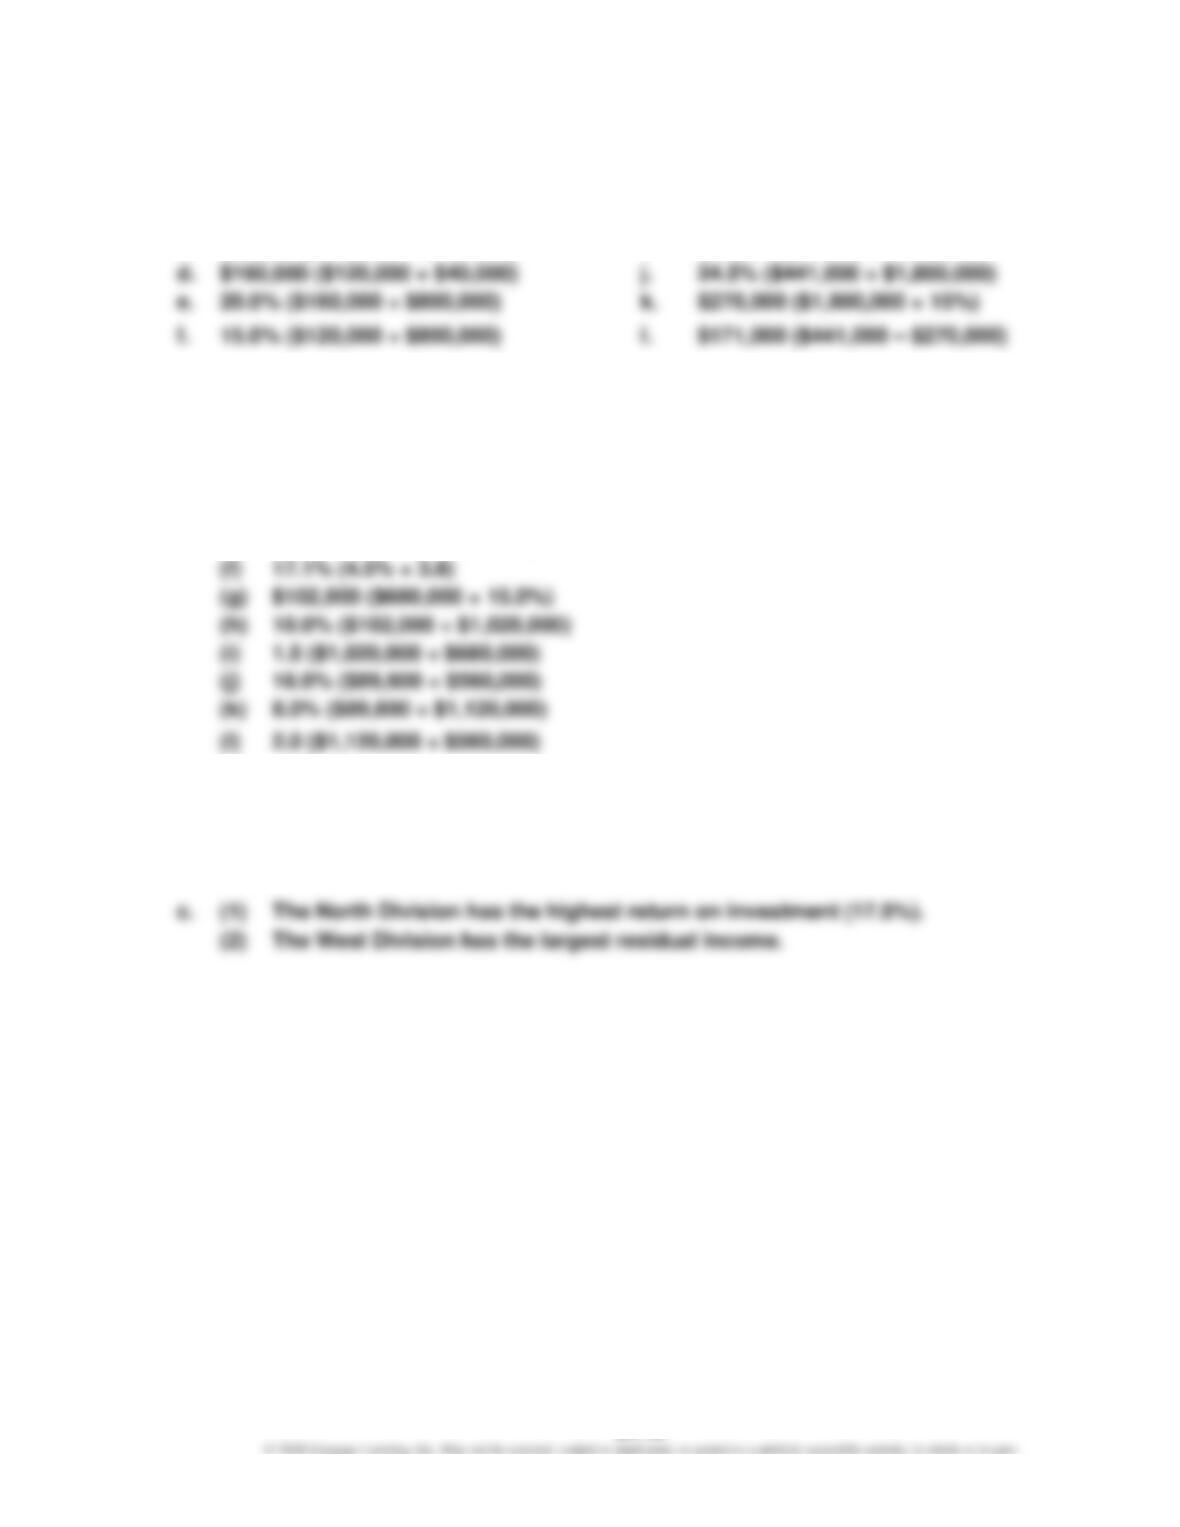
Ex. 24–16 (FIN MAN); Ex. 10–16 (MAN)
a.
(a)
$60,200 ($860,000 × 7.0%)
(b)
$344,000 ($60,200 ÷ 17.5%)
(c)
2.5 (17.5% ÷ 7.0%) or $860,000 ÷ $344,000
(d)
$1,140,000 ($51,300 ÷ 4.5%)
(e)
$300,000 ($1,140,000 ÷ 3.8)
$102,000 ($680,000 × 15.0%)
10.0% ($102,000 ÷ $1,020,000)
1.5 ($1,020,000 ÷ $680,000)
(k)
8.0% ($89,600 ÷ $1,120,000)
2.0 ($1,120,000 ÷ $560,000)
b.
North Division:
$18,920 [$60,200 – ($344,000 × 12%)]
South Division:
$15,300 [$51,300 – ($300,000 × 12%)]
East Division:
$20,400 [$102,000 – ($680,000 × 12%)]
West Division:
$22,400 [$89,600 – ($560,000 × 12%)]
CHAPTER 24 (FIN MAN); CHAPTER 10 (MAN) Evaluating Decentralized Operations
Ex. 24–17 (FIN MAN); Ex. 10–17 (MAN)
a.
Increase in Ziegler Inc.’s
Market
Variable Cost
Units
Operating Income
=
Price
–
per Unit
×
Transferred
$33,750,000
=
($1,350
–
$900)
×
75,000
=
×
Variable Cost
Units
Operating Income
Price
–
per Unit
Transferred
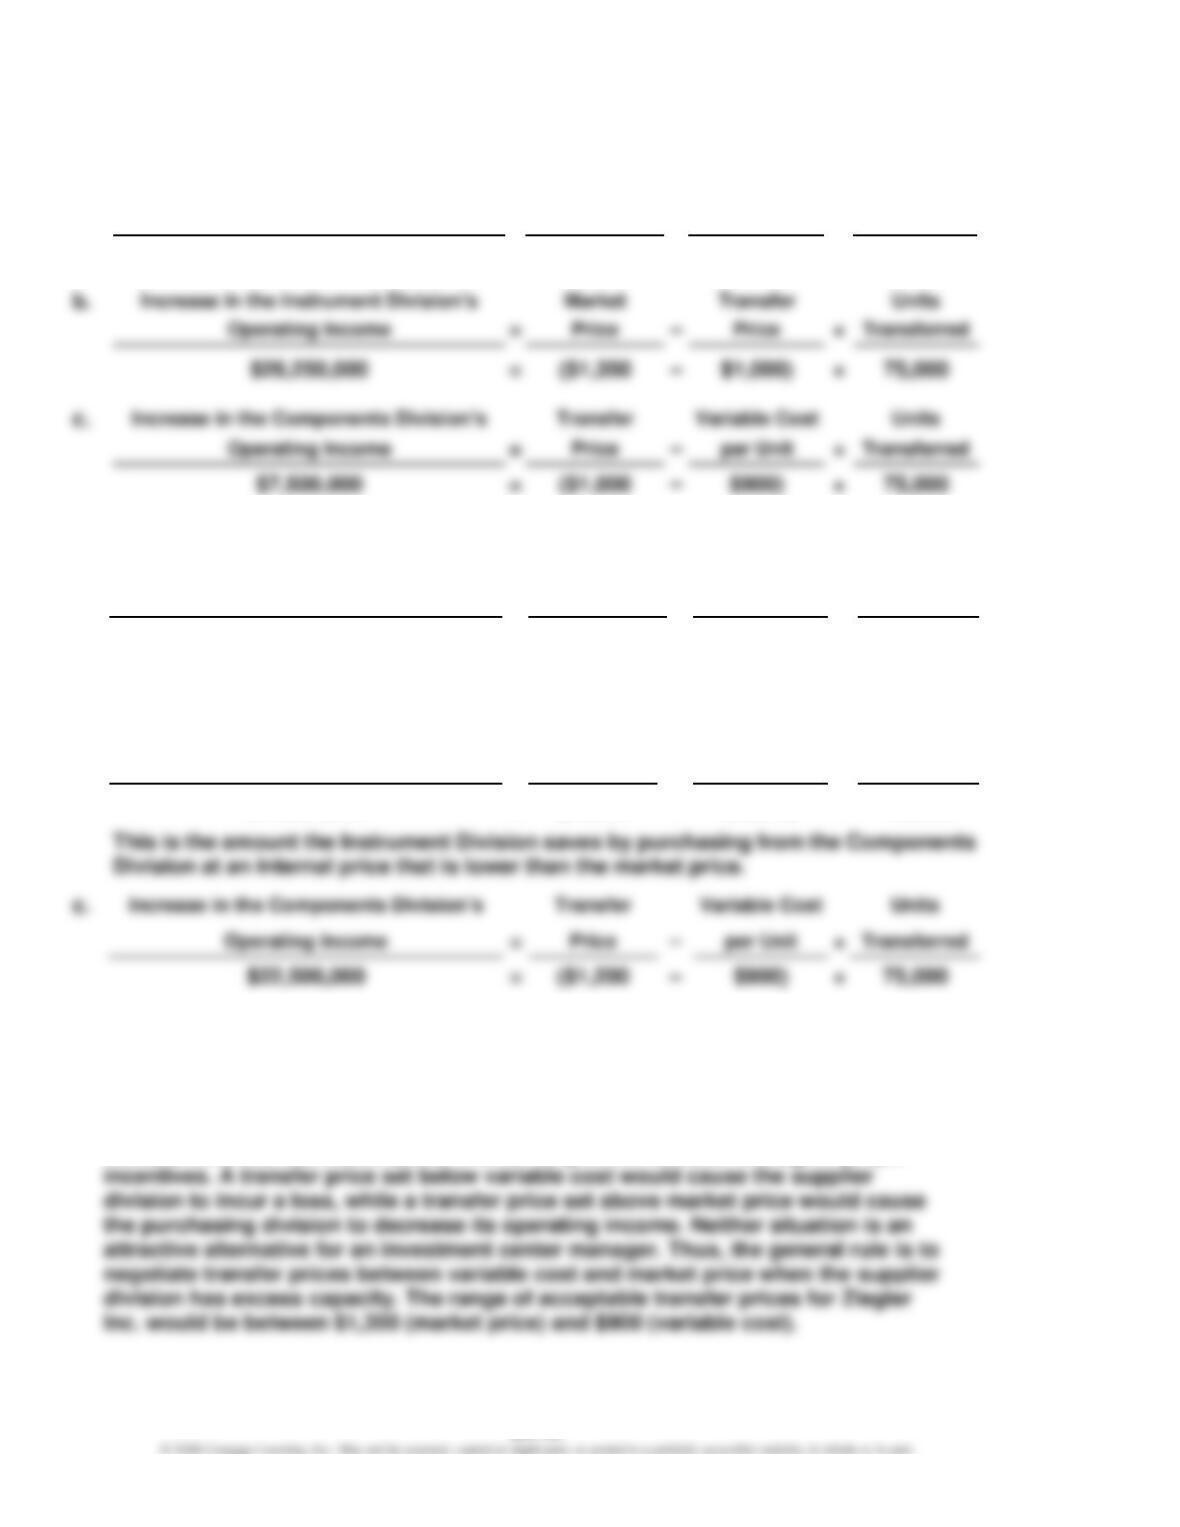
Ex. 24–18 (FIN MAN); Ex. 10–18 (MAN)
a.
Increase in Ziegler Inc.’s
Market
Variable Cost
Units
Operating Income
=
Price
–
per Unit
×
Transferred
$33,750,000
=
($1,350
–
$900)
×
75,000
This amount is the same amount by which Ziegler Inc.’s operating income increased
in Ex. 24–17, when a transfer price of $1,000 was used.
b.
Increase in the Instrument Division’s
Market
Transfer
Units
Operating Income
=
Price
–
Price
×
Transferred
$11,250,000
=
($1,350
–
$1,200)
×
75,000
×
This is the amount the Components Division earns by using available excess capacity
to produce and sell products above variable cost to the Instrument Division.
d. Any transfer price will cause the total income of the company to increase, as long
as the supplier division capacity is used toward making materials for products that
are ultimately sold to the outside. However, transfer prices should be set between
variable cost and the market price in order to give the division managers proper
CHAPTER 24 (FIN MAN); CHAPTER 10 (MAN) Evaluating Decentralized Operations
PROBLEMS
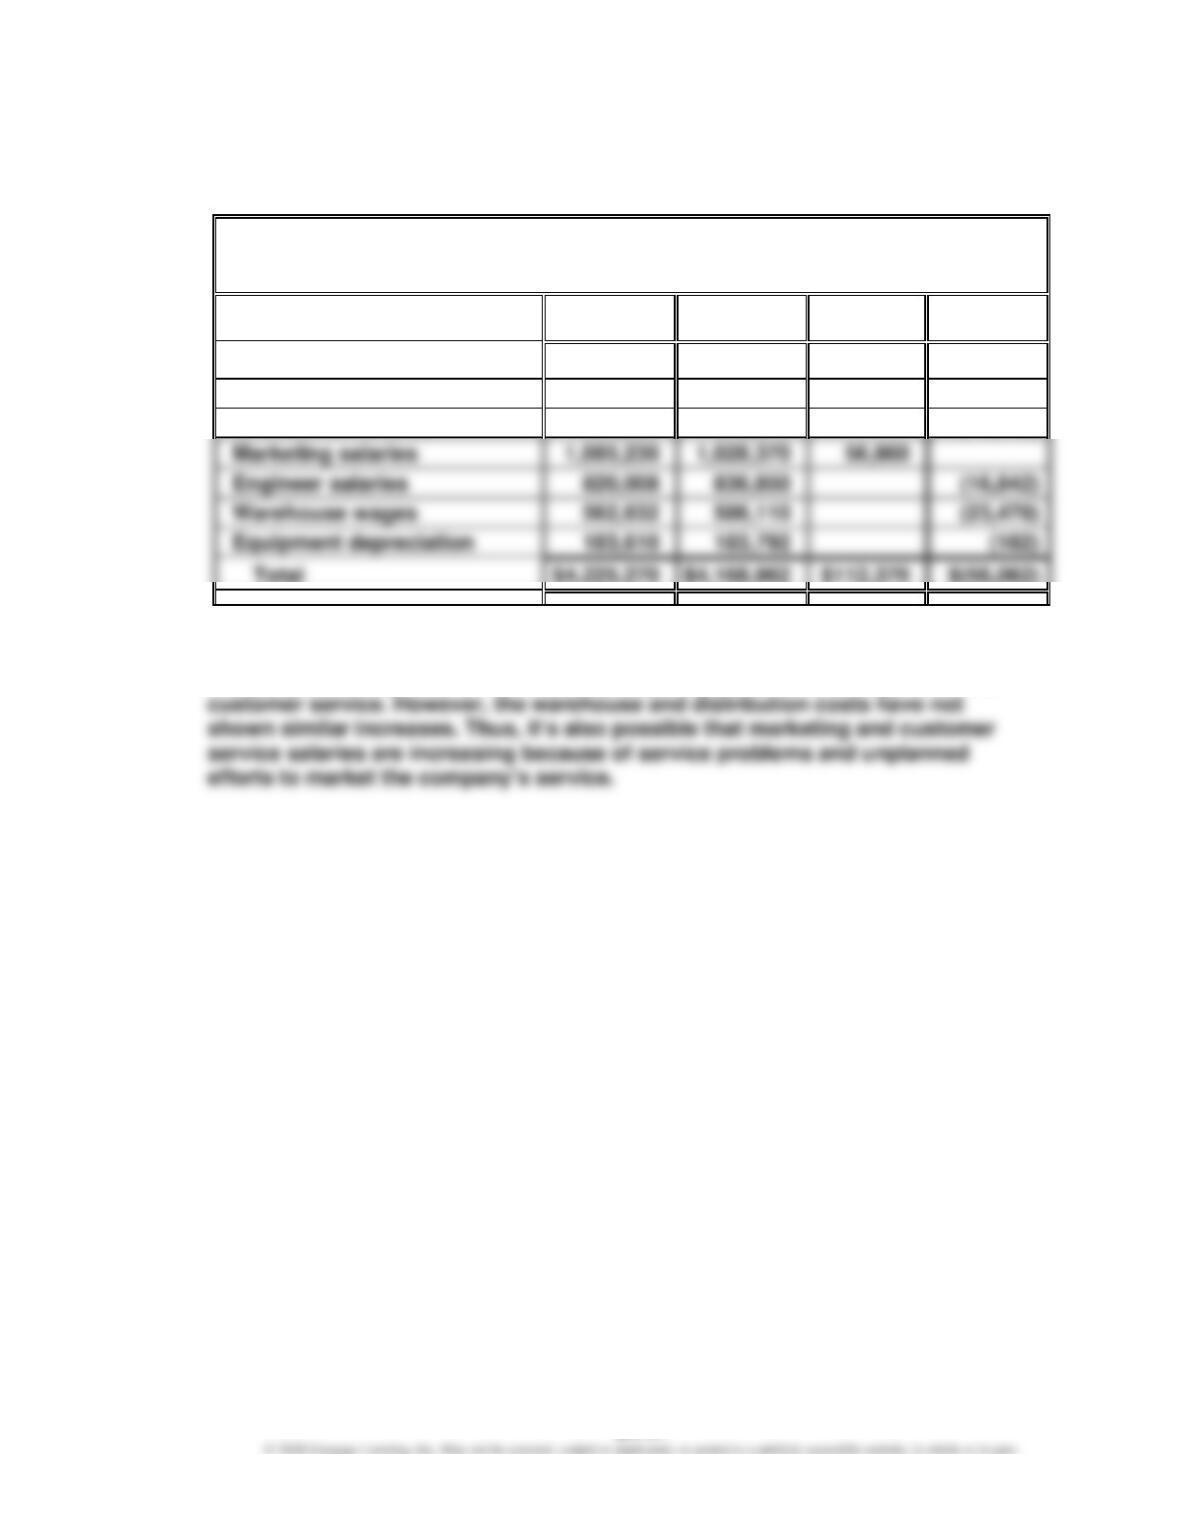
Prob. 24–1A (FIN MAN); Prob. 10–1A (MAN)
1.
GHT Tech Inc.
Budget Performance Report—Director, Consumer Products Division
For the Month Ended January 31
Actual
Budget
Over
Budget
(Under)
Budget
Customer service salaries
$ 602,350
$ 546,840
$ 55,510
Insurance and property taxes
110,240
114,660
$ (4,420)
Distribution salaries
861,200
872,340
(11,140)
Marketing salaries
56,860
Engineer salaries
820,008
836,850
(16,842)
Warehouse wages
562,632
586,110
(23,478)
Equipment depreciation
183,610
183,792
Total
$4,225,270
$4,168,962
$112,370
$(56,062)
2. The customer service and marketing salaries are significantly over budget. The
director should investigate the cause of these results. One possibility is that the
company is having an increase in sales, requiring greater marketing effort and
CHAPTER 24 (FIN MAN); CHAPTER 10 (MAN) Evaluating Decentralized Operations
Prob. 24–2A (FIN MAN); Prob. 10–2A (MAN)
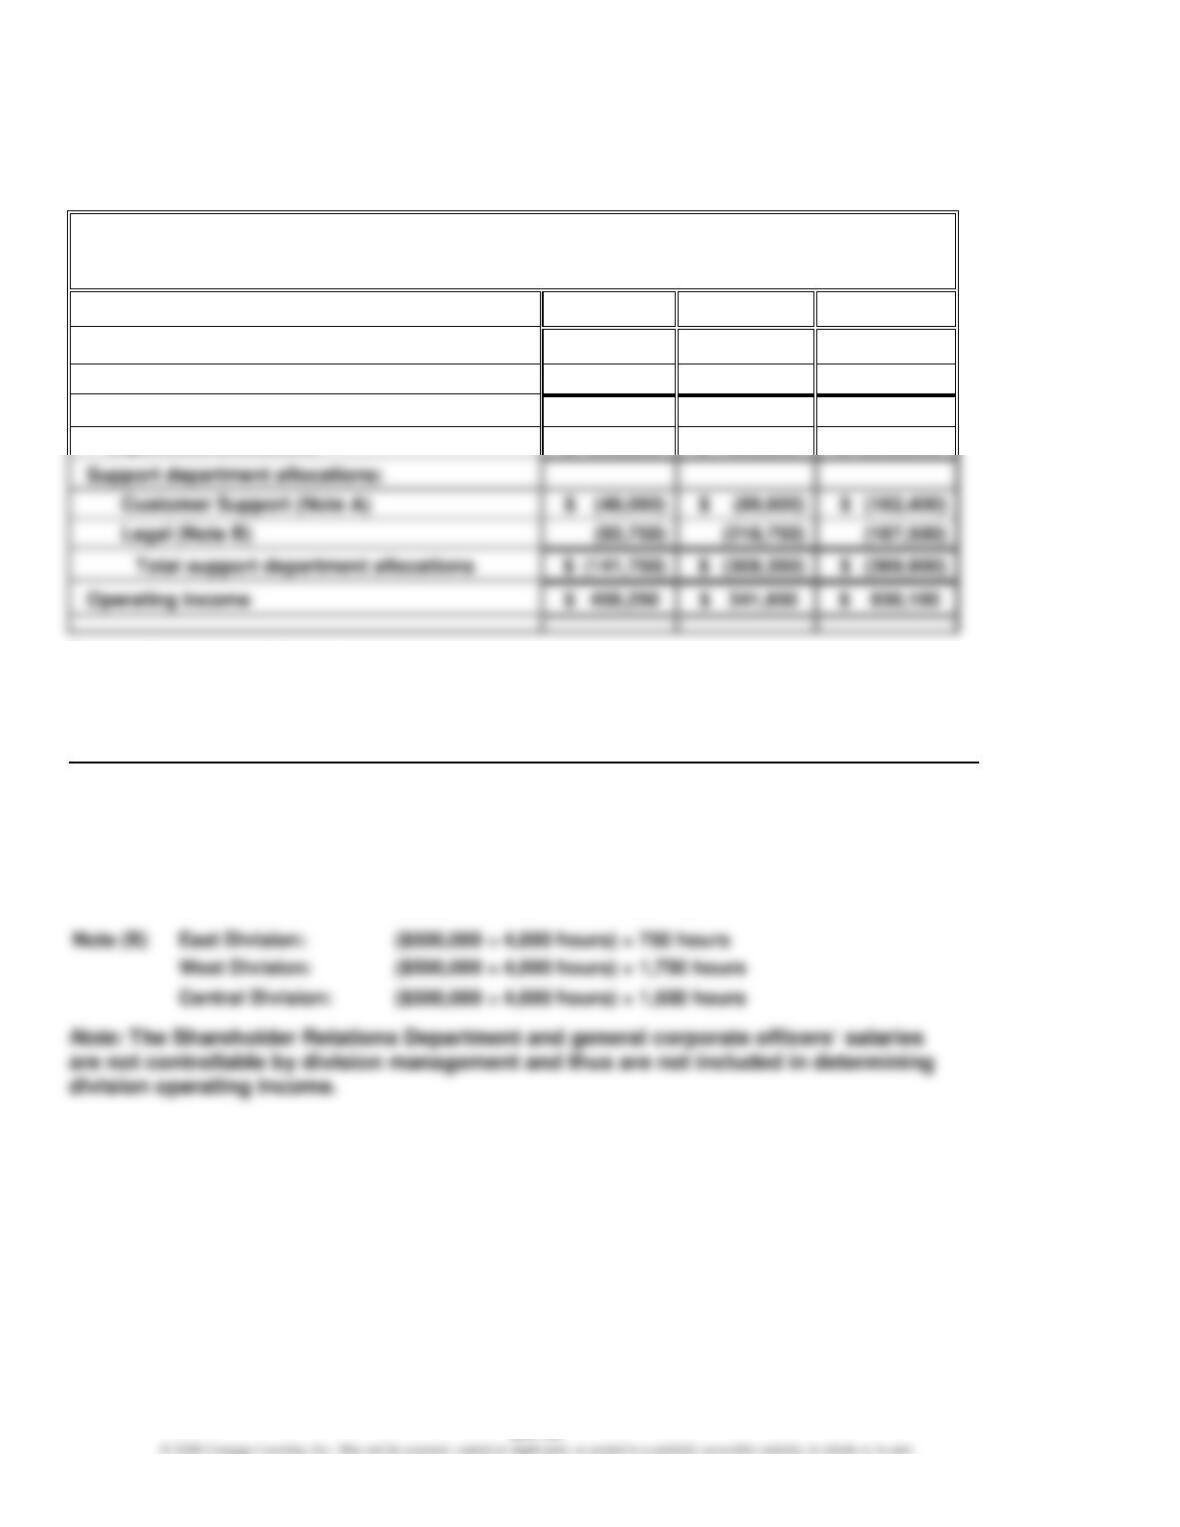
1.
Red Line Railroad Inc.
Divisional Income Statements
For the Quarter Ended December 31
East
West
Central
Revenues
$1,400,000
$ 2,000,000
$ 3,200,000
Operating expenses
(800,000)
(1,350,000)
(1,900,000)
Operating income before support
department allocations
$ 600,000
$ 650,000
$ 1,300,000
Support department allocations:
Supporting computations:
Support department allocation rates for Customer Support and Legal are determined as
follows:
East
West
Central
Total
Number of customer contacts …..
1,500
2,800
5,700
10,000
Number of hours billed ……………..
750
1,750
1,500
4,000
Note (A)
East Division:
($320,000 + 10,000 contacts) × 1,500 contacts
West Division:
($320,000 ÷ 10,000 contacts) × 2,800 contacts
Central Division:
($320,000 ÷ 10,000 contacts) × 5,700 contacts
West Division:
($500,000 ÷ 4,000 hours) × 1,750 hours
CHAPTER 24 (FIN MAN); CHAPTER 10 (MAN) Evaluating Decentralized Operations
Prob. 24–2A (FIN MAN); Prob. 10–2A (MAN) (Concluded)
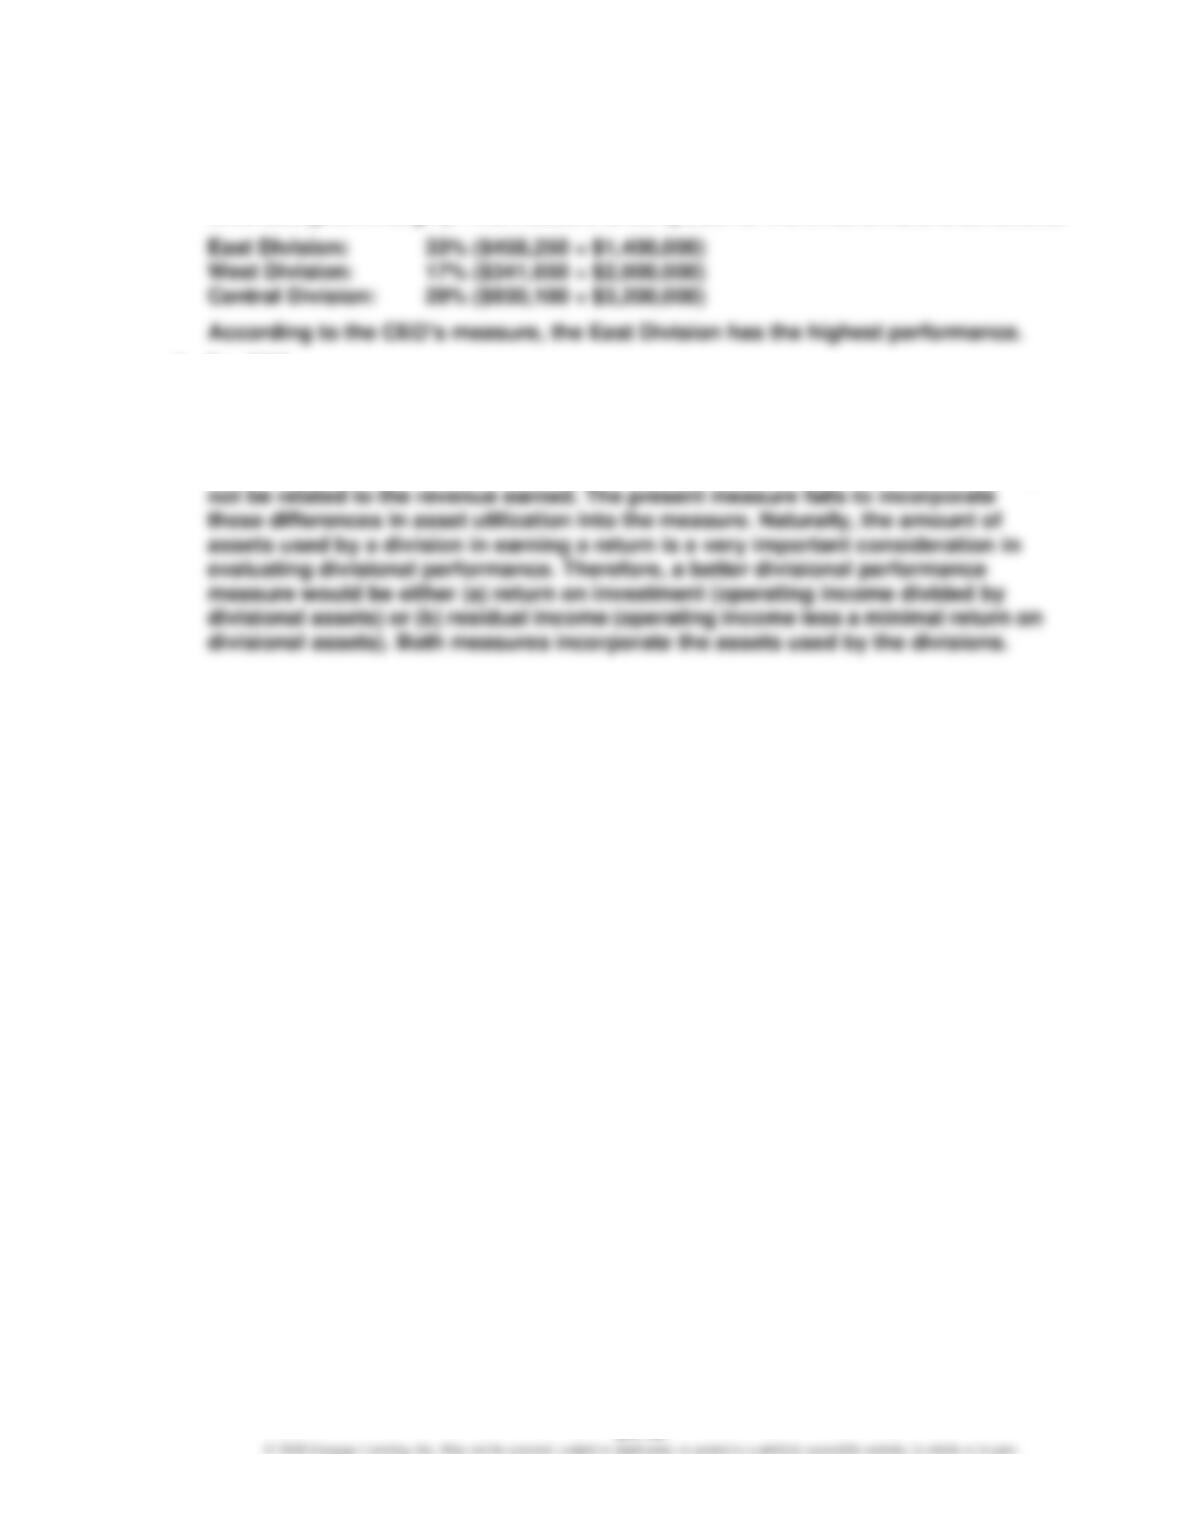
2. The CEO evaluates the three divisions using operating income as a percent of
revenues (profit margin). This measure is computed for the three divisions as follows:
3. To: CEO
The method used to evaluate the performance of the divisions should be
reevaluated. The present method identifies the amount of operating income per
dollar of earned revenue. However, this company requires a significant investment
in fixed assets for production and distribution facilities. The amount of assets may
CHAPTER 24 (FIN MAN); CHAPTER 10 (MAN) Evaluating Decentralized Operations
Prob. 24–3A (FIN MAN); Prob. 10–3A (MAN)
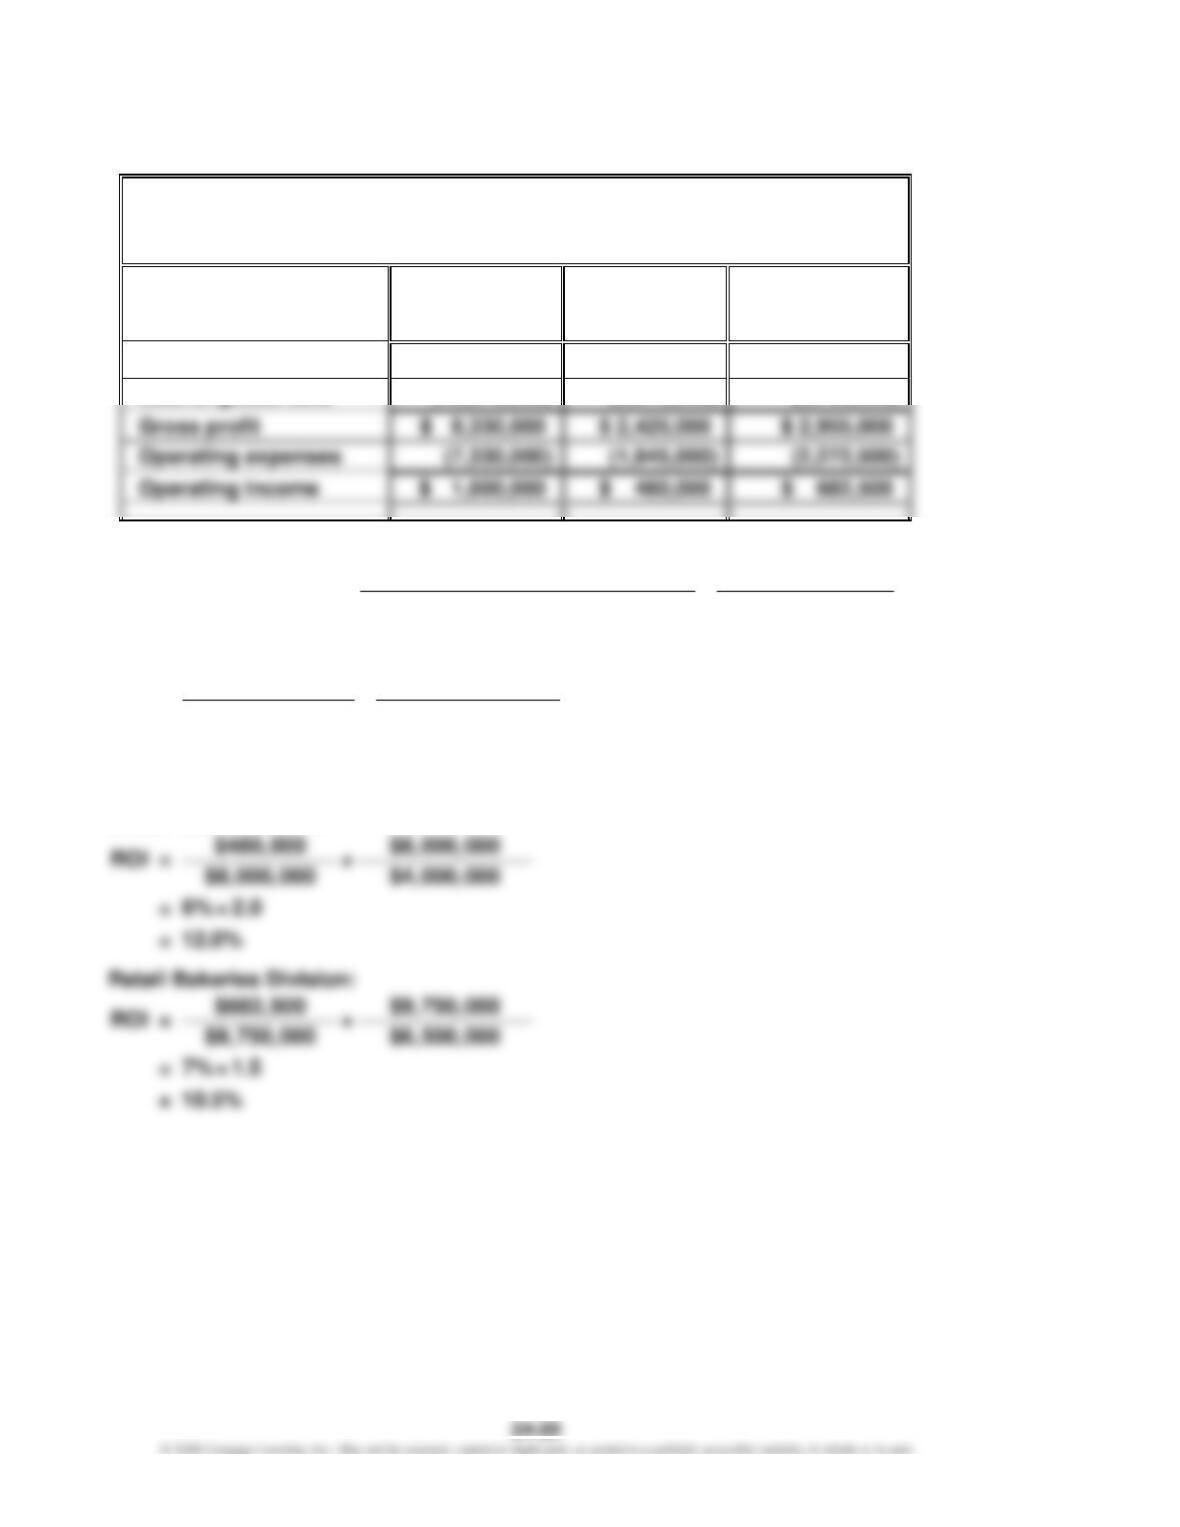
1.
The Crunchy Granola Company
Divisional Income Statements
For the Year Ended June 30, 20Y7
Cereal
Division
Snack Cake
Division
Retail
Bakeries
Division
Sales
$ 25,000,000
$ 8,000,000
$ 9,750,000
2.
Return on Investment = Profit Margin × Investment Turnover
Operating Income Sales
Return on Investment = ×
Sales Invested Assets
Cereal Division:
$1,000,000 $25,000,000
ROI = ×
$25,000,000 $10,000,000
= 4% × 2.5
= 10.0%
Snack Cake Division: