1. a. Property, plant, and equipment or fixed assets
b. Current assets (inventory)
2. Undeveloped land acquired for future resale rather than operations is classified and reported as
an investment, below the Current Assets section.
6. a. The straight-line depreciation method is most appropriate when the revenues generated
b
y the asset are about the same from period to period.
b. The units-of-activity depreciation method is most appropriate when the asset’s use (and
revenues) vary from period to period.
c. The double-declining-balance depreciation method is most appropriate when the revenues
generated by the asset are greater in the early periods of use rather than in later periods.
7. Capital expenditures include the cost of acquiring fixed assets and the cost of improving an
asset. These costs are recorded by increasing (debiting) a fixed asset account. Capital
expenditures also include the costs of extraordinary repairs, which are recorded by decreasing
(debiting) the asset’s accumulated depreciation account. Revenue expenditures are recorded as
expenses and are costs that benefit only the current period and are incurred for normal
maintenance and repairs of fixed assets.
8. Capital expenditure
CHAPTER 10
LONG-TERM ASSETS: FIXED AND INTANGIBLE
DISCUSSION QUESTIONS
CHAPTER 10 Long-Term Assets: Fixed and Intangible
PE 10-1A
a. $1,290,000 ($1,630,000 – $340,000)
b. 10% (100% ÷ 10)
c. $129,000 ($1,290,000 × 10%) or ($1,290,000 ÷ 10 years)
PE 10-2A
a. $184,800 ($202,800 – $18,000)
b. $0.42 per mile ($184,800 ÷ 440,000 miles)
c. $47,460 (113,000 miles × $0.42)
PE 10-2B
PE 10-3A
a. 5% [(100% ÷ 40) × 2]
b. $59,650 ($1,193,000 × 5%)
PE 10-3B
PE 10-4A
a. $16,400 [($304,000 – $41,600) ÷ 16]
b. $140,000 [$304,000 – ($16,400 × 10)]
c. $15,400 [($140,000 – $16,800) ÷ 8]
PE 10-4B
PRACTICE EXERCISES
CHAPTER 10 Long-Term Assets: Fixed and Intangible
PE 10-5A
14 Accumulated Depreciation—Delivery Van 4,700
Cash 4,700
14 Delivery Van 920
Cash 920
PE 10-5B
Aug. 7 Delivery Truck 2,800
PE 10-6A
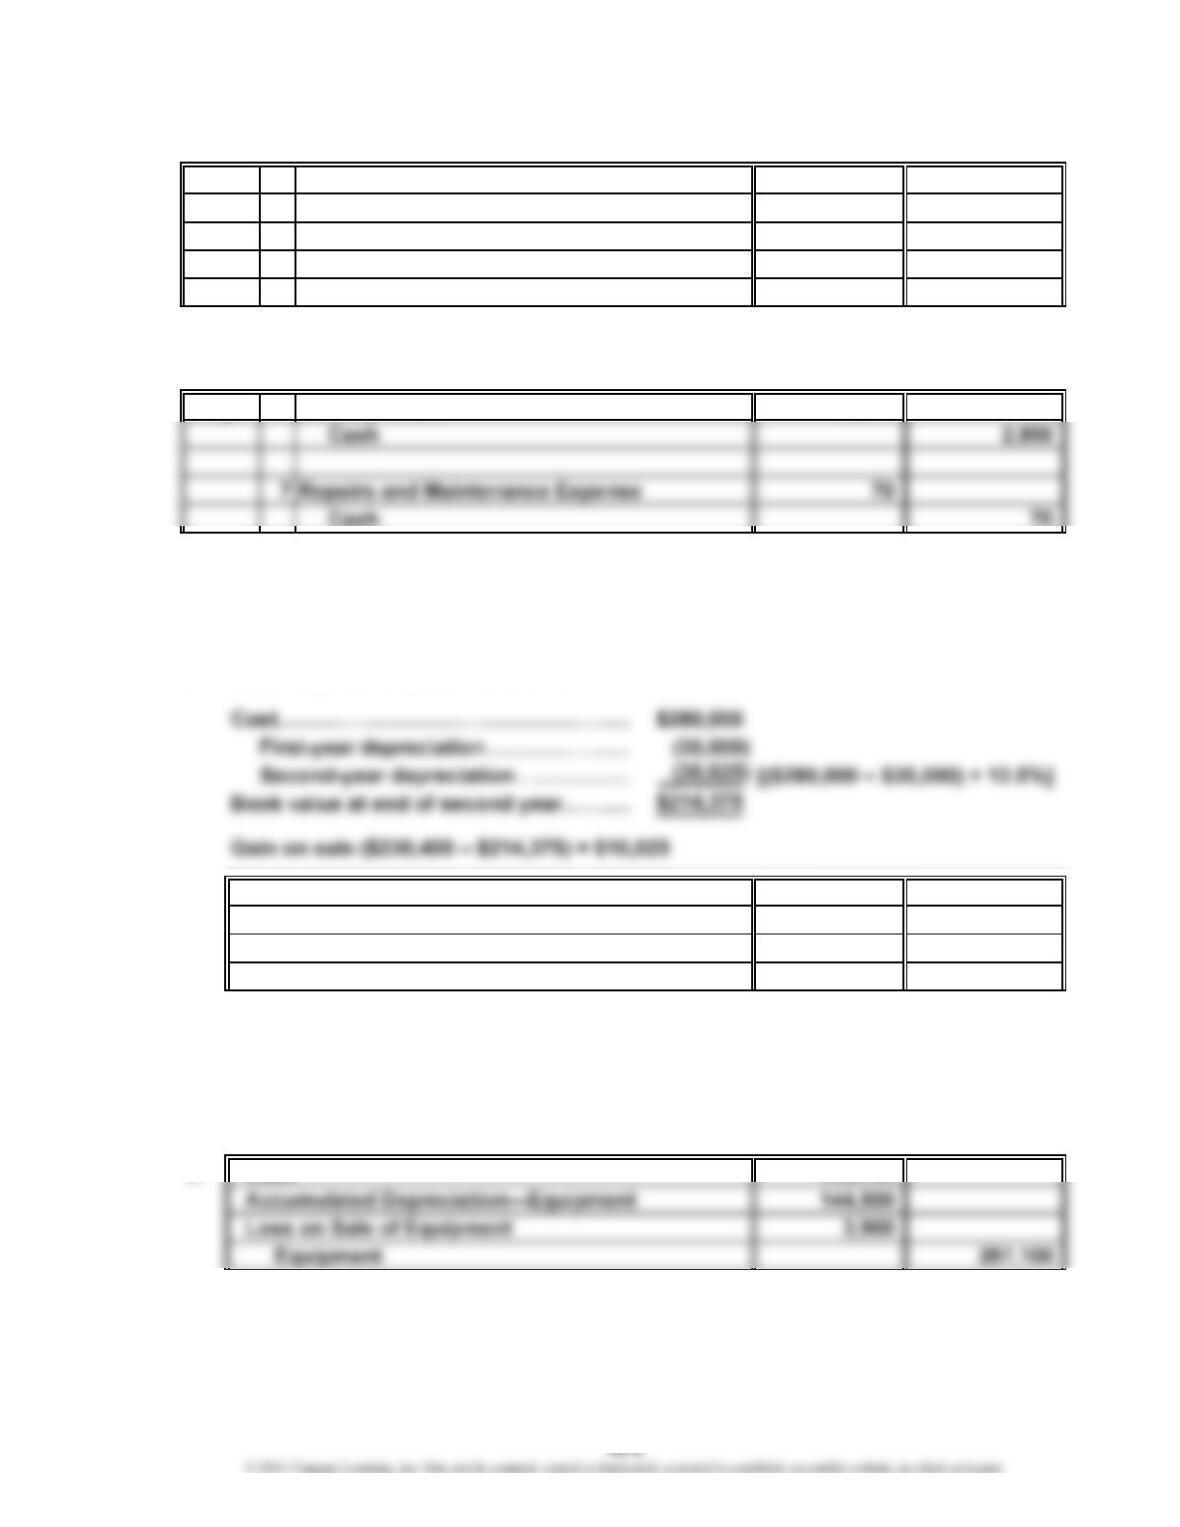
a. $35,000 = $280,000 × [(100% ÷ 16) × 2] = $280,000 × 12.5%
b. $16,025 gain, computed as follows:
c. Cash 230,400
Accumulated Depreciation—Equipment 65,625
Equipment 280,000
Gain on Sale of Equipment 16,025
PE 10-6B
a. $28,900 [($287,100 – $27,000) ÷ 9]
b. $3,900 loss {$138,700 – [$287,100 – ($28,900 × 5)]}
Feb.
CHAPTER 10 Long-Term Assets: Fixed and Intangible
PE 10-7A
a. $1.12 per ton = $342,720,000 ÷ 306,000,000 tons
b. $62,272,000 = 55,600,000 tons × $1.12 per ton
c. 31 Depletion Expense 62,272,000
Accumulated Depletion 62,272,000
Depletion of mineral deposit.
PE 10-7B
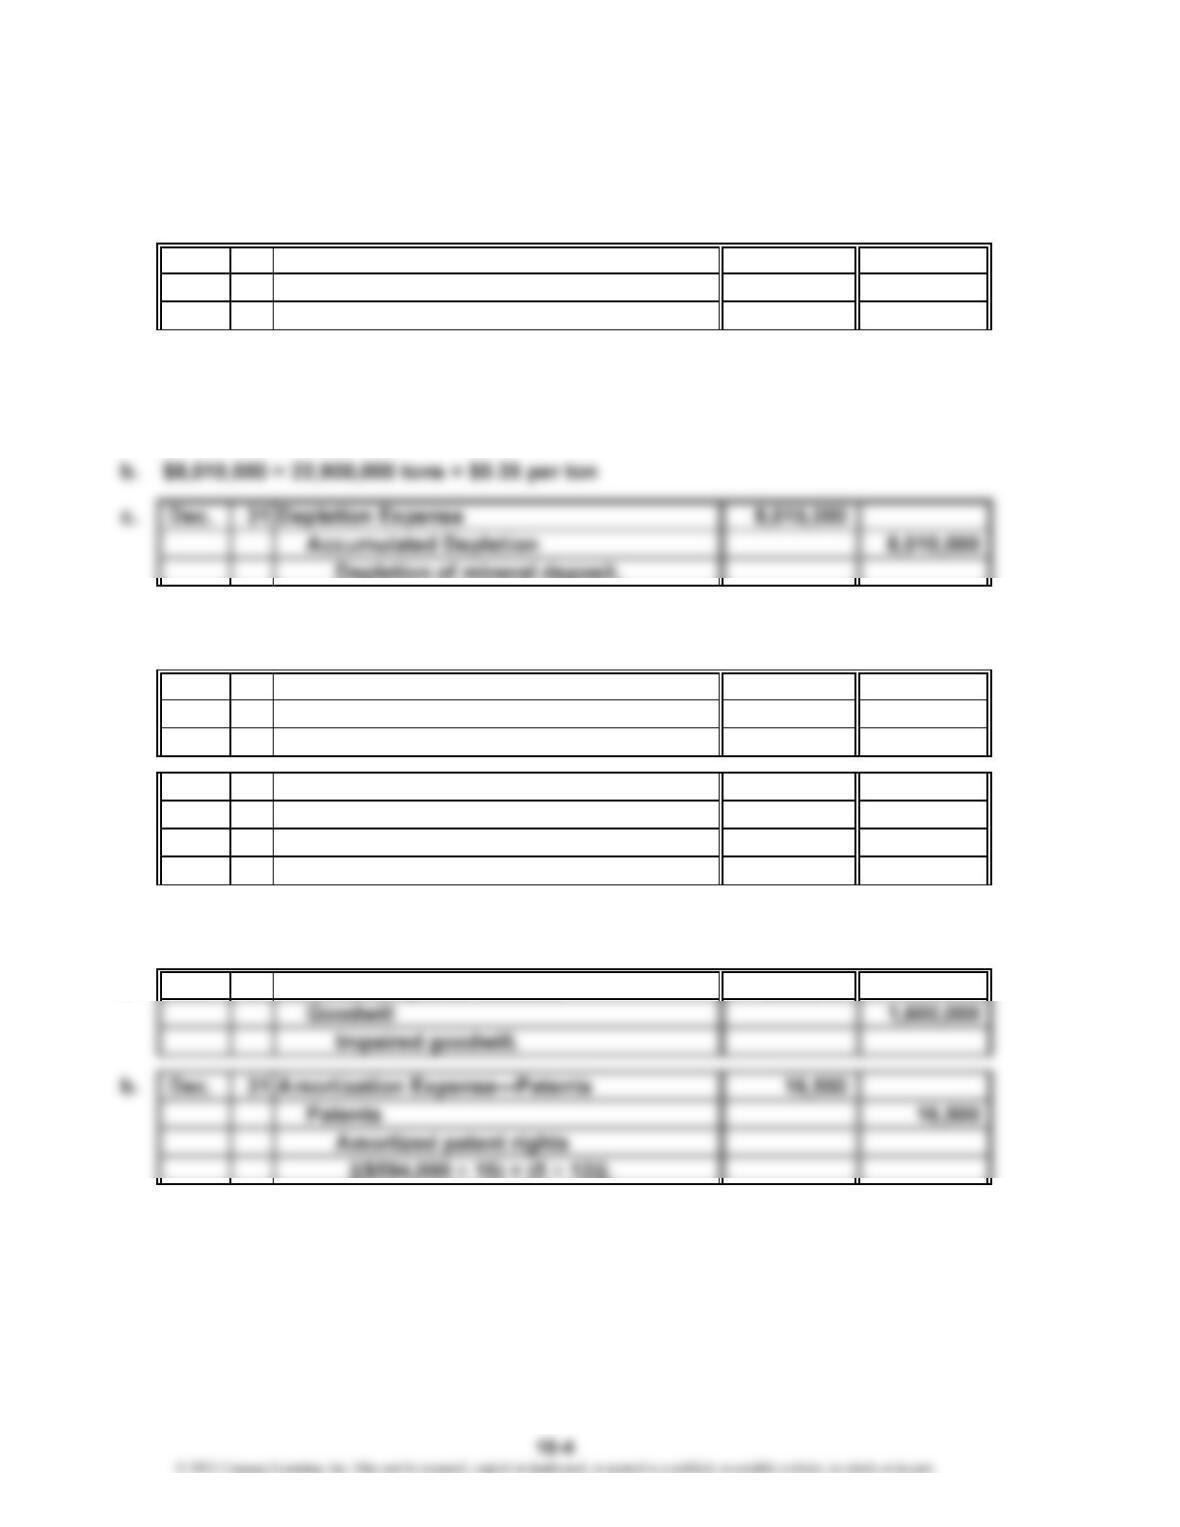
a. $0.35 per ton = $195,650,000 ÷ 559,000,000 tons
PE 10-8A
a. Dec. 31 Loss from Impaired Goodwill 4,700,000
Goodwill 4,700,000
Impaired goodwill.
b. Dec. 31 Amortization Expense—Patents 78,750
Patents 78,750
Amortized patent rights
[($1,260,000 ÷ 12) × (9 ÷ 12)].
PE 10-8B
a. Dec. 31 Loss from Impaired Goodwill 1,600,000
Dec.
CHAPTER 10 Long-Term Assets: Fixed and Intangible
PE 10-9A
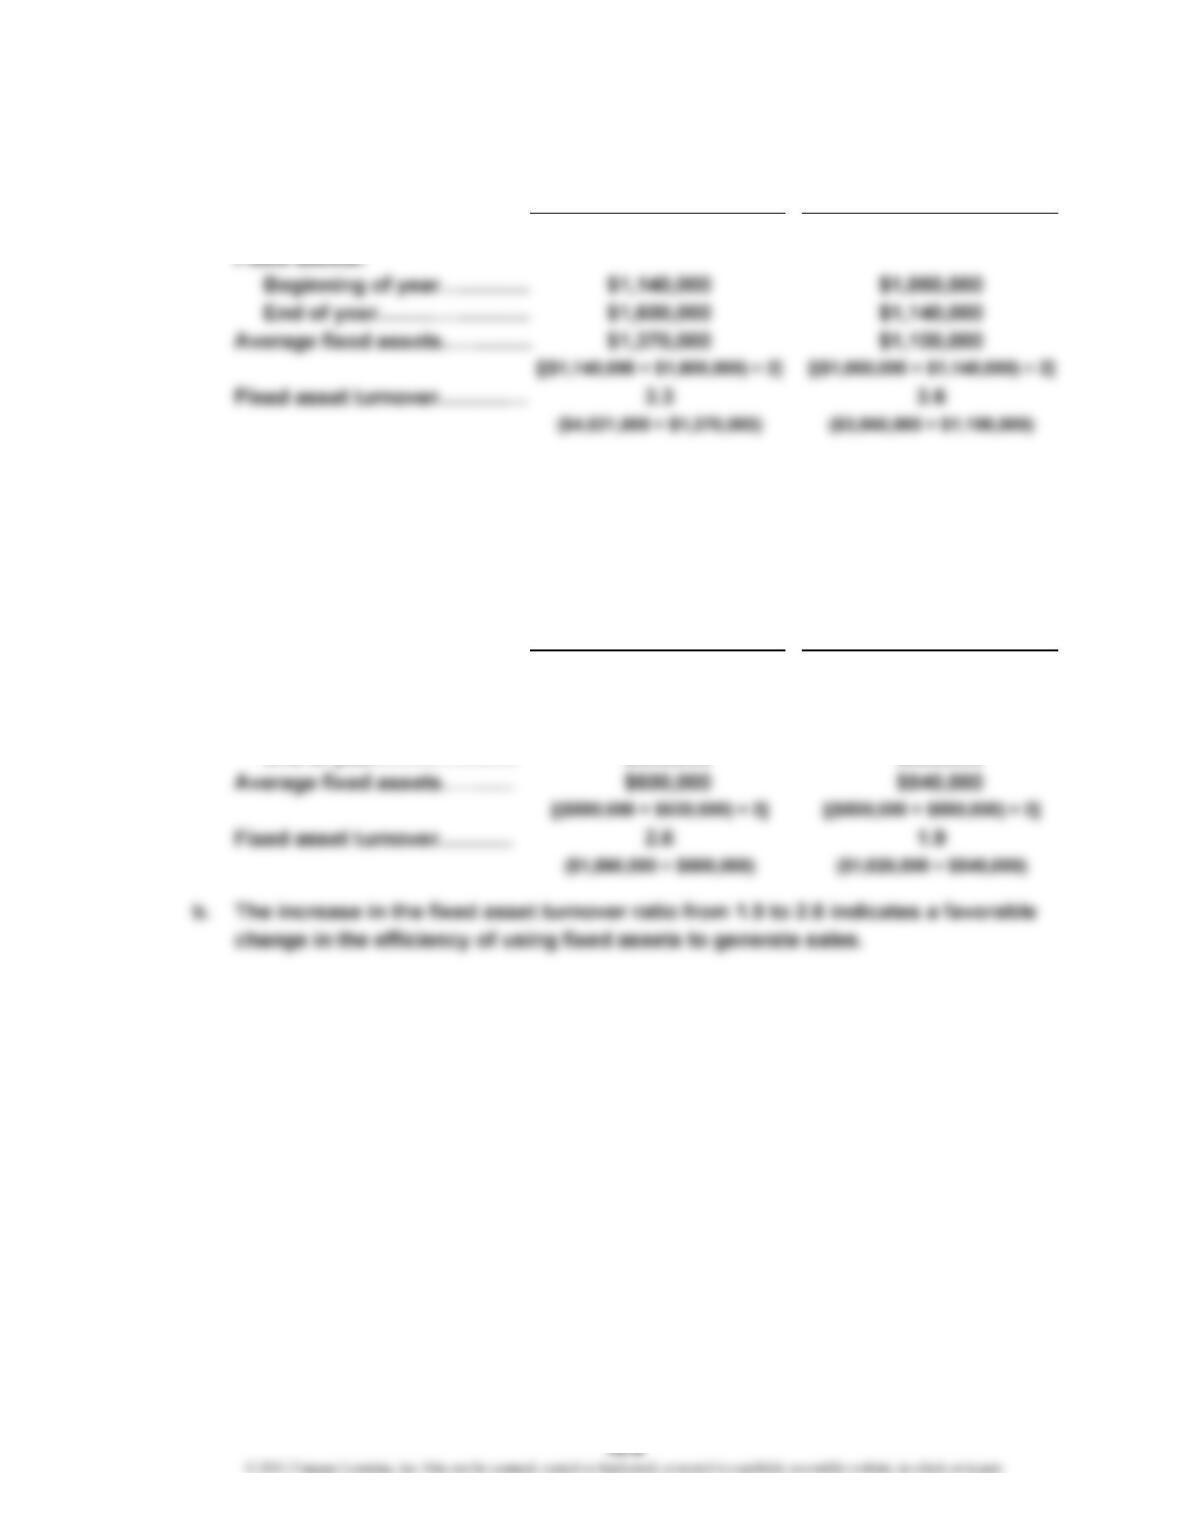
a. Fixed Asset Turnover:
Sales……………………………
…
b. The decrease in the fixed asset turnover ratio from 3.6 to 3.3 indicates an
unfavorable change in the efficiency of using fixed assets to generate sales.
PE 10-9B
a. Fixed Asset Turnover:
Sales…………………………
…
Fixed assets:
Beginning of year………
…
…
Year 2 Year 1
$1,560,000 $1,026,000
$580,000 $500,000
Year 2 Year 1
$4,521,000 $3,960,000
CHAPTER 10 Long-Term Assets: Fixed and Intangible
Ex. 10-1
a. New printing press: 1, 2, 3, 5, 6
b. Used printing press: 7, 8, 9, 11
Ex. 10-3
Initial cost of land ($90,000 + $50,000)……………………
…
$140,000
Legal fees……………………………………………………
…
$ 1,750
Delinquent taxes……………………………………………
…
25,000
Demolition of building……………………………………
…
9,000 35,750
Total costs to acquire and prepare land for use…………
…
$175,750
Less salvage of materials……………………………………
…
1,000
Cost of land to be reported on the balance sheet………
…
$174,750
Ex. 10-5
(a) 10% (100% ÷ 10), (b) 12.5% (100% ÷ 8), (c) 4% (100% ÷ 25),
(d) 2.5% (100% ÷ 40), (e) 20% (100% ÷ 5), (f) 25% (100% ÷ 4),
(g) 5% (100% ÷ 20)
Ex. 10-6
$4,400 [($66,700 – $5,100) ÷ 14]
EXERCISES
CHAPTER 10 Long-Term Assets: Fixed and Intangible
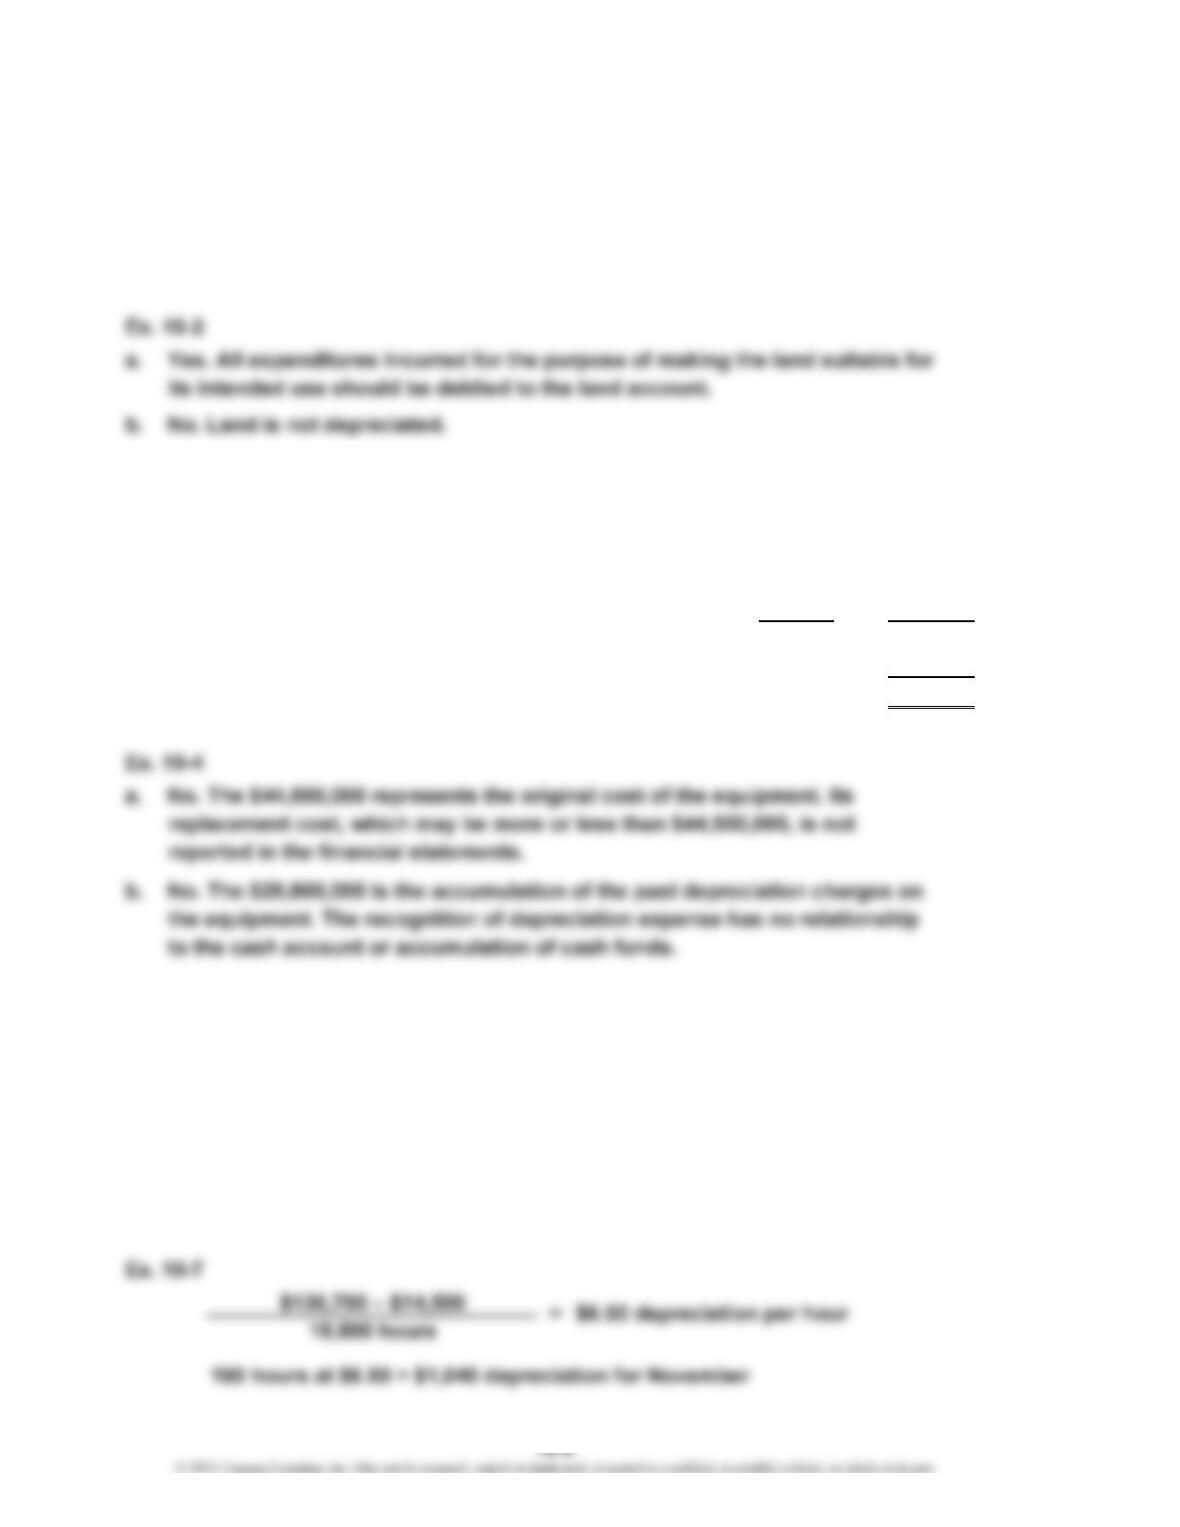
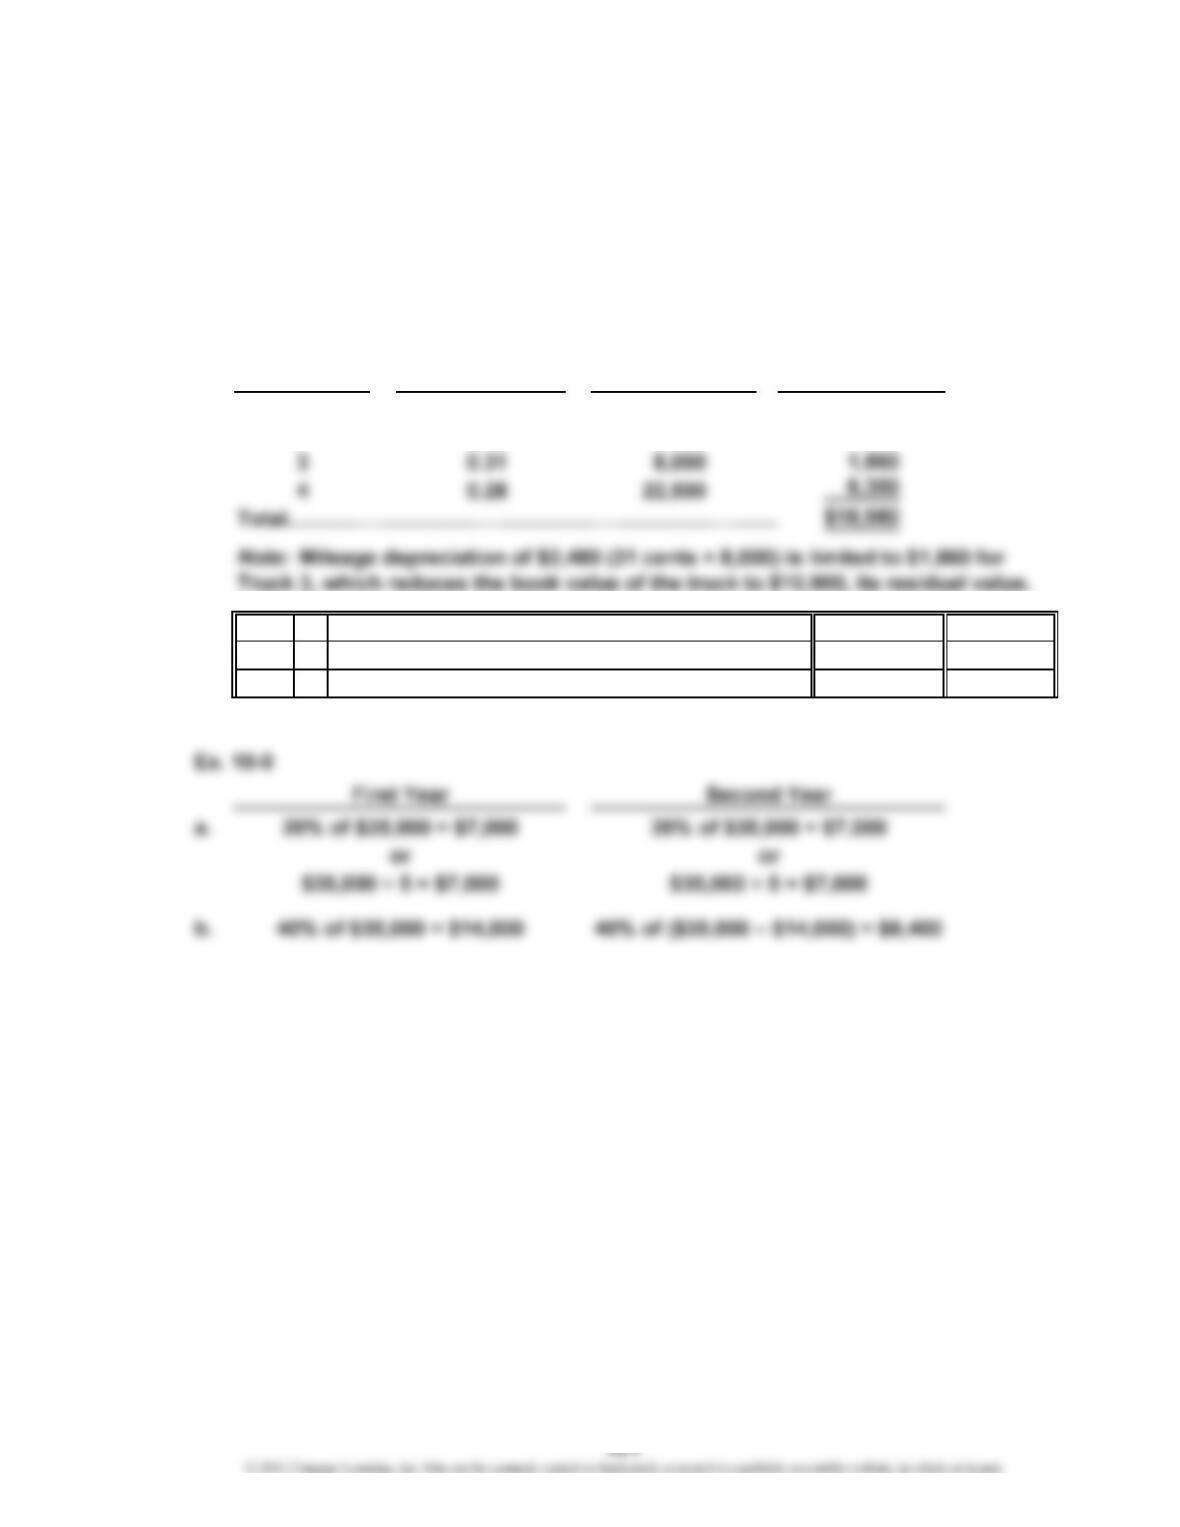
Ex. 10-8
a. Depreciation Rate per Mile:
Truck 1 ($80,000 – $15,000) ÷ 250,000 = $0.26
Truck 2 ($54,000 – $6,000) ÷ 300,000 = $0.16
Truck 3 ($72,900 – $10,900) ÷ 200,000 = $0.31
Truck 4 ($90,000 – $22,800) ÷ 240,000 = $0.28
Miles Operated
21,000
33,500
b. Dec. 31 Depreciation Expense—Trucks 18,980
Accumulated Depreciation—Trucks 18,980
Truck depreciation.
Ex. 10-10
a. 5% of ($61,000 – $9,000) = $2,600 or [($61,000 – $9,000) ÷ 20]
b. Year 1: 10% of $61,000 = $6,100
Year 2: 10% of ($61,000 – $6,100) = $5,490
Rate per Mile Depreciation
Accumulated
Truck No.
1
2
$0.26
0.16
Credit to
$ 5,460
5,360
CHAPTER 10 Long-Term Assets: Fixed and Intangible
Ex. 10-11
a. Year 1: ($105,000 – $12,000) ÷ 10 = $9,300; $9,300 × (8 ÷ 12) = $6,200
Year 2: ($105,000 – $12,000) ÷ 10 = $9,300
b. Year 1: 8 ÷ 12 × 20% of $105,000 = $14,000
Year 2: 20% of ($105,000 – $14,000) = $18,200
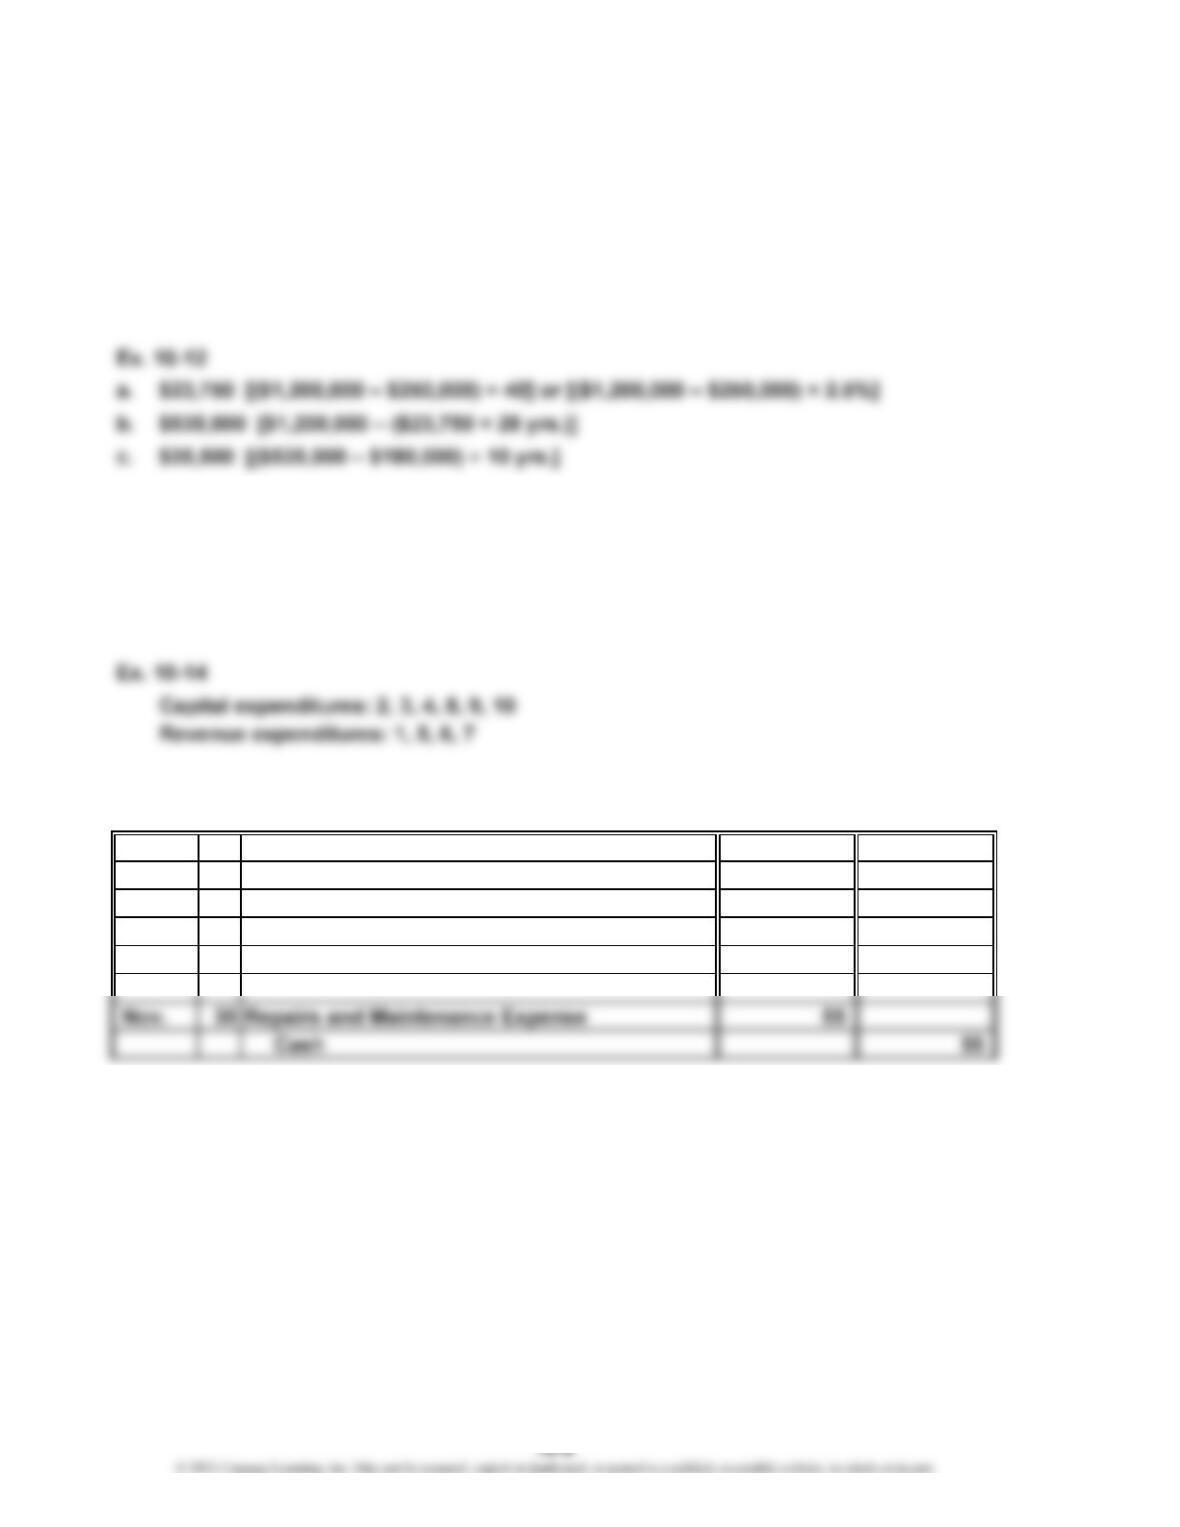
Ex. 10-13
Capital expenditures: 1, 3, 5, 7, 8, 9, 10
Revenue expenditures: 2, 4, 6
Ex. 10-15
Mar. 20 Accumulated Depreciation—Delivery Truck 1,890
Cash 1,890
June 11 Delivery Truck 1,350
Cash 1,350
CHAPTER 10 Long-Term Assets: Fixed and Intangible
Ex. 10-16
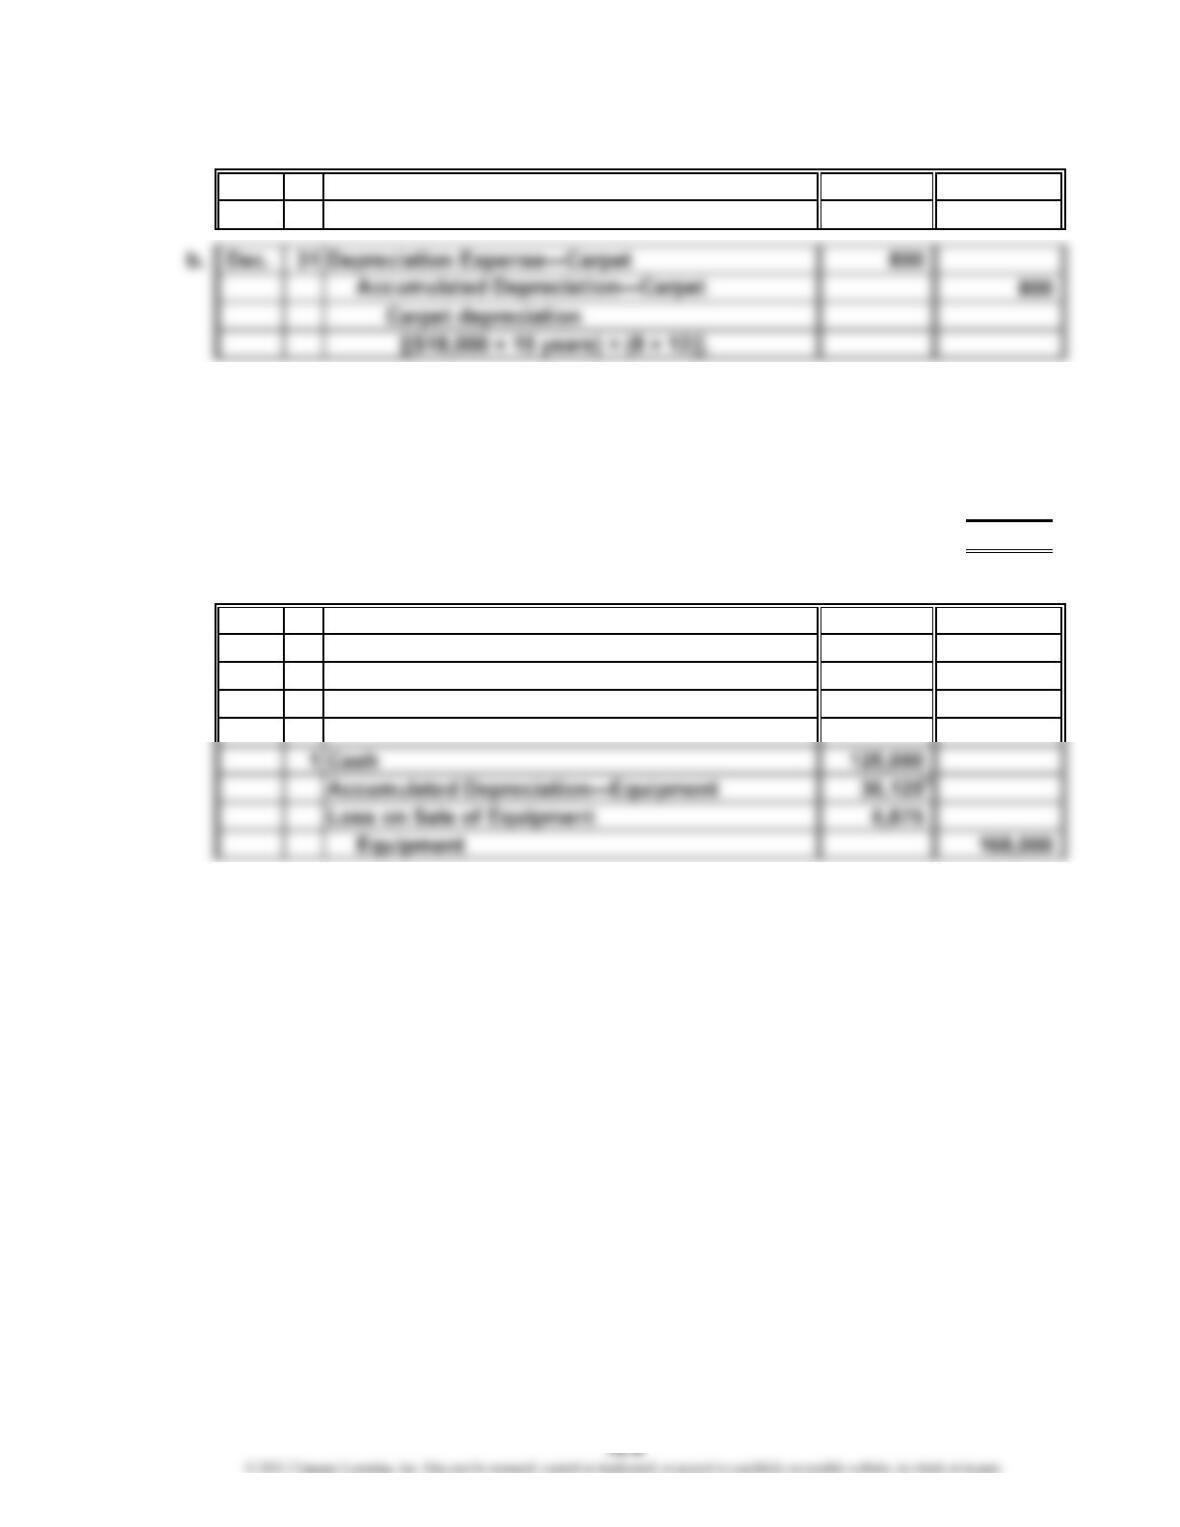
a. Apr. 30 Carpet 18,000
Cash 18,000
Ex. 10-17
a. Cost of equipment…………………………………………………………………
…
$168,000
Less accumulated depreciation at end of fourth year, December 31
(4 years at $8,500 per year)……………………………………………………
…
34,000
Book value at end of fourth year, December 31………………………………
…
$134,000
Yearly depreciation = ($168,000 – $15,000) ÷ 18 = $8,500
b. Apr. 1 Depreciation Expense—Equipment 2,125
Accumulated Depreciation—Equipment 2,125
Equipment depreciation
($8,500 × 3 ÷ 12).
* Accumulated Depreciation—Equipment = $34,000 + $2,125 = $36,125
CHAPTER 10 Long-Term Assets: Fixed and Intangible
Ex. 10-18
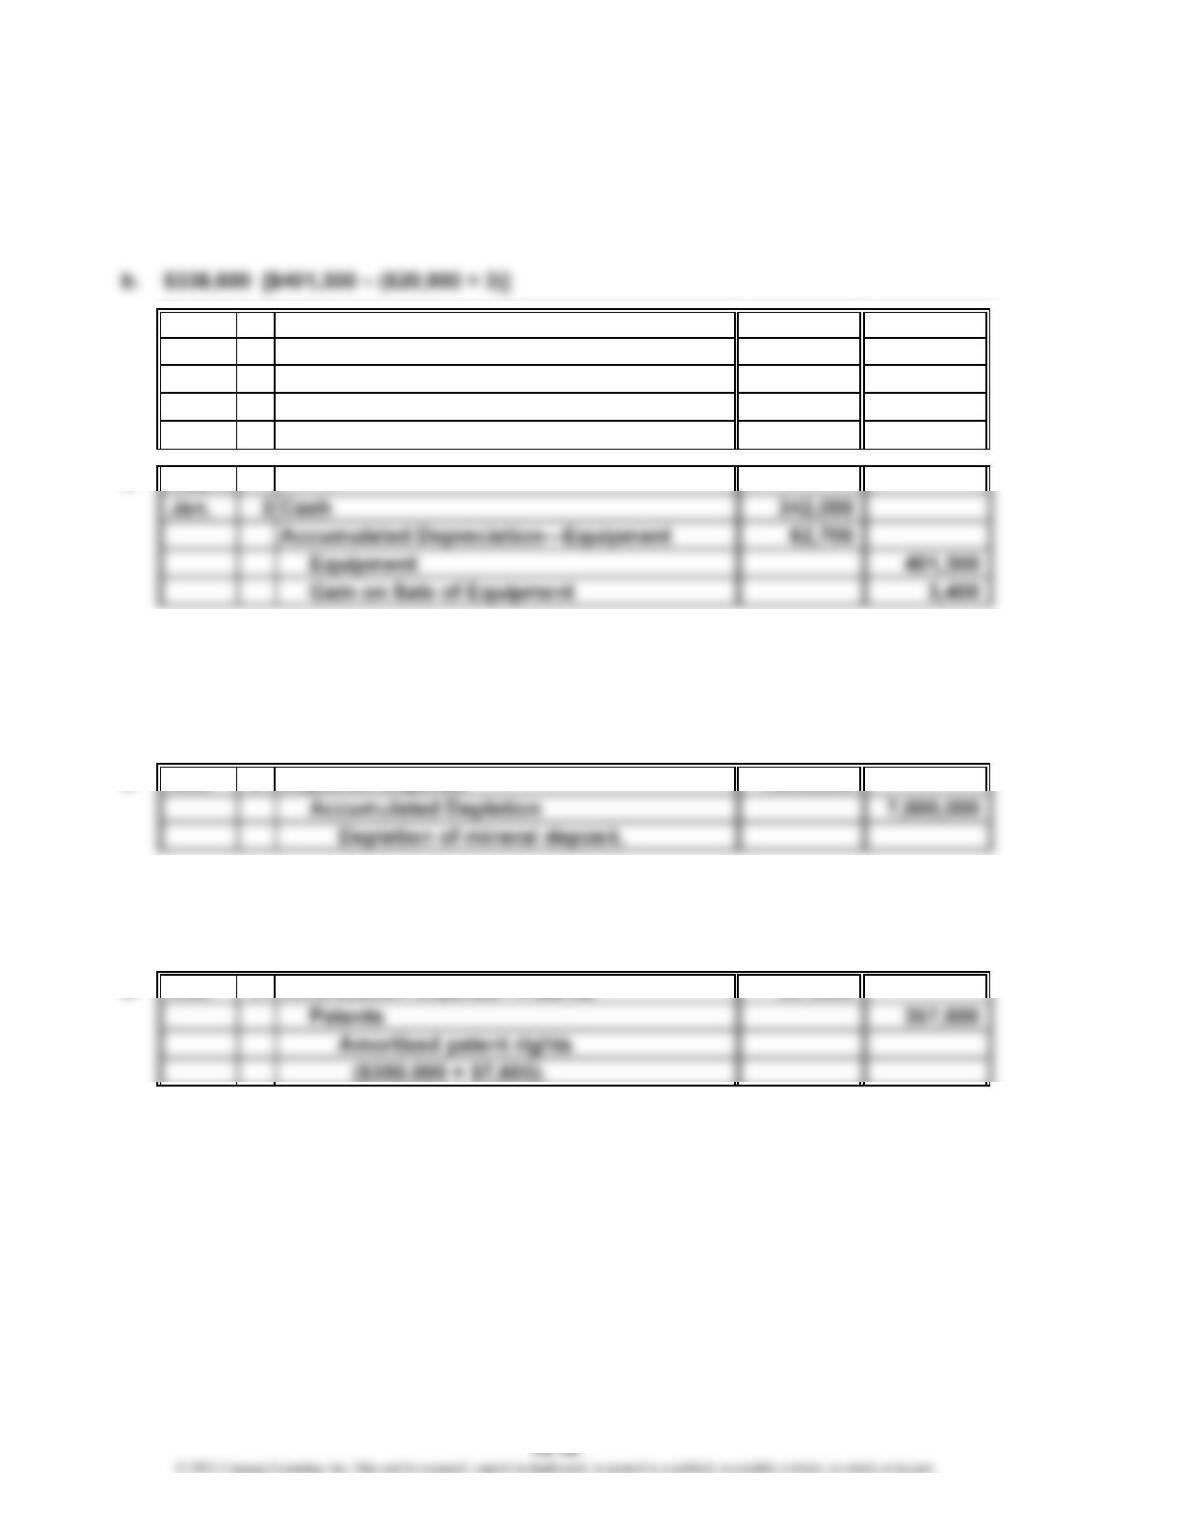
a. Year 1 depreciation expense: $20,900 [($401,300 – $25,100) ÷ 18]
Year 2 depreciation expense: $20,900
Year 3 depreciation expense: $20,900
c. Year 4
Jan. 3 Cash 315,000
Accumulated Depreciation—Equipment 62,700
Loss on Sale of Equipment 23,600
Equipment 401,300
Ex. 10-19
a. $53,200,000 ÷ 19,000,000 tons = $2.80 depletion per ton
2,500,000 tons × $2.80 = $7,000,000 depletion expense
Ex. 10-20
a. ($2,800,000 ÷ 8) + ($38,000 ÷ 5) = $357,600 total patent amortization expense
CHAPTER 10 Long-Term Assets: Fixed and Intangible
Ex. 10-21
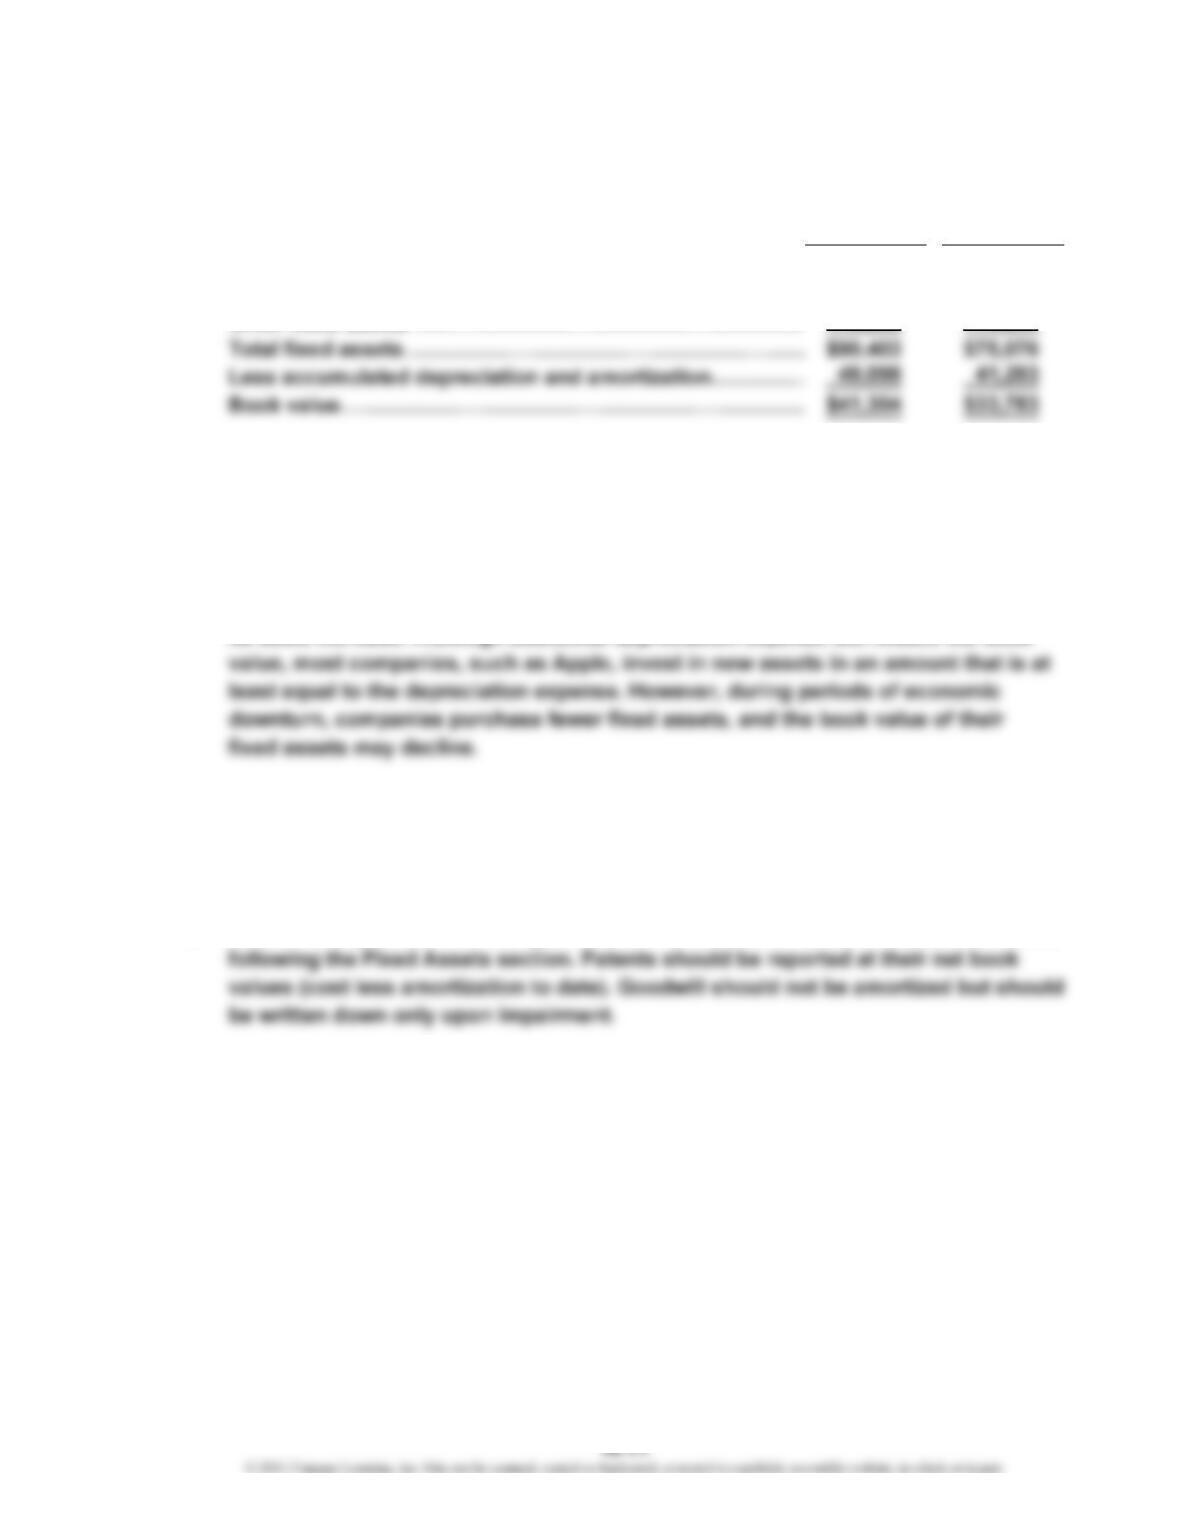
a. Property, Plant, and Equipment (in millions):
Current Preceding
Year Year
Land and buildings………………………………………………
…
$16,216 $13,587
Machinery, equipment, and internal-use software…………
…
65,982 54,210
8,205 7,279
A comparison of the book values of the current and preceding years indicates
that the book value increased. A comparison of the total cost and accumulated
depreciation reveals that Apple purchased $15,327 million ($90,403 – $75,076) of
additional fixed assets, which was offset by the additional depreciation expense
of $7,806 million ($49,099 – $41,293) taken during the current year.
b. We would expect Apple’s book value of fixed assets to increase during the year as
Ex. 10-22
1. Fixed assets should be reported at cost and not replacement cost.
2. Land does not depreciate.
3. Patents and goodwill are intangible assets that should be listed in a separate section
…
CHAPTER 10 Long-Term Assets: Fixed and Intangible
Ex. 10-23
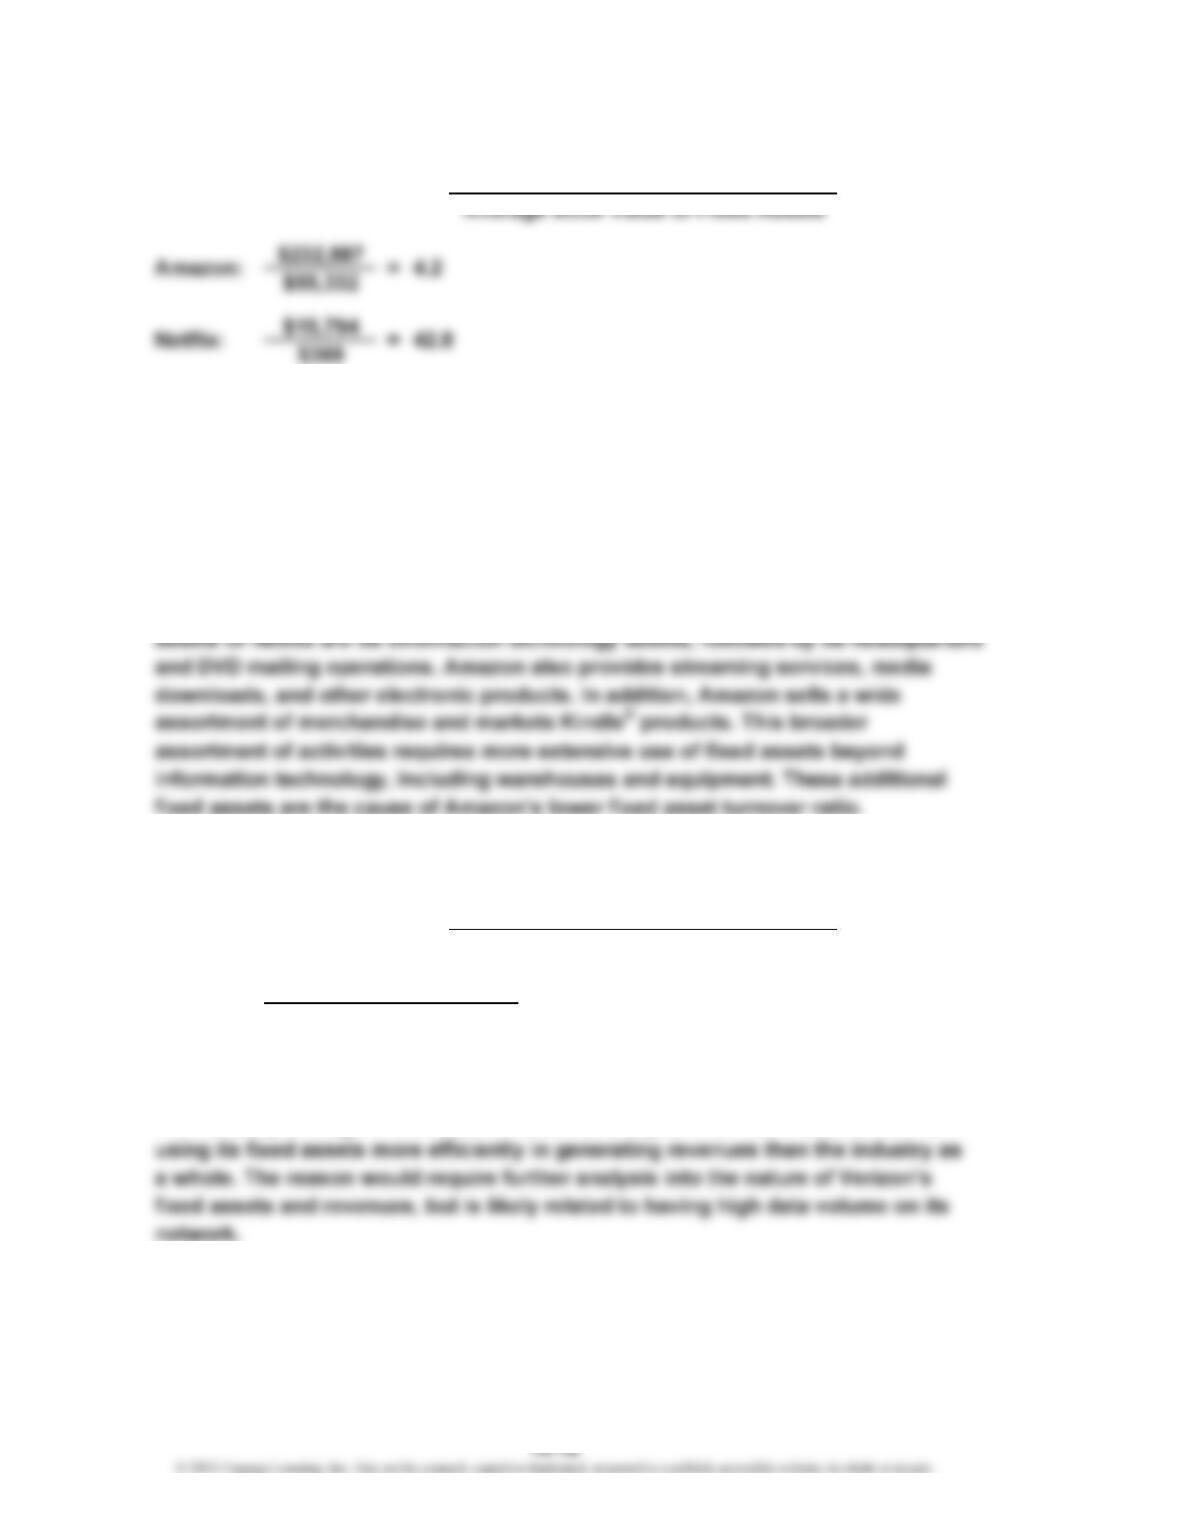
b. Netflix is more efficient than Amazon in generating revenue from fixed assets.
Netflix’s fixed asset turnover ratio is 42.8, which means it is able to generate $42.80
of revenue for every dollar of fixed assets. Amazon’s fixed asset turnover ratio is 4.2,
which is only $4.20 of revenue for every dollar of fixed assets. Netflix’s fixed asset
turnover ratio is more than 10 times larger than Amazon’s (42.8 ÷ 4.2).
c. The difference in their fixed asset turnover ratios reflects the difference in their
core businesses. Netflix is mostly an Internet streaming and DVD rental company.
These services do not require significant fixed assets. The most significant fixed
fixed assets are the cause of Amazon’s lower fixed asset turnover ratio.
Ex. 10-24
b. Verizon earns $1.50 revenue for every dollar of fixed assets. Telecommunications
requires a significant investment in the network in order to generate revenues.
The industry average fixed asset turnover ratio is just over 1.0. Thus, Verizon is
Fixed Asset Turnover Ratio = Sales
a.
($89,286 + $88,568) ÷ 2
a.
Verizon: $130,863 = 1.5
Sales
Average Book Value of Fixed Assets
Fixed Asset Turnover Ratio =
CHAPTER 10 Long-Term Assets: Fixed and Intangible
Ex. 10-25
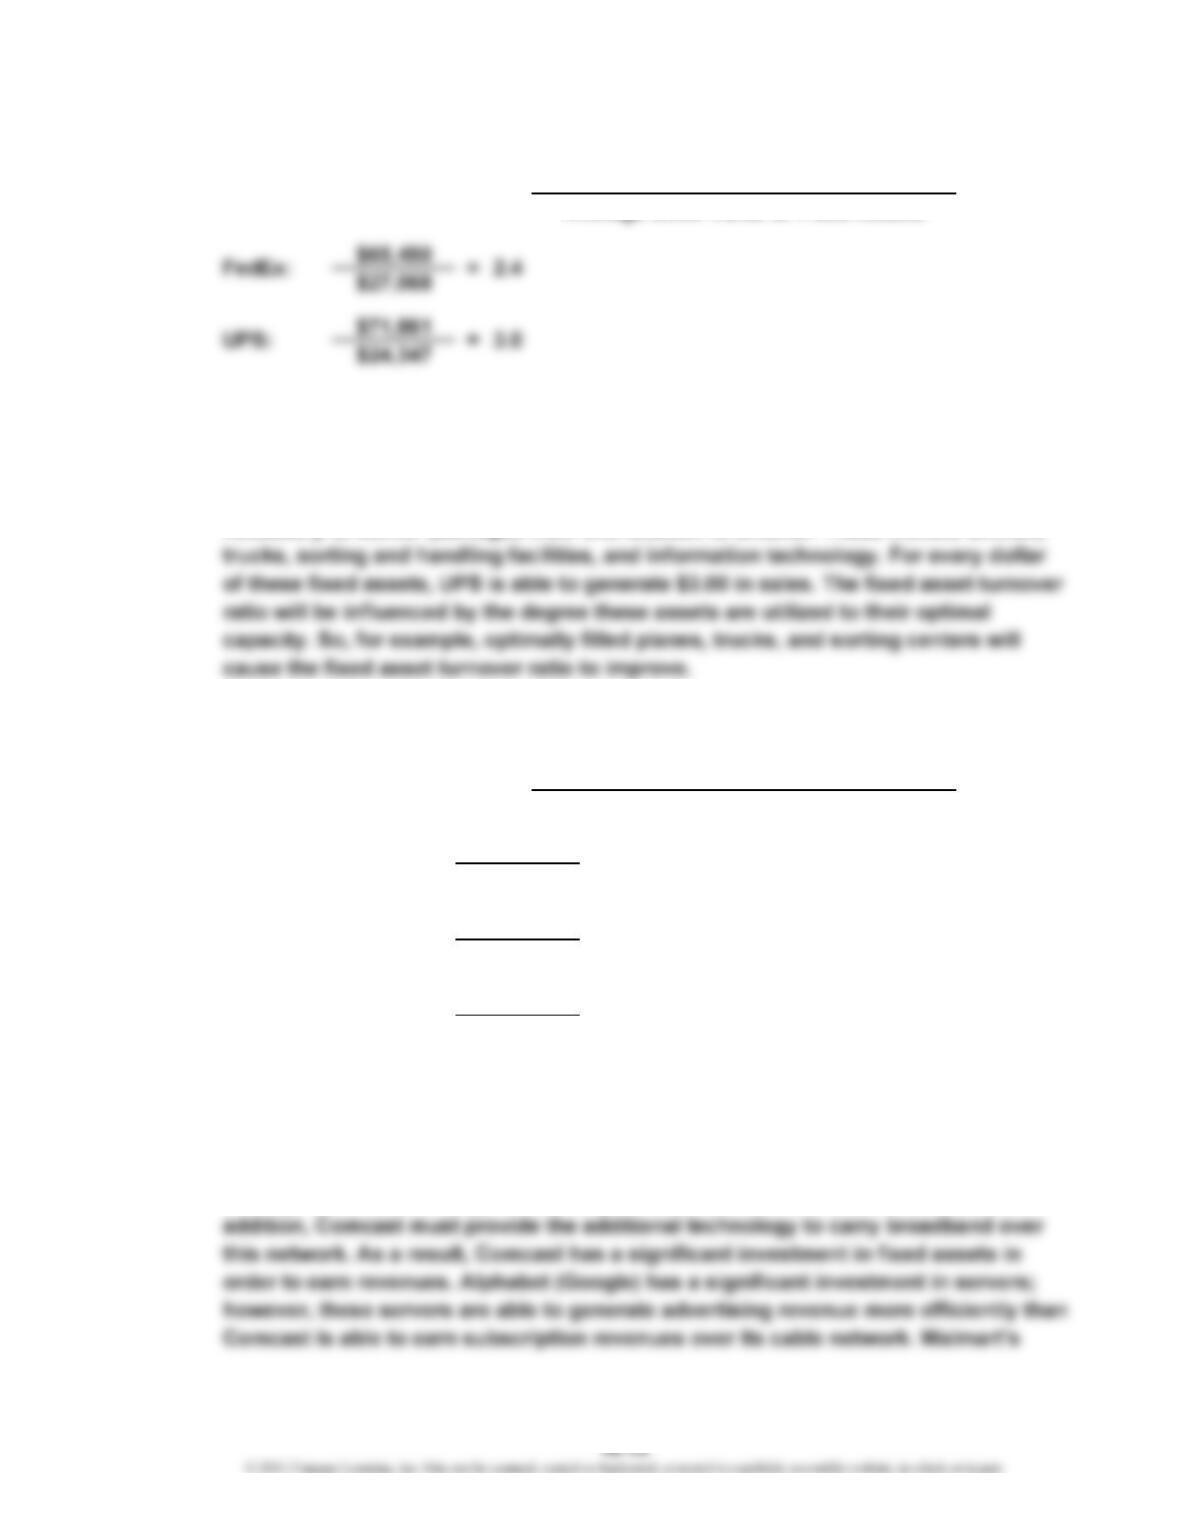
b. The ratios show that UPS is 25% more efficient at using its fixed assets than
FedEx [(3.0 – 2.4) ÷ 2.4].
c. The fixed asset turnover is a measure of how efficiently revenue is generated from
underlying fixed assets. In the case of UPS, the fixed assets represent all fixed asset
s
Ex. 10-26
b. Comcast’s fixed asset turnover is less than the other two companies. This means
Comcast is less efficient at generating sales from fixed assets than the other two
companies. This can be explained by the nature of Comcast’s business. Comcast
must build a complete cable network in order to earn revenues. This includes
underground cable through cities, neighborhoods, and individual residences. In
Sales
Average Book Value of Fixed Assets
2.3
2.7
4.5
$136,819
$51,051
$94,507
$41,454
$510,329
$113,107
=
=
Comcast:
=Walmart:
Alphabet (Google) Inc.:
a.
Fixed Asset Turnover Ratio =
a. Fixed Asset Turnover Ratio = Sales
CHAPTER 10 Long-Term Assets: Fixed and Intangible
Ex. 10-26 (Concluded)
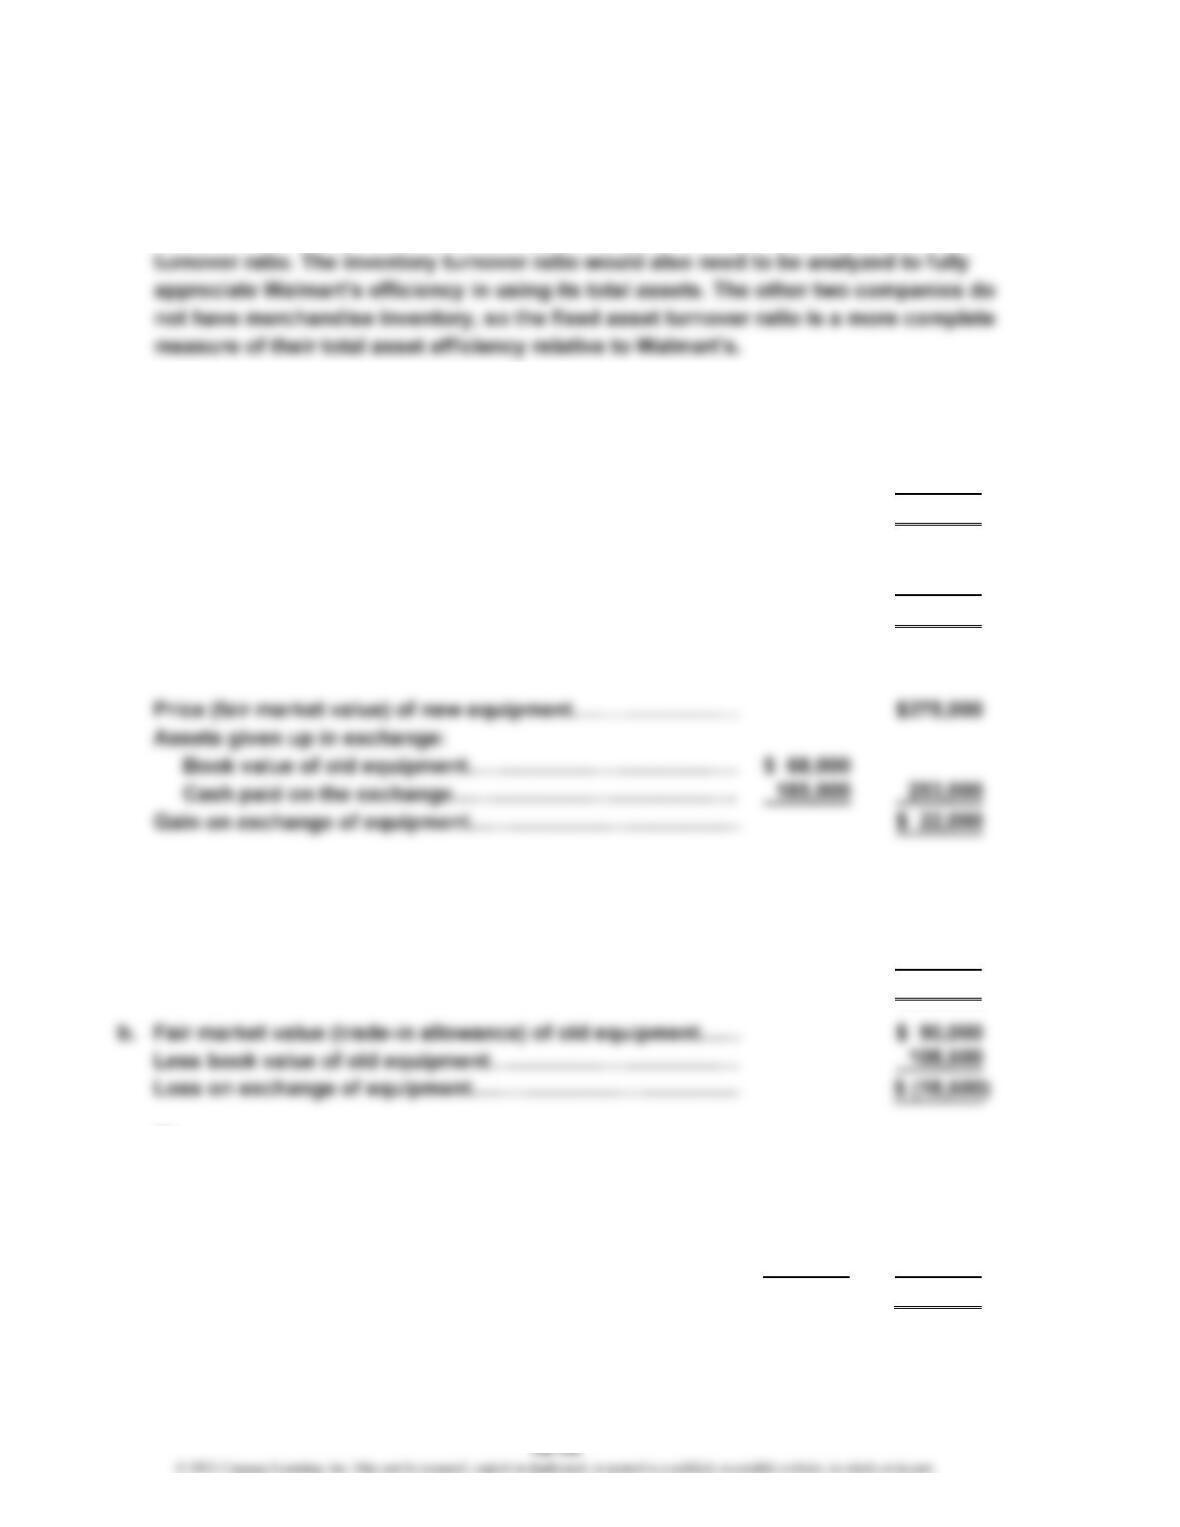
major fixed assets are its stores. However, Walmart’s other major asset is
merchandise inventory, which is not included in the fixed asset turnover ratio.
Thus, Walmart’s higher asset efficiency is only partially explained by the fixed asset
Appendix Ex. 10-27
a. Price (fair market value) of new equipment…………………… $275,000
Less trade-in allowance of old equipment……………………
…
90,000
Cash paid on the date of exchange……………………………
…
$185,000
b. Fair market value (trade-in allowance) of old equipment…
…
$ 90,000
Less book value of old equipment……………………………… 68,000
Gain on exchange of equipment………………………………… $ 22,000
or
…
Appendix Ex. 10-28
a. Price (fair market value) of new equipment…………………… $275,000
Less trade-in allowance of old equipment……………………
…
90,000
Cash paid on the date of exchange……………………………
…
$185,000
…
…
or
Price (fair market value) of new equipment…………………… $275,000
Assets given up in exchange:
Book value of old equipment………………………………… $108,500
Cash paid on the exchange…………………………………
…
185,000 293,500
Loss on exchange of equipment………………………………
…
$ (18,500)
CHAPTER 10 Long-Term Assets: Fixed and Intangible
Appendix Ex. 10-29
a. July 1 Depreciation Expense—Equipment 6,000
Accumulated Depreciation—Equipment 6,000
Equipment depreciation ($12,000 × 6 ÷ 12).
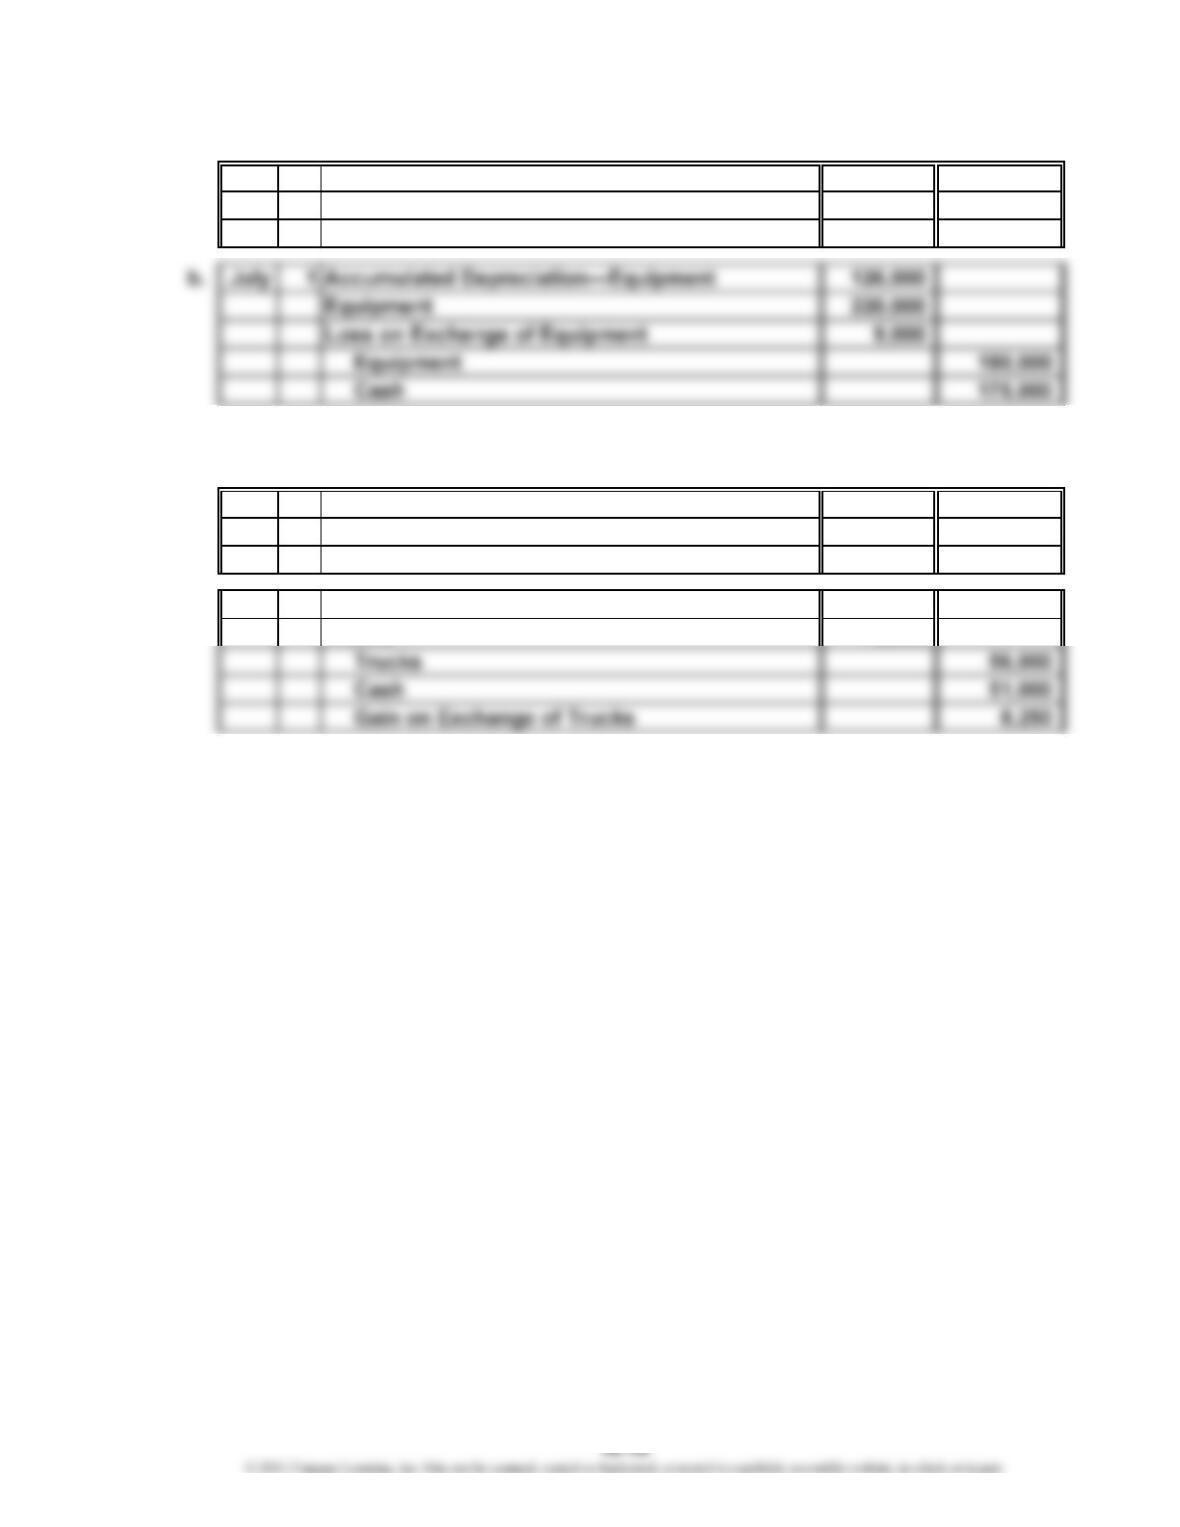
Appendix Ex. 10-30
a. Oct. 1 Depreciation Expense—Trucks 5,250
Accumulated Depreciation—Trucks 5,250
Truck depreciation ($7,000 × 9 ÷ 12).
b. Oct. 1 Accumulated Depreciation—Trucks 40,250
Trucks 75,000
CHAPTER 10 Long-Term Assets: Fixed and Intangible
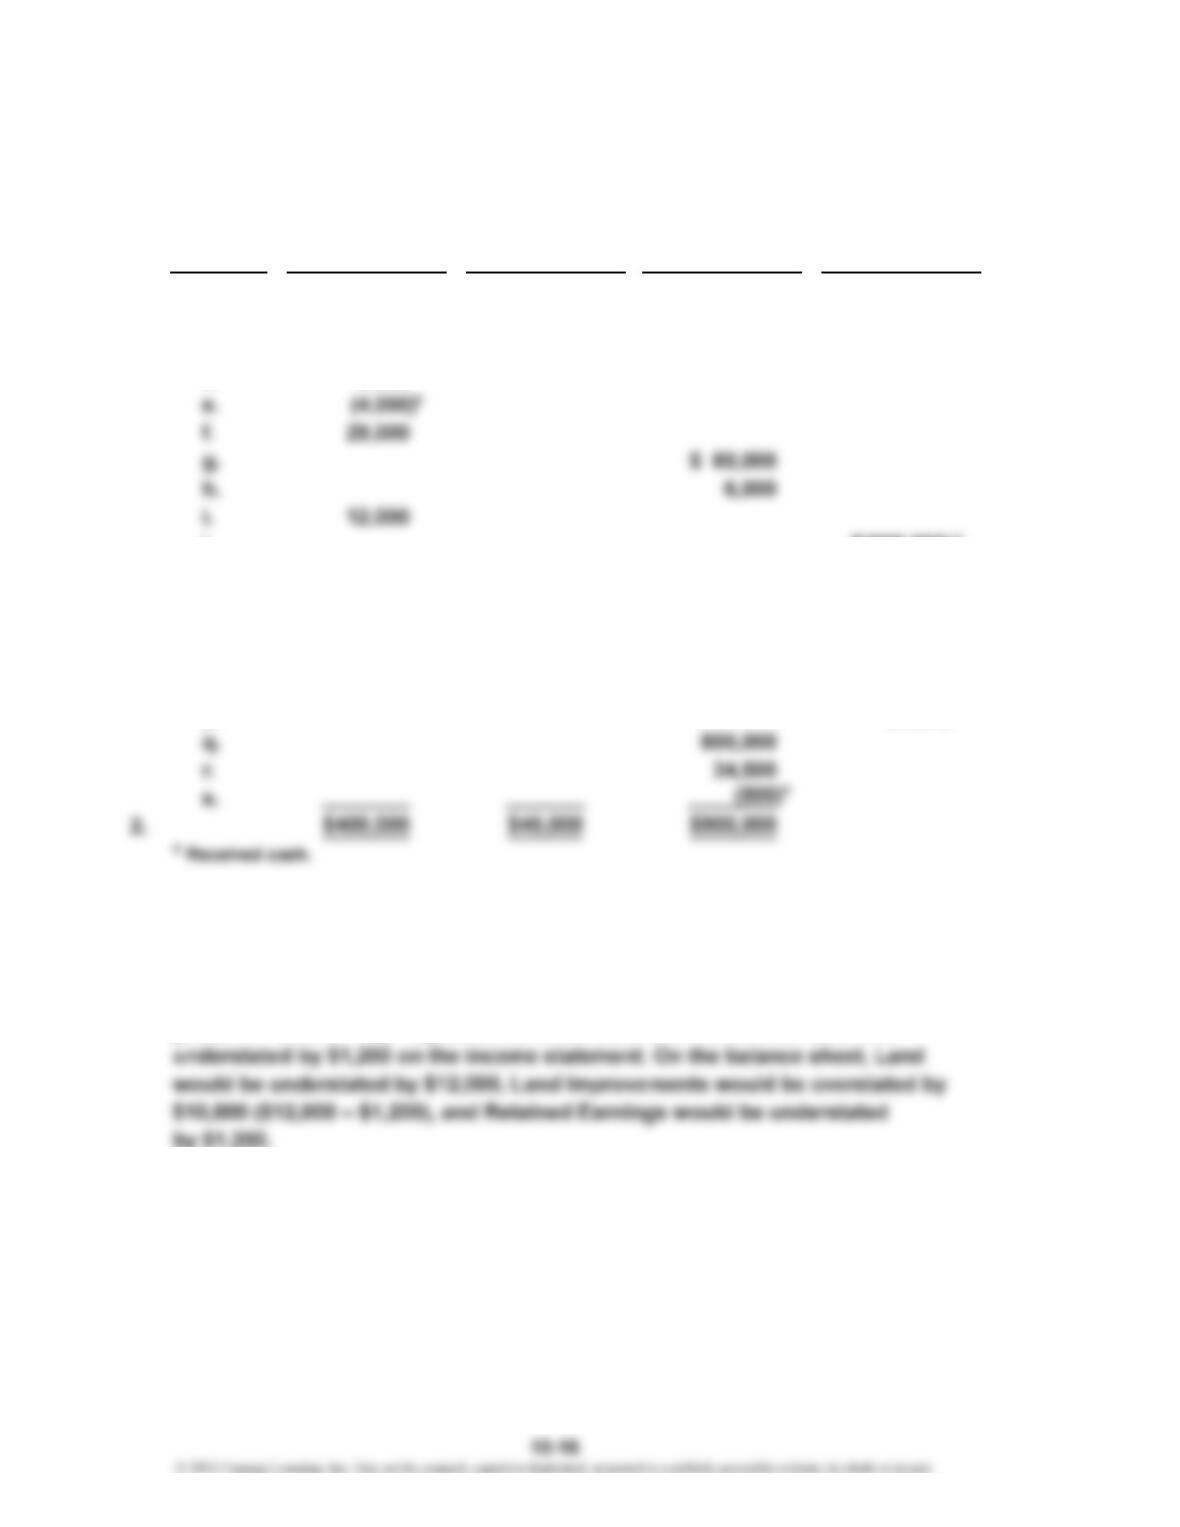
Prob. 10-1A
1. Land Other
Item Land Improvements Building Accounts
a. $ 2,500
b. 340,000
c. 15,500
d. 5,000
j. $(900,000)
k. 5,500
l. $32,000
m. 11,000
n. 2,000
o. 2,500
p. (7,500)
3. Land used as a plant site does not lose its ability to provide services; thus, it is
not depreciated. However, land improvements do lose their ability to provide
services as time passes and are, therefore, depreciated.
4. Because land improvements are depreciated, depreciation expense of $1,200
[$12,000 × (100% ÷ 20) × 2] would be overstated and net income would be
PROBLEMS
*
*