
CHAPTER 10
Budgetary Control and Responsibility Accounting
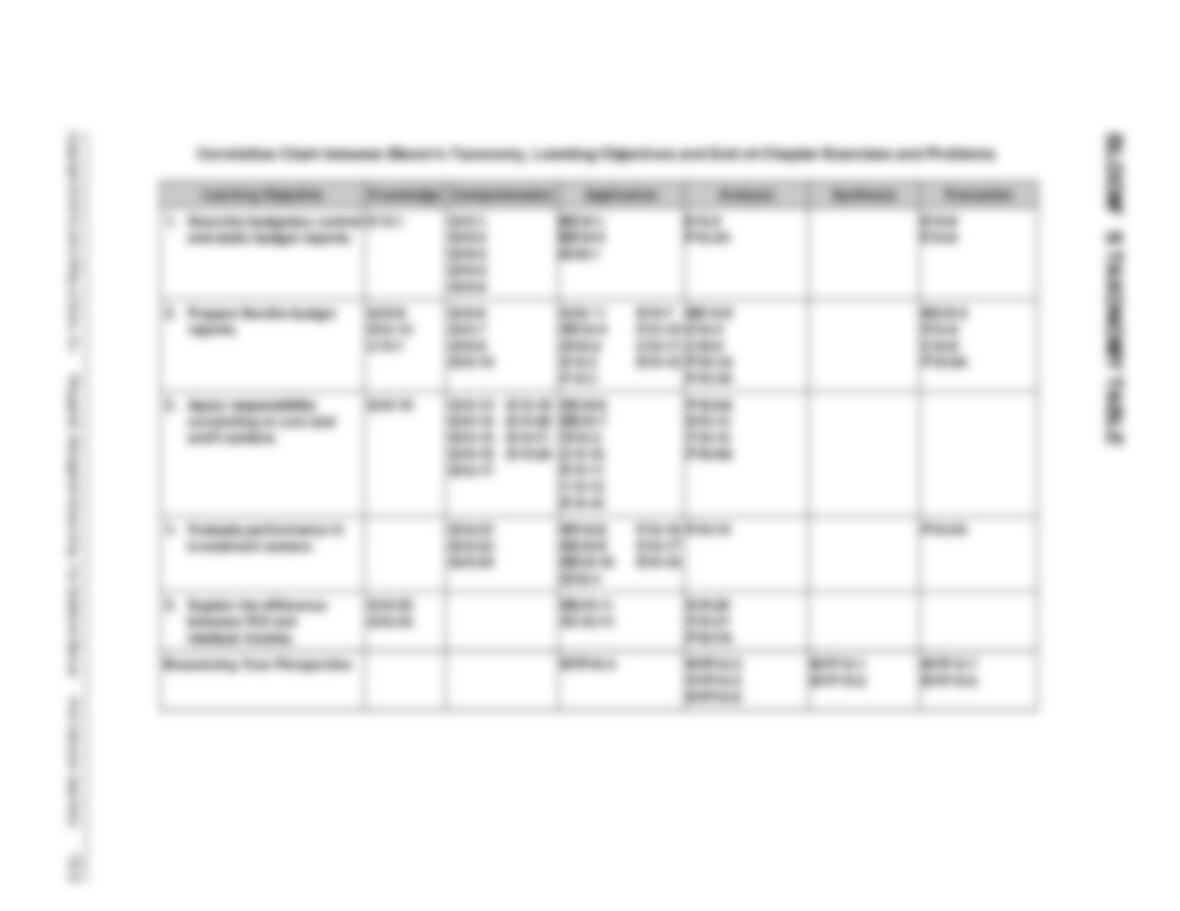
ASSIGNMENT CLASSIFICATION TABLE
Learning Objectives
Questions
Brief
Exercises
Do It!
Exercises
A
Problems
1. Describe budgetary control
and static budget reports.
1, 2, 3, 4, 5
1, 2
1
1, 2, 8, 9
3A
2. Prepare flexible budget
reports.
6, 7, 8, 9, 10,
11, 12
3, 4, 5
2
1, 3, 4, 5, 6, 7,
8, 9, 10, 11,
12
1A, 2A, 3A
3. Apply responsibility
accounting to cost and profit
centers.
13, 14, 15, 16,
17, 18, 19, 20,
21, 24
6, 7
3
10, 11, 13, 14,
15, 16
4A, 6A
4. Evaluate performance in
investment centers.
22, 23, 24
8, 9, 10
4
16, 17, 18, 19
5A
*5. Explain the difference
between ROI and residual
income.
25, 26
11, 12
20, 21
7A
*Note: All asterisked Questions, Exercises, and Problems relate to material contained in the appendix to the
chapter.
ASSIGNMENT CHARACTERISTICS TABLE
Problem
Number
Description
Difficulty
Level
Time
Allotted (min.)
1A
Prepare flexible budget and budget report for manufacturing
overhead.
Simple
20–30
2A
Prepare flexible budget, budget report, and graph for
manufacturing overhead.
Moderate
30–40
3A
State total budgeted cost formula, and prepare flexible
budget reports for two time periods.
Simple
20–30
5A
Prepare responsibility report for an investment center,
Moderate
40–50
6A
Prepare reports for cost centers under responsibility
Moderate
40–50
Compare ROI and residual income.
ANSWERS TO QUESTIONS
1. (a) Budgetary control is the use of budgets in controlling operations.
(b) The steps in budgetary control are:
(1) Develop the planned objectives (budget).
2.
Purpose
Name of Report
Frequency
Primary Recipient(s)
(a)
(b)
(c)
Scrap
Departmental overhead costs
Income statement
Daily
Monthly
Monthly and Quarterly
Production manager
Department manager
Top management
3. The budget report for the second quarter can include year-to-date information as well as data for
the second quarter.
4. There is no justification for Ken’s concern. The sales budget is derived from the sales forecast
and it represents management’s best estimate of sales. Thus, it is a useful basis for evaluating
sales performance.
5. A static budget is an appropriate basis for evaluating a manager’s effectiveness in controlling
costs when:
6. Yes, this is true. A flexible budget is a series of static budgets at different levels of activity.
7. The performance is unfavorable. The budgeted indirect labor cost in the static budget is $1.35 per
direct labor hour ($54,000 ÷ 40,000). At 45,000 direct labor hours, budgeted costs are $60,750
(45,000 X $1.35). Thus, indirect labor is $3,250 over budget ($64,000 – $60,750).
8. The performance is favorable. Factory insurance is a fixed cost. At 50,000 direct labor hours, the
budgeted cost is still $6,500. Thus, factory insurance is $200 under budget ($6,500 – $6,300).
9. The steps in preparing a flexible budget are:
(1) Identify the activity index and the relevant range of activity.
10. Cali Company can say that total budgeted costs are $20,000 fixed plus $6.50 per direct labor
hour [($85,000 – $20,000) ÷ 10,000].
11. (a) At 9,000 hours, total budgeted costs are $86,000, or [$50,000 + ($4 X 9,000)].
(b) At 12,345 hours, total budgeted costs are $99,380, or [$50,000 + ($4 X 12,345)].
Questions Chapter 10 (Continued)
12. Management by exception means that top management’s review of a budget report is focused
either entirely or primarily on differences between actual results and planned objectives. The
criteria for identifying exceptions are materiality and controllability of the item.
13. Responsibility accounting is a method of controlling operations that involves accumulating and
reporting costs (and revenues, where relevant) on the basis of the manager who has the authority
to make the day-to-day decisions about the items. The purpose of responsibility accounting is to
evaluate a manager’s performance on the basis of matters directly under that manager’s control.
15. A cost is controllable at a given level of managerial responsibility if the manager has the power to
incur the cost within a given period of time. Most costs incurred directly are controllable, whereas costs
incurred indirectly and allocated to a responsibility level are noncontrollable at that level.
16. Responsibility reports differ from budget reports in two respects: (1) a distinction is made between
controllable and noncontrollable items and (2) performance reports either emphasize, or only
include, items controllable by the individual manager.
18. There are three types of responsibility centers:
(a) A cost center incurs costs (and expenses) but does not generate revenues.
19. (a) Only controllable costs are included in a performance report for a cost center.
(b) Variable and fixed costs are not identified in the report.
20. Direct fixed costs relate specifically to one center and are incurred for the sole benefit of that
center. An indirect fixed cost relates to the company’s overall activities and is incurred for the
Questions Chapter 10 (Continued)
22. The primary basis for evaluating the performance of the manager of an investment center is
return on investment (ROI). The formula is: Controllable Margin divided by Average Operating Assets.
23. ROI can be improved by: (1) increasing controllable margin and (2) reducing average operating
assets. Controllable margin can be increased by increasing sales or by reducing variable and
controllable fixed costs.
24. (a) The manager being evaluated should have direct input into the process of establishing budget
goals and have the opportunity to respond to the evaluation. (b) Top management should make
the evaluation entirely on matters controllable by the manager, and should fully support the
evaluation process.
SOLUTIONS TO BRIEF EXERCISES
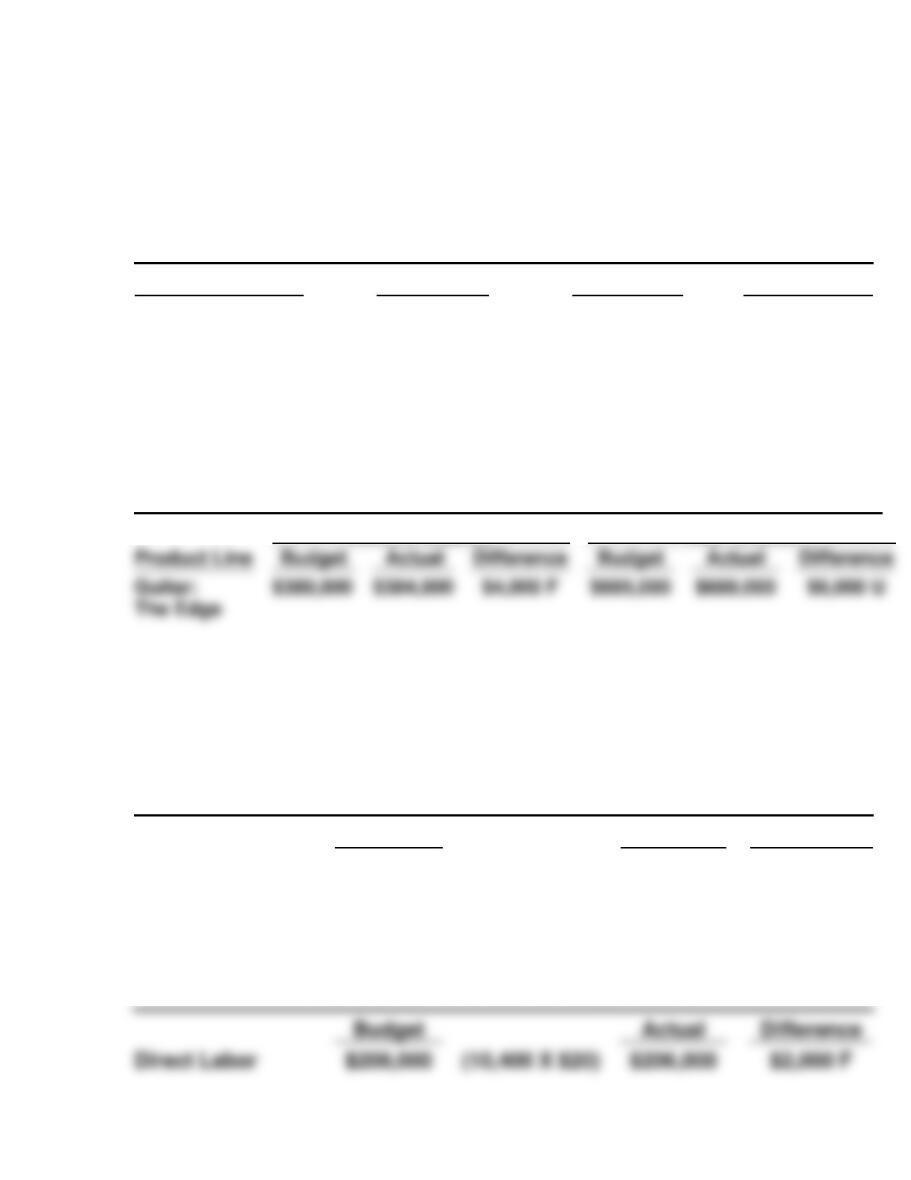
BRIEF EXERCISE 10-1
CROIX COMPANY
Sales Budget Report
For the Quarter Ended March 31, 2017
Product Line
Budget
Actual
Difference
Guitar: The Edge
$315,000
$305,000
$10,000 U
BRIEF EXERCISE 10-2
CROIX COMPANY
Sales Budget Report
For the Quarter Ended June 30, 2017
Second Quarter
Year to Date
The Edge
BRIEF EXERCISE 10-3
(a) ROONEY COMPANY
Static Direct Labor Budget Report
For the Month Ended January 31, 2017
Budget
Actual
Difference
Direct Labor
$200,000
(10,000 X $20)
$206,000
$6,000 U
(b) ROONEY COMPANY
Flexible Direct Labor Budget Report
For the Month Ended January 31, 2017
Direct Labor
(10,400 X $20)
$2,000 F
BRIEF EXERCISE 10-3 (Continued)
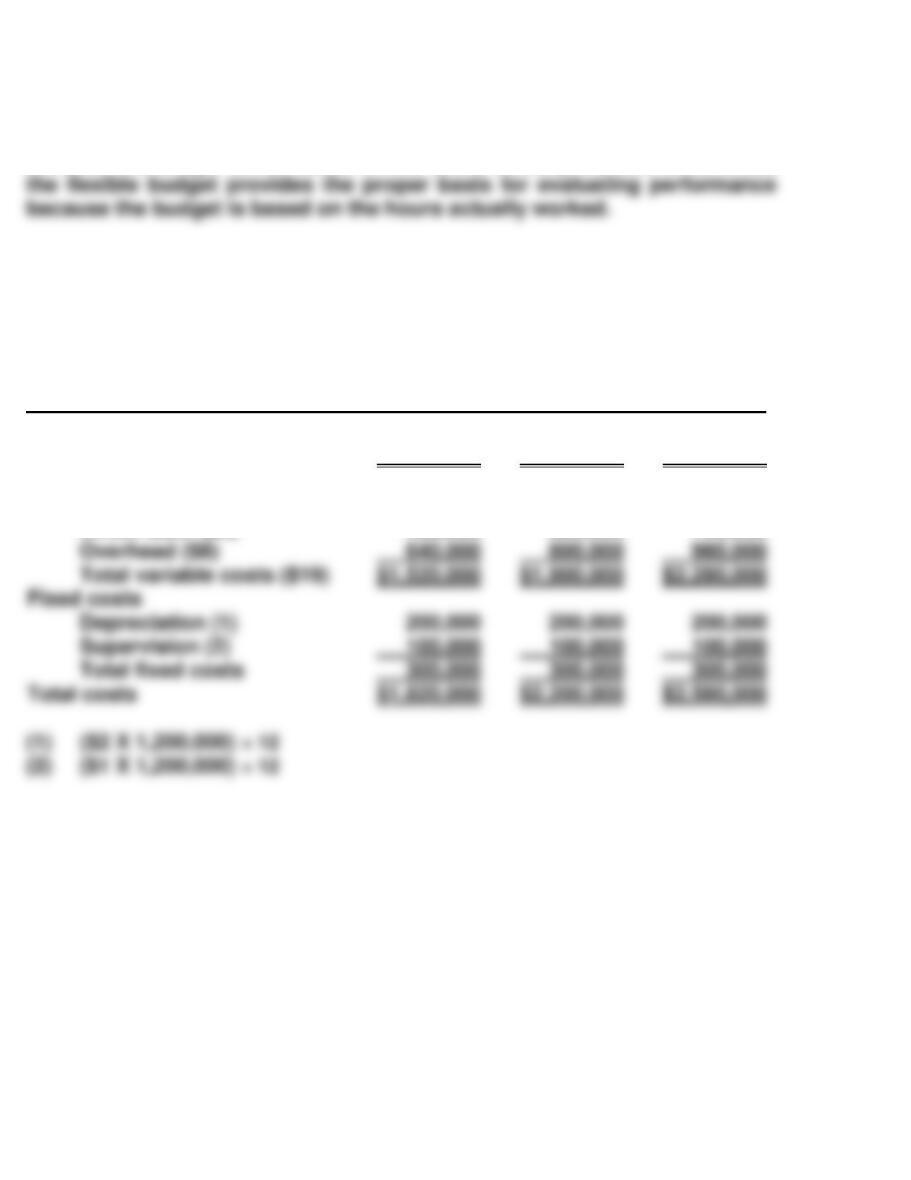
The static budget does not provide a proper basis for evaluating performance
because the budget is not based on the hours actually worked. In contrast,
BRIEF EXERCISE 10-4
GUNDY COMPANY
Monthly Flexible Manufacturing Budget
For the Year 2017
Activity level
Finished units
Variable costs
Direct materials ($5)
Direct labor ($6)
80,000
$ 400,000
480,000
100,000
$ 500,000
600,000
120,000
$ 600,000
720,000
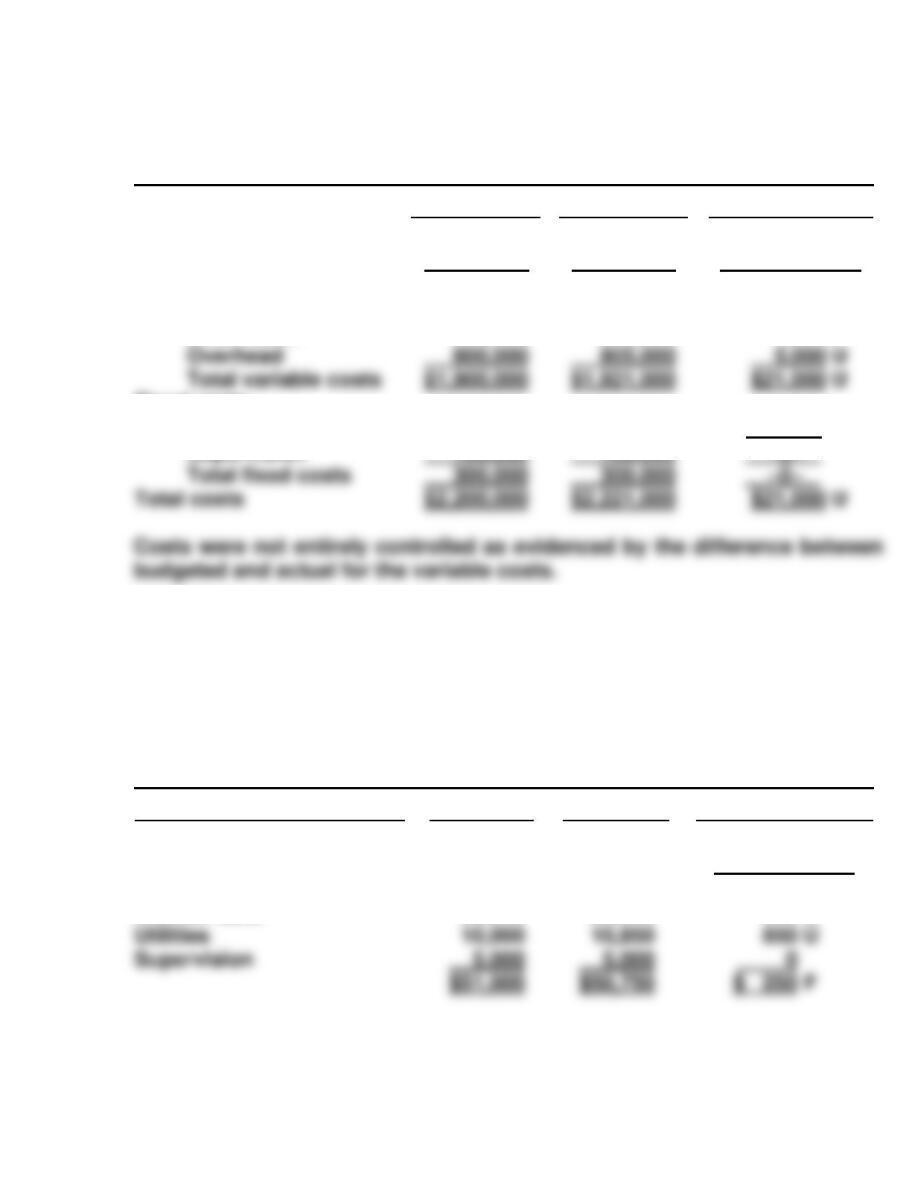
BRIEF EXERCISE 10-5
GUNDY COMPANY
Manufacturing Flexible Budget Report
For the Month Ended March 31, 2017
Budget
Actual
Difference
Units produced
Variable costs
Direct materials
Direct labor
Fixed costs
Depreciation
Supervision
100,000
$ 500,000
600,000
200,000
100,000
100,000
$ 520,000
596,000
200,000
100,000
Favorable F
Unfavorable U
$20,000 U
4,000 F
–0–
–0–
BRIEF EXERCISE 10-6
HANNON COMPANY
Assembly Department
Manufacturing Overhead Cost Responsibility Report
For the Month Ended April 30, 2017
Controllable Cost
Budget
Actual
Difference
Utilities
$50,750
Indirect materials
Indirect labor
$16,000
20,000
$14,300
20,600
Favorable F
Unfavorable U
$1,700 F
600 U
BRIEF EXERCISE 10-7
TORRES COMPANY
Water Division
Responsibility Report
For the Year Ended December 31, 2017
Budget
Actual
Difference
Sales
Variable costs
$2,000,000
1,000,000
$2,080,000
1,050,000
Favorable F
Unfavorable U
$80,000 F
50,000 U
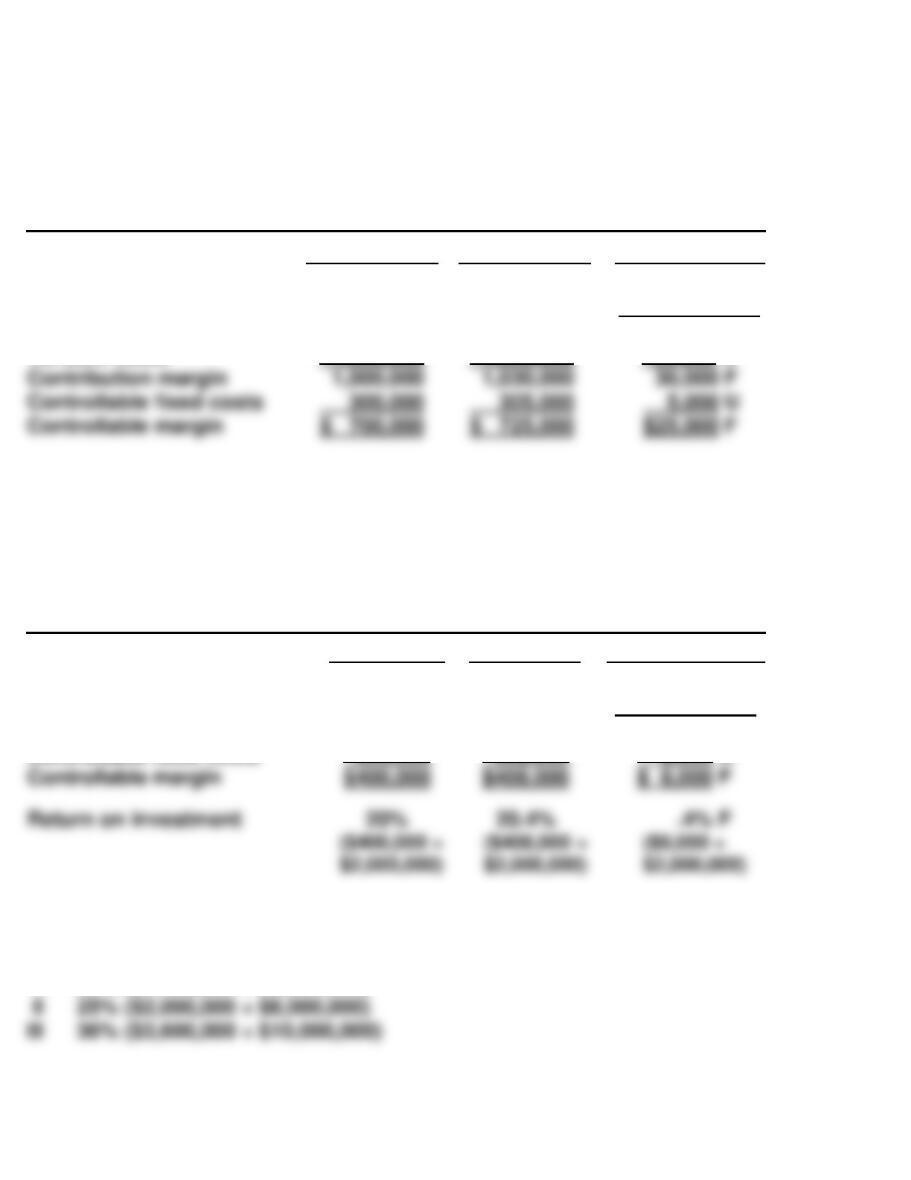
BRIEF EXERCISE 10-8
COBB COMPANY
Plastics Division
Responsibility Report
For the Year Ended December 31, 2017
Budget
Actual
Difference
Contribution margin
Controllable fixed costs
$700,000
300,000
$710,000
302,000
Favorable F
Unfavorable U
$10,000 F
2,000 U
BRIEF EXERCISE 10-9
III 28% ($1,400,000 ÷ $5,000,000)
$25,000 F
BRIEF EXERCISE 10-10
III A $300,000 ($2,000,000 X .15) increase in sales will increase contribution
margin and controllable margin $210,000 ($300,000 X 70%). The new
ROI is 32.2% ($1,610,000 ÷ $5,000,000).
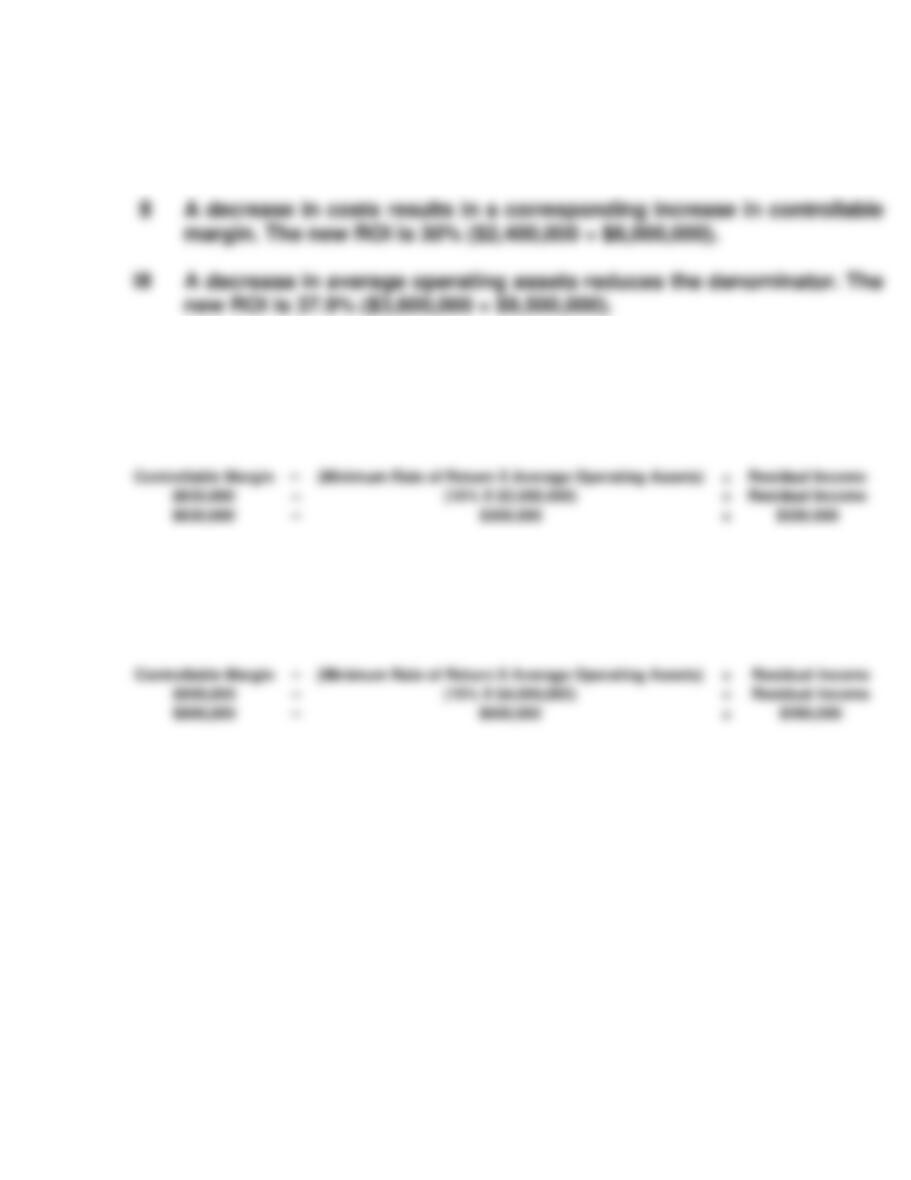
*BRIEF EXERCISE 10-11
Controllable Margin
÷
Average Operating Assets
=
ROI
$630,000
÷
$3,000,000
=
21%
Controllable Margin
(Minimum Rate of Return X Average Operating Assets)
=
Residual Income
$630,000
=
Residual Income
=
*BRIEF EXERCISE 10-12
Controllable Margin
÷
Average Operating Assets
=
ROI
$800,000
÷
$4,000,000
=
20%
(Minimum Rate of Return X Average Operating Assets)
=
Residual Income
$800,000
=
Residual Income
$800,000
=
SOLUTIONS FOR DO IT! EXERCISES
DO IT! 10-1
Difference
Favorable F
Unfavorable U
Budget
6,000
Actual
6,500
Production in units
Variable costs
Direct materials ($7)
$ 42,000
$ 38,850
$3,150 F
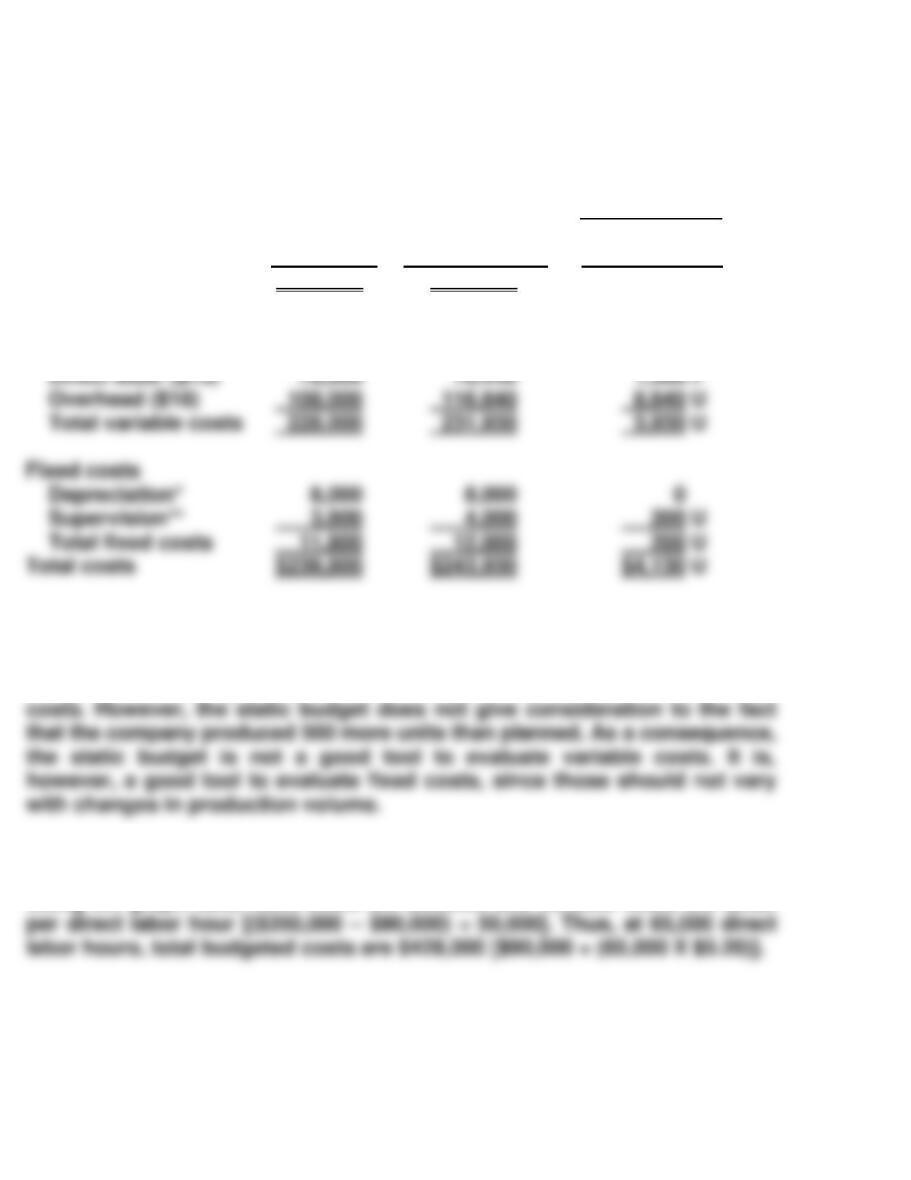
The static budget indicates that actual variable costs exceeded budgeted
amounts by $3,930. Fixed costs were unfavorable by $200. The static
budget gives the impression that the company did not control its variable
DO IT! 10-2
Using the graph data, fixed costs are $90,000, and variable costs are $5.20
Overhead ($18)
Total variable costs
Fixed costs
Depreciation*
Total fixed costs
11,800
12,000
200 U
Total costs
$239,800
$243,930
DO IT! 10-3
ROCKIES DIVISION
Responsibility Report
For the Year Ended December 31, 2017
Difference
Favorable F
Budget Actual Unfavorable U
Sales $2,000,000 $1,890,000 $110,000 U
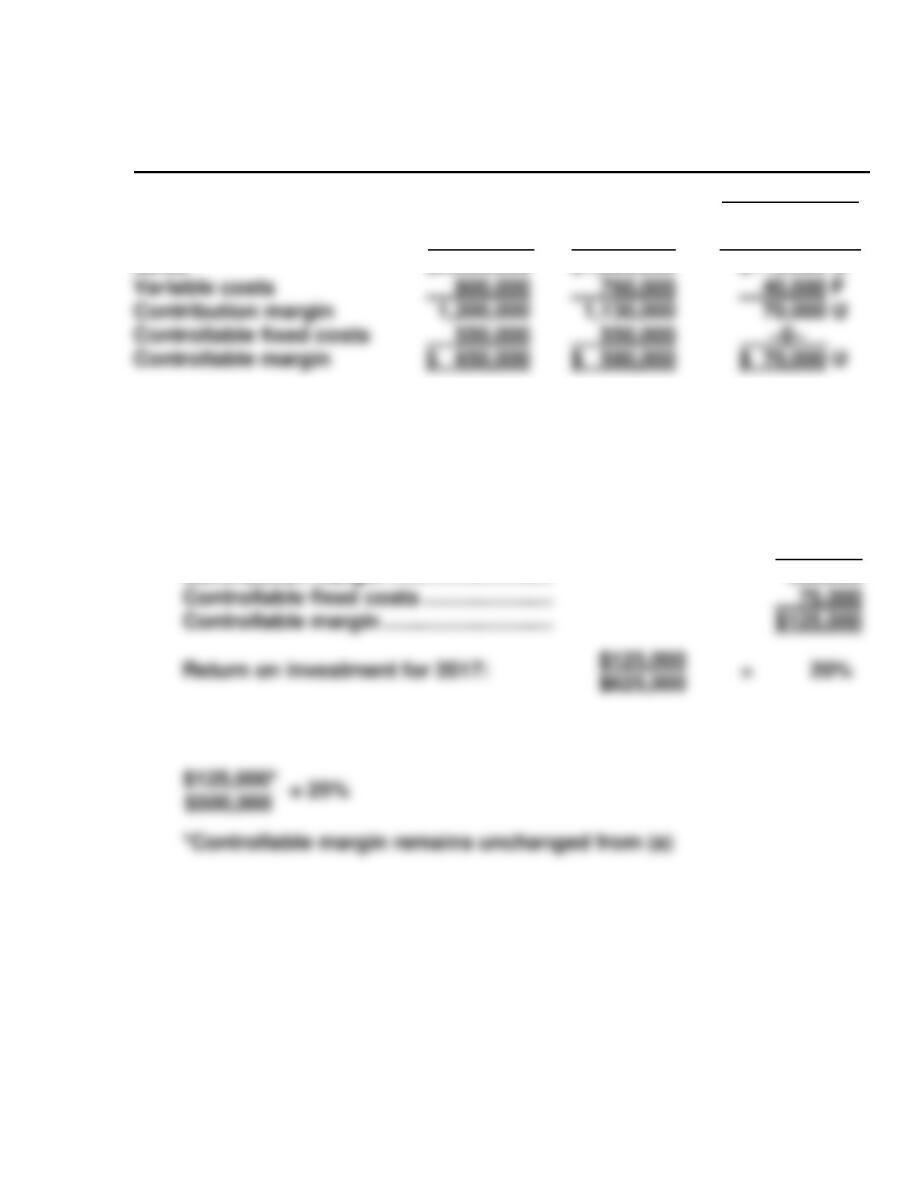
DO IT! 10-4
(a) Controllable margin for 2017:
Sales ……………………………………………..
$500,000
Variable costs ………………………………..
300,000
Contribution margin ……………………….
200,000
Controllable fixed costs ………………….
75,000
Controllable margin ………………………..
$125,000*
(b) Expected return on investment for alternative 1:
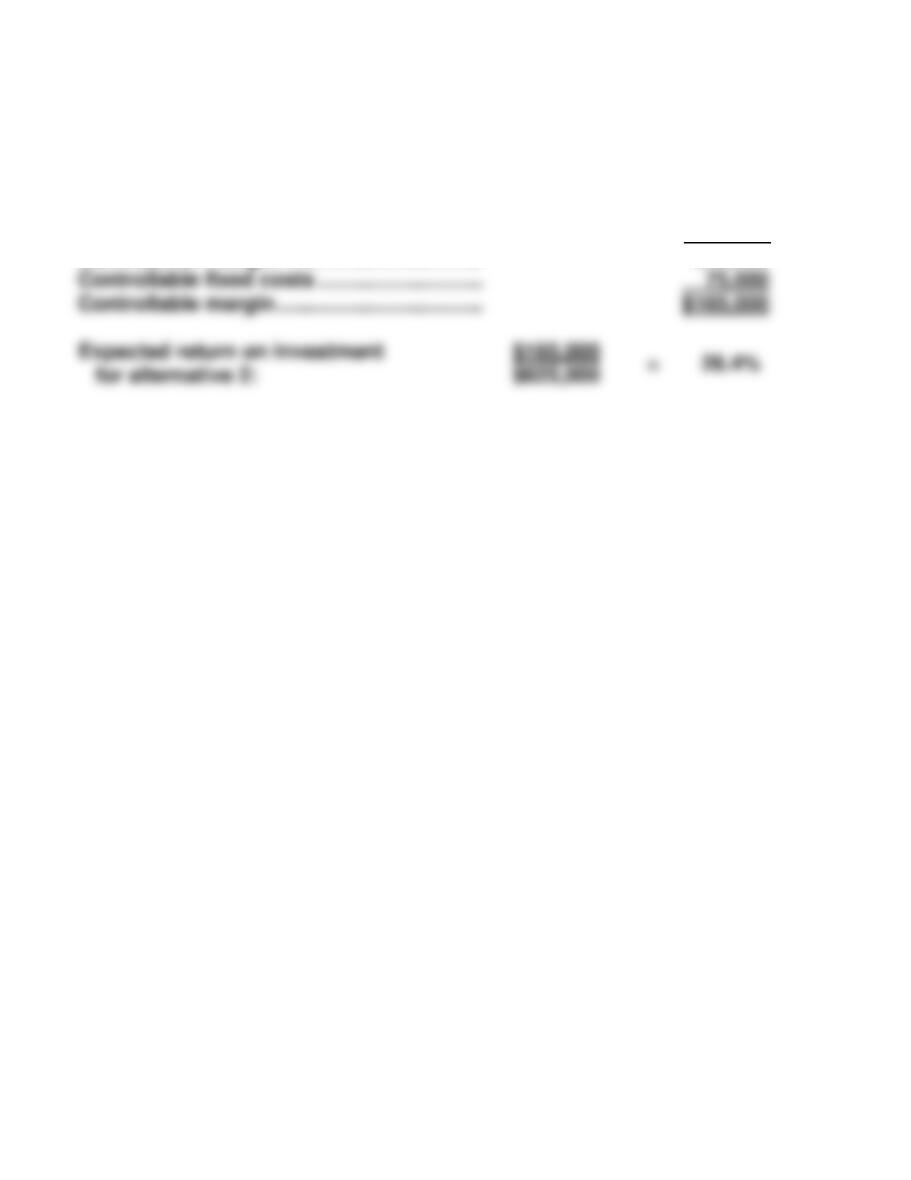
DO IT! 10-4 (Continued)
Controllable margin for alternative 2:
Sales ($500,000 + 100,000) ……………………….
$600,000
Variable costs
($300,000/$500,000 X $600,000) ……………..
360,000
Contribution margin ………………………………..
240,000
Controllable fixed costs …………………………..
75,000
Controllable margin …………………………………
$165,000
SOLUTIONS TO EXERCISES
EXERCISE 10-1
1. True.
2. False. Budget reports are prepared as frequently as needed.
3. True.
4. True.
5. False. Budgetary control works best when a company has a formalized
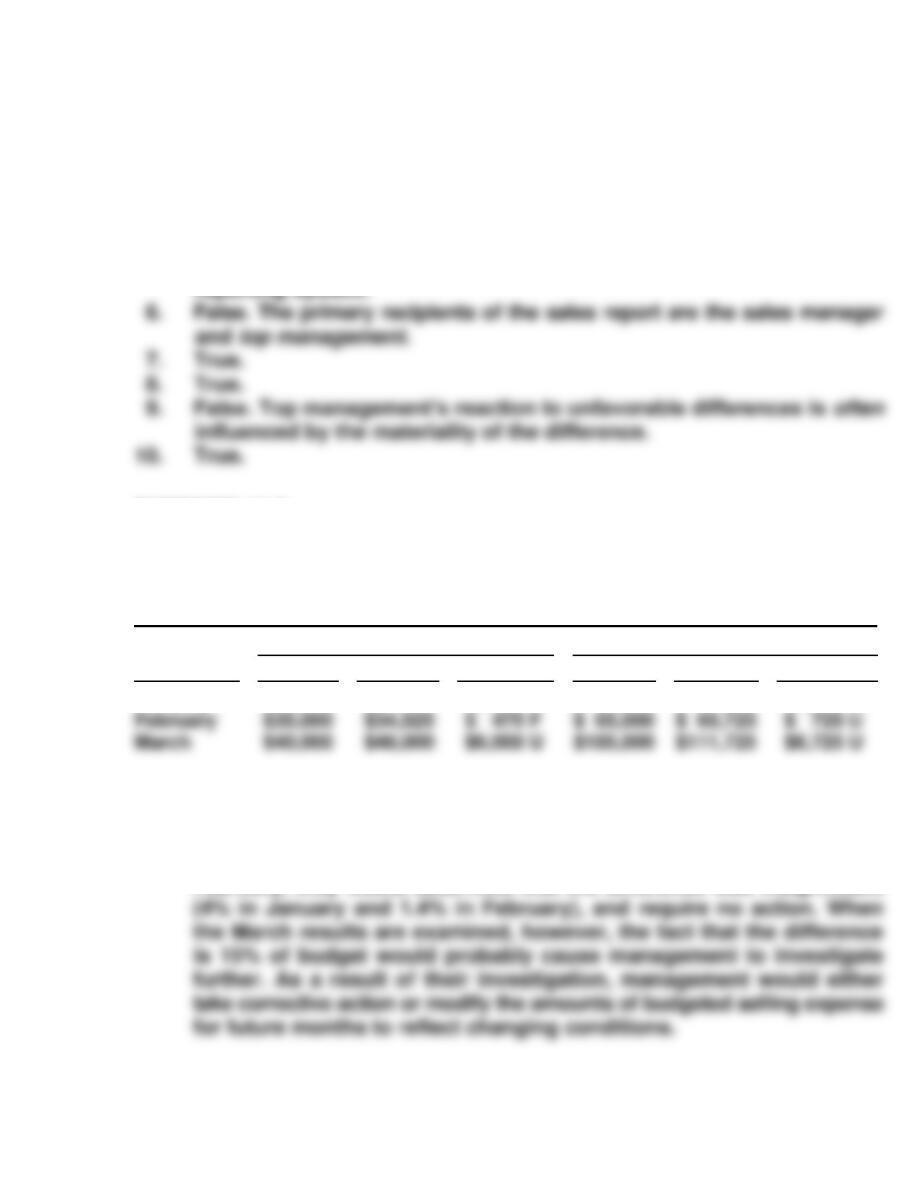
EXERCISE 10-2
(a) CREDE COMPANY
Selling Expense Report
For the Quarter Ending March 31
By Month
Year–to–Date
Month
Budget
Actual
Difference
Budget
Actual
Difference
January
$30,000
$31,200
$1,200 U
$ 30,000
$ 31,200
$1,200 U
February
$35,000
$34,525
$ 65,000
March
$40,000
$46,000
$6,000 U
$105,000
$111,725
$6,725 U
(b) The purpose of the Selling Expense Report is to help management
control selling expenses. The primary recipient is the sales manager.
(c) Most likely, when management scrutinized the results for January and
February, they would determine that the difference was insignificant
EXERCISE 10-3
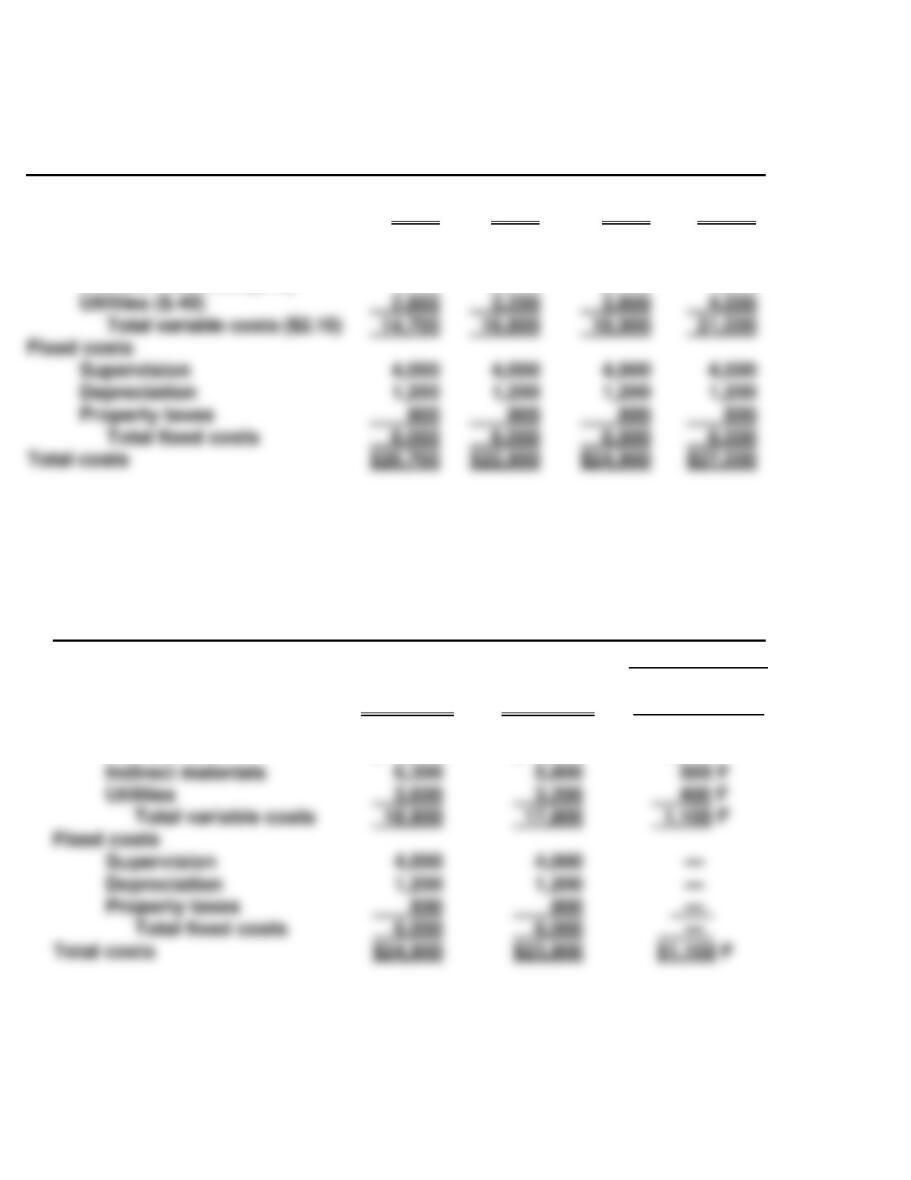
MYERS COMPANY
Monthly Manufacturing Overhead Flexible Budget
For the Year 2017
Activity level
Direct labor hours
Variable costs
Indirect labor ($1)
Indirect materials ($.70)
7,000
$ 7,000
4,900
8,000
$ 8,000
5,600
9,000
$ 9,000
6,300
10,000
$10,000
7,000
EXERCISE 10-4
(a) MYERS COMPANY
Manufacturing Overhead Flexible Budget Report
For the Month Ended July 31, 2017
Difference
Direct labor hours (DLH)
Variable costs
Indirect labor
Budget at
9,000 DLH
$ 9,000
Actual Costs
9,000 DLH
$ 8,800
Favorable F
Unfavorable U
$200 F
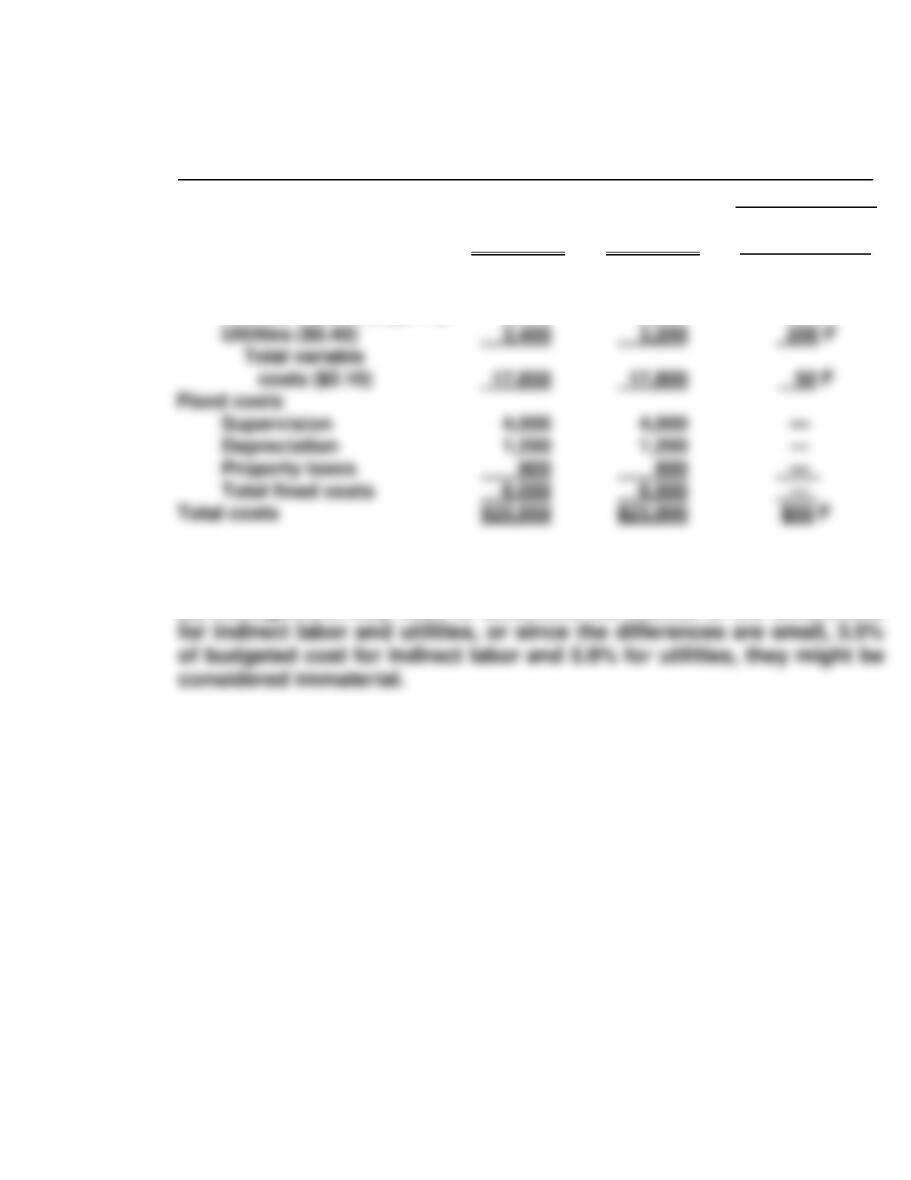
EXERCISE 10-4 (Continued)
(b) MYERS COMPANY
Manufacturing Overhead Flexible Budget Report
For the Month Ended July 31, 2017
Difference
Direct labor hours (DLH)
Variable costs
Indirect labor ($1.00)
Indirect materials ($0.70)
Budget at
8,500 DLH
$ 8,500
5,950
Actual Costs
8,500 DLH
$ 8,800
5,800
Favorable F
Unfavorable U
$300 U
150 F
(c) In case (a) the performance for the month was satisfactory. In case
(b) management may need to determine the causes of the differences
EXERCISE 10-5
FALLON COMPANY
Monthly Selling Expense Flexible Budget
For the Year 2017
Activity level
Sales
Variable expenses
Sales commissions (6%)
Advertising (4%)
Fixed expenses
Sales salaries
Depreciation
$170,000
$ 10,200
6,800
35,000
7,000
$180,000
$ 10,800
7,200
35,000
7,000
$190,000
$ 11,400
7,600
35,000
7,000
$200,000
$ 12,000
8,000
35,000
7,000
EXERCISE 10-6
(a) FALLON COMPANY
Selling Expense Flexible Budget Report
For the Month Ended March 31, 2017
Difference
Sales
Variable expenses
Sales commissions
Advertising
Budget
$170,000
$ 10,200
6,800
Actual
$170,000
$ 11,000
6,900
Favorable F
Unfavorable U
$800 U
100 U
EXERCISE 10-6 (Continued)
(b) FALLON COMPANY
Selling Expense Flexible Budget Report
For the Month Ended March 31, 2017
Difference
Sales
Variable expenses
Sales commissions
Fixed costs
Sales salaries
Depreciation
Budget
$180,000
$ 10,800
35,000
7,000
Actual
$180,000
$ 11,000
35,000
7,000
Favorable F
Unfavorable U
$200 U
0 U
0 U
(c) Flexible budgets are essential in evaluating a manager’s performance
in controlling variable expenses because the budget allowance varies
EXERCISE 10-7
(a) APPLIANCE POSSIBLE INC.
Flexible Production Cost Budget
Activity level
Production levels 90,000 100,000 110,000
Variable costs:
Manufacturing ($6) $ 540,000 $ 600,000 $ 660,000
Fixed costs:
Manufacturing 160,000 160,000 160,000
(b) Let (X) represent number of units
Sales price(X) = Variable costs(X) + Fixed costs + Profit
EXERCISE 10-8
(a) RENSING GROOMERS
Flexible Budget
Activity level
Direct labor hours 550 600 700
Variable costs:
Grooming supplies ($5) $ 2,750 $ 3,000 $ 3,500
Direct labor ($14) 7,700 8,400 9,800
(b) A flexible budget presents expected costs at various levels of produc–
tion volume, not just one, so that comparisons can be made between
actual costs and budgeted costs at the same volume. This allows the
(c) $21,000 ÷ 550 = $38.18
(d) Cost formula is $10,000 + $20(X), where (X) = direct labor hours
Total cost = $10,000 + ($20 X 650) = $23,000.
EXERCISE 10-9
(a) SORIA COMPANY
Selling Expense Flexible Budget Report
Clothing Department
For the Month Ended October 31, 2017
Difference
Sales in units
Variable expenses
Sales commissions ($.30)
Advertising expense ($.09)
Fixed expenses
Rent
Sales salaries
Budget
10,000
$ 3,000
900
1,500
1,200
Actual
10,000
$ 2,600
850
1,500
1,200
Favorable F
Unfavorable U
$ 400 F
50 F
0 U
0 U
(b) No, Joe should not have been reprimanded. As shown in the flexible
budget report, variable costs were $1,450 below budget.
EXERCISE 10-10
(a) CHUBBS INC.
Manufacturing Overhead Flexible Budget Report
For the Quarter Ended March 31, 2017
Difference
Budget
Actual
Favorable F
Unfavorable U
Variable costs
Indirect materials
Indirect labor
$12,000
10,000
$13,500
9,500
$1,500 U
500 F
(b) CHUBBS INC.
Manufacturing Overhead Responsibility Report
For the Quarter Ended March 31, 2017
Difference
Controllable Costs
Budget
Actual
Favorable F
Unfavorable U
Indirect materials
Indirect labor
$12,000
10,000
$13,500
9,500
$1,500 U
500 F
EXERCISE 10-11
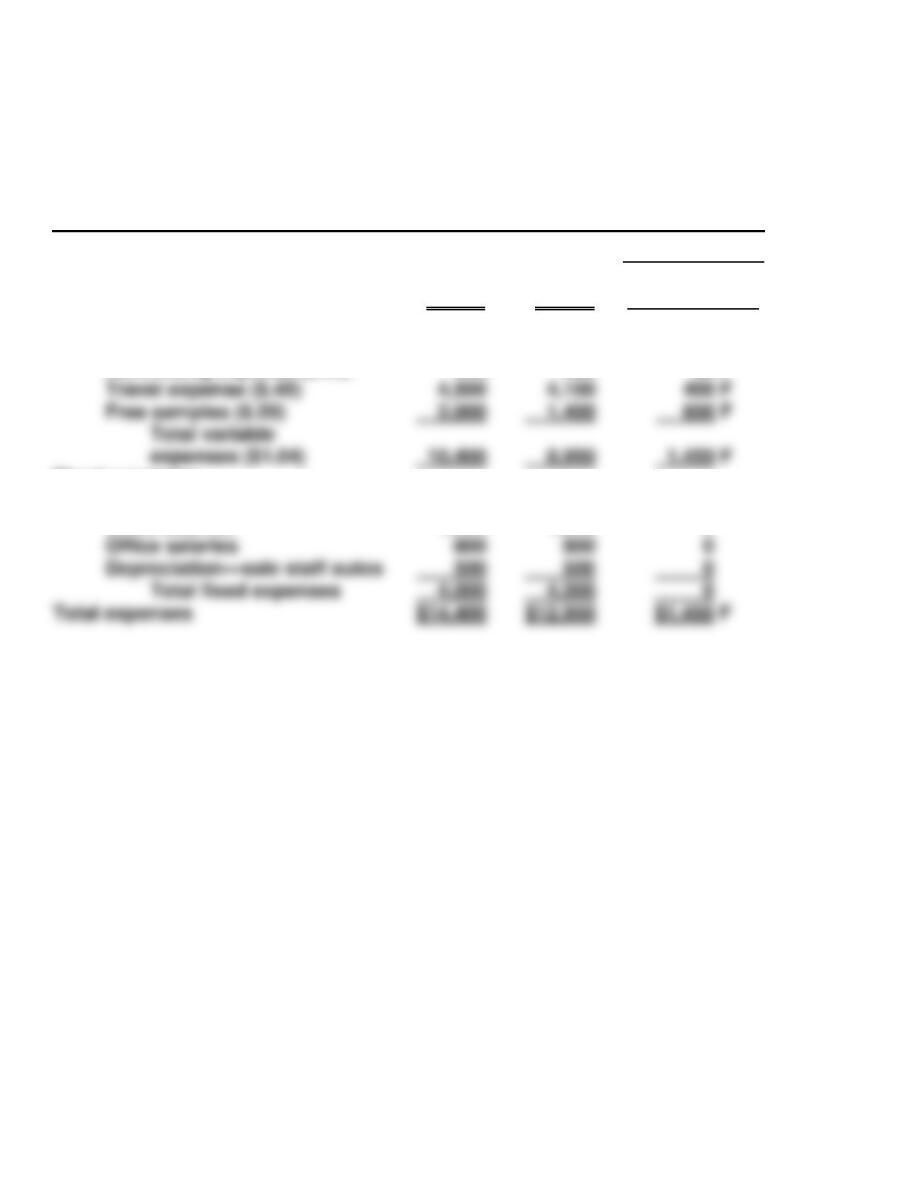
(a) URLINK COMPANY
Home Internet Services Segment
Responsibility Report
For the Quarter Ended March 31, 2017
Budget
Actual
Difference
Favorable F
Unfavorable U
Service revenue
$25,000
$26,200
$1,200 F
Variable costs:
(b)
MEMO
TO: Lenny Kirkland
FROM: Student
SUBJECT: The Reporting Principles of Performance Reports
When evaluating the performance of a company’s segments, the performance
reports should:
2,800
3,400
Total variable costs
7,400
7,850
Contribution margin
Controllable fixed costs:
1,500
1,300
Total controllable fixed costs
Controllable margin
$ 3,100
$ 3,650
EXERCISE 10-12
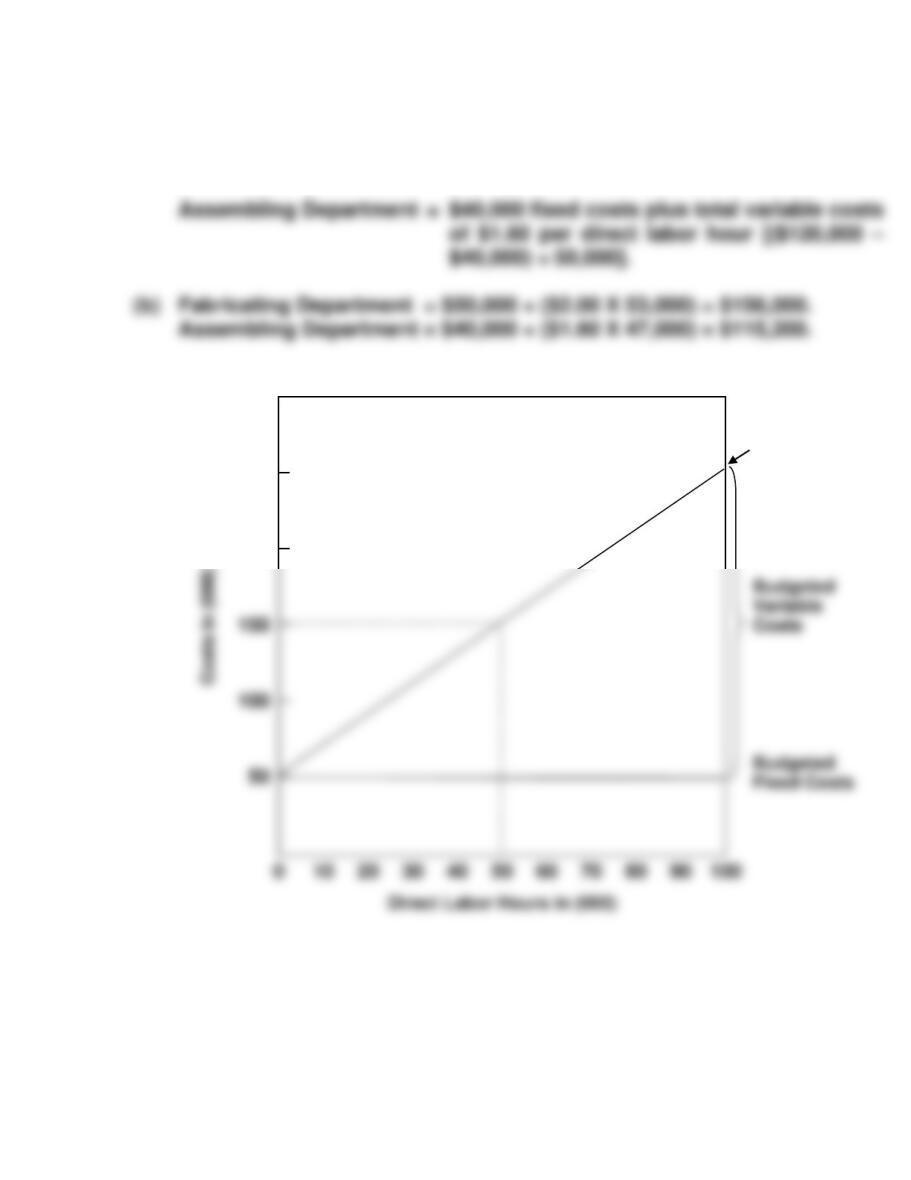
(a) Fabricating Department = $50,000 fixed costs plus total variable costs
of $2.00 per direct labor hour [($150,000 –
$50,000) ÷ 50,000].
(c)
$300
150
100
Total
Budgeted
Cost Line
250
200
EXERCISE 10-13
(a)
To Dallas Department Manager—Finishing Month: July
Controllable Costs:
Budget
Actual
Fav/Unfav
Direct Materials
$ 44,000
$ 42,500
$1,500 F
(b)
To Assembly Plant Manager—Dallas Month: July
Controllable Costs:
Budget
Actual
Fav/Unfav
Dallas Office
$ 92,000
$ 95,000
$3,000 U
(c)
To Vice President—Production Month: July
Controllable Costs:
Budget
Actual
Fav/Unfav
V P Production
Assembly plants:
Atlanta
$ 130,000
420,000
$ 132,000
424,000
$2,000 U
4,000 U
EXERCISE 10-14
(a) MALONE COMPANY
Mixing Department
Responsibility Report
For the Month Ended January 31, 2017
Controllable Cost
Budget
Actual
Difference
Indirect labor
$12,000
$12,250
$ 250 UU
(b) Most likely, when management examined the responsibility report for
January, they would determine that the differences were insignificant
for indirect labor (2.1% of budget), lubricants (1.5%), and maintenance
EXERCISE 10-15
(a) 1. Controllable margin ($270,000 – $100,000) $170,000
EXERCISE 10-15 (Continued)
(b) HORATIO INC.
Women’s Shoe Division
Responsibility Report
For the Month Ended June 30, 2017
Difference
Budget
Actual
Favorable F
Unfavorable U
Sales
$600,000
$600,000
$ 0 U
EXERCISE 10-16
(a) HARRINGTON COMPANY
Sports Equipment Division
Responsibility Report
2017
Budget
Actual
Difference
Sales
$900,000
$880,000
$20,000 U
Variable costs
Cost of goods sold
440,000
408,000
32,000 F
Selling and administrative
60,000
61,000
1,000 U
Total
Contribution margin
400,000
411,000
11,000 F
105,000
Selling and administrative
90,000
66,000
Total
Controllable margin
$210,000
$240,000
$30,000 F
EXERCISE 10-17
(a) Controllable margin = ($3,000,000 – $1,950,000 – $600,000) = $450,000
(b) 1. Contribution margin percentage is 35%, or ($1,050,000 ÷ $3,000,000)
Increase in controllable margin = $300,000 X 35% = $105,000
ROI = ($450,000 + $105,000) ÷ $5,000,000 = 11.1%
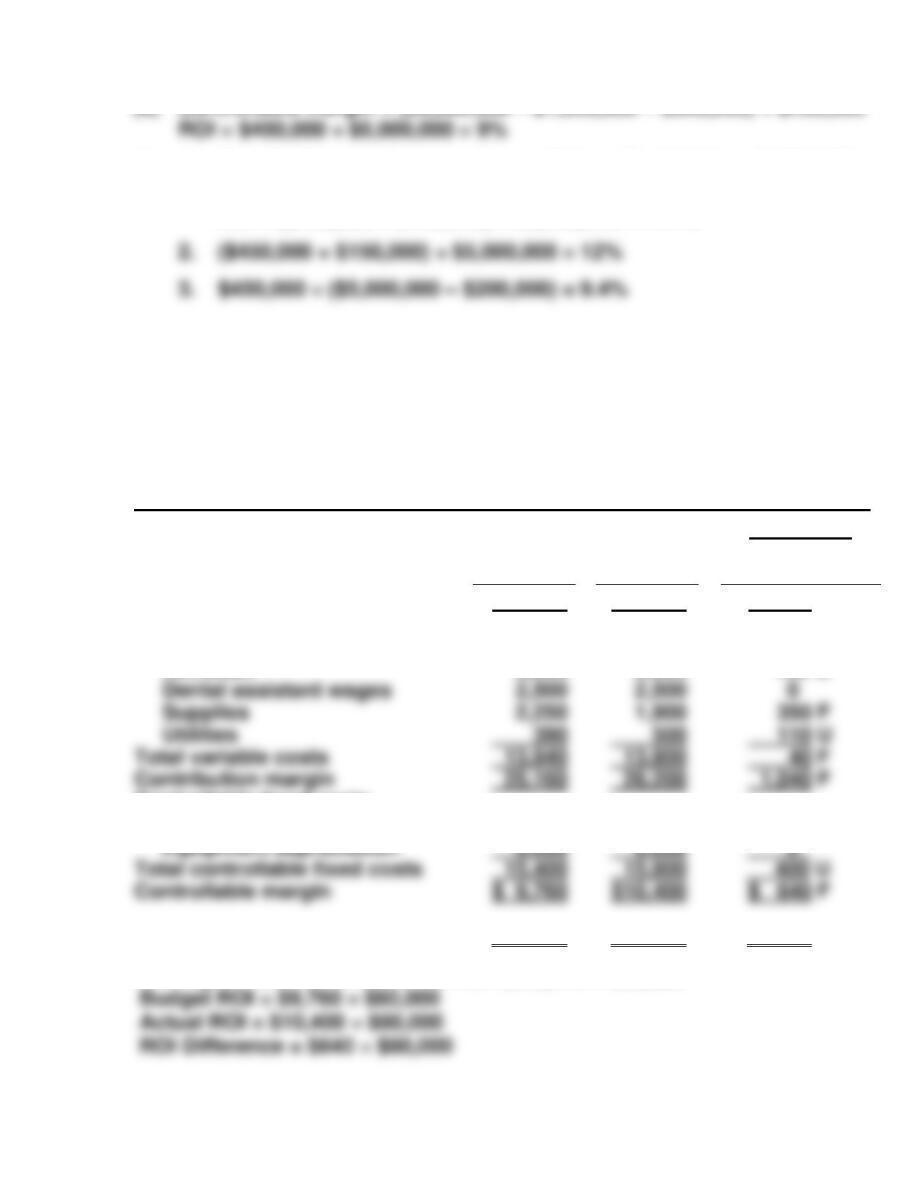
EXERCISE 10-18
(a) DINKLE AND FRIZELL DENTAL CLINIC
Preventive Services
Responsibility Report
For the Month Ended May 31, 2017
Budget
Actual
Difference
Favorable F
Unfavorable U
Service revenue
$39,000
$40,000
$1,000 F
Variable costs
Filling materials
4,900
5,000
100 U
Novocain
3,800
3,900
100 U
Dental assistant wages
2,500
2,500
Supplies
2,250
1,900
Utilities
390
500
110 U
Total variable costs
40 F
Contribution margin
Controllable fixed costs
Dentist salary
9,400
9,800
400 U
Equipment depreciation
6,000
6,000
Controllable margin
$ 9,760
$10,400
$ 640 F
Return on investment*
12.2%
13.0%
0.8% F
*Average investment = ($82,400 + $77,600) ÷ 2 = $80,000
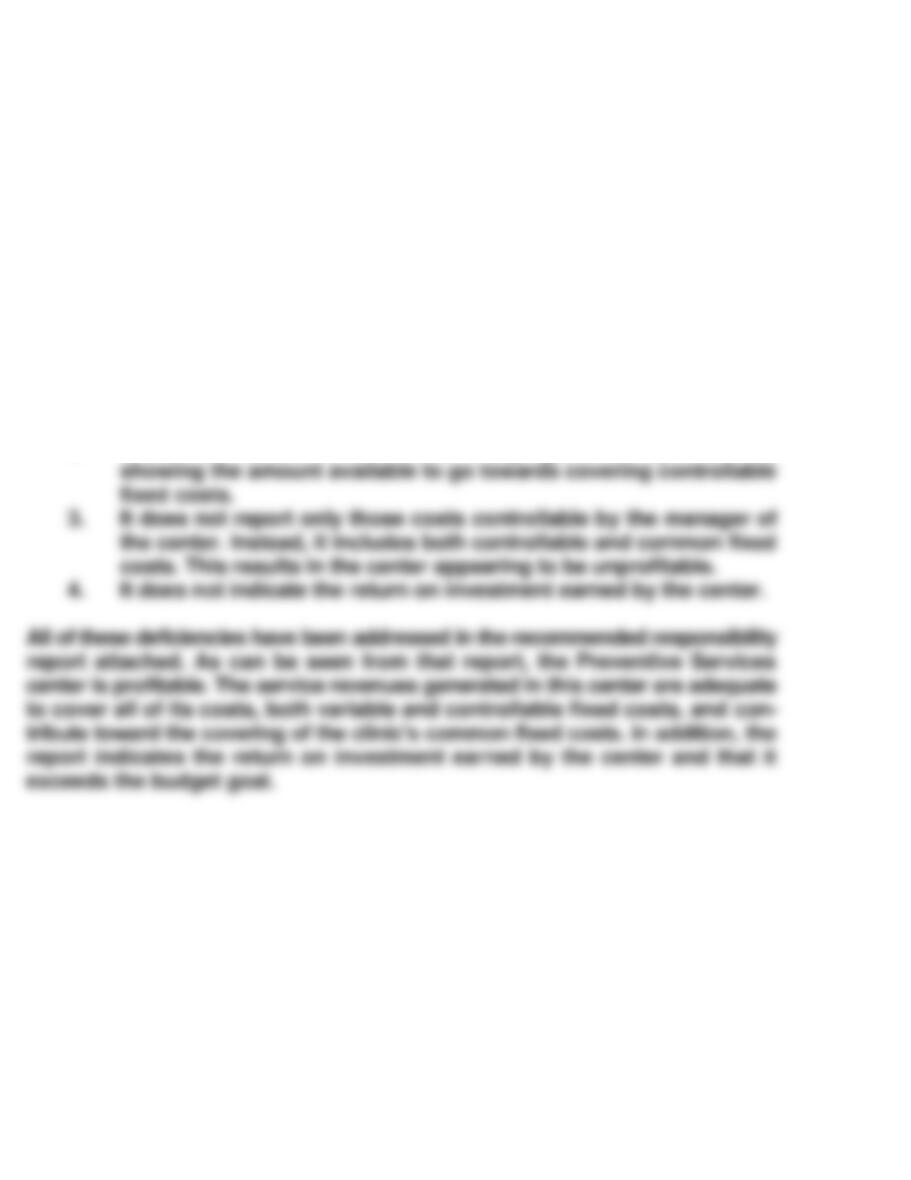
EXERCISE 10-18 (Continued)
(b)
MEMO
TO: Drs. Reese Dinkle and Anita Frizell
FROM: Student
SUBJECT: Deficiencies in the Current Responsibility Reporting System
The current reporting system has the following deficiencies:
1. It does not clearly show both budgeted goals and actual performance.
2. It does not indicate the contribution margin generated by the center,
EXERCISE 10-19
Planes:
ROI = Controllable margin ÷ Average operating assets
12% = Controllable margin ÷ $25,000,000
Contribution margin = Controllable margin + Controllable fixed costs
= $3,000,000 + $1,500,000
Taxis:
ROI
=
Controllable margin
÷
Average operating assets
10%
=
$80,000
÷
Average operating assets
Average operating assets
=
$80,000 ÷ 10%
Contribution margin
Controllable fixed costs
$250,000 – $80,000
Contribution margin
=
Service revenue – Variable costs
=
$500,000 – Variable costs
=
$250,000
EXERCISE 10-19 (Continued)
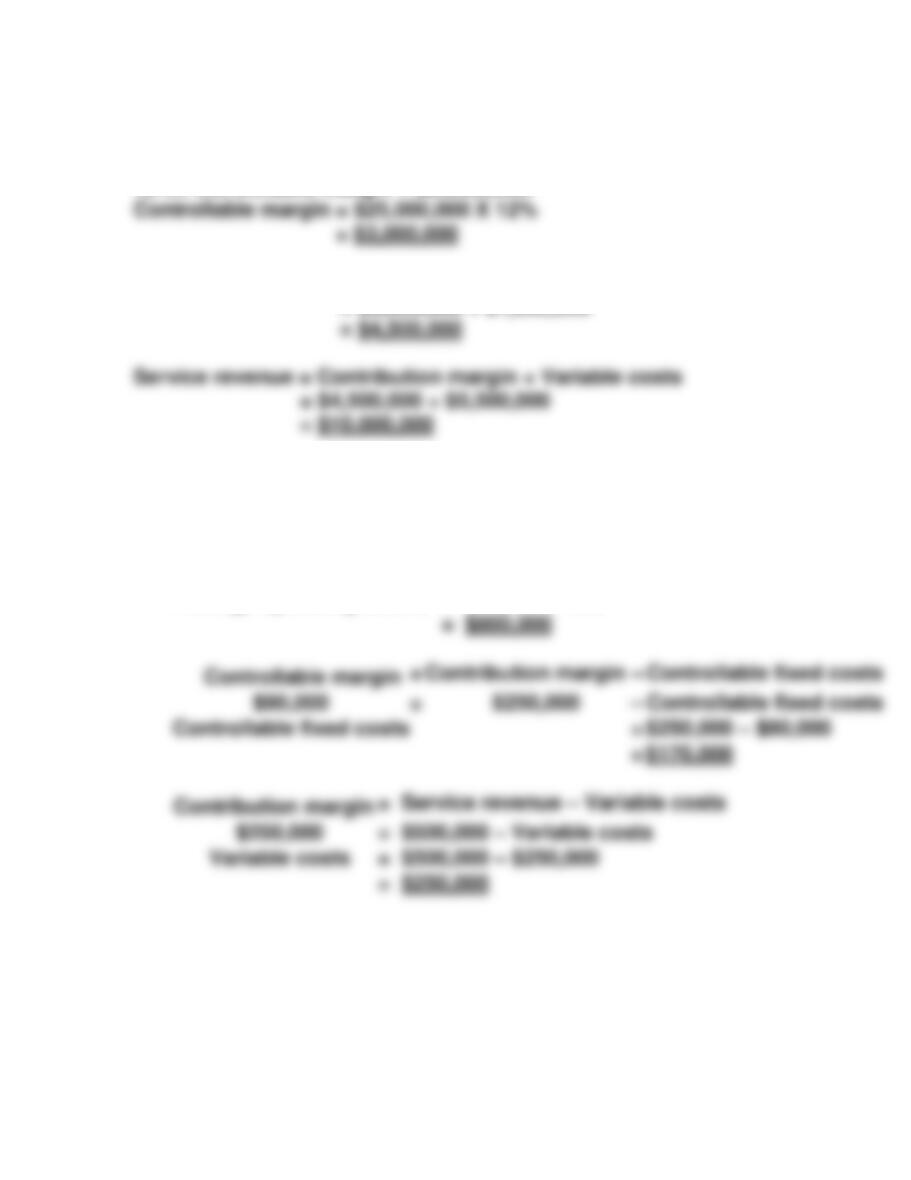
Limos:
ROI = Controllable margin ÷ Average operating assets
= $210,000 ÷ $1,500,000
= 14%
Controllable margin
=
Contribution margin
–
Controllable fixed costs
$210,000
=
$480,000
–
Controllable fixed costs
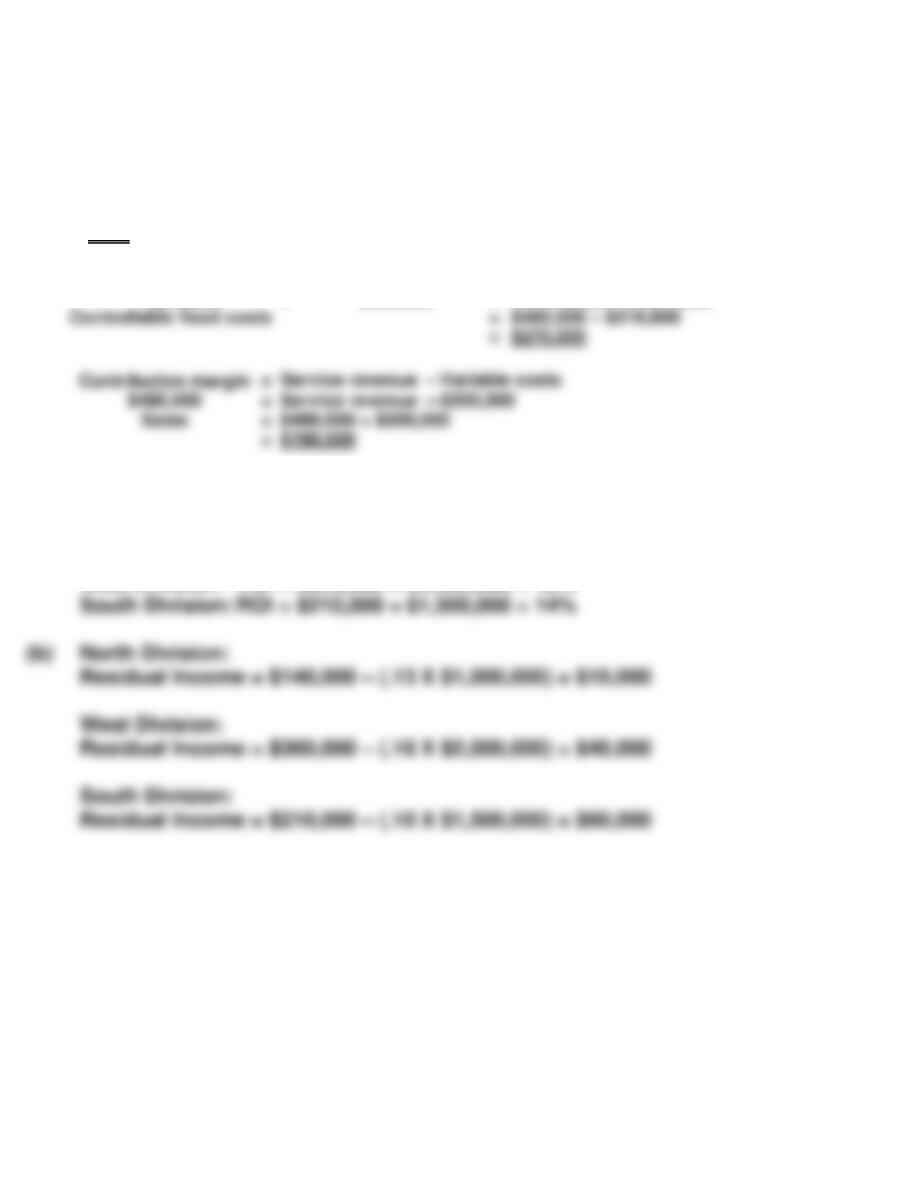
*EXERCISE 10-20
(a) North Division: ROI = $140,000 ÷ $1,000,000 = 14%
West Division: ROI = $360,000 ÷ $2,000,000 = 18%
Service revenue
Variable costs
$780,000
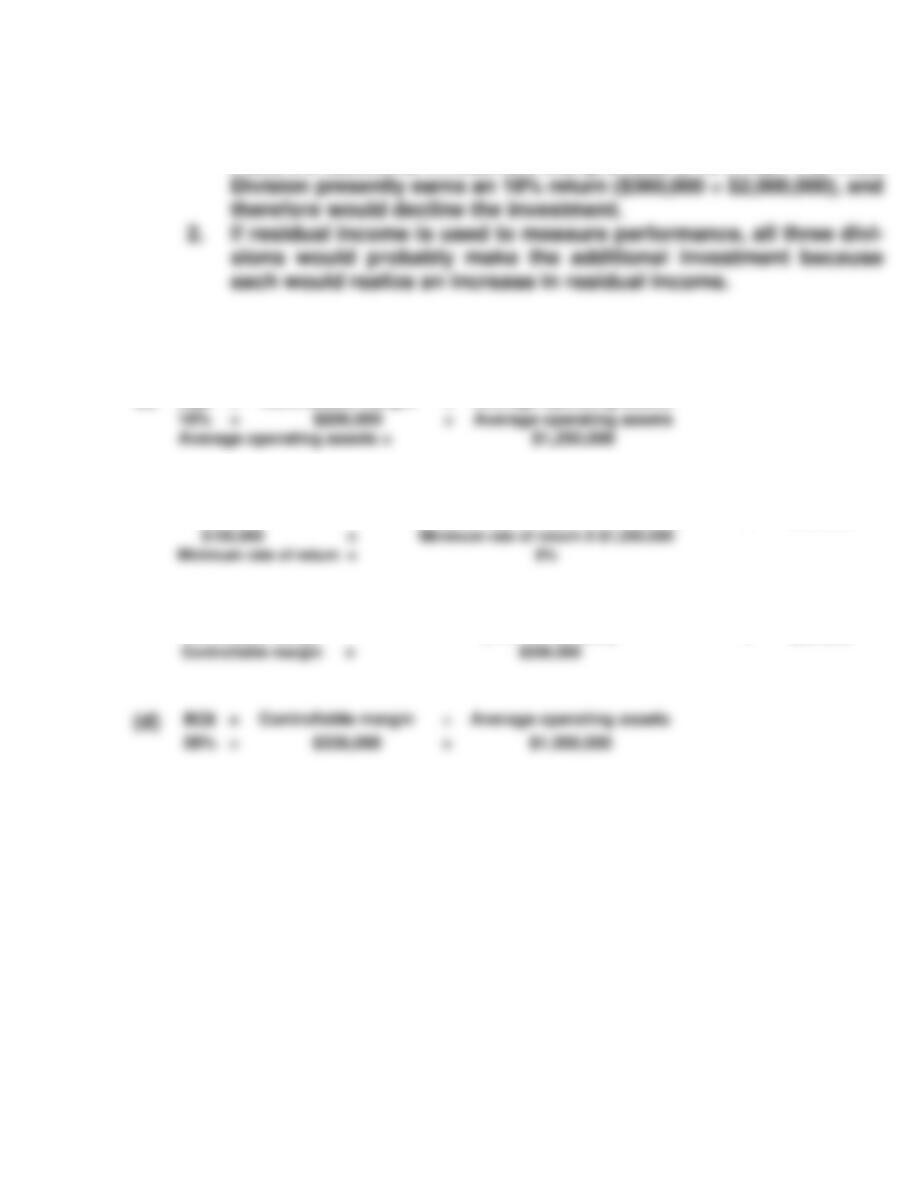
*EXERCISE 10-20 (Continued)
(c) 1. If ROI is used to measure performance, only the North Division
(with a 14% ROI) and the South Division (with a 14% ROI) would
make the additional investment that provides a 16% ROI. The West
*EXERCISE 10-21
(a)
ROI
=
Controllable margin
÷
Average operating assets
(b)
Controllable margin
–
(Minimum rate of return X Average operating assets)
=
Residual income
$200,000
–
(Minimum rate of return X $1,250,000)
=
$100,000
$100,000
=
Minimum rate of return
(c)
Controllable margin
–
(Minimum rate of return X Average operating assets)
=
Residual income
Controllable margin
–
(11% X $1,200,000)
=
$204,000
Controllable margin
SOLUTIONS TO PROBLEMS
PROBLEM 10-1A
(a) BUMBLEBEE COMPANY
Packaging Department
Monthly Manufacturing Overhead Flexible Budget
For the Year 2017
Activity level
Direct labor hours
Variable costs
Indirect labor ($.42)*
Indirect materials ($.30)
($1.25)
Fixed costs
Supervision**
Depreciation
27,000
$11,340
8,100
8,000
6,000
2,500
30,000
$12,600
9,000
8,000
6,000
2,500
33,000
$13,860
9,900
8,000
6,000
2,500
36,000
$15,120
10,800
8,000
6,000
2,500
PROBLEM 10-1A (Continued)
(b) BUMBLEBEE COMPANY
Packaging Department
Manufacturing Overhead Flexible Budget Report
For the Month Ended October 31, 2017
Difference
Direct labor hours (DLH)
Variable costs
Indirect labor
Indirect materials
Repairs
Budget at
27,000 DLH
$11,340
8,100
6,210
Actual Costs
27,000 DLH
$12,432
7,680
6,100
Favorable F
Unfavorable U
$1,092 U
420 F
110 F
(c) The overall performance of management was slightly unfavorable.
Total costs
PROBLEM 10-2A
(a) ZELMER COMPANY
Monthly Manufacturing Overhead Flexible Budget
Ironing Department
For the Year 2017
Activity level
Direct labor hours
Variable costs
Indirect labor ($.40)
Indirect materials ($.50)
35,000
$14,000
17,500
40,000
$16,000
20,000
45,000
$18,000
22,500
50,000
$20,000
25,000
PROBLEM 10-2A (Continued)
(b) ZELMER COMPANY
Ironing Department
Manufacturing Overhead Flexible Budget Report
For the Month Ended June 30, 2017
Difference
Direct labor hours (DLH)
Variable costs
Indirect labor
Indirect materials
Fixed costs
Supervision*
Depreciation
Insurance
Budget at
41,000 DLH
$16,400 (1)
20,500 (2)
4,000
1,500
1,000
Actual Costs
41,000 DLH
$18,040 (5)
19,680 (6)
4,000
1,500
1,000
Favorable F
Unfavorable U
$1,640 U
820 F
0 U
0 U
0 U
(c) The manager was ineffective in controlling variable costs ($3,690 U).
Fixed costs were effectively controlled.
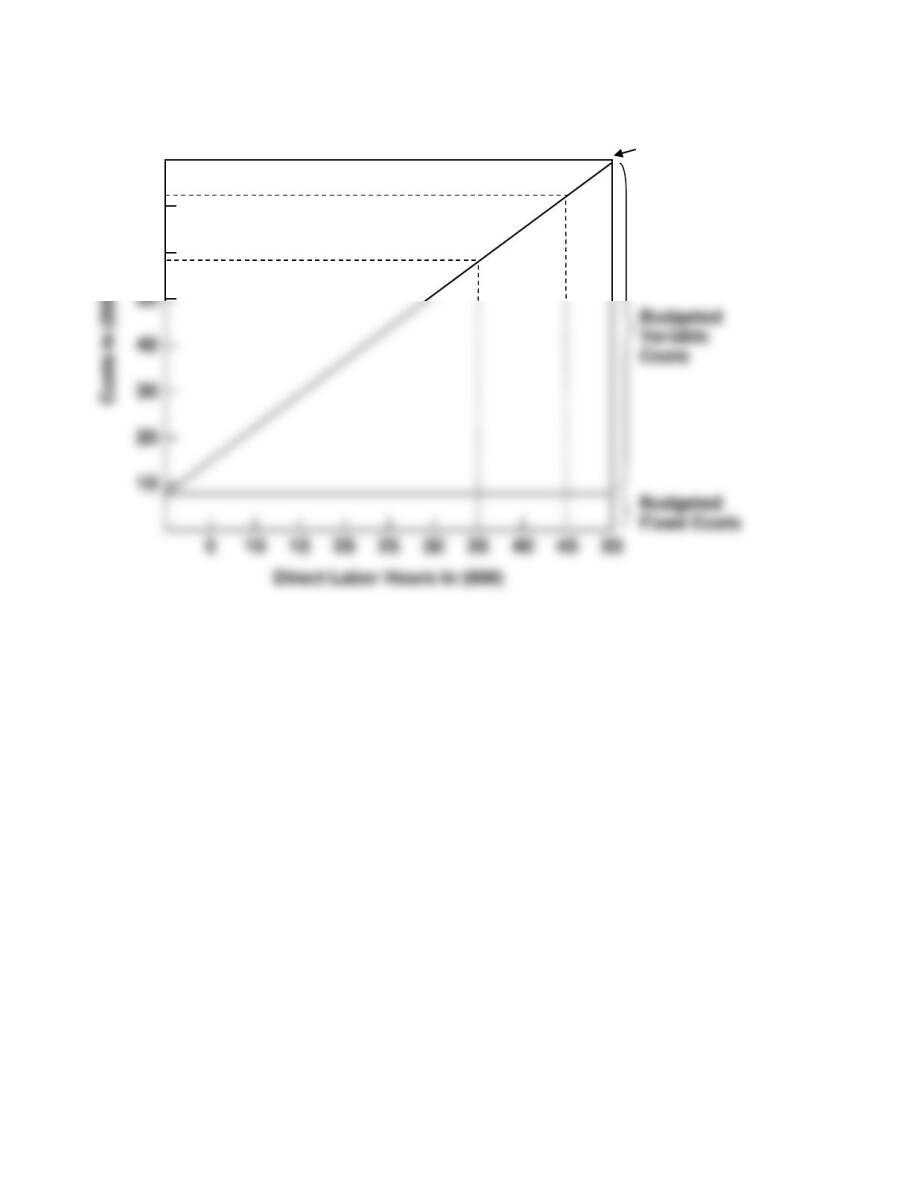
PROBLEM 10-2A (Continued)
(e)
$80
Total
Budgeted
Cost Line
70
60
40
30
10
PROBLEM 10-3A
(a) The formula is fixed costs $35,000 plus variable costs of $2.85 per unit
($171,000 ÷ 60,000 units).
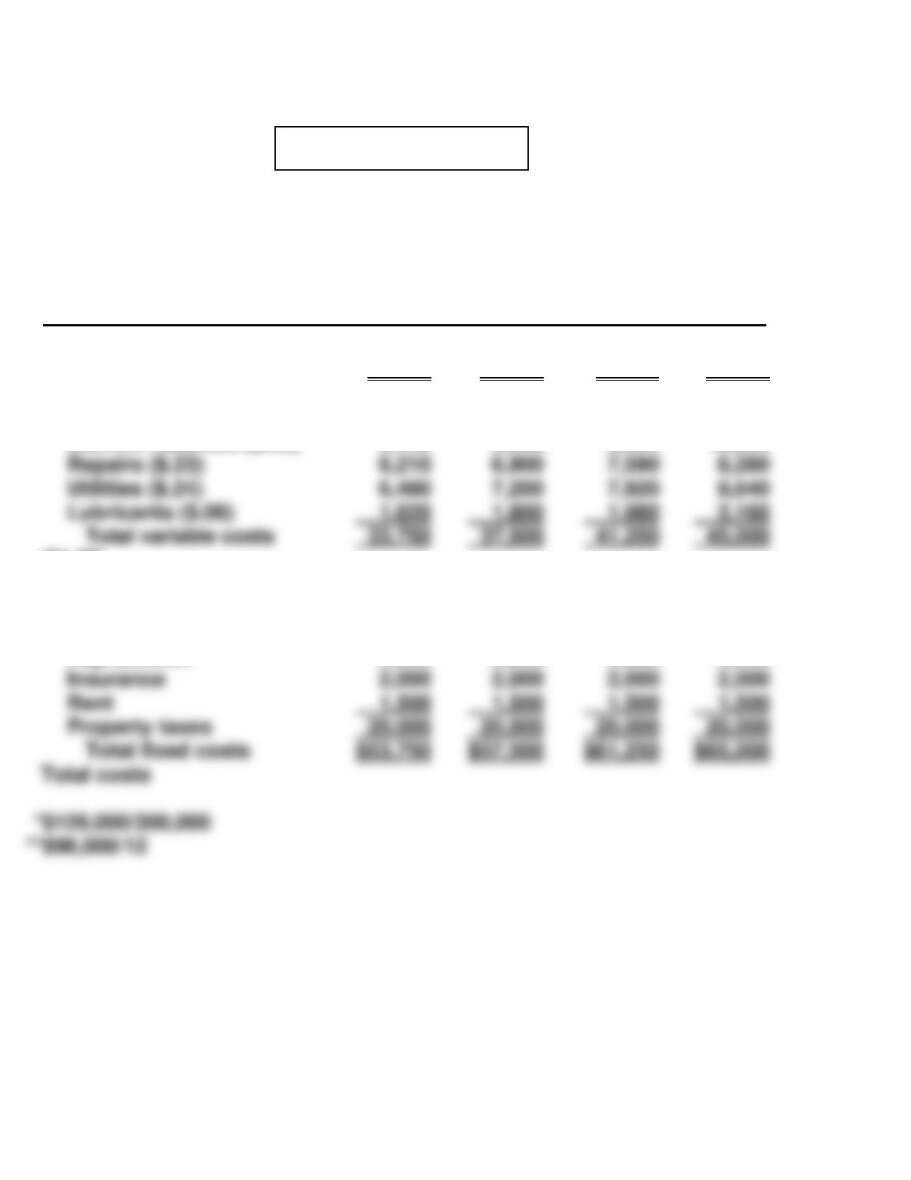
(b) RATCHET COMPANY
Assembling Department
Flexible Budget Report
For the Month Ended August 31, 2017
Difference
Units
Variable costs*
Direct materials ($.80 X 58,000)
Direct labor ($.90 X 58,000)
Fixed costs
Rent
Supervision
Depreciation
Total fixed
Total costs
Budget at
58,000 Units
$ 46,400
52,200
12,000
17,000
6,000
35,000
$200,300
Actual Costs
58,000 Units
$ 47,000
51,200
12,000
17,000
6,000
35,000
$202,200
Favorable F
Unfavorable U
$ 600 U
1,000 F
0 U
0 U
0 U
0 U
$1,900 U
*Note that the per unit variable costs are computed by taking the
budget amount at 60,000 units and dividing it by 60,000. For example,
$48,000
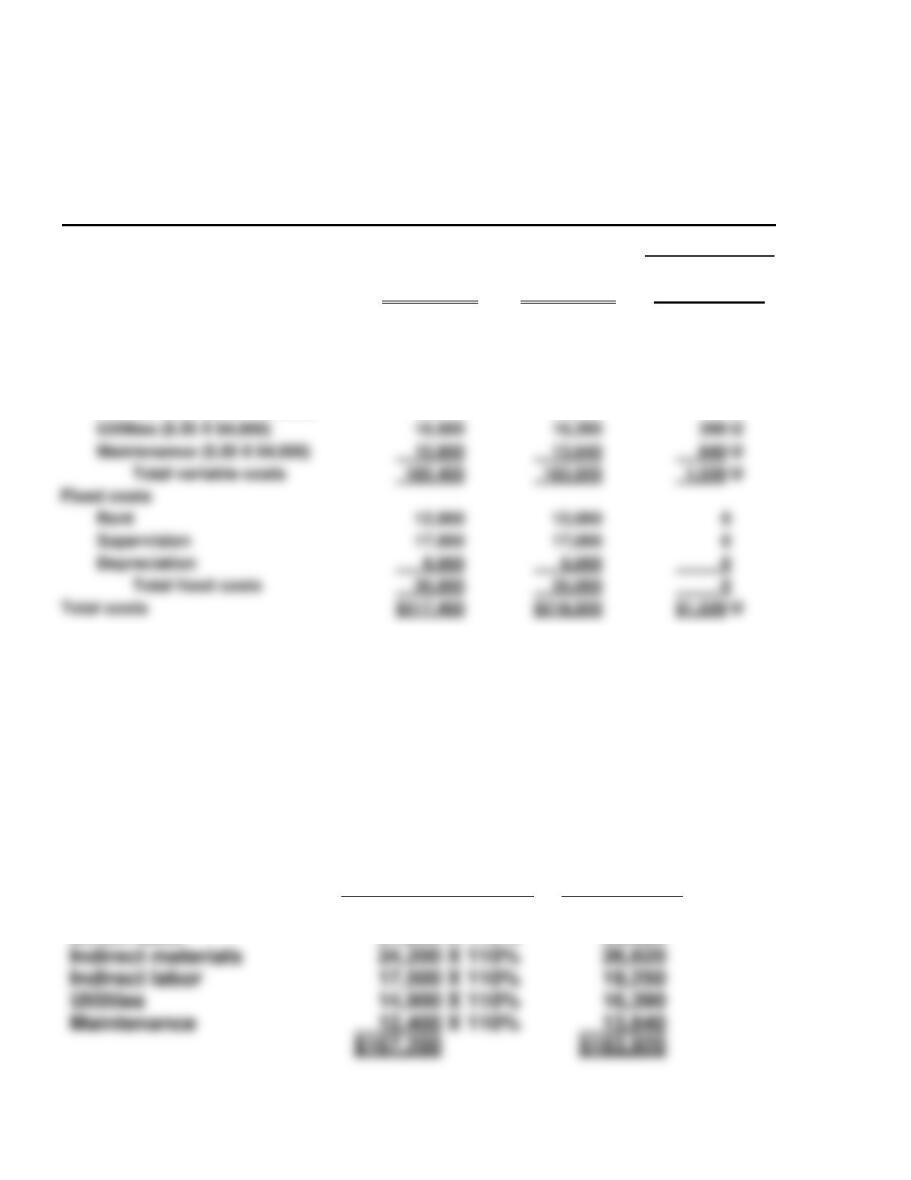
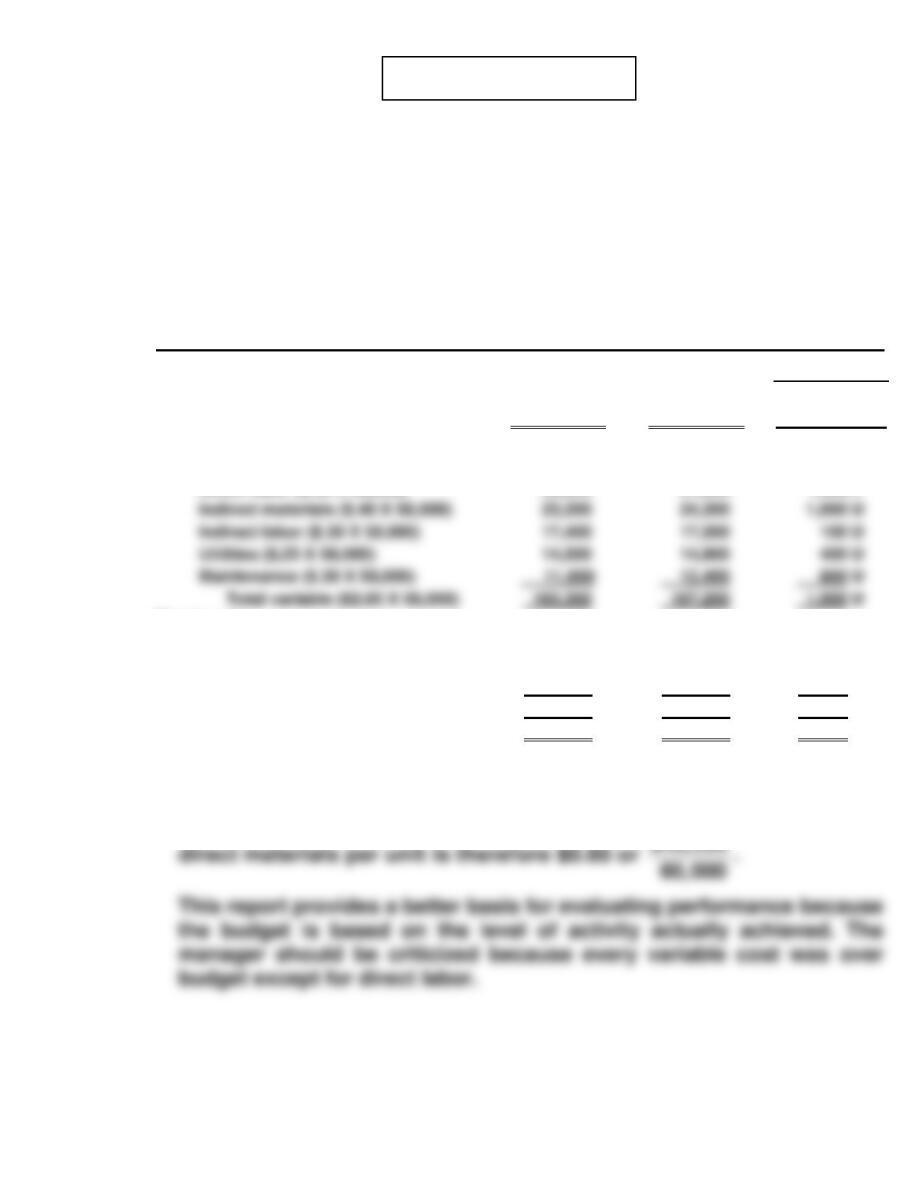
PROBLEM 10-3A (Continued)
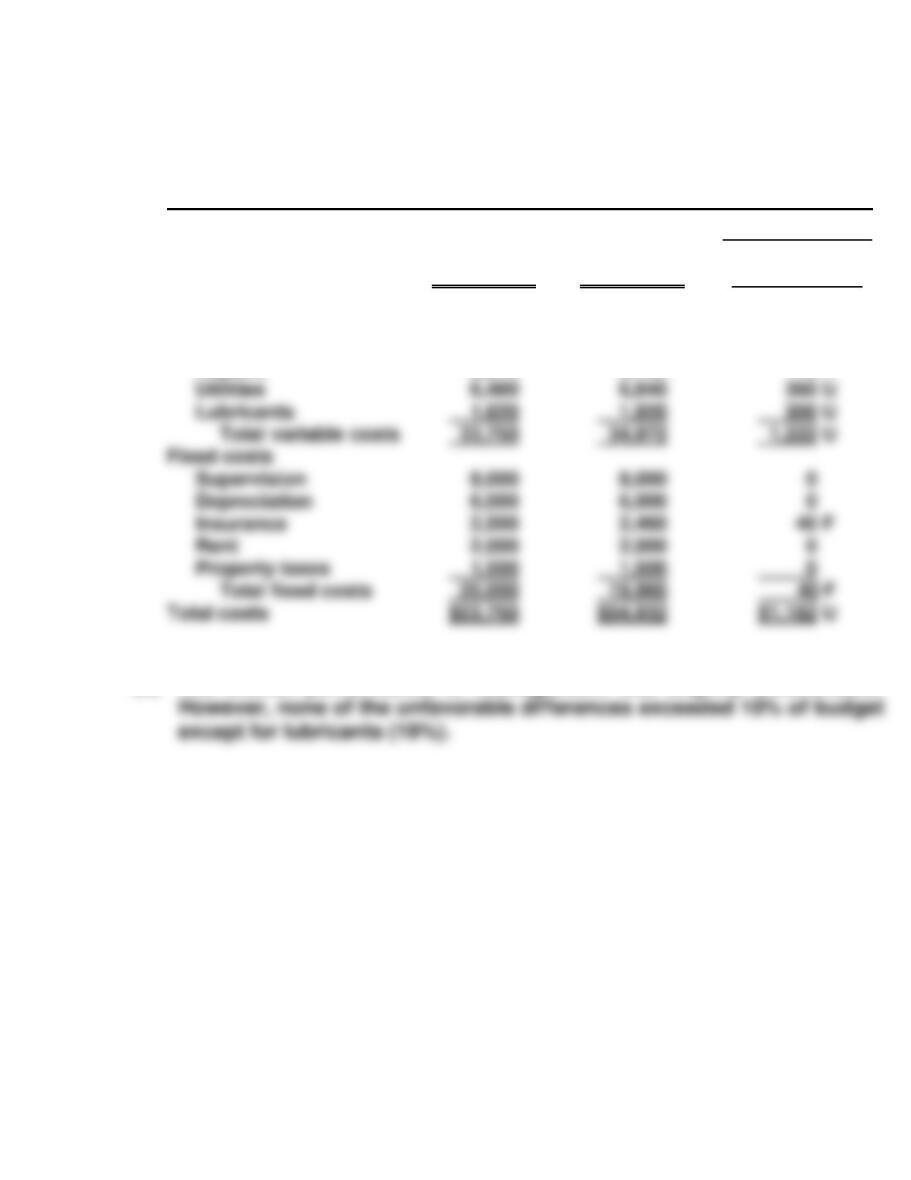
(c) RATCHET COMPANY
Assembling Department
Flexible Budget Report
For the Month Ended September 30, 2017
Difference
Units
Variable costs
Direct materials ($.80 X 64,000)
Direct labor ($.90 X 64,000)
Indirect materials ($.40 X 64,000)
Indirect labor ($.30 X 64,000)
Budget at
64,000 Units
$ 51,200
57,600
25,600
19,200
Actual Costs
64,000 Units
$ 51,700
56,320
26,620
19,250
Favorable F
Unfavorable U
$ 500 U
1,280 F
1,020 U
50 U
The manager’s performance was slightly better in September than it
was in August. However, each variable cost was slightly over budget
again except for direct labor.
Note that actual variable costs in September were 10% higher than
the actual variable costs in August. Therefore to find the actual vari–
able costs in September, the actual variable costs in August must be
increased 10% as follows:
August
(actual)
September
(actual)
Direct materials
Direct labor
$ 47,000 X 110%
51,200 X 110%
=
$ 51,700
56,320
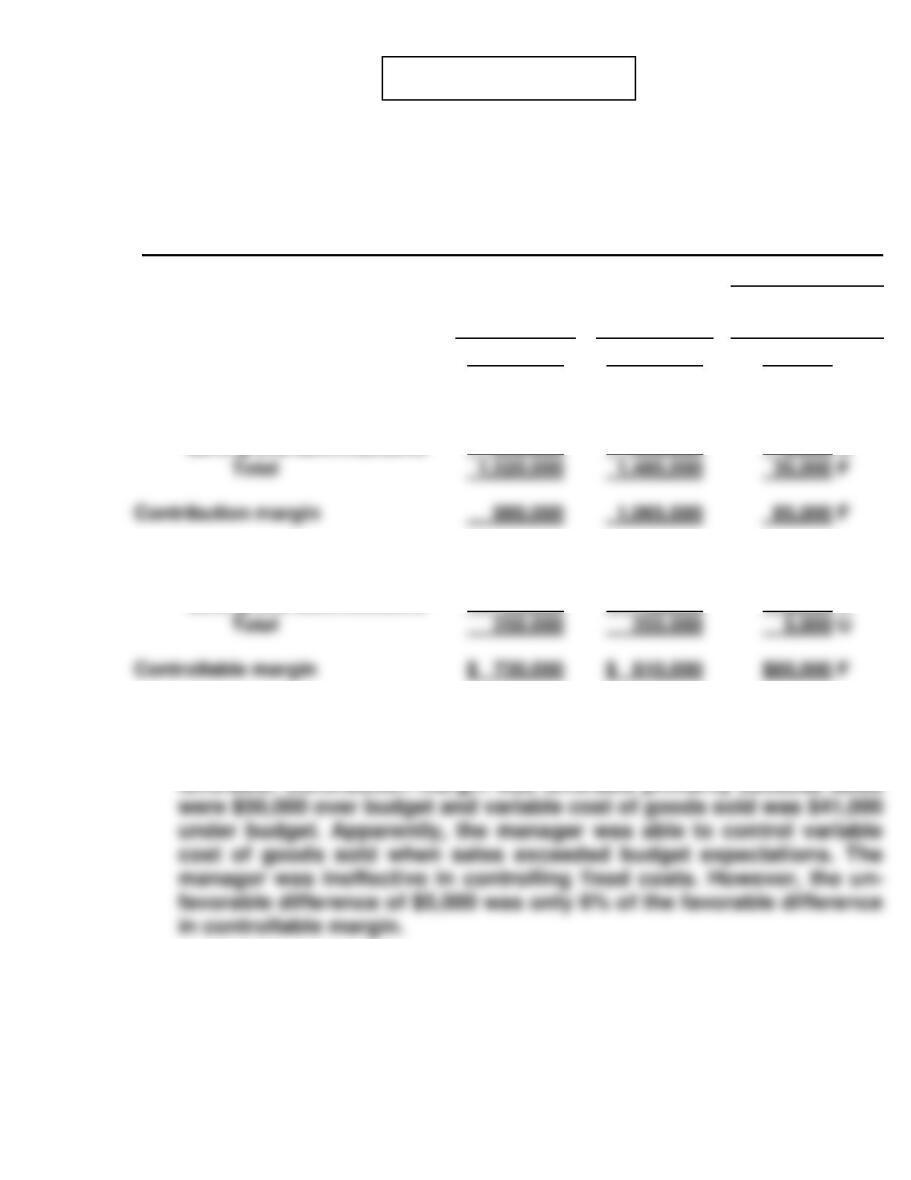
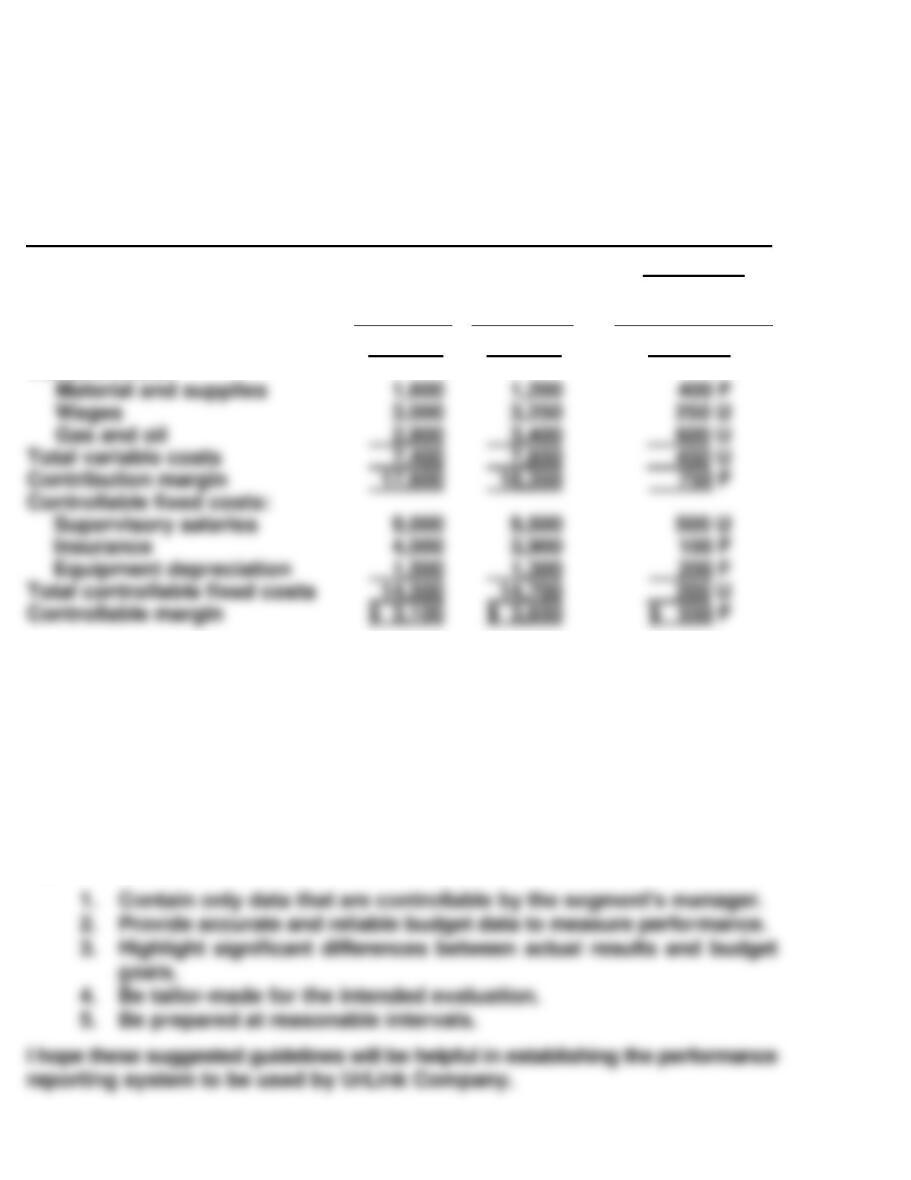
PROBLEM 10-4A
(a) CLARKE INC.
Patio Furniture Division
Responsibility Report
For the Year Ended December 31, 2017
Difference
Budget
Actual
Favorable F
Unfavorable U
Sales
Variable costs
Cost of goods sold
Selling and administrative
Controllable fixed costs
Cost of goods sold
Selling and administrative
$2,500,000
1,300,000
220,000
200,000
50,000
$2,550,000
1,259,000
226,000
203,000
52,000
$50,000 F
41,000 F
6,000 U
3,000 U
2,000 U
(b) The manager effectively controlled revenues and costs. Contribution
margin was $85,000 favorable and controllable margin was $80,000
(c) Two costs are excluded from the report: (1) noncontrollable fixed costs
and (2) indirect fixed costs. The reason is that neither cost is control-
lable by the Patio Furniture Division Manager.
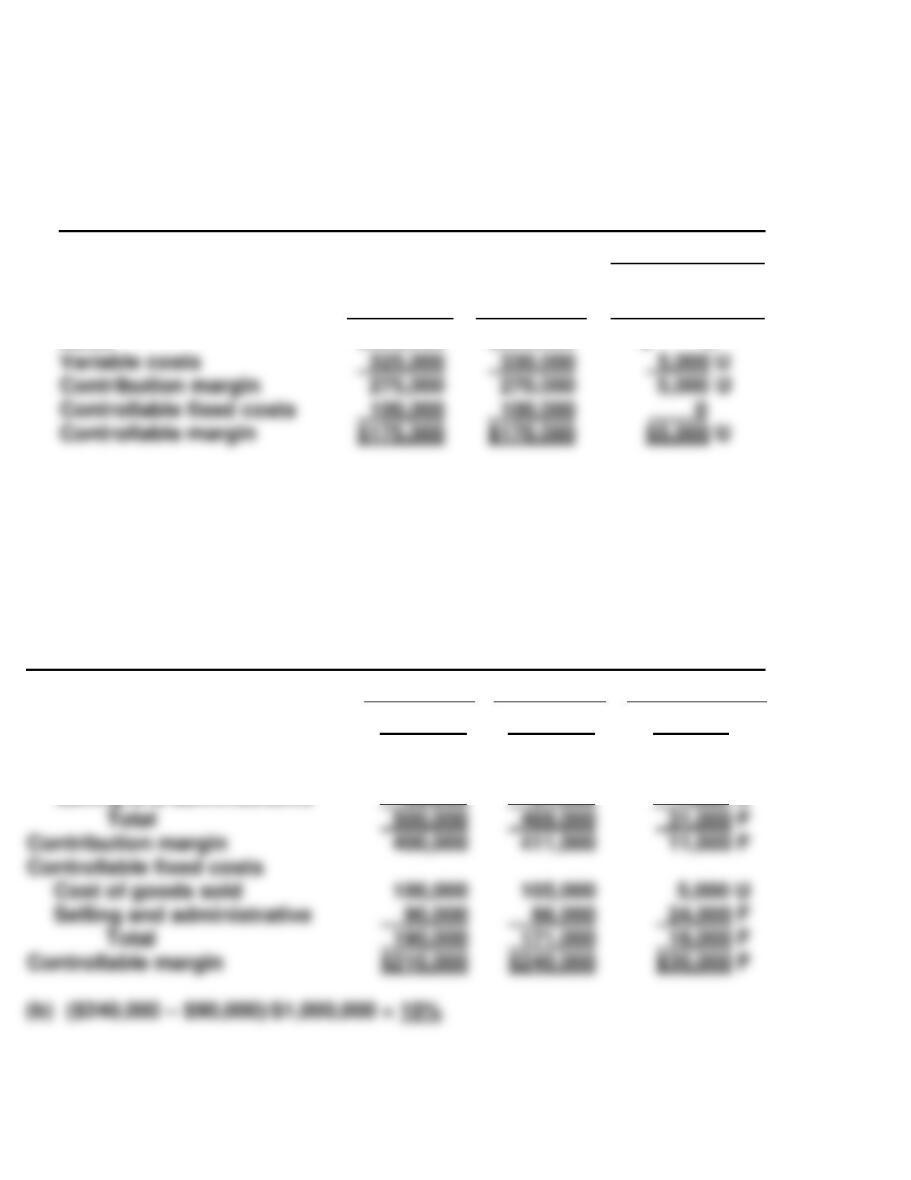
PROBLEM 10-5A
(a) OPTIMUS COMPANY
Home Division
Responsibility Report
For the Year Ended December 31, 2017
(in thousands of dollars)
Difference
Budget
Actual
Favorable F
Unfavorable U
Sales
Variable costs
Cost of goods sold
Selling and administrative
Total
$1,300
620
100
720
$1,400
665
125
790
$100 F
45 U
25 U
70 U
(b) The performance of the manager of the Home Division was slightly
above budget expectations for the year. The item that top manage-
ment would likely investigate is the reason why variable cost of
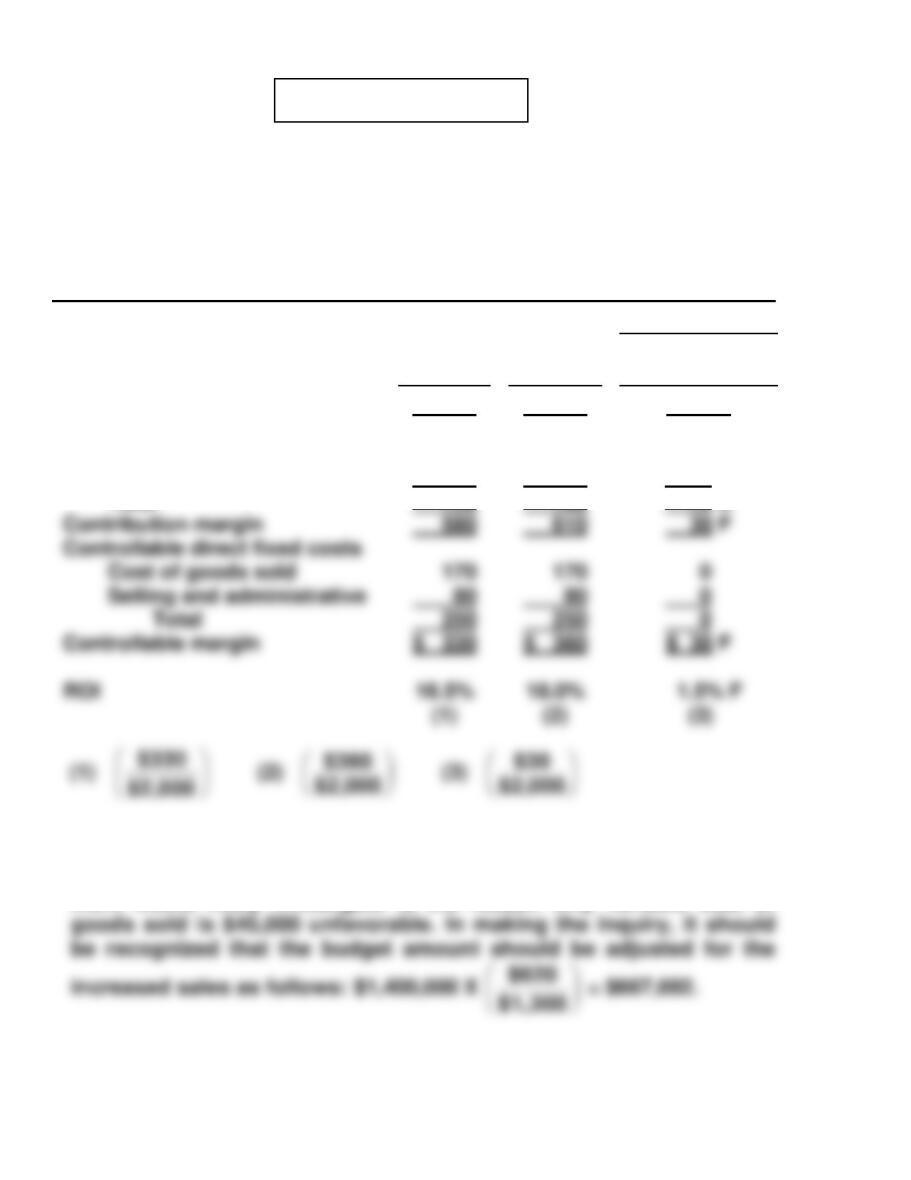
(3)
PROBLEM 10-5A (Continued)
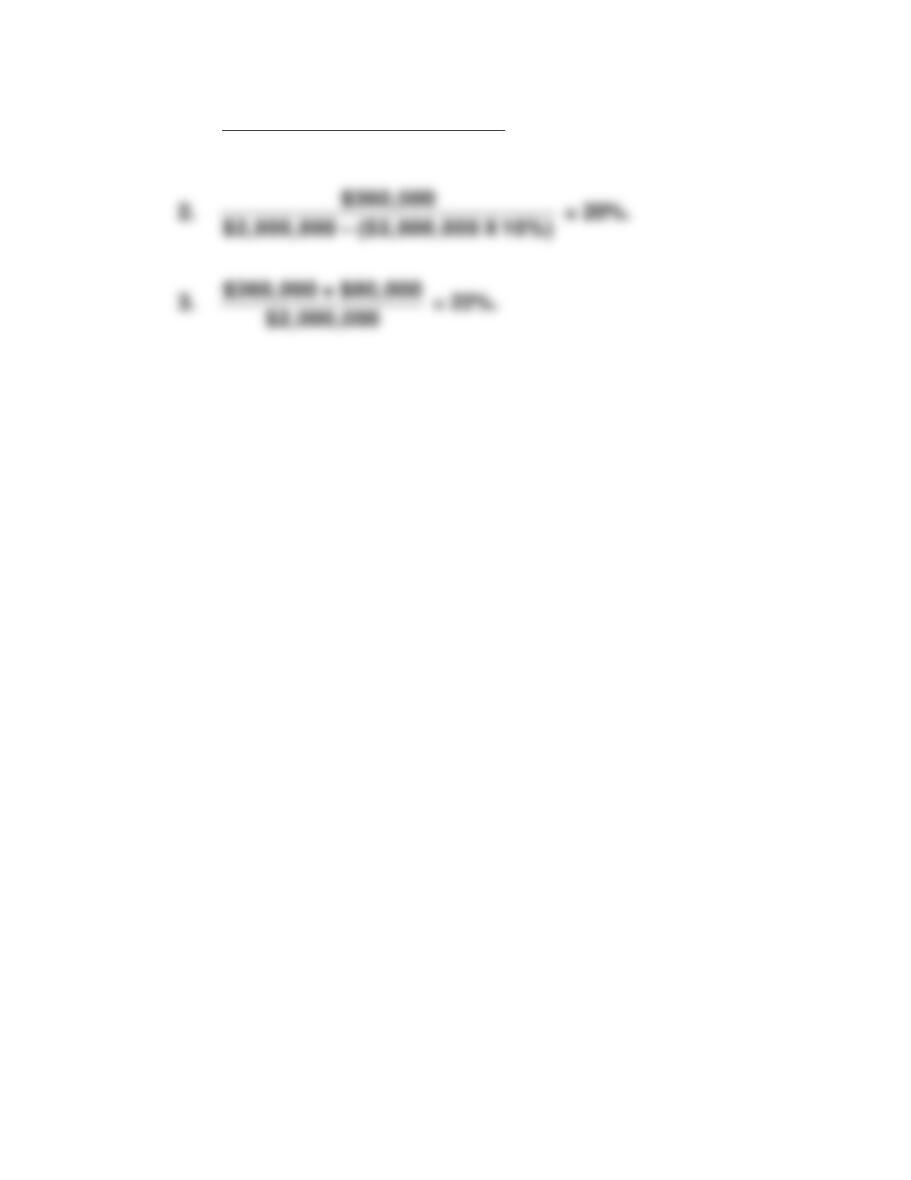
(c) 1.
$360,000 + ($665,000 X 5%)
$2,000,000
= 19.7%.
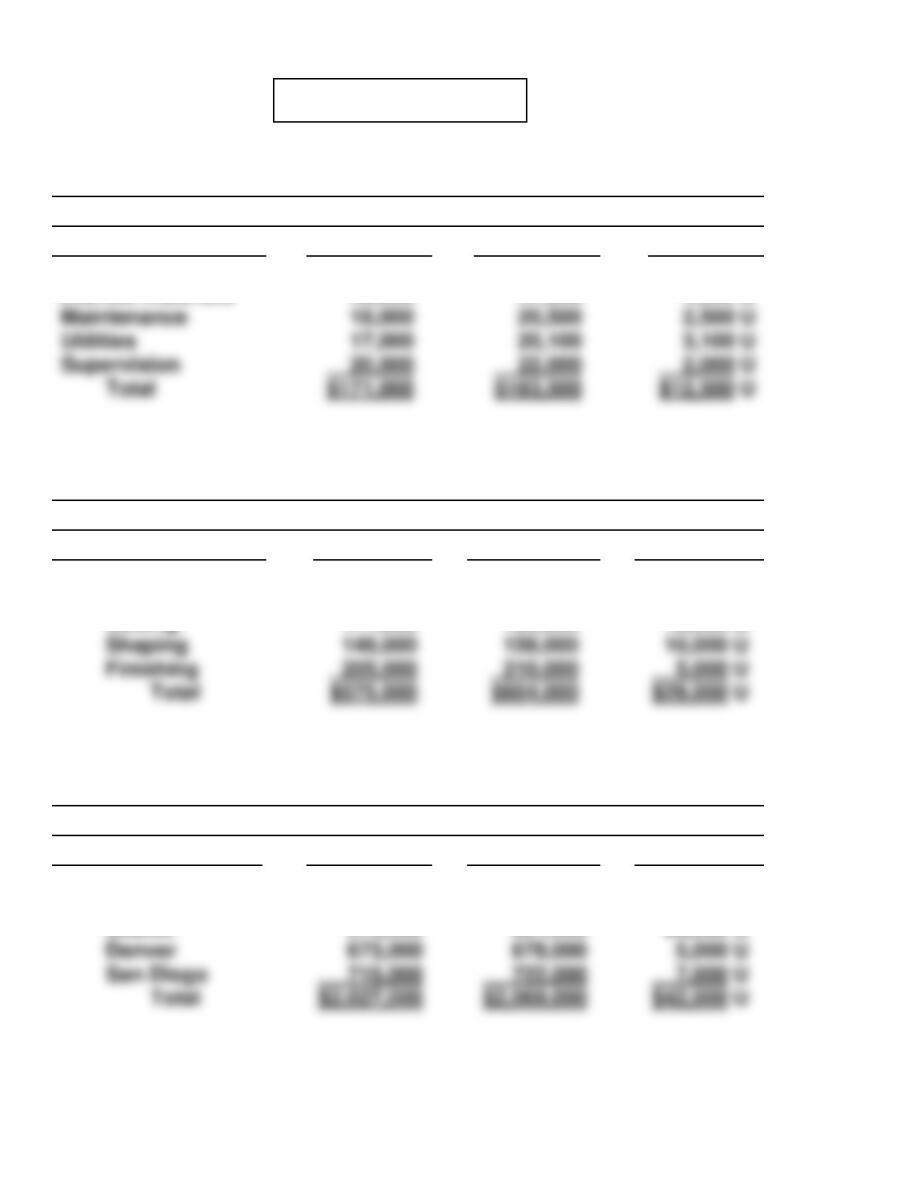
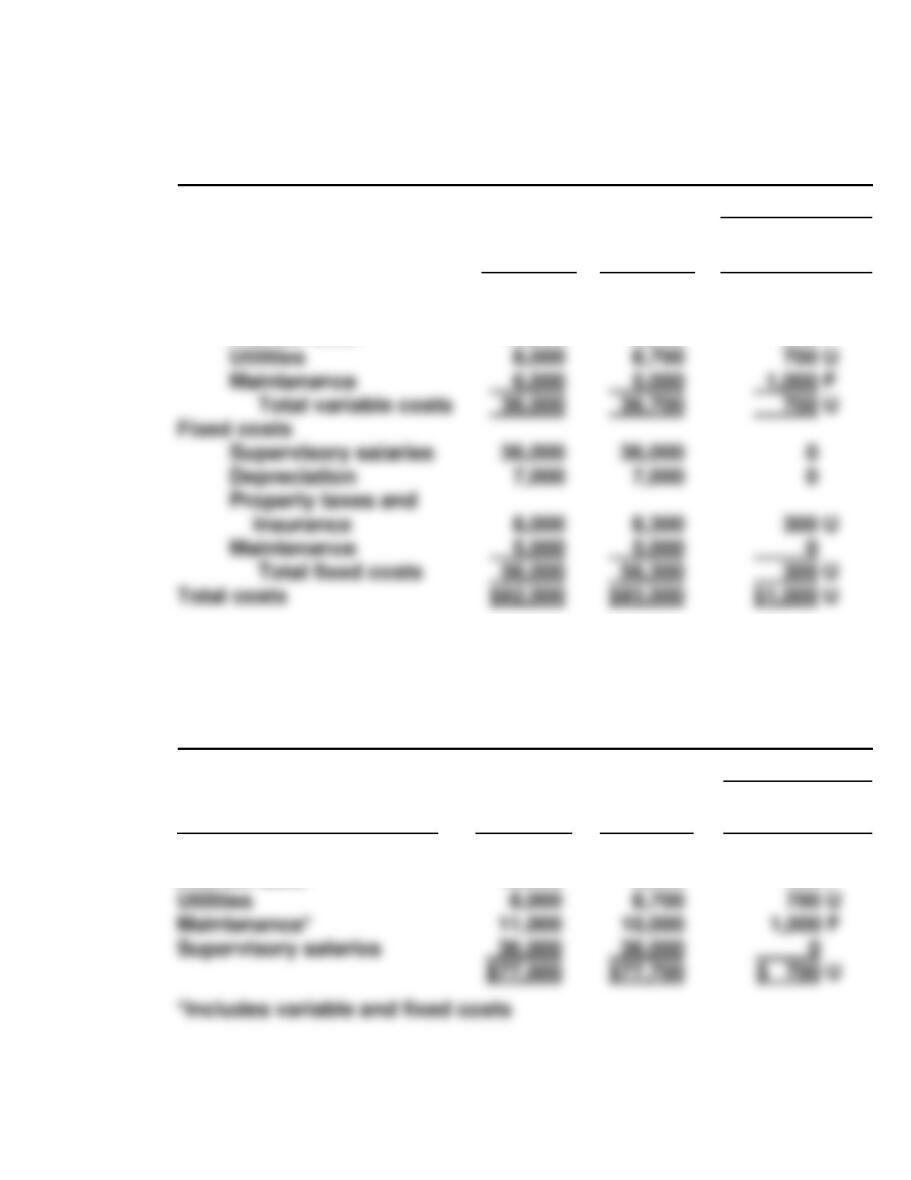
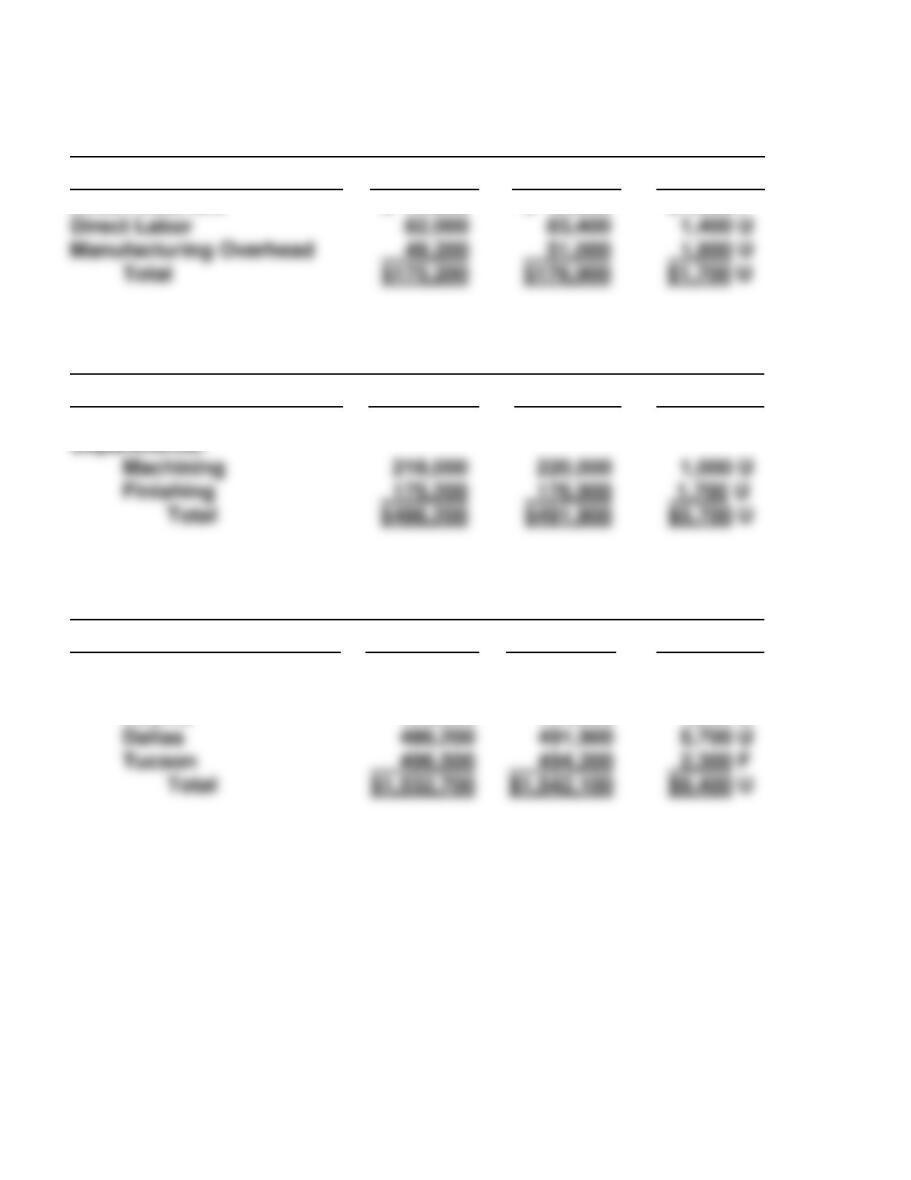
PROBLEM 10-6A
(a) No. 1
To Cutting Department Manager—Seattle Division Month: January
Controllable Costs:
Budget
Actual
Fav/Unfav
Indirect labor
Indirect materials
$ 70,000
46,000
$ 73,000
47,900
$ 3,000 U
1,900 U
No. 2
To Division Production Manager—Seattle Month: January
Controllable Costs:
Budget
Actual
Fav/Unfav
Seattle Division
Departments:
Cutting
$ 51,000
171,000
$ 52,500
183,500
$ 1,500 U
12,500 U
No. 3
To Vice President—Production Month: January
Controllable Costs:
Budget
Actual
Fav/Unfav
V-P Production
Divisions:
Seattle
$ 64,000
575,000
$ 65,000
604,000
$ 1,000 U
29,000 U
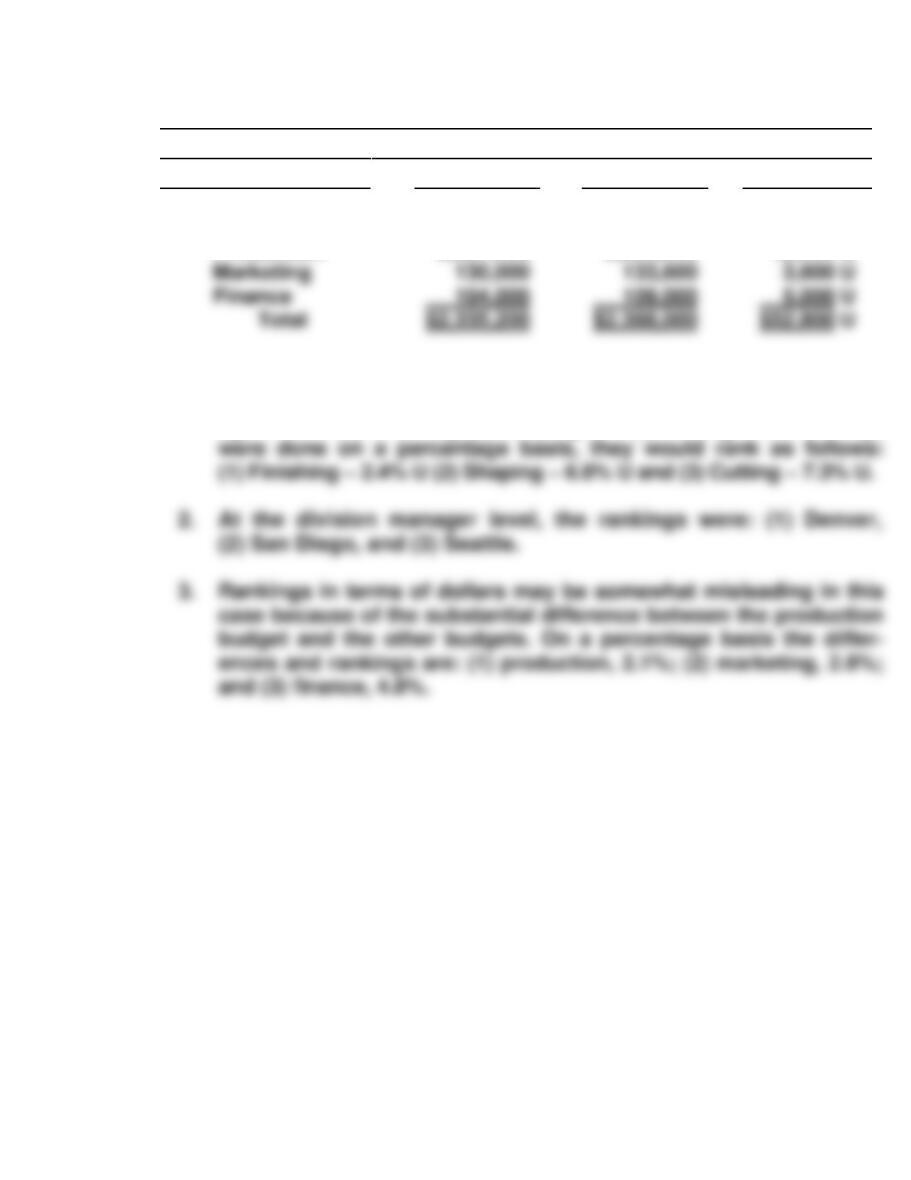
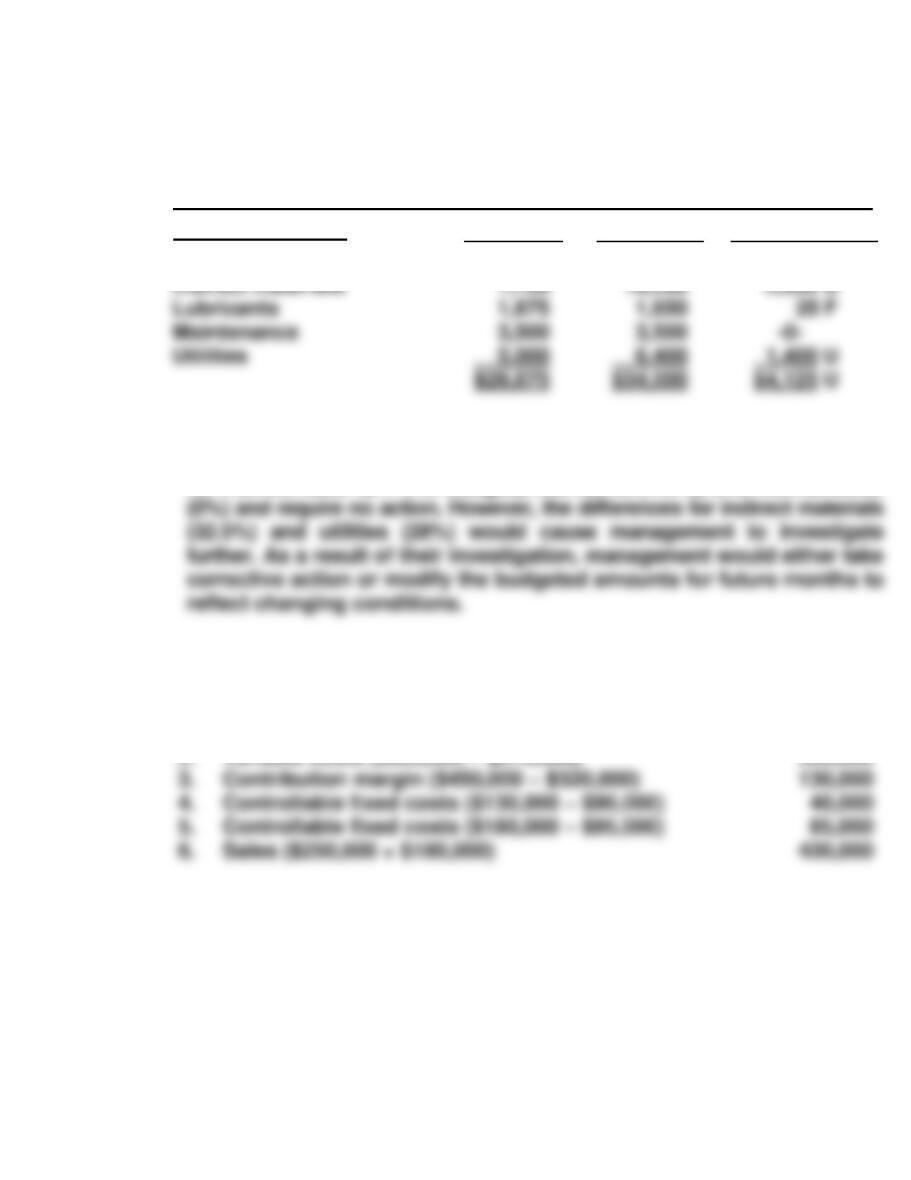
PROBLEM 10-6A (Continued)
No. 4
To President Month: January
Controllable Costs:
Budget
Actual
Fav/Unfav
President
Vice-Presidents:
Production
$ 74,200
2,027,000
$ 76,400
2,069,000
$ 2,200 U
42,000 U
(b) 1. Within the Seattle division the rankings of the department man-
agers were: (1) Finishing, (2) Shaping, and (3) Cutting. If the rankings
*PROBLEM 10-7A
(a) 1. ROI = Controllable Margin ÷ Average Operating Assets
ROI = $2,460,000 ÷ $12,300,000
ROI = 20%
2. Residual Income = Controllable Margin – (Minimum Rate of
Return X Average Operating Assets)
investment opportunity it had in 2017 if residual income had been
used as the performance measure because an increase in residual
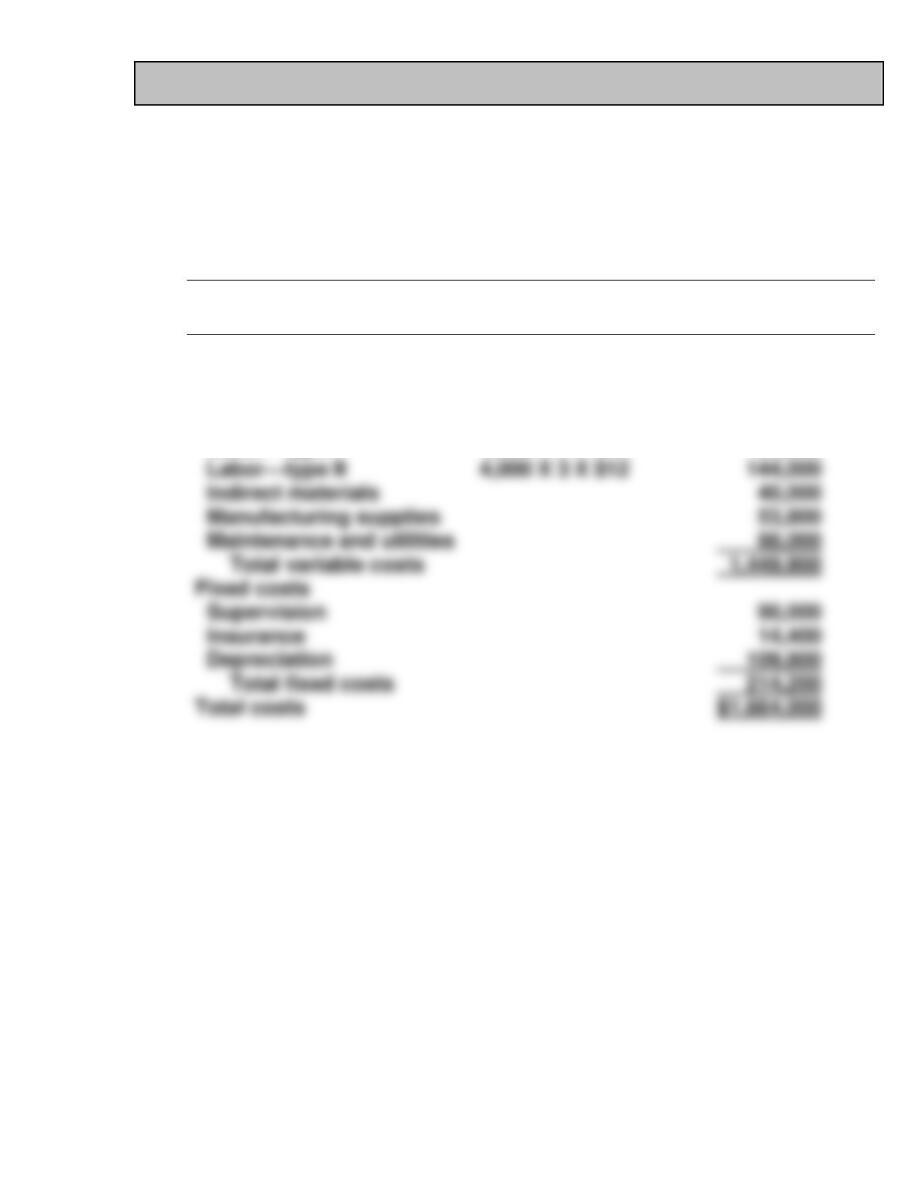
CD10 CURRENT DESIGNS
(a) Current Designs
Rotomolded Line
Manufacturing Budget
For the Year Ended December 31, 2017
4,000 kayaks
Units to be produced
Calculation
Amount budgeted
Costs:
Variable costs
Polyethylene powder
4,000 X 54 X $1.50
$ 324,000
Finishing kits
4,000 X $170
680,000
Labor—type I
4,000 X 2 X $15
120,000
Labor—type II
4,000 X 3 X $12
Indirect materials
Manufacturing supplies
Maintenance and utilities
88,000
Total variable costs
Fixed costs
Supervision
Insurance
Depreciation
Total fixed costs
214,200
Total costs
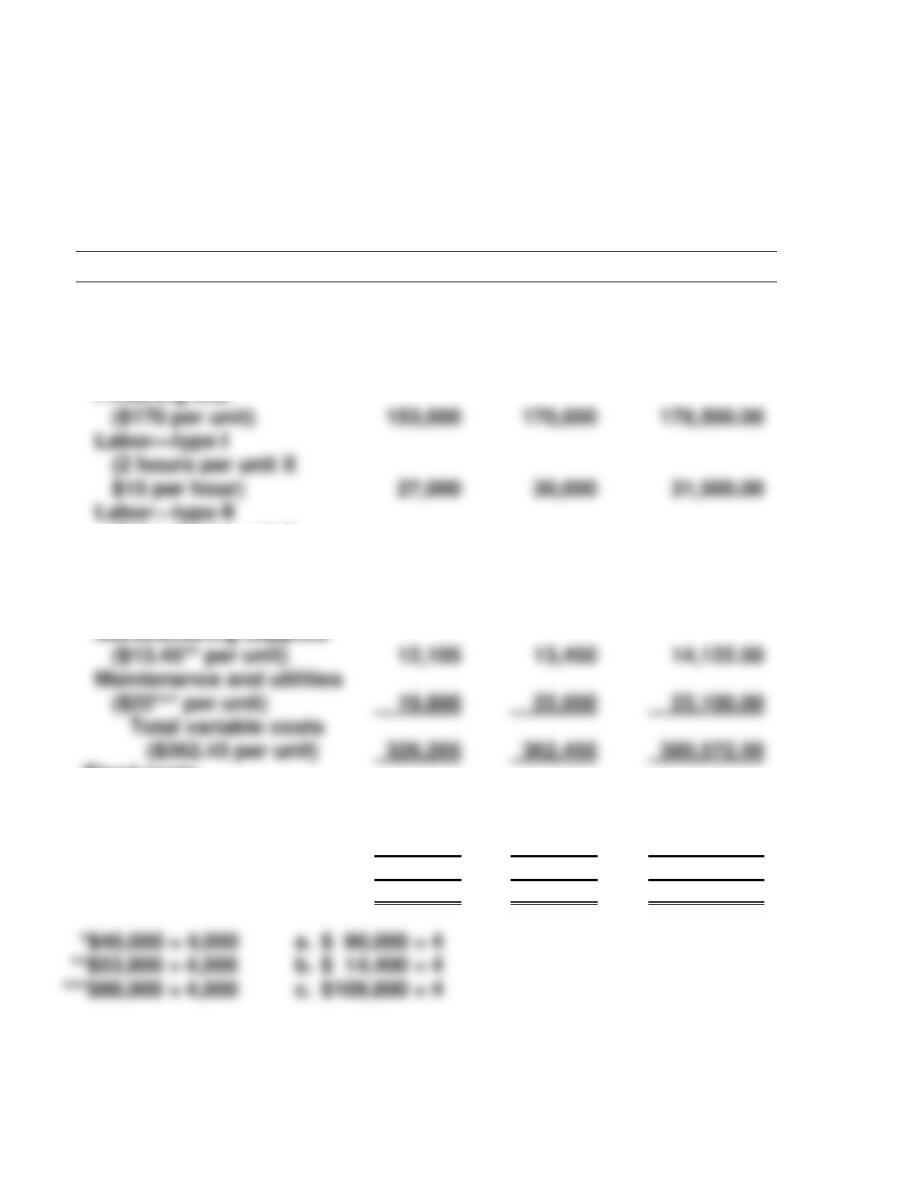
CD10 (Continued)
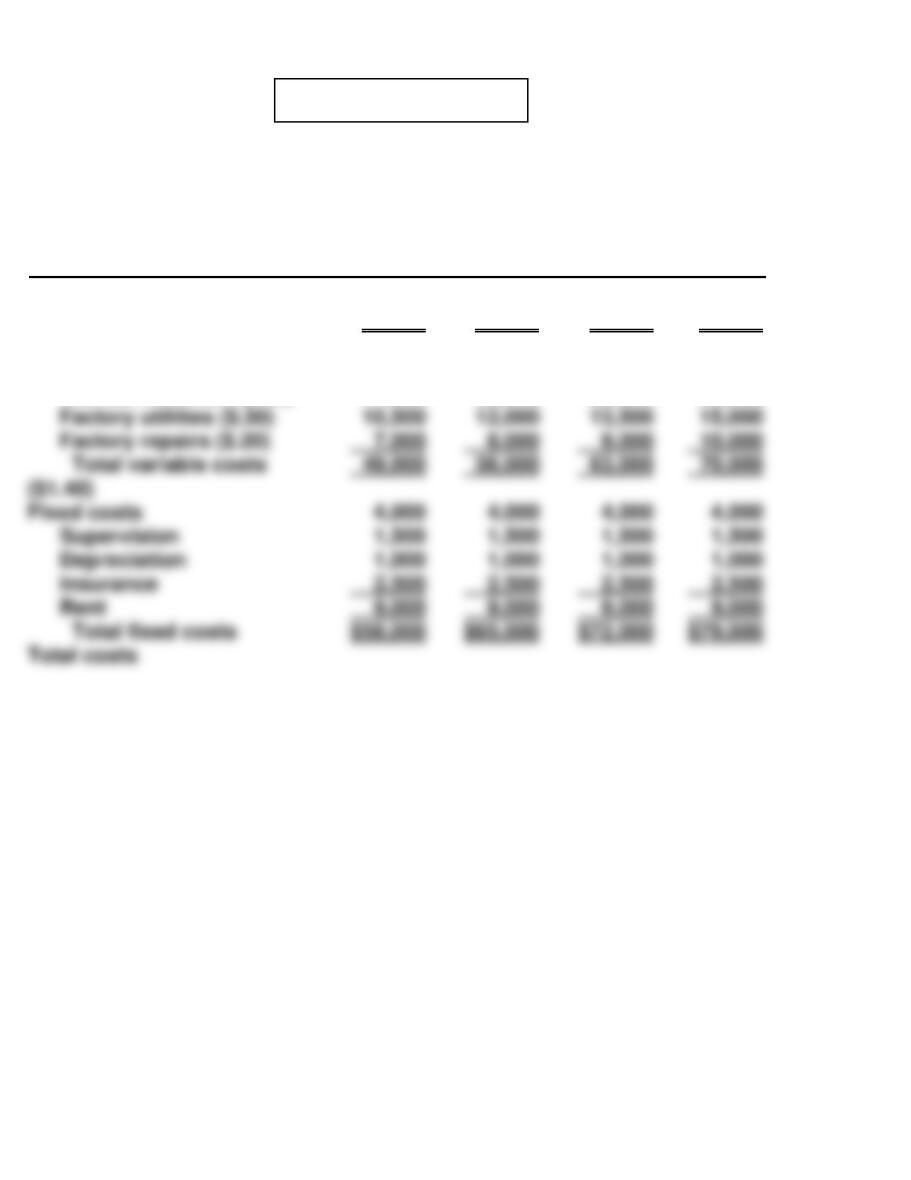
(b) Current Designs
Rotomolded Line
Manufacturing Flexible Budget Report
For the Quarter Ended March 31, 2017
Units to be produced
900 kayaks
1,000 kayaks
1,050 kayaks
Costs:
Variable costs
Polyethylene powder
(54 X 1.50 per unit)
$ 72,900
$ 81,000
$ 85,050.00
(3 hours per unit X
$12 per hour)
32,400
36,000
37,800.00
Indirect materials
($10* per unit)
9,000
10,000
10,500.00
($13.45** per unit)
12,105
13,450
14,122.50
Maintenance and utilities
($22*** per unit)
19,800
22,000
23,100.00
Total variable costs
($362.45 per unit)
Fixed costs
Supervision (a.)
22,500
22,500
22,500.00
Insurance (b.)
3,600
3,600
3,600.00
Depreciation (c.)
27,450
27,450
27,450.00
Total fixed costs
53,550
53,550
53,550.00
Total costs
$379,755
$416,000
$434,122.50
Finishing kits
($170 per unit)
170,000
(2 hours per unit X
$15 per hour)
27,000
30,000
31,500.00
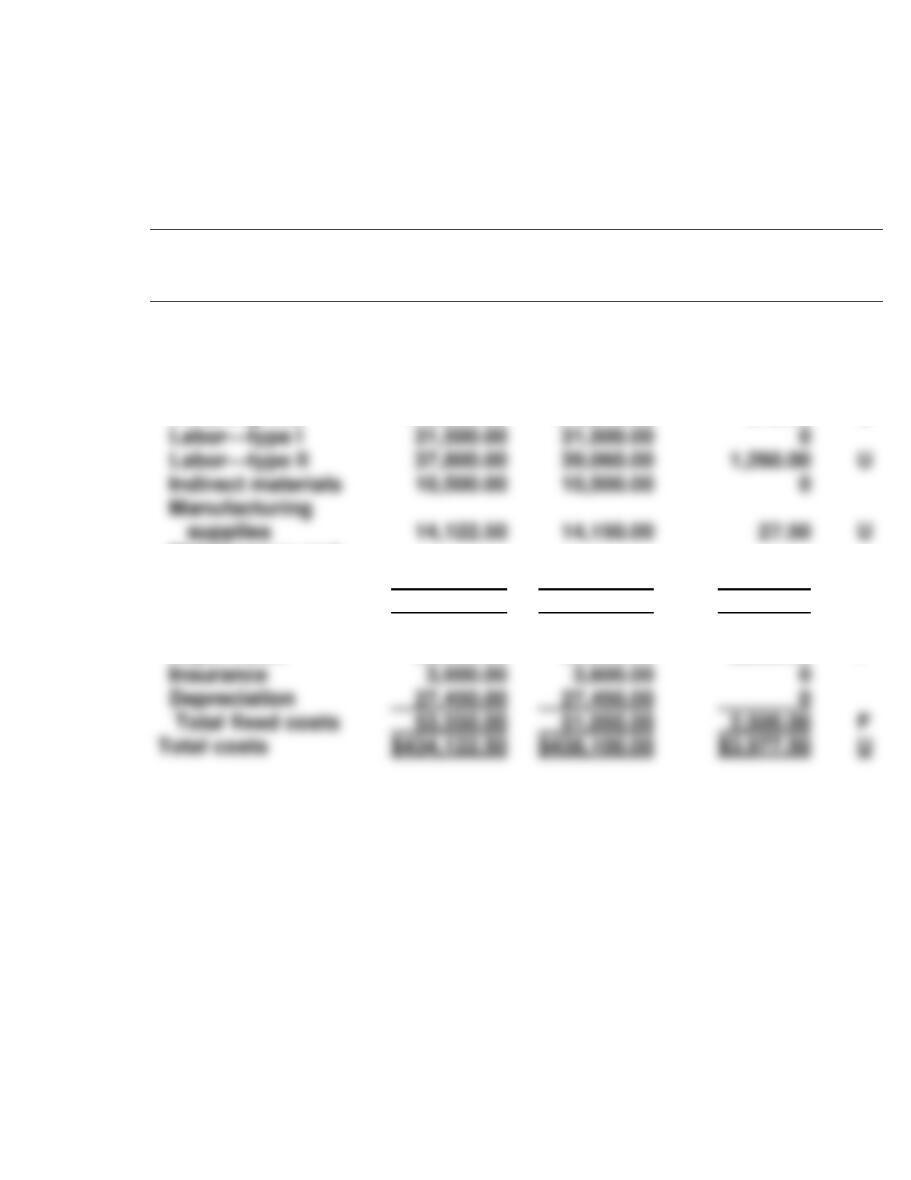
CD10 (Continued)
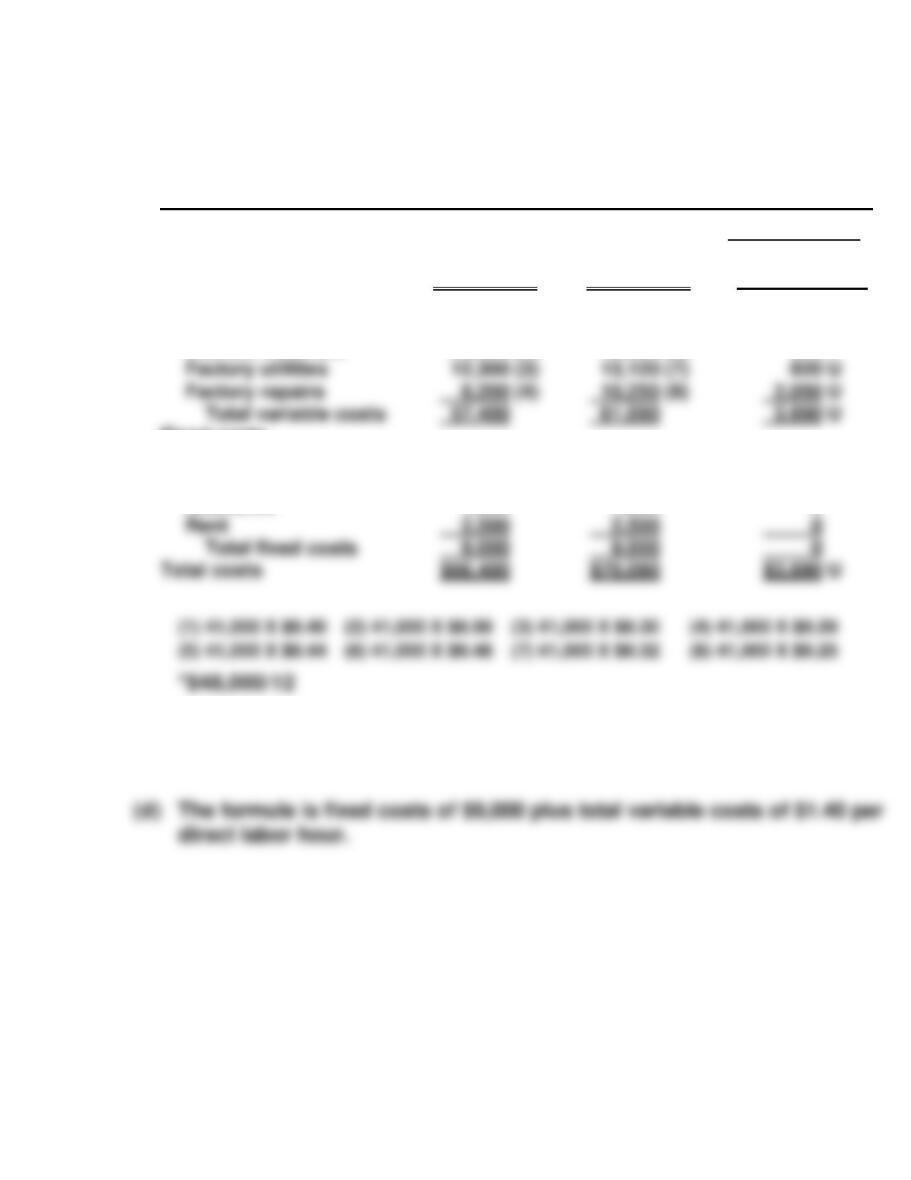
(c) Current Designs
Rotomolded Line
Manufacturing Flexible Budget Report
For the Quarter Ended March 31, 2017
Units to be produced
Budget for
1,050 kayaks
Actual costs for
1,050 kayaks
Difference
F = favorable
U = unfavorable
Costs:
Variable costs
Polyethylene
powder
$ 85,050.00
$ 87,000.00
$1,950.00
U
Finishing kits
178,500.00
178,840.00
340.00
U
Maintenance and
utilities
23,100.00
26,000.00
2,900.00
U
Total variable costs
380,572.50
387,050.00
6,477.50
U
Fixed costs
Supervision
22,500.00
20,000.00
2,500.00
F
Depreciation
27,450.00
27,450.00
Total fixed costs
53,550.00
51,050.00
2,500.00
F
Total costs
$434,122.50
$438,100.00
$3,977.50
U
Labor—type I
31,500.00
31,500.00
U
Indirect materials
10,500.00
10,500.00
supplies
U
BYP 10-1 DECISION-MAKING ACROSS THE ORGANIZATION
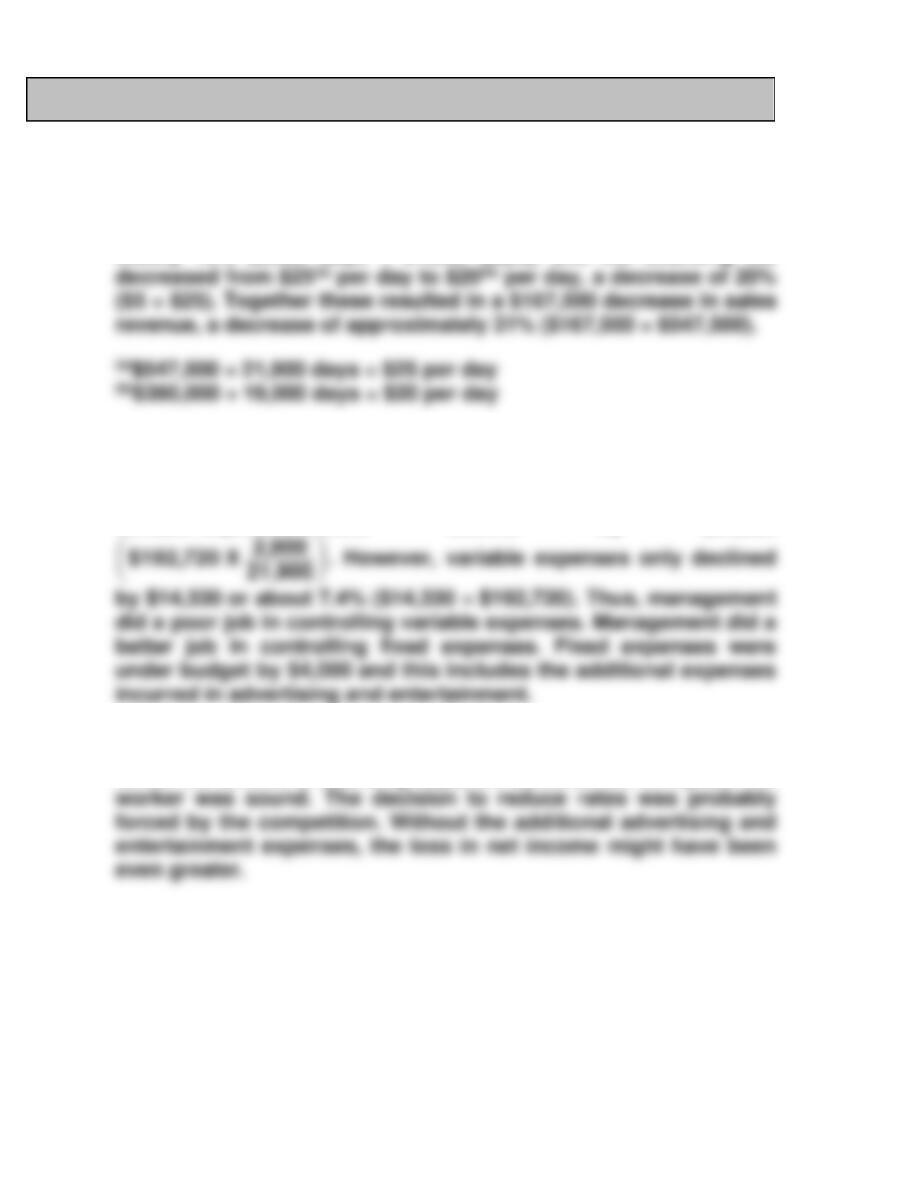
(a) 1. The primary causes of the loss in net income were the decrease in
the number of boarding days and the decrease in the boarding
fee. The number of boarding days decreased by 2,900 or approxi-
mately 13% (2,900 days ÷ 21,900 days), and the boarding fee
2. Management did a poor job in controlling variable expenses.
Given that boarding days declined by about 13%, variable
expenses should decline by about 13%, or more precisely,
variable expenses should decline by $25,520
3. Management’s decisions to stay competitive probably were sound.
Given the decline in boarding days, the decision not to replace the
BYP 10-1 (Continued)
(b) GREEN PASTURES
Income Statement
Flexible Budget Report
For the Year Ended December 31, 2017
Difference
Boarding days (BD)
Sales ($25)
Less variable expenses
Feed ($5)
Budget at
19,000 BD
$475,000
95,000
Actual at
19,000 BD
$380,000
104,390
Favorable F
Unfavorable U
$ 95,000 U
9,390 U
(c) 1. The primary causes of the decrease in net income are the decreases
in boarding rates and volume. The average daily rate charged
was $20 = ($380,000 ÷ 19,000). This rate resulted in a decrease in
sales revenue of $95,000 or 20% = ($95,000 ÷ $475,000).
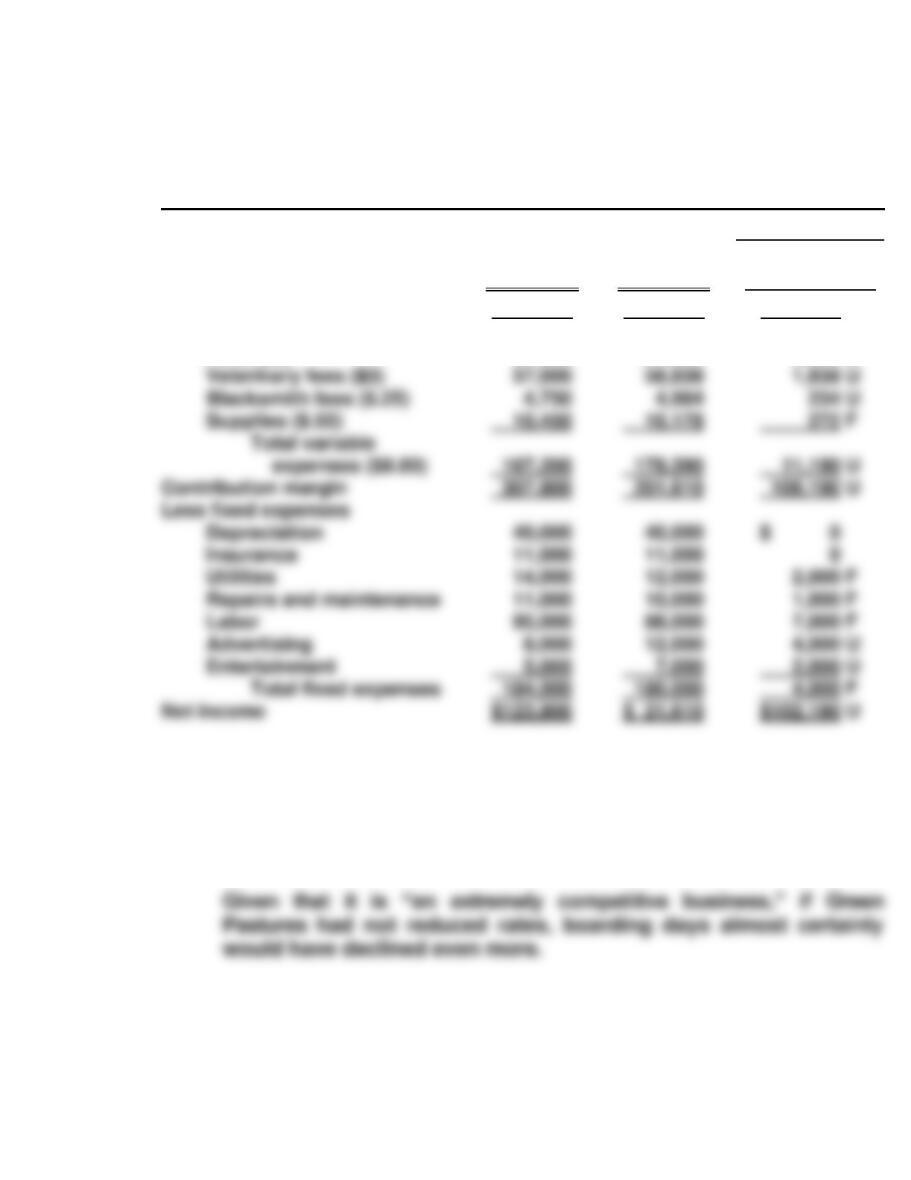
BYP 10-1 (Continued)
2. Management did a poor job of controlling variable expenses. These
expenses in total were $11,190 over budget or 6.7%, or ($11,190 ÷
$167,200).
(d) Given that the industry is “extremely competitive,” management should
consider two options. One, become the lowest cost operator. If Green
Pastures is the company with the lowest operating costs, it can under–
price its competitors and take customers away from them (increasing
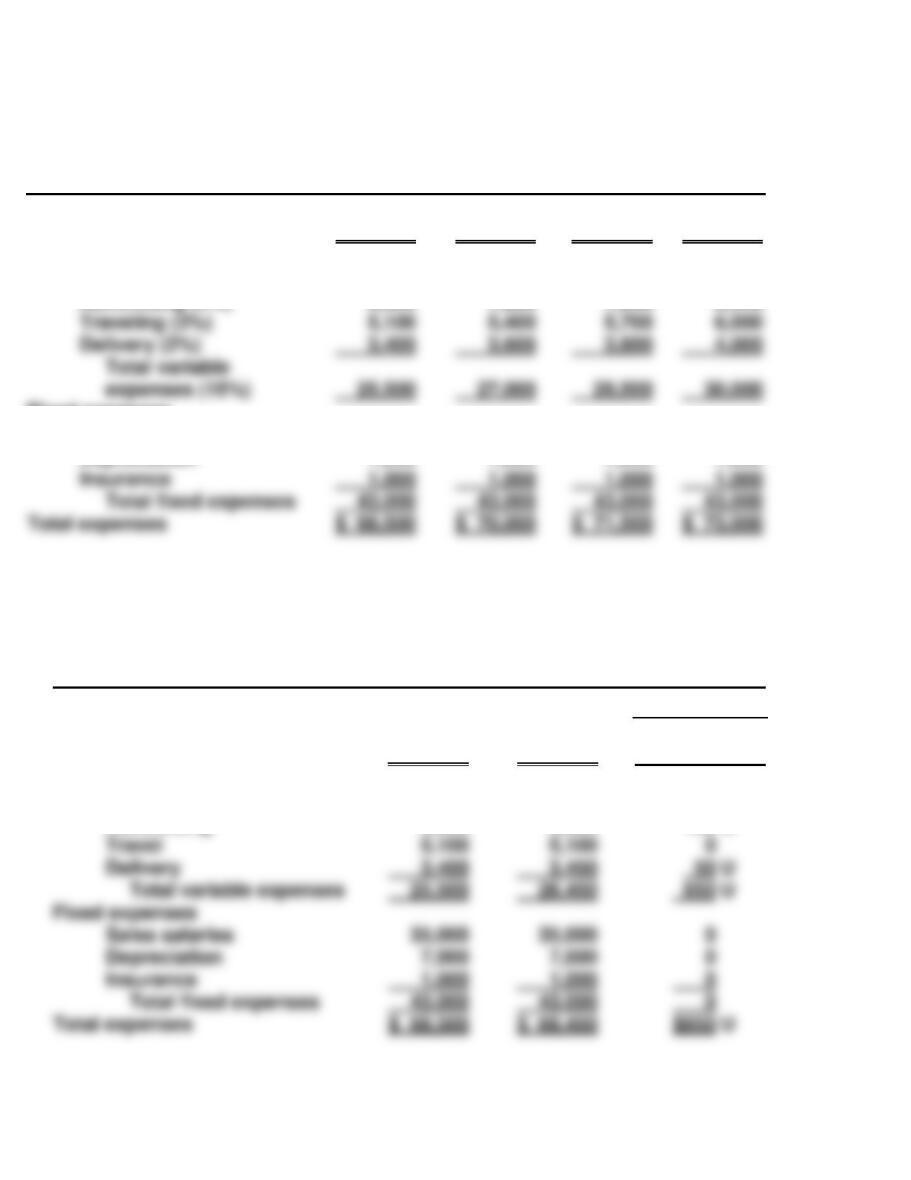
BYP 10-2 MANAGERIAL ANALYSIS
(a) Mary Gammel—Profit Center: Responsible for sales, inventory cost,
advertising, sales personnel, printing, and travel. She is not responsible
for the assets invested in her division and probably does not control
the rent or depreciation costs either. As a profit center manager she
might have control of the insurance, but she probably does not.
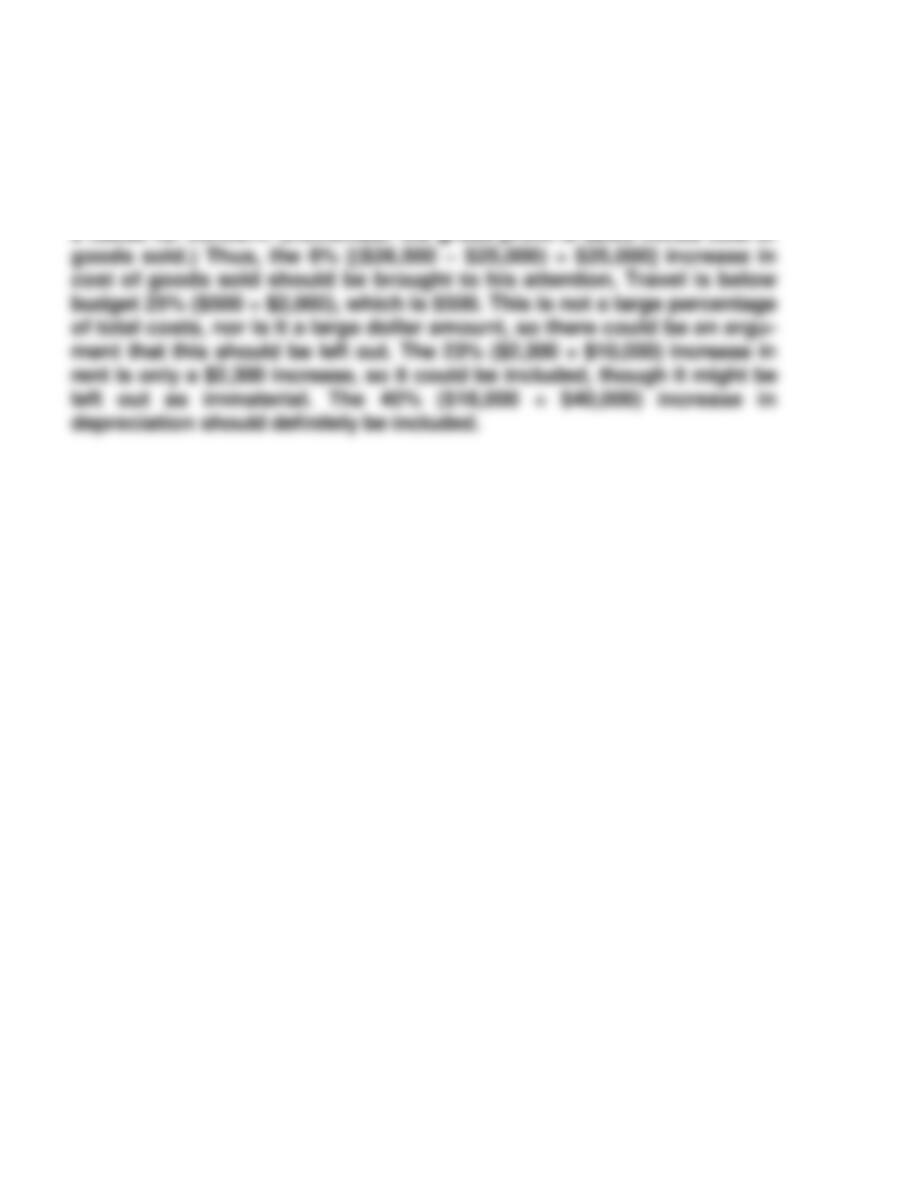
(b) Mary Gammel Budget differences: The cost of goods sold is 28%
($42,000 ÷ $150,000) above budget and so should definitely be brought
to her attention. Travel is 30% ($6,000 ÷ $20,000) below budget.
Students may differ as to whether they believe that this should be
brought to her attention. The differences in rent and depreciation should
not be brought to her attention because she does not control those
costs.
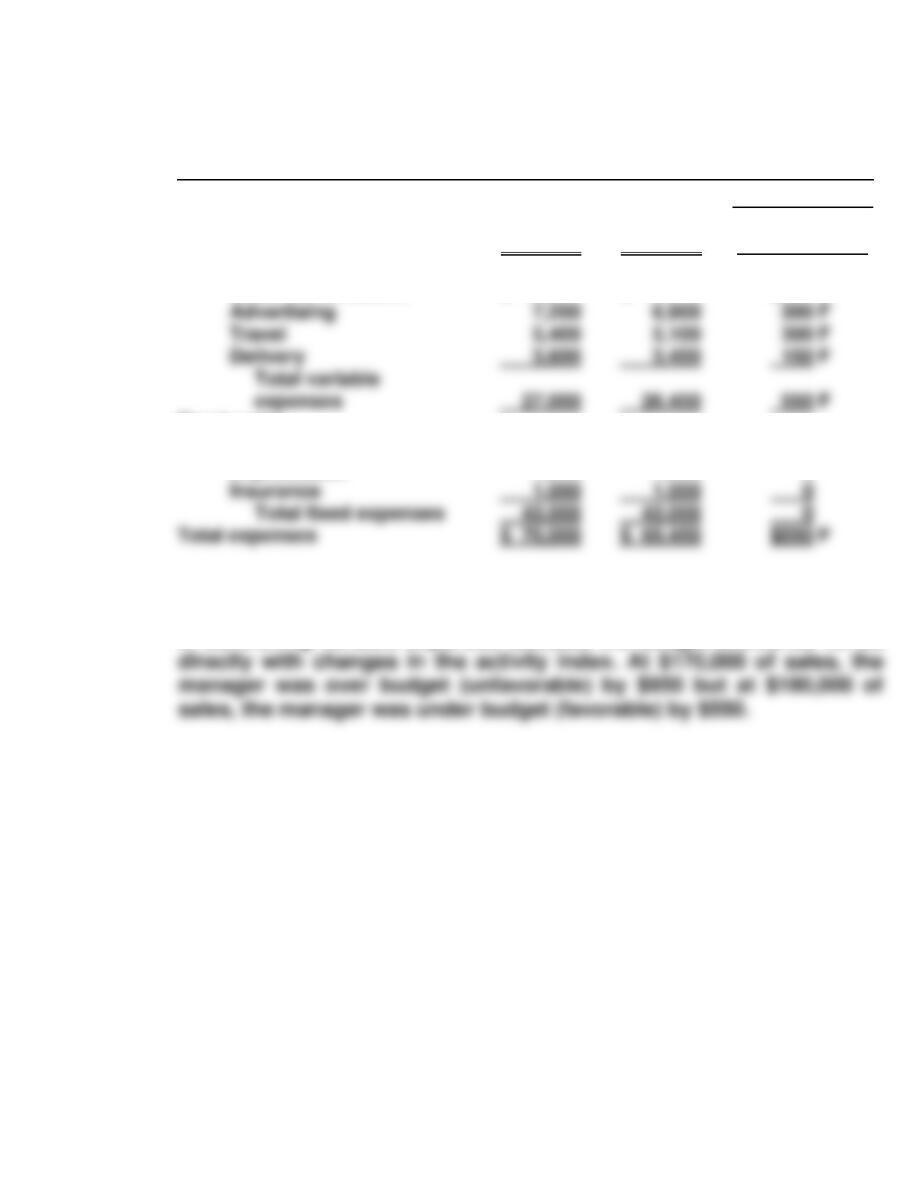
BYP 10-2 (Continued)
Jose Gomez Budget differences: As manager of an investment center,
Mr. Gomez is responsible for all categories of the budget. The
selection in this case would be which differences merit his attention.
Any decrease in a company’s gross profit rate (gross profit ÷ sales) is
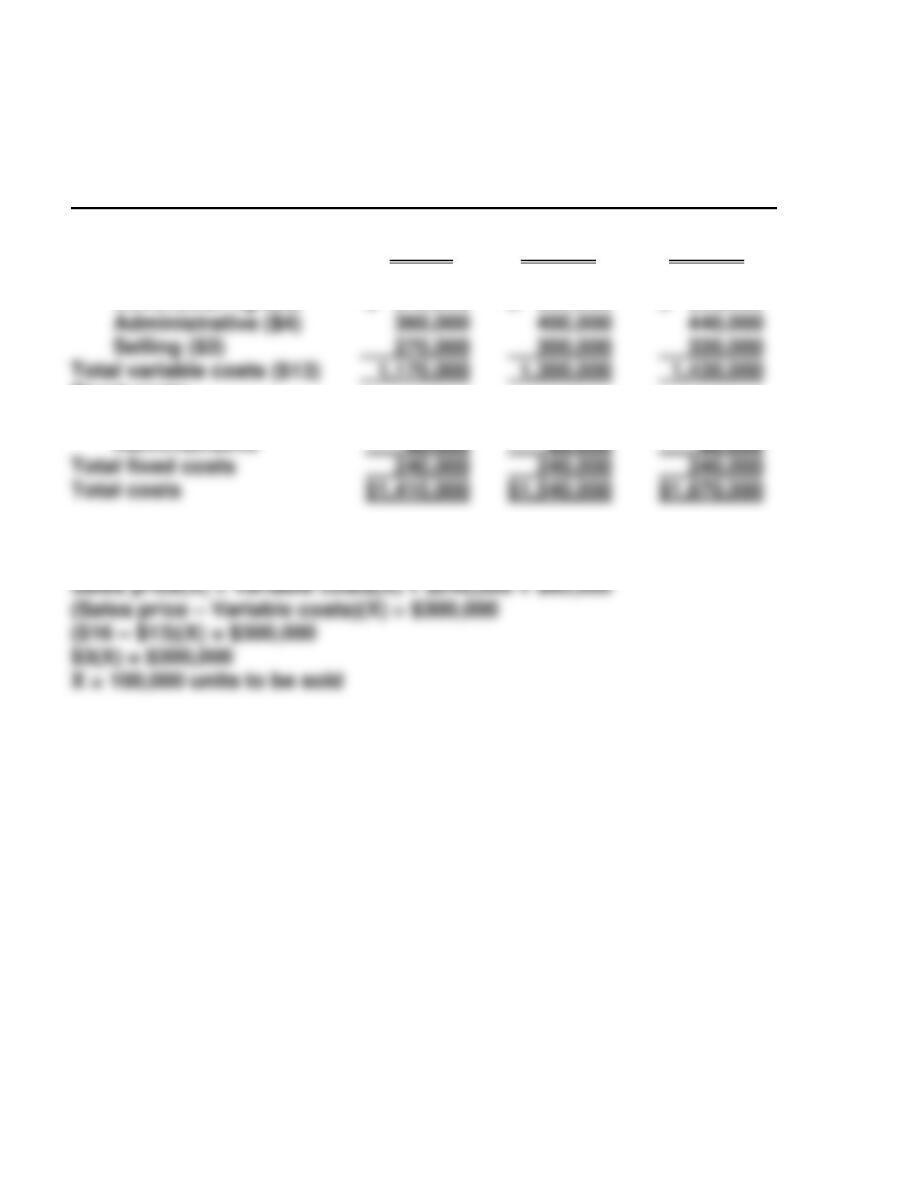
BYP 10-3 REAL-WORLD FOCUS
(a) The company’s costs do not increase proportionately with the revenues
increase in the third and fourth quarter because the behavior of the
costs is primarily fixed.
BYP 10-4 REAL-WORLD FOCUS
(a) The two most common pain points are (1) dealing with other managers
and (2) technology issues, mainly frustration of budgeting in Excel
spreadsheets.
(b) Of those companies that participated in the survey, 97 percent said
that they prepare annual budgets. Of those that prepare annual budgets,
60 percent say that they begin the process by determining sales
forecasts.
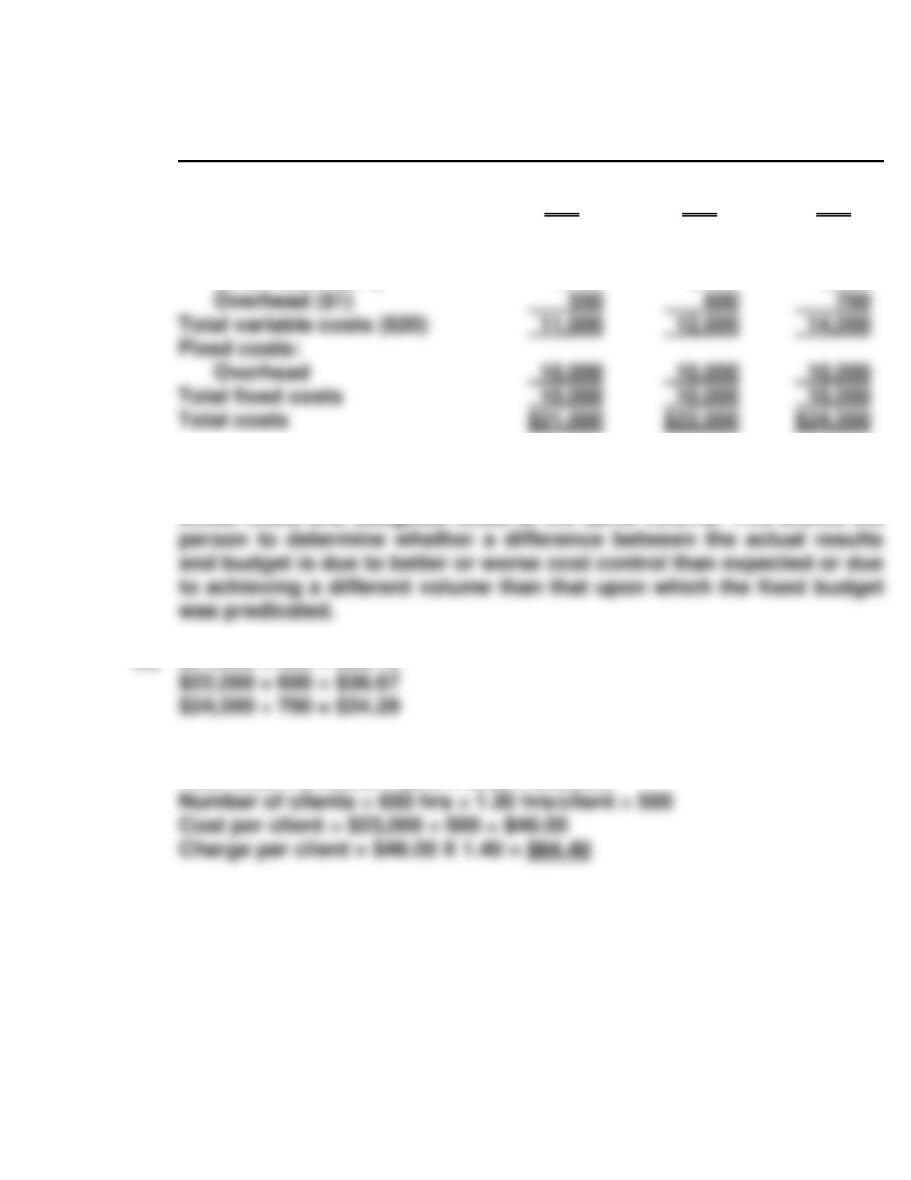
BYP 10-5 COMMUNICATION ACTIVITY
(a) Fred Bedner should be able to control all the variable costs and the
fixed costs of supervision (but not his portion) and inspection.
Insurance and depreciation ordinarily are not the responsibility of the
department manager.
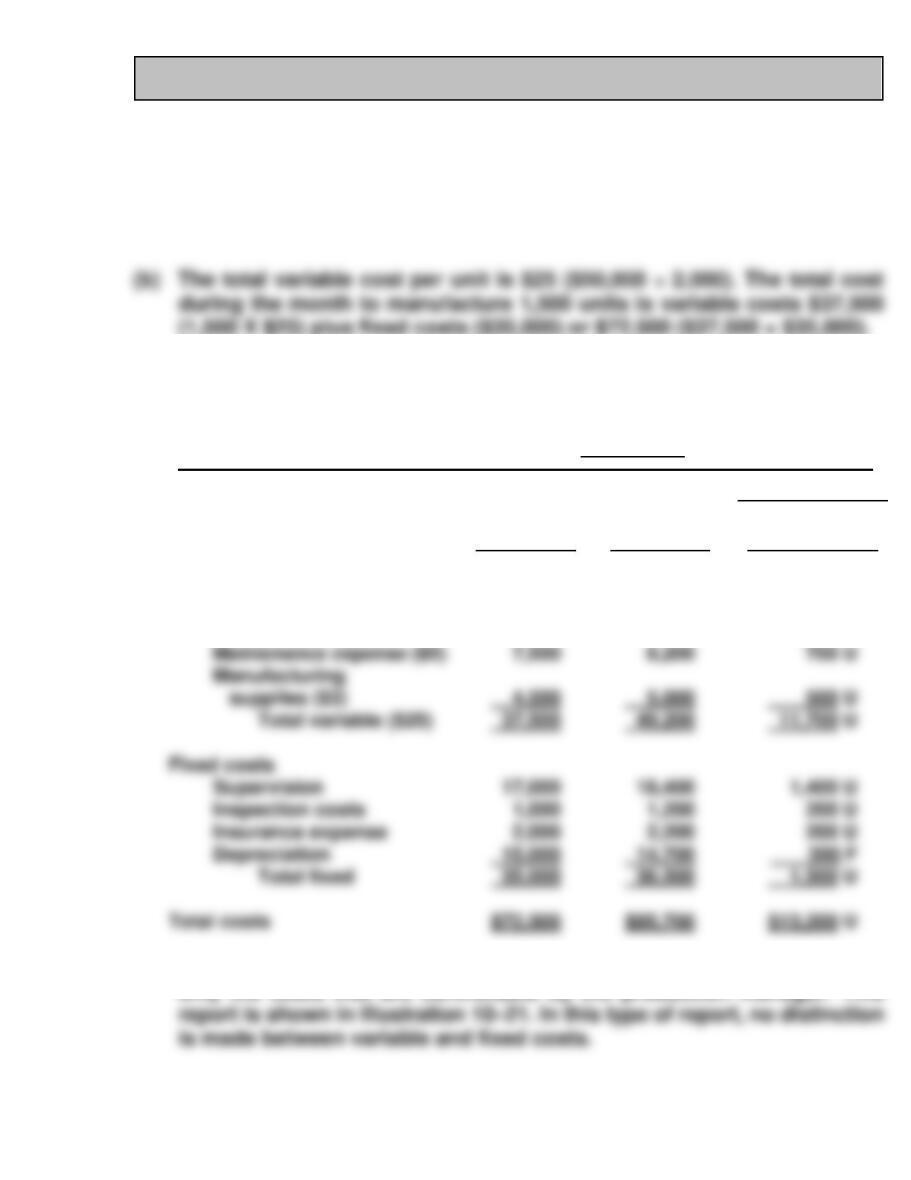
(1,500 X $25) plus fixed costs ($35,000) or $72,500 ($37,500 + $35,000).
(c) FLEMING COMPANY
Production Department
Manufacturing Overhead Flexible Budget Report
For the Month Ended
Difference
Variable costs
Indirect materials ($11)
Indirect labor ($6)
Budget at
1,500 units
$16,500
9,000
Actual at
1,500 units
$22,500
13,500
Favorable F
Unfavorable U
$ 6,000 U
4,500 U
(d) A production department is a cost center. Thus, the report should include
only the costs that are controllable by the production manager. This
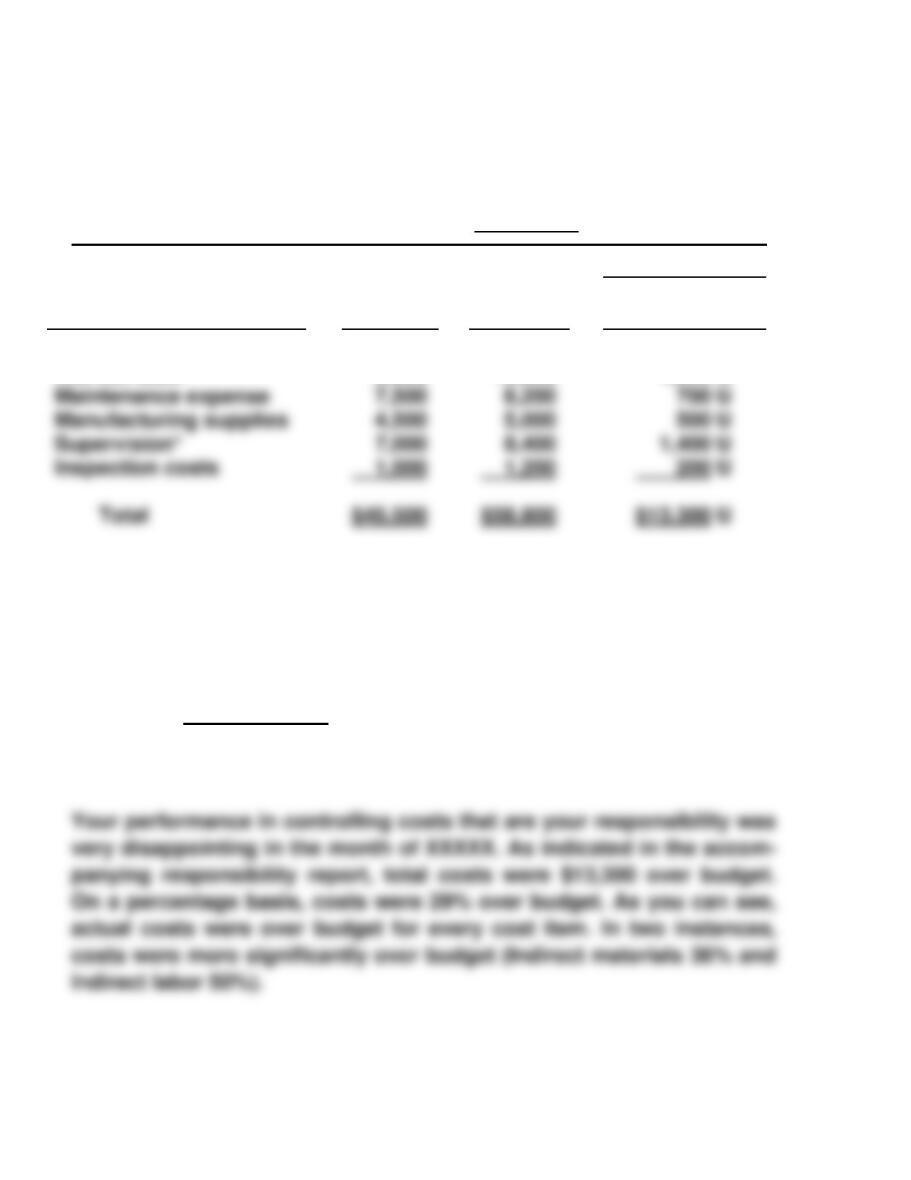
BYP 10-5 (Continued)
FLEMING COMPANY
Production Department
Manufacturing Overhead Responsibility Report
For the Month Ended
Difference
Controllable Cost
Budget
Actual
Favorable F
Unfavorable U
Indirect materials
Indirect labor
$16,500
9,000
$22,500
13,500
$ 6,000 U
4,500 U
*$10,000 is deducted from both budget and actual for Mr. Bedner’s cost.
To: Mr. Fred Bedner, Production Manager
From: , Vice President of Production
Subject: Performance Evaluation for the Month of XXXXX

BYP 10-5 (Continued)
Fred, it is imperative that you get costs under control in your department
as soon as possible.
BYP 10-6 ETHICS CASE
(a) The stakeholders in this ethical situation are:
The employees and managers of each investment center.
The central management and chief executive officer.
The customers who buy the product.
The owners or stockholders.
(b) Pressure to perform is a frequently identified cause for unethical
conduct. Employees are more prone to engage in unethical conduct
(c) The company might maintain open lines of communication with its em-
ployees to better know the pressures of its managers. By “keeping in
touch,” the company may avoid making unreasonable demands on its
managers and employees. The company might also develop a company
BYP 10-7 ALL ABOUT YOU
(a) The basic idea is to set up individual envelopes for different expense
categories. Once you have used up the money in a particular envelope,
you can’t use more. Begin by preparing a monthly budget. Identify
those items that you will pay in cash. These would include things like
groceries, eating out at restaurants, clothing, gasoline, car repairs, gifts,
(b) Answers will vary by student.
BYP 10-8 CONSIDERING YOUR COSTS AND BENEFITS
In general, in past years it has usually been considered prudent to
purchase a home rather than to rent. As noted, over time, home prices have
usually appreciated in most parts of the country. Mortgage interest
provides some tax relief, and by purchasing a home you get some control
over your housing costs. However, recent turbulence in the housing market
has made the decision more complicated. In some parts of the country
home prices have fallen considerably, and there is no indication how soon