10–18
10–19
Formatted: Normal1, Centered, Border: Top: (No border),
Tab stops: Not at 1″
Formatted: Font: 8 pt
o Using actual activity leads to information that can distort pricing decisions.
▪ The problem with theoretical capacity is that, by definition, the company cannot
achieve it. Managers using it as a basis for pricing are in danger of not recovering the
costs.
• Assigning the Cost of Unused Capacity
o A business usually acquires more capacity than it expects to use possibly because the:
▪ Expansion in the future would have been taken care of.
• Seasonal Demand and the Cost of Unused Capacity
o Demand can fluctuate when there are seasonal differences in demand.
▪ For RAC, that means summer months (or weekends) will see peak demand and the
capacity is reserved to serve the summer (or weekend) market. In this case, the best
solution is to assign the cost of unused capacity to summer (or weekend) customers
who will benefit the most from the excess capacity.
10–20
Formatted: Normal1, Centered, Border: Top: (No border),
Tab stops: Not at 1″
LO 10-7 Describe how activities that influence quality affect costs and
profitability.
MANAGING THE COST OF QUALITY
• How Can We Limit Conflict between Traditional Managerial Accounting Systems and Total
Quality Management?
o Total quality management (TQM) systems are developed to support quality initiatives.
Unless the cost accounting systems are also designed to support these initiatives,
companies are likely to find that TQM has little economic benefit.
▪ A separation of cost and quality systems risks sending managers wrong signals about
the value of quality programs.
▪ For the implementation of TQM to be effective, fives changes must be made to the
traditional managerial accounting systems.
• The information should include problem-solving data that come from both
financial and nonfinancial reports.
• The workers (line employees) themselves should collect the information and use
it to get feedback and solve problems.
10–21
Formatted: Normal1, Centered, Border: Top: (No border),
Tab stops: Not at 1″
Formatted: Font: 8 pt
• What Is Quality?
o When designing a cost management system to support quality programs, it is necessary to
know what view of quality the system is designed to support.
▪ External View: Customer Expectations
• Customer expectations impose costs on the firm and these costs have to be
considered in making decisions.
• When products or services are so new or so different, customers may not even
know what to expect.
▪ Internal View: Conformance toTo Specifications
• Conformance to specification is not sufficient. The specifications can be such that
a product that is 100% within specifications finds no buyer at any price.
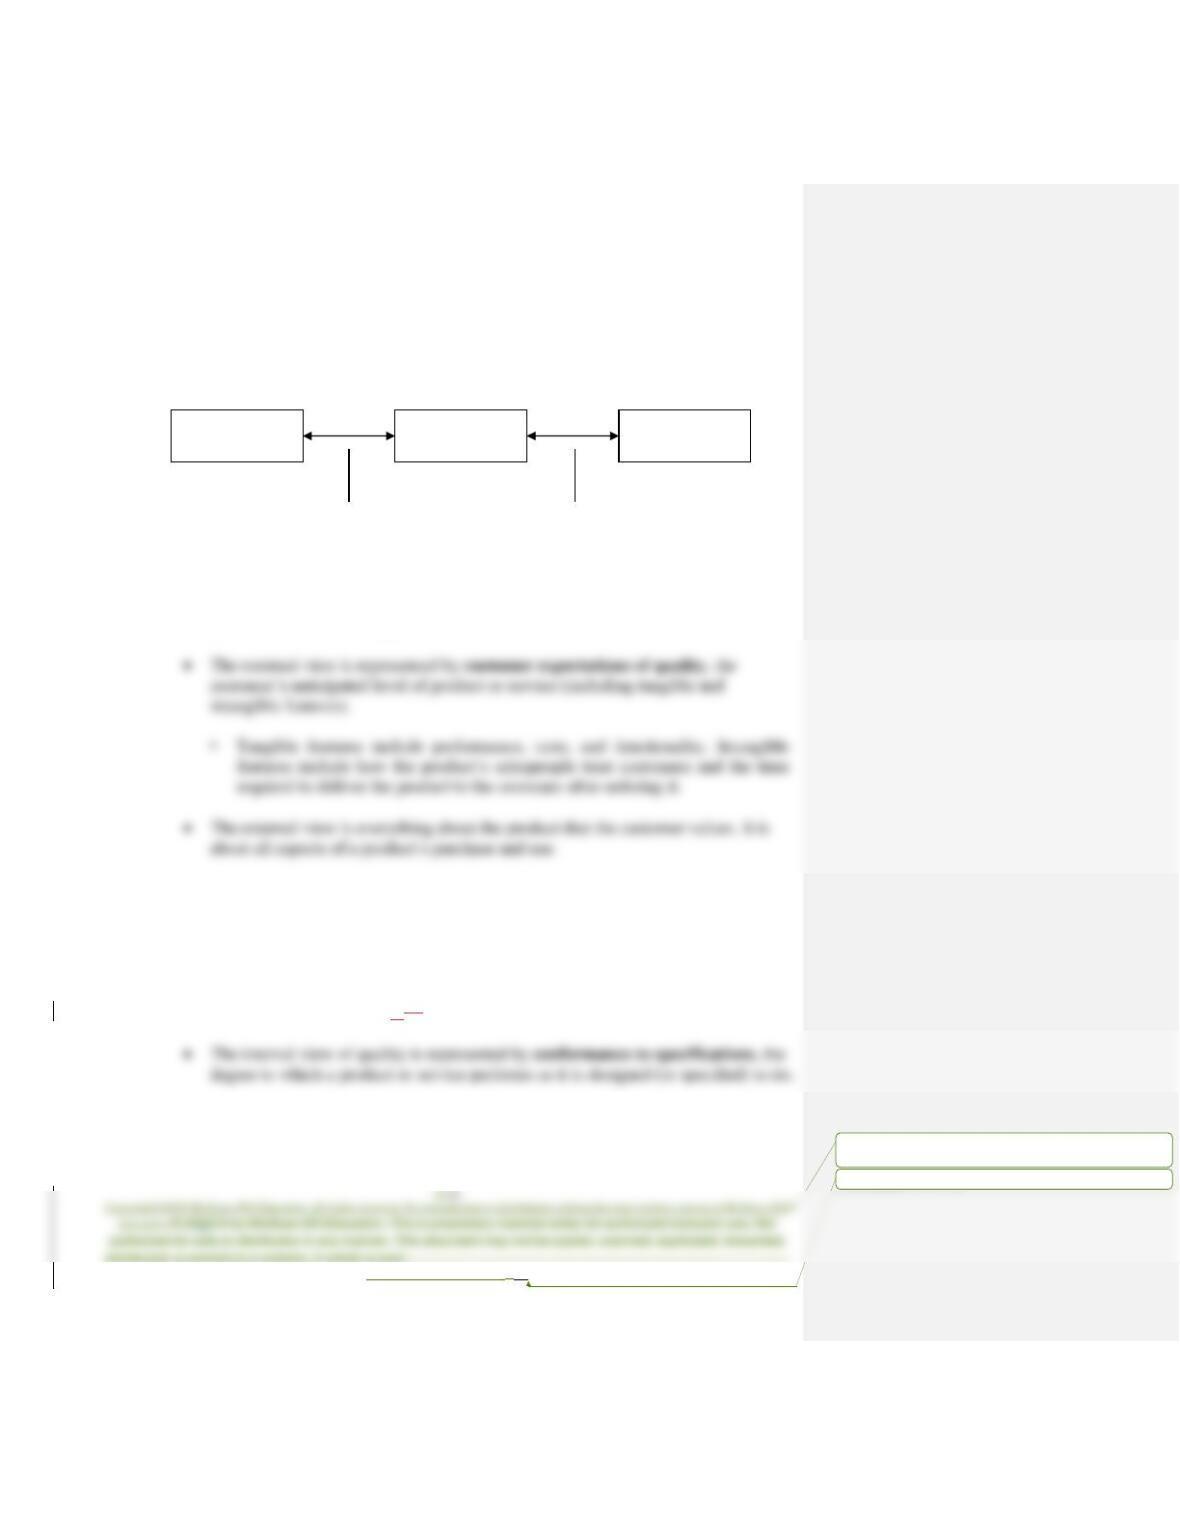
Customer
expectations
Design
specifications
Actual product
performance
External View:
Are customer
expectations met in
designing the product?
Internal View:
Does the product
delivered meet design
specifications?
10–22
Formatted: Normal1, Centered, Border: Top: (No border),
Tab stops: Not at 1″
10–23
Formatted: Normal1, Centered, Border: Top: (No border),
Tab stops: Not at 1″
LO 10-8 Compare the costs of quality control to the costs of failing to control
quality.
• What Is the Cost of Quality?
o Quality is something the customer values and the firm expends resources on to ensure.
▪ The cost of quality system is a system that reflects the tension between incurring
costs to ensure quality and the costs incurred with quality failures.
• It is based on the idea that a tension exists between incurring costs to ensure that
products meet the company’s definition of quality and the cost incurred by not
meeting that definition.
o Conformance Costs
▪ Ensuring that quality conforms to the firm’s requirements involves two costs.
o Nonconformance Costs
▪ Two costs arise from the failure to control quality.
• Internal failure costs are incurred when nonconforming products and services
are detected before being delivered to customers.
• External failure costs are incurred when nonconforming products and services
are detected after being delivered to customers, including warranty repairs,
product liability, marketing costs, and lost sales.
o Exhibit 10.16 summarizes the four main classifications of quality costs.
10–24
Formatted: Normal1, Centered, Border: Top: (No border),
Tab stops: Not at 1″
Formatted: Font: 8 pt
10–25
Formatted: Normal1, Centered, Border: Top: (No border),
Tab stops: Not at 1″
▪ Costs of quality are often expressed as a percentage of sales.
• Exhibit 10.18 shows a sample cost of quality report and how such information can
be used to reduce the overall cost of quality.
▪ The cost of quality report can be a valuable decision-making aid for managers, but it
is only effective if all quality costs are measured and reported.
10–26
Formatted: Normal1, Centered, Border: Top: (No border),
Tab stops: Not at 1″
Formatted: Font: 8 pt
Matching
A.
Activity-based cost management
J.
Normal activity
B.
Actual activity
K.
Practical capacity
C.
Appraisal costs
L.
Prevention costs
Lean manufacturing
_____ 1. Costs incurred when nonconforming products and services are detected after being
delivered to customers.
_____ 2. The expenditures or the amounts spent on the activity.
_____ 6. The customer’s anticipated level of product or service including tangible and
intangible features).
_____ 7. Costs incurred to detect individual units of products that do not conform to
specifications.
_____ 8. The amount of production possible under ideal conditions with no time for
maintenance, breakdowns, or absenteeism.
_____ 9. The long-run expected volume produced.
_____ 10. The amount of production possible assuming only the expected downtime for
scheduled maintenance and normal breaks and vacations.
_____ 11. Costs incurred when nonconforming products and services are detected before being
delivered to customers.
_____ 12. The difference between resources used and resources supplied.
_____ 17. A cost accounting system designed around the value chain of major products and
services to support lean manufacturing. Approach to production that looks to
Formatted: Font: (Default) Times New Roman
10–27
Formatted: Normal1, Centered, Border: Top: (No border),
Tab stops: Not at 1″
Matching Answers
1. FG
2. NO
4. D
6. EF
8. PQ
10. KL
12. QR
14. B
16. RE
18. OP
Multiple Choice
1. Activity-based management:
a. Is an extension of activity-based costing.
b. Requires information about product cost and costs of activities and processes.
c. Distinguishes between value-added and nonvalue-added activities.
d. All of the above.
2. Interest cost associated with a bond issue to support capital expansion is an example of:
3. Customer profitability analysis:
a. Tracks revenues only.
b. Relies on activity-based costing.
c. Looks at customers’ buying patterns closely.
d. Both b and c.
4. The cost of suppliers:
a. Is the price charged.
5. What was the theoretical capacity for the month of May?
a. 15,500 units
b. 15,000 units
c. 13,000 units
d. 10,400 units
Formatted: Normal1, Centered, Border: Top: (No border),
Tab stops: Not at 1″
Formatted: Font: 8 pt
7. Unused capacity:
8. Practical capacity allows for:
a. Unexpected downtime.
b. Scheduled maintenance.
c. Interruptions due to random power failure.
d. Sick leaves.
10. Which of the following is not usually available in the cost of quality report?
a. Prevention costs
b. Cost of lost business
c. Appraisal costs
d. Costs of scrap, rework, and reinspection
12. An activity-based income statement:
a. Is less informative than the traditional income statement.
b. Classifies costs based on cost hierarchies.
c. Shows only resources supplied.
d. Demonstrates that unit-level costs usually have unused resources.
10–31
Multiple Choice Answers
1. d (LO1)
3. d (LO4)
5. a (LO6)
500 units per day × 31 days in May = 15,500 units.
7. d (LO5, LO6)
9. d (LO7)
11. d (LO1)
12. b (LO5)
10–32
Demonstration Problem
Windows of the World (WoW) sells and delivers new windows to construction sites in the
Midwest. Each window is sold for $130. In addition, WoW charges a flat fee of $5 per window
for shipping and handling. Some customers are happy with the arrangement while others are
leaving. The owner of WoW, Jack, decides to take a closer look at the situation and hires a
consultant to do the job. The consultant compiles the data on shipping and handling for the
second quarter and prepares the following table:
Activity
Activity Cost
Cost Driver
Cost Driver Volume
Order entry
$24,000
Number of orders
1,200 orders
Packaging
22,500
Number of windows
15,000 windows
Delivery
30,800
Number of deliveries
1,400 deliveries
General administration
39,000
Order value
$1,950,000
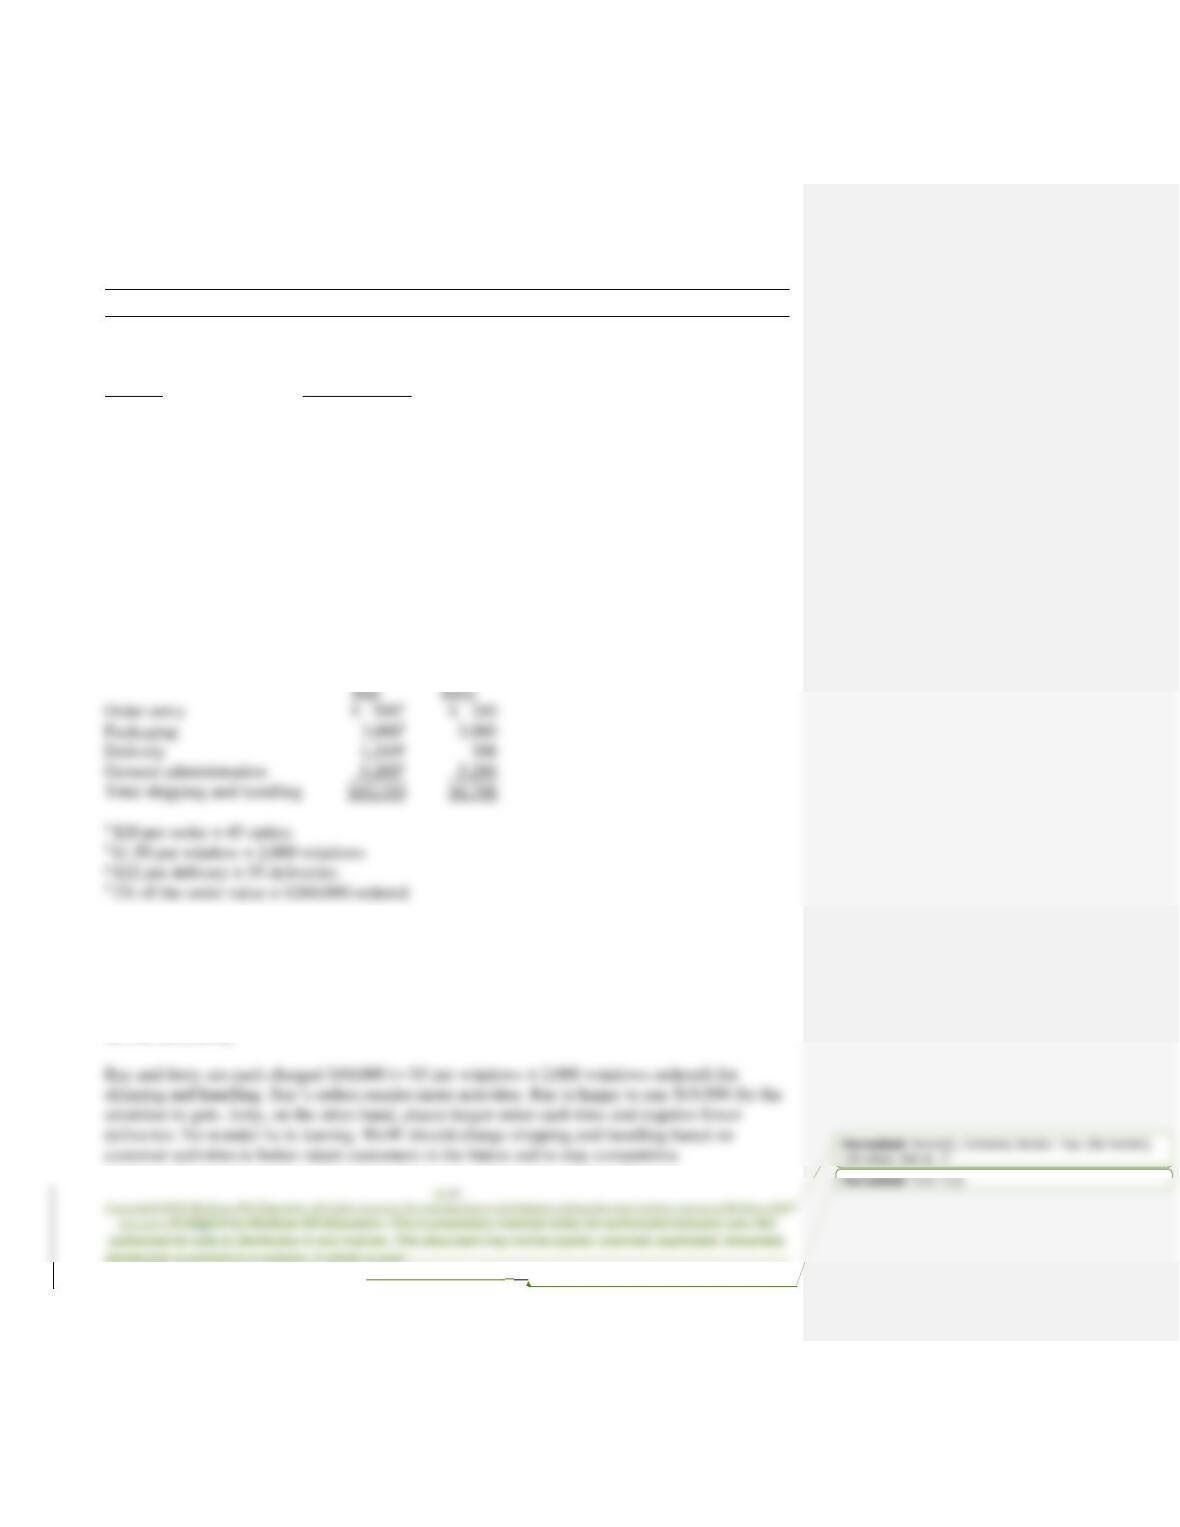
Jack also provides activity data from two representative customers (Ray and Jerry), one stays and
one is leaving.
Number of orders placed
Number of windows ordered
Number of deliveries made
Order value
10–33
Demonstration Problem – Solution
Part 1
Activity
Cost driver rate
Order entry
$20 per ordera
Packaging
$1.50 per windowb
Delivery
$22 per deliveryc
General administration
2% of the order valued
a $24,000 ÷ 1,200 orders
b $22,500 ÷ 15,000 windows
c $30,800 ÷ 1,400 deliveries
d $39,000 ÷ $1,950,000
Part 2
The customer costs for Ray, who stays, and Jerry, who is leaving, are as follows.
Order entry
Packaging
Delivery
General administration
Total shipping and handling
Part 3
Currently WoW charges customers shipping and handling a flat fee of $5 per window. It is a
volume-based measure. However, the activity analysis reveals that the number of orders and the
number of deliveries are also important and that each customer takes advantage of the delivery