
10–1
Chapter 10
Fundamentals of Cost Management
Learning Objectives
1. Describe how activity-based cost management can be used to improve operations.
2. Use the hierarchy of costs to manage costs.
3. Describe how the actions of customers and suppliers affect a firm’s costs.
4. Use activity-based costing methods to assess customer and supplier costs.
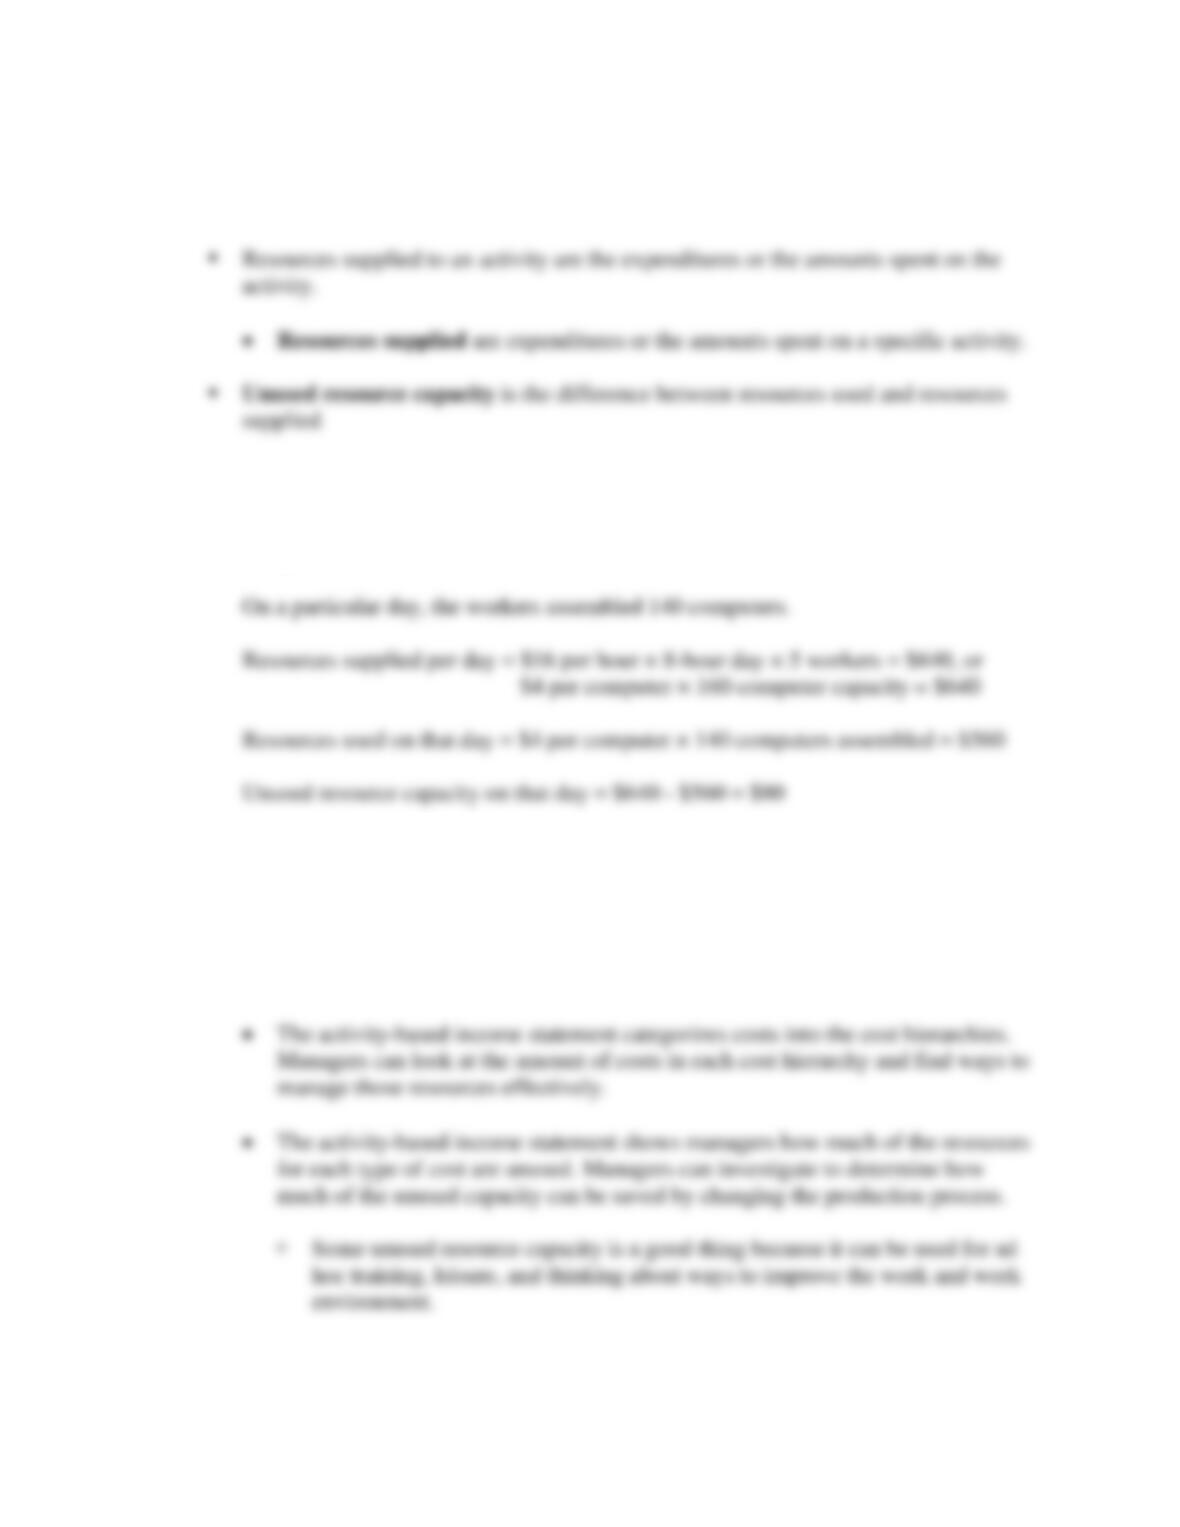
5. Distinguish between resources used and resources supplied.
6. Design cost management systems to assign capacity costs.
7. Describe how activities that influence quality affect costs and profitability.
8. Compare the costs of quality control to the costs of failing to control quality.
Chapter Overview
I. USING ACTIVITY-BASED COST MANAGEMENT TO ADD VALUE
• Using Activity-Based Cost Information to Improve Processes
II. MANAGING THE COST OF CUSTOMERS AND SUPPLIERS
• Using Activity-Based Costing to Determine the Cost of Customers and Suppliers
• Determining Why the Cost of Customers Matter
• Using Cost of Customer Information to Manage Costs
III. DETERMINING THE COST OF SUPPLIERS
• Capturing the Cost Savings
IV. MANAGING THE COST OF CAPACITY
• Using and Supplying Resources
• Computing the Cost of Unused Capacity
• Assigning the Cost of Unused Capacity
• Seasonal Demand and the Cost of Unused Capacity
V. MANAGING THE COST OF QUALITY
• How Can We Limit Conflict between Traditional Managerial Accounting Systems
and Total Quality Management?
• What Is Quality?
o External View: Customer Expectations
o Internal View: Conformance To Specifications
• What Is the Cost of Quality?
10–3
Chapter Outline
LO 10-1 Describe how activity-based cost management can be used to
improve operations.
USING ACTIVITY-BASED COST MANAGEMENT TO ADD VALUE
• Activity-based cost management (ABCM) is an approach that uses activity-based costing
data to evaluate the cost of value-chain activities and to identify opportunities for
improvement.
o First, some key concepts:
▪ Activity-based costing (ABC) is a system used to assign costs to products based on
the products’ use of activities, which are the discrete tasks an organization undertakes
to make or deliver the product.
▪ The value chain is the set of activities that transforms raw resources into products for
customers.
o ABC and ABCM can be used to improve operations:
▪ Better information about product costs helps managers make decisions about pricing
and whether to keep or drop products.
• Using Activity-Based Cost Information to Improve Processes
o The first step in ABCM is activity analysis, which has six steps:
10–4
▪ Develop activity-based costing data for each activity, based on the resources used in
each activity.
▪ Classify all activities as value-added or nonvalue-added.
▪ Continuously improve the efficiency of all value-added activities. Eliminate or reduce
nonvalue-added activities.
• This changing of operational processes to improve performance, often after
examining activity-based costing data to determine opportunities for
improvement, is called process reengineering.
• Generally, the following types of activities are candidates for elimination because,
from the perspective of the customer, they do not add value to the product:
Storing materials items
• Using Activity-Based Cost Management in a Service Setting
o Activity-based cost management applies to many different types of organizations,
including manufacturing, retail, service, nonprofit, and governmental agencies.
o Exhibit 10.1 shows the activity flow in loan application process.
• Lean Manufacturing and Activity-Based Cost Management
o In the business world, you’ll often find activity-based cost management paired with lean
manufacturing.
▪ Lean manufacturing is an approach to production that tries to significantly reduce
production costs using solutions such as just-in-time inventory and production,
elimination of waste, and tighter quality control.
10–5
o What often emerges after firms adopt lean manufacturing is a new approach to cost
accounting, termed lean accounting.
▪ Lean accounting is a cost accounting system designed around the value chain of
major products and services to support lean manufacturing. It can also refer to
applying lean production methods to accounting work itself.
o Traditional manufacturing firms often group similar operations together.
▪ This approach often results in large work-in-process inventories. Why? Because the
company wants to keep these activities going full speed.
o Lean manufacturers organize differently.
LO 10-2 Use the hierarchy of costs to manage costs.
• Using Cost Hierarchies
o Managers can establish a hierarchy of costs to manage them effectively.
▪ Allocating all costs to units can be misleading if some costs do not vary with the
volume of units.
10–6
▪ A management decision that affects units alone requires the analysis of volume-
related activities.
LO 10-3 Describe how the actions of customers and suppliers affect a firm’s
costs.
MANAGING THE COST OF CUSTOMERS AND SUPPLIERS
• The advantage of an activity-based costing system is that it reflects the diverse uses of
resources in the product costs so managers can make better decisions about the products.
o For some firms, however, decisions are not about the products or services but about
customers.
o One advantage of an activity-based costing system is that it reflects the diverse uses of
resources in the product costs so managers can make better decisions about the products.
▪ Management’s decisions about customers, such as the choice of TV programming to
spend its advertising budget and to attract one audience over the other, will also affect
firm costs and the resulting profits associated with different groups of customers.
LO 10-4 Use activity-based costing methods to assess customer and supplier
costs.
• Using Activity-Based Costing to Determine the Cost of Customers and Suppliers
o The concepts of activity-based costing can be applied to the question of customer costing
(and therefore customer profitability) easily.
10–7
▪ Step 1: Identify activities (Entering the order, Picking the order, Delivering the order,
and Supervising and administering delivery).
• Exhibit 10.2 shows some summary operating data based on the planning for next
year.
▪ Step 2: Select cost drivers for each of the activities (Number of orders entered,
Number of items picked, Number of deliveries made, and Order value, respectively).
▪ Step 3: Compute the cost driver rates (= Activity cost in a cost pool ÷ Cost driver
volume)
• Exhibit 10.4 shows the computation for cost driver rates for each of the four
activities.
Activity costs for each activity ÷ Cost driver volume = Cost driver rate
▪ Step 4: Assign the delivery cost to individual customers using cost driver rates and
their consumption of activity volumes.
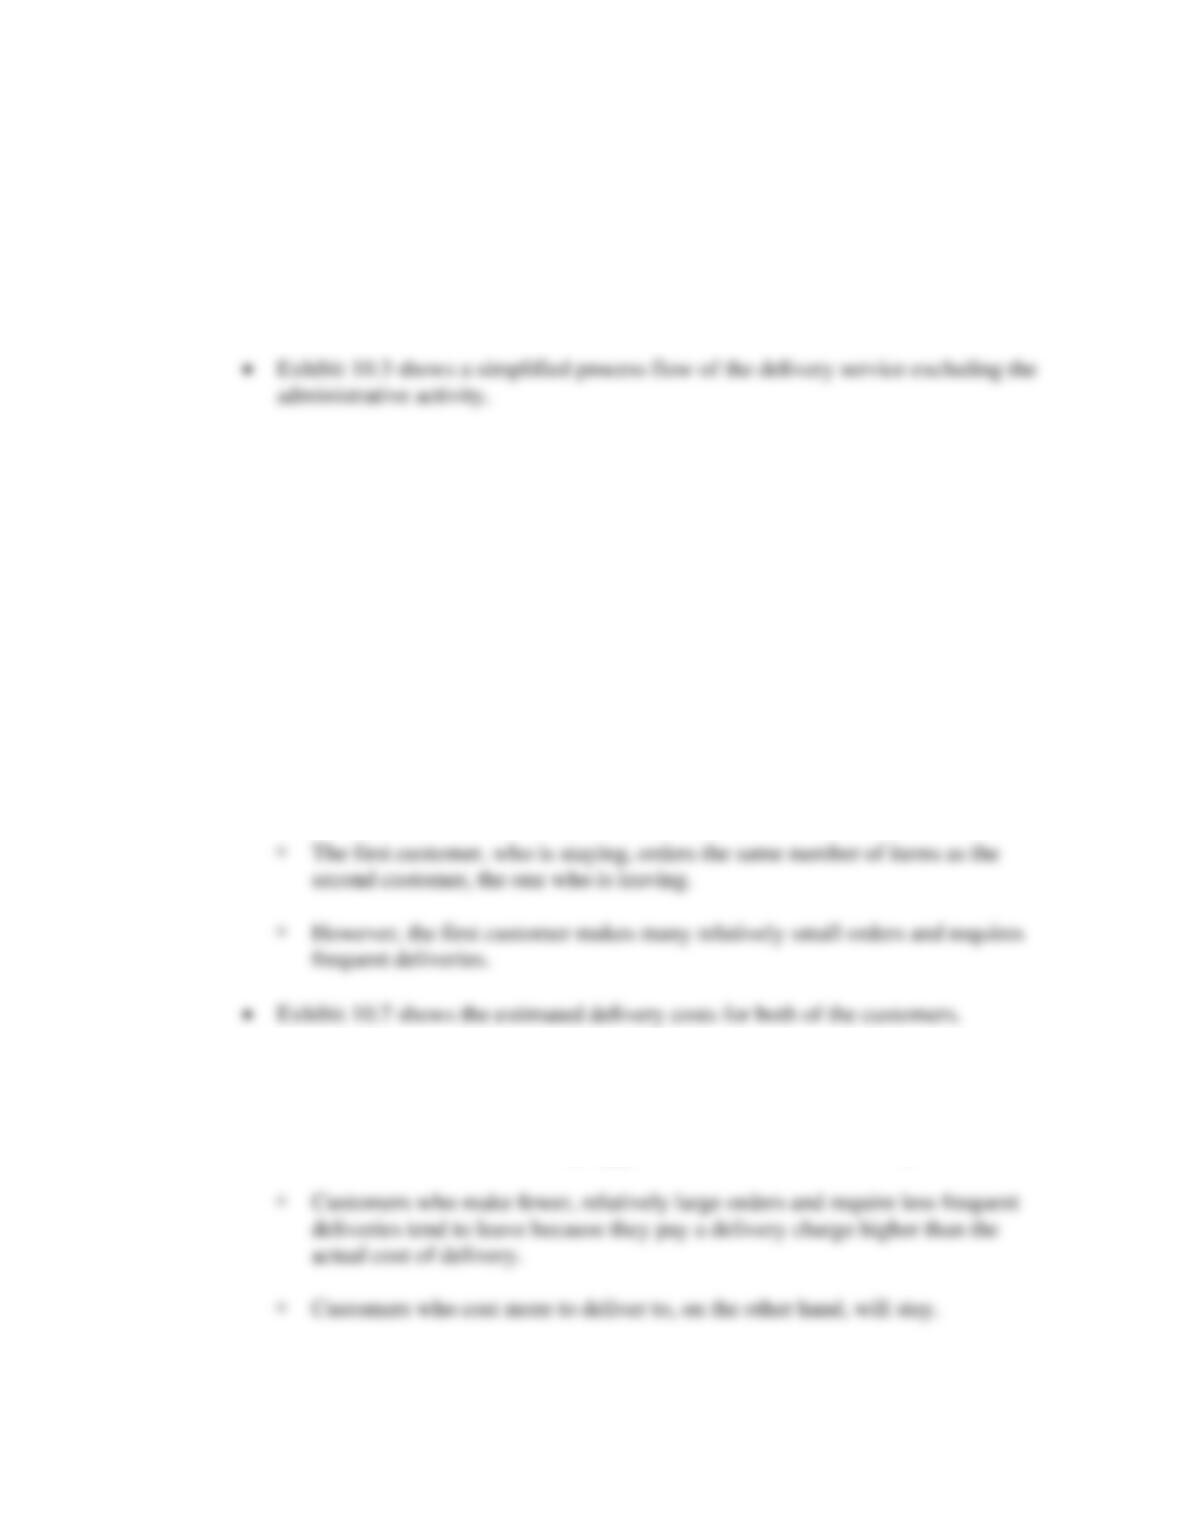
• Exhibit 10.5 shows the cost driver information for two sample customers.
• Exhibit 10.6 for the cost flow diagram for the customer cost analysis.
▪ Red used to charge customers for the delivery services based on a fixed percentage of
the order values.
• The link between customers’ buying patterns and the cost of delivery was lost.
10–8
• From the cost driver information, it turns out that the order patterns, not the order
values, drive most of the cost of delivery. Red can use the information from the
cost of customer system to manage costs better.
• Determining Why the Cost of Customers Matter
o In addition, delivery services can be priced according to the cost driver rates that reflect
the consumption of delivery activities. Customers can determine the tradeoff between
delivery costs and inventory costs.
See Demonstration Problem
DETERMINING THE COST OF SUPPLIERS
• The analysis of customer cost can be applied to suppliers.
o Firms usually evaluate suppliers based on the price alone, ignoring other services
provided as well.
10–9
▪ When information such as the estimated total cost of late delivery, the estimated units
of late delivery, and the probability of late delivery (based on past performance)
becomes available, the expected unit cost of late delivery can be added to the unit
price charged (or bid) by the supplier to arrive at the effective purchase price for each
supplier.
• Additional cost of late delivery per unit =
Estimated total cost of late deliveries
Estimated units of late deliveries
• Capturing the Cost Savings
LO10-5 Distinguish between resources used and resources supplied.
MANAGING THE COST OF CAPACITY
• Using and Supplying Resources
o In some situations, costs go up and down proportionately with the cost driver. In others,
when workers are paid by the hour, there may be a difference between the piecework rate
and the cost driver rate.
10–10
o n general, activity-based costing estimates the cost of resources used. That is,
▪ Resources used = Cost driver rate × Cost driver volume.
▪ Example: A computer manufacturer employs five workers. Each of the employees
works 8-hour days at $16 per hour and has the ability to assemble four computers per
hour, or a total of 32 computers per day. The cost driver rate is assumed to be $4 per
computer.
o Since the traditional income statement only shows resources supplied, a more informative
report for managing capacity costs will include the following in an activity-based income
statement.
▪ Exhibit 10.10 shows a traditional income statement. A more informative report for
managing capacity costs is shown in Exhibit 10.11.
10–11
Some costs have more unused resources than others. Unit-related costs often
show little or no unused resources. Capacity-related costs usually have unused
resources unless the company is operating at full capacity.
LO 10-6 Design cost management systems to assign capacity costs.
• Computing the Cost of Unused Capacity
o The importance of managing capacity costs increases with the relative proportion of these
costs in an organization’s cost structure.
o Allocation of fixed operating costs (supervision, depreciation, maintenance, and so on) to
products depends on how the allocation base (the denominator number in terms of
“capacity”) is defined.
o The discussion in the text features Northern Air Charters (NAC), which operates a fleet
of small aircraft that flies tourists into remote regions for hunting, fishing, and
backpacking trips.
▪ Exhibit 10.12 shows the fixed operating costs rates for three years (including one in
which business is down and one in which business is booming).
▪ If capacity is chosen as the allocation base, the manager needs to decide how to
measure it. There are four different definitions of capacity as the allocation base:
• Theoretical capacity, which is the amount of production possible under ideal
conditions with no time for maintenance, breakdowns, or absenteeism.
10–12
o Using actual activity leads to information that can distort pricing decisions.
• Assigning the Cost of Unused Capacity
o A business usually acquires more capacity than it expects to use possibly because the:
▪ Expansion in the future would have been taken care of.
• Seasonal Demand and the Cost of Unused Capacity
o Demand can fluctuate when there are seasonal differences in demand.
▪ For RAC, that means summer months (or weekends) will see peak demand and the
10–13
LO 10-7 Describe how activities that influence quality affect costs and
profitability.
MANAGING THE COST OF QUALITY
• How Can We Limit Conflict between Traditional Managerial Accounting Systems and Total
Quality Management?
o Total quality management (TQM) systems are developed to support quality initiatives.
Unless the cost accounting systems are also designed to support these initiatives,
companies are likely to find that TQM has little economic benefit.
▪ A separation of cost and quality systems risks sending managers wrong signals about
the value of quality programs.
▪ For the implementation of TQM to be effective, fives changes must be made to the
traditional managerial accounting systems.
• The information should include problem-solving data that come from both
financial and nonfinancial reports.
10–14
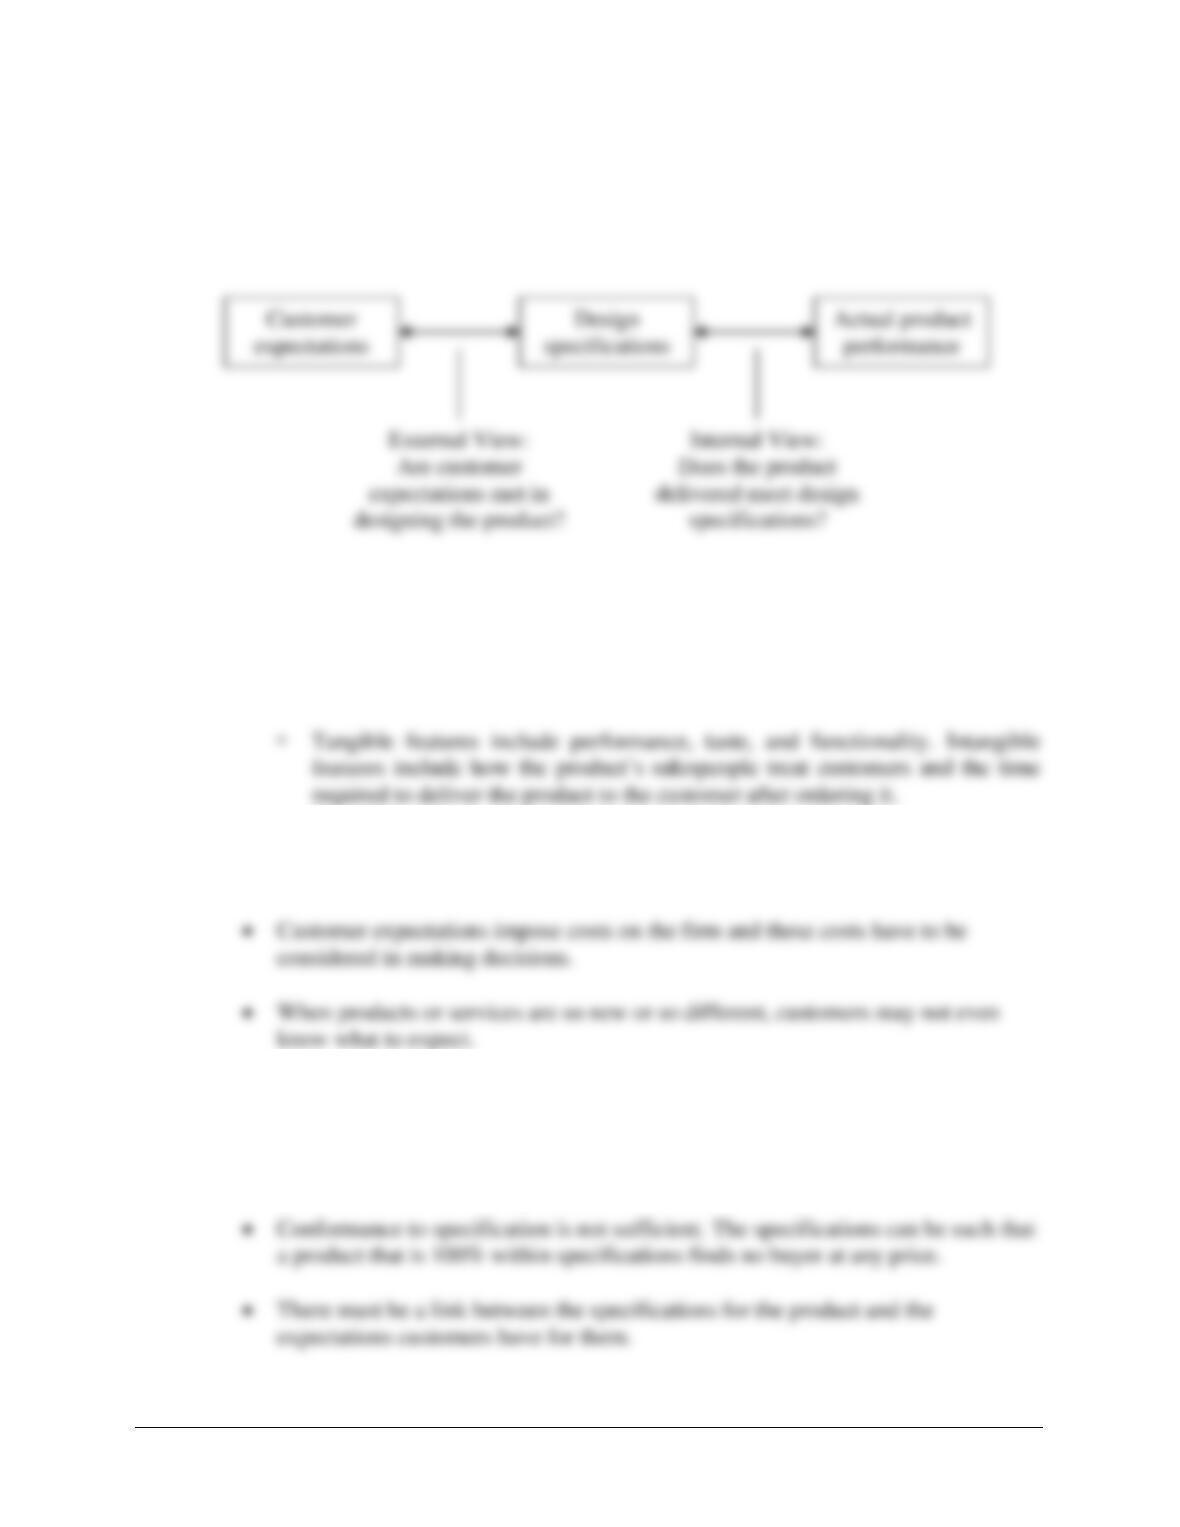
• What Is Quality?
o When designing a cost management system to support quality programs, it is necessary to
know what view of quality the system is designed to support.
▪ External View: Customer Expectations
• The external view is represented by customer expectations of quality, the
customer’s anticipated level of product or service (including tangible and
intangible features).
• The external view is everything about the product that the customer values. It is
about all aspects of a product’s purchase and use.
▪ Internal View: Conformance To Specifications
• The internal view of quality is represented by conformance to specifications, the
degree to which a product or service performs as it is designed (or specified) to do.
10–15
LO 10-8 Compare the costs of quality control to the costs of failing to control
quality.
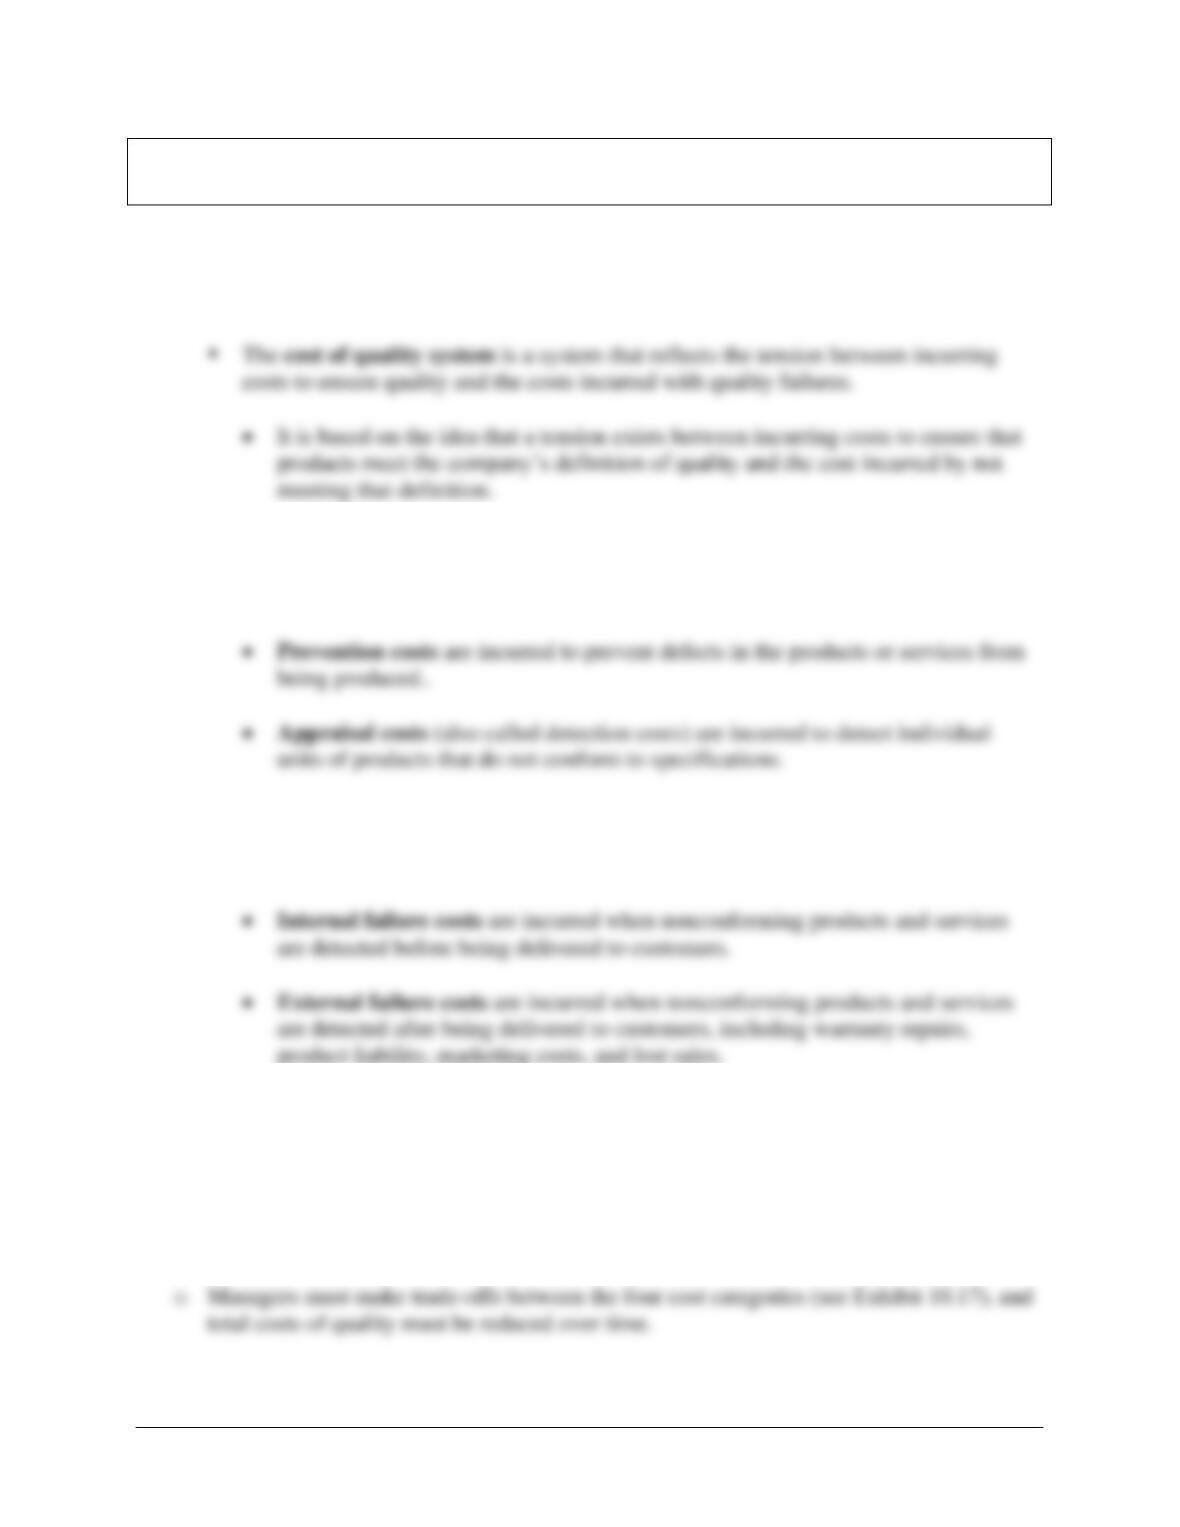
• What Is the Cost of Quality?
o Quality is something the customer values and the firm expends resources on to ensure.
o Conformance Costs
▪ Ensuring that quality conforms to the firm’s requirements involves two costs.
o Nonconformance Costs
▪ Two costs arise from the failure to control quality.
o Exhibit 10.16 summarizes the four main classifications of quality costs.
• Trade-Offs, Quality Control and Failure Costs
o The ultimate goal in implementing a quality improvement program is to achieve zero
defects while incurring minimal costs of quality.
10–16
▪ Costs of quality are often expressed as a percentage of sales.
• Exhibit 10.18 shows a sample cost of quality report and how such information can
be used to reduce the overall cost of quality.
▪ The cost of quality report can be a valuable decision-making aid for managers, but it
is only effective if all quality costs are measured and reported.
Matching
A.
Activity-based cost management
J.
Normal activity
B.
Actual activity
K.
Practical capacity
C.
Appraisal costs
L.
Prevention costs
D.
Conformance to specifications
M.
Process reengineering
E.
Customer expectations of quality
N.
Resources supplied
F.
External failure costs
O.
Resources used
G.
Internal failure costs
P.
Theoretical capacity
H.
Lean accounting
Q.
Unused resource capacity
I.
Lean manufacturing
_____ 1. Costs incurred when nonconforming products and services are detected after being
delivered to customers.
_____ 2. The expenditures or the amounts spent on the activity.
_____ 3. Approach that uses activity-based costing data to evaluate the cost of value-chain
activities and to identify opportunities for improvement.
_____ 4. The degree to which a product or service meets expectations.
_____ 5. Costs incurred to prevent defects in the products or services from being produced.
_____ 6. The customer’s anticipated level of product or service including tangible and
intangible features).
_____ 7. Costs incurred to detect individual units of products that do not conform to
specifications.
_____ 8. The amount of production possible under ideal conditions with no time for
maintenance, breakdowns, or absenteeism.
_____ 9. The long-run expected volume produced.
_____ 10. The amount of production possible assuming only the expected downtime for
scheduled maintenance and normal breaks and vacations.
_____ 11. Costs incurred when nonconforming products and services are detected before being
delivered to customers.
_____ 12. The difference between resources used and resources supplied.
_____ 13. Approach to production that looks to significantly reduce production costs using
solutions such as just-in–time inventory and production, elimination of waste, and
tighter quality control.
_____ 14. Actual volume for the period.
_____ 15. Changing operational processes to improve performance, often after examining
activity-based costing data to determine opportunities for improvement.
_____ 16. A system that reflects the tension between incurring costs to ensure quality and the
costs incurred with quality failures.
_____ 17. Approach to production that looks to significantly reduce production costs using
solutions such as just-in–time inventory and production, elimination of waste, and
tighter quality control.
_____ 18. Cost driver rate multiplied by the cost driver volume
10–18
Matching Answers
1. G
Multiple Choice
1. Activity-based management:
a. Is an extension of activity-based costing.
b. Requires information about product cost and costs of activities and processes.
c. Distinguishes between value-added and nonvalue-added activities.
d. All of the above.
2. Interest cost associated with a bond issue to support capital expansion is an example of:
a. Unit-level costs.
b. Batch-level costs.
c. Product-sustaining costs.
d. Facility-sustaining costs.
3. Customer profitability analysis:
a. Tracks revenues only.
b. Relies on activity-based costing.
c. Looks at customers’ buying patterns closely.
d. Both b and c.
4. The cost of suppliers:
a. Is the price charged.
b. Takes into account on-time deliveries and quality.
c. Is closely related to the effective price of buying.
d. Both b and c.
Use the following information to answer questions 5 and 6:
An appliance manufacturer can produce 500 washers per day at full capacity. Scheduled
maintenance, downtime, and breaks reduce capacity to 400 washers per day. In May, the
manufacturer only operated 26 days.
5. What was the theoretical capacity for the month of May?
a. 15,500 units
b. 15,000 units
c. 13,000 units
d. 10,400 units
6. What was the practical capacity for the month of May?
a. 15,500 units
b. 15,000 units
c. 13,000 units
d. 10,400 units

10–20
7. Unused capacity:
a. May be used against unexpected demand fluctuations.
b. May be reserved for future expansion.
c. Should be allocated based on theoretical capacity.
d. Both a and b.
8. Practical capacity allows for:
a. Unexpected downtime.
b. Scheduled maintenance.
c. Interruptions due to random power failure.
d. Sick leaves.
9. Which of the following statements is correct?
a. Customer expectations represent the external view of quality.
b. Conformance to specifications represents the internal view of quality.
c. There must be a link between both the internal and the external views of quality to be
successful.
d. All of the above.
10. Which of the following is not usually available in the cost of quality report?
a. Prevention costs
b. Cost of lost business
c. Appraisal costs
d. Costs of scrap, rework, and reinspection
11. What are the steps of activity analysis?
a. Identify the process objectives as defined by customers.
b. Chart the activities used to complete the product.
c. Continuously improve the efficiency of all value-added activities..
d. All of the above.
12. An activity-based income statement:
a. Is less informative than the traditional income statement.
b. Classifies costs based on cost hierarchies.
c. Shows only resources supplied.
d. Demonstrates that unit-level costs usually have unused resources.
10–21
Multiple Choice Answers
1. d (LO1)

10–22
Demonstration Problem
Windows of the World (WoW) sells and delivers new windows to construction sites in the
Midwest. Each window is sold for $130. In addition, WoW charges a flat fee of $5 per window
for shipping and handling. Some customers are happy with the arrangement while others are
leaving. The owner of WoW, Jack, decides to take a closer look at the situation and hires a
consultant to do the job. The consultant compiles the data on shipping and handling for the
second quarter and prepares the following table:
Activity
Activity Cost
Cost Driver
Cost Driver Volume
Order entry
$24,000
Number of orders
1,200 orders
Packaging
22,500
Number of windows
15,000 windows
Delivery
30,800
Number of deliveries
1,400 deliveries
General administration
39,000
Order value
$1,950,000
Jack also provides activity data from two representative customers (Ray and Jerry), one stays and
one is leaving.
Ray
Jerry
Number of orders placed
45
14
Number of windows ordered
2,000
2,000
Number of deliveries made
55
14
Order value
$260,000
$260,000
Required:
1. Determine the cost driver rates associated with shipping and handling activities.
2. Determine customer cost for Ray and Jerry.
3. Recommend changes to WoW’s shipping and handling pricing policy.
10–23
Demonstration Problem – Solution
Part 1
Activity
Cost driver rate
Order entry
Packaging
Delivery
General administration
Total shipping and handling
Part 2
The customer costs for Ray, who stays, and Jerry, who is leaving, are as follows.
Part 3
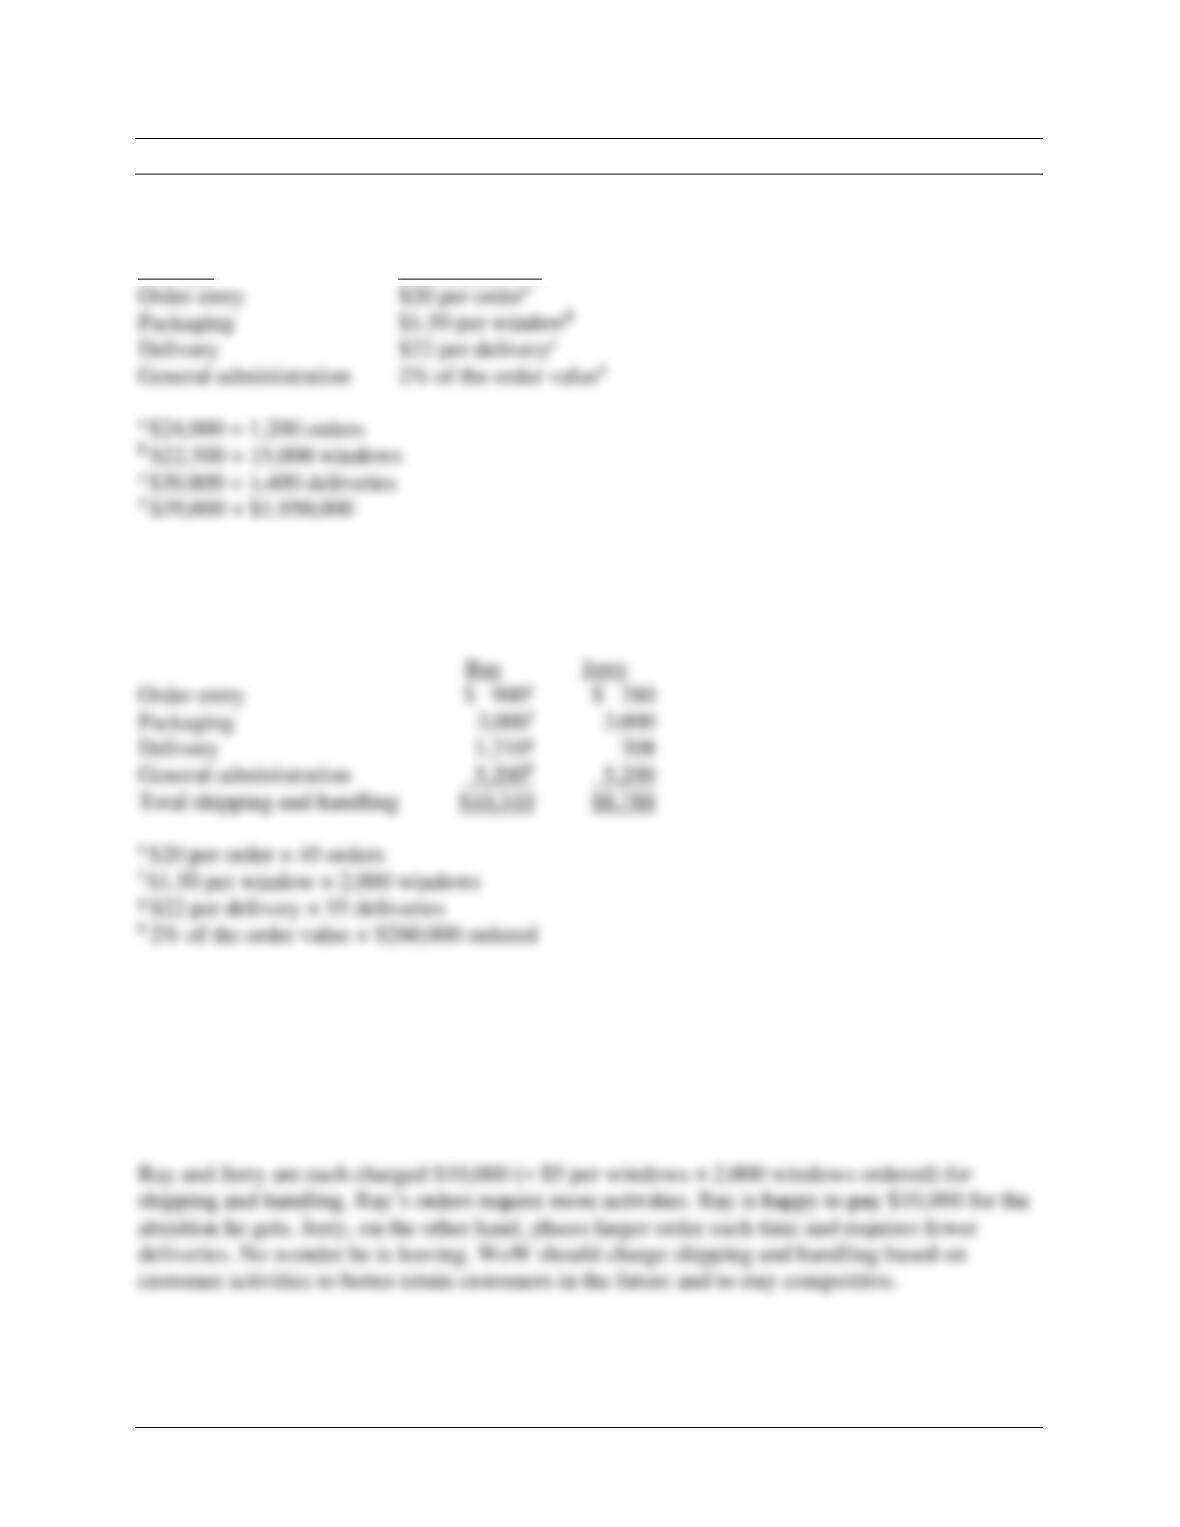
Currently WoW charges customers shipping and handling a flat fee of $5 per window. It is a
volume-based measure. However, the activity analysis reveals that the number of orders and the
number of deliveries are also important and that each customer takes advantage of the delivery
service differently.
Order entry
Packaging
Delivery
General administration