CHAPTER 24 (FIN MAN); CHAPTER 10 (MAN) Evaluating Decentralized Operations
Prob. 24–3A (FIN MAN); Prob. 10–3A (MAN) (Concluded)
3. Per dollar of invested assets, the Snack Cake Division is the most profitable of the
three divisions. Assuming that the returns on investment do not change in the
future, an expansion of the Snack Cake Division will return 12.0 cents (12.0%) on
CHAPTER 24 (FIN MAN); CHAPTER 10 (MAN) Evaluating Decentralized Operations
Prob. 24–4A (FIN MAN); Prob. 10–4A (MAN)
1.
Return on Investment = Profit Margin× Investment Turnover
Operating Income Sales
Return on Investment = ×
Sales Invested Assets
Commercial Division:
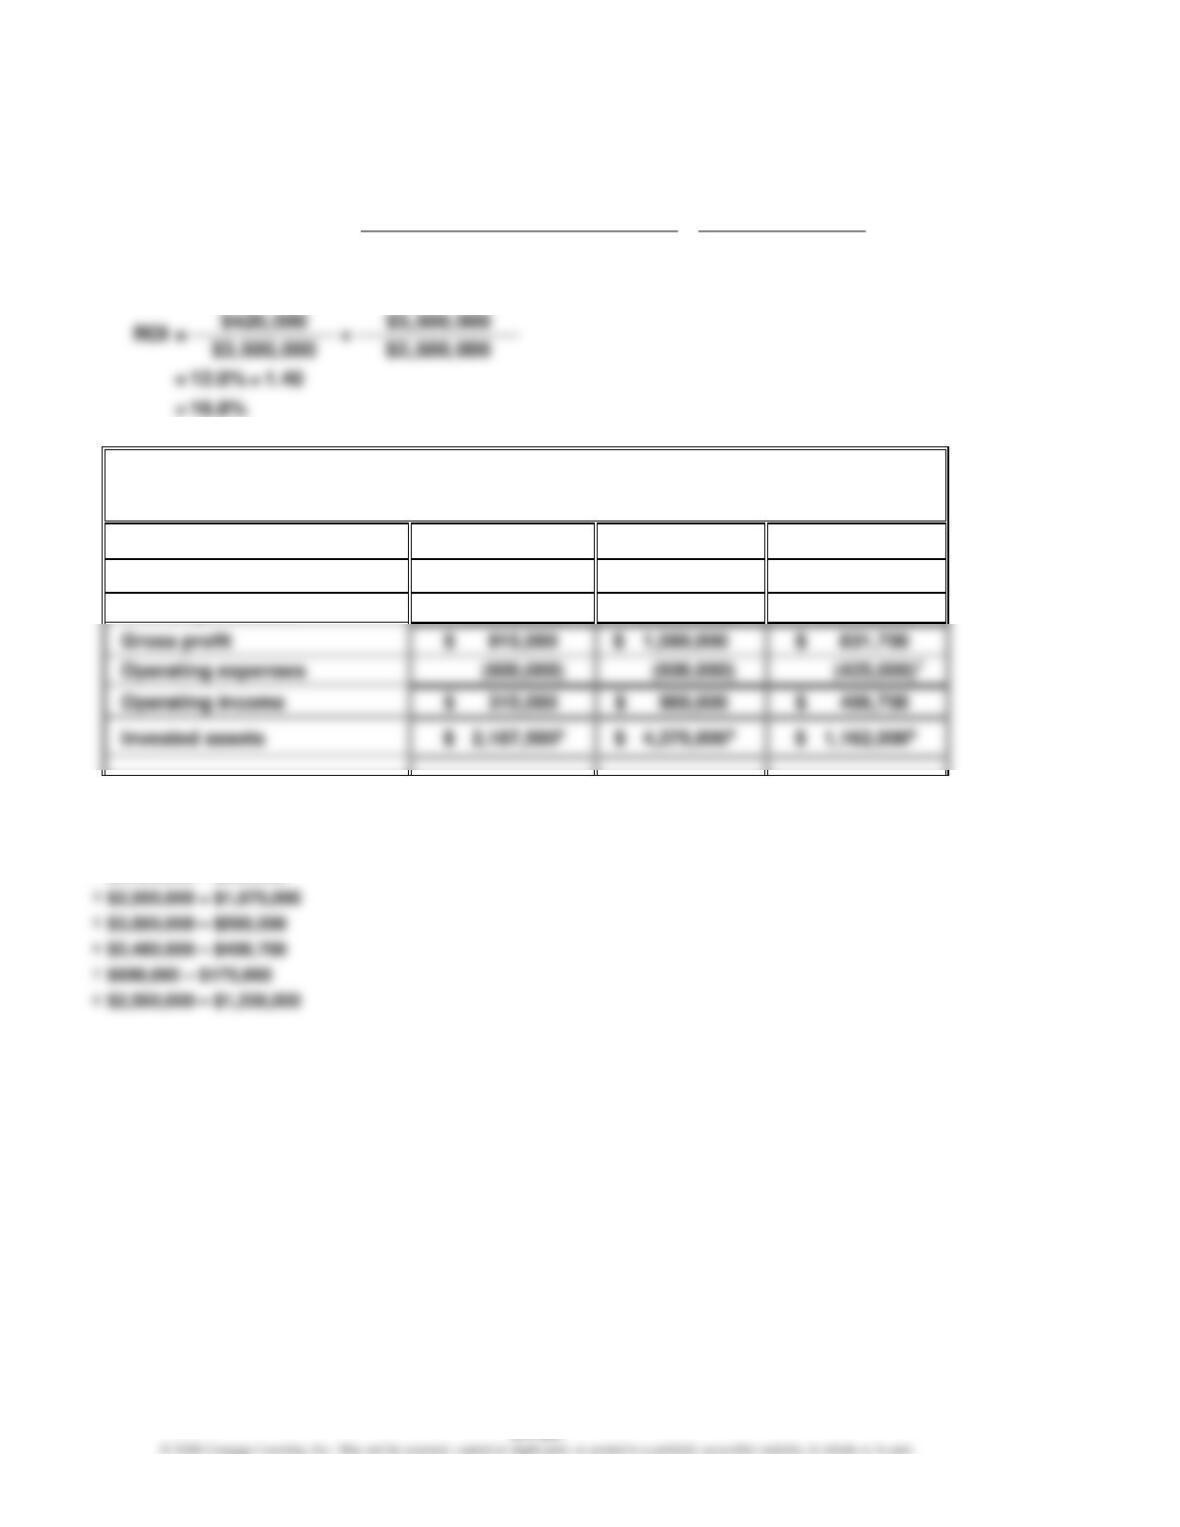
2.
Maxell Manufacturing Inc.—Commercial Division
Estimated Income Statements
For the Year Ended December 31, 20Y9
Proposal 1
Proposal 2
Proposal 3
Sales
$ 3,500,000
$ 3,500,000
$ 2,905,0005
Cost of goods sold
(2,585,000)1
(1,920,000)3
(2,073,300)6
Operating expenses
(600,000)
1
$2,480,000 + $105,000
2
$2,500,000 – $312,500
3
$2,480,000 – $560,000
4
$2,500,000 + $1,875,000
5
$3,500,000 – $595,000
6
$2,480,000 – $406,700
7
8
$2,500,000 – $1,338,000
CHAPTER 24 (FIN MAN); CHAPTER 10 (MAN) Evaluating Decentralized Operations
Prob. 24–4A (FIN MAN); Prob. 10–4A (MAN) (Concluded)
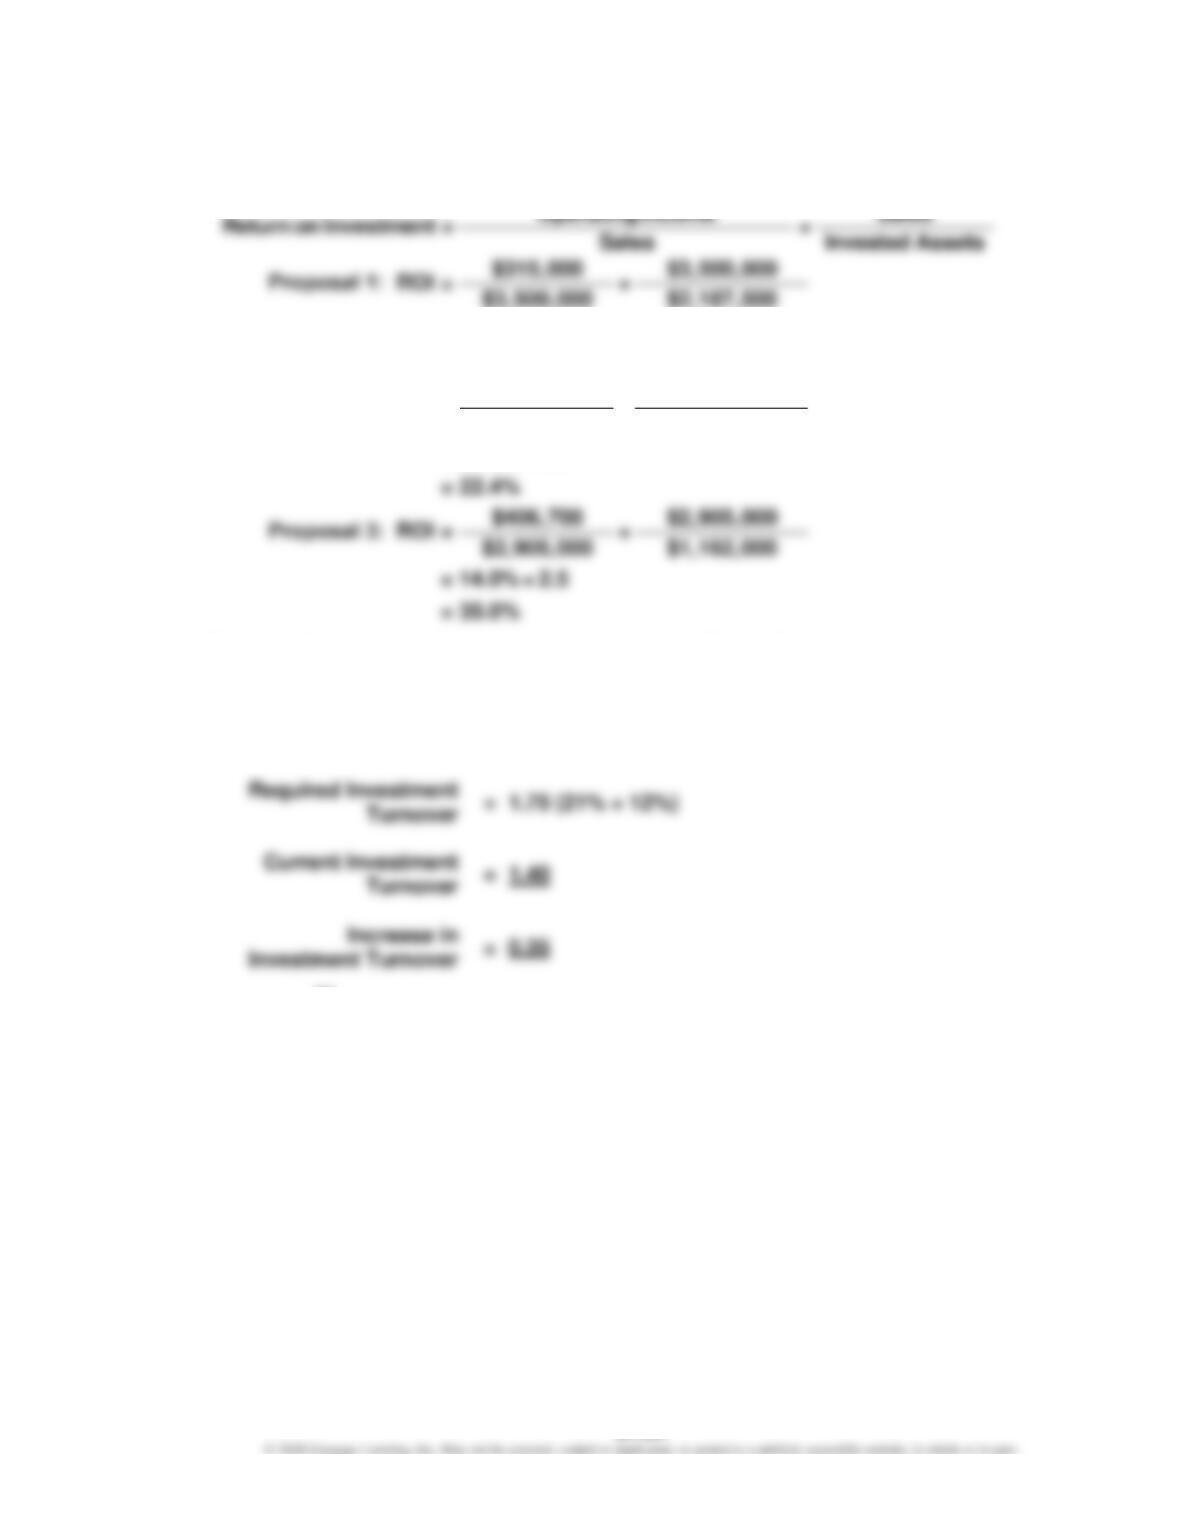
3. Return on Investment = Profit Margin × Investment Turnover
= 9.0% × 1.6
= 14.4%
Proposal 2:
$980,000 $3,500,000
ROI = ×
$3,500,000 $4,375,000
= 28.0% × 0.8
4. Proposal 3 would yield a return on investment of 35.0%. Proposal 2 would yield a return
on investment of 22.4%.
5.
Return on Investment
=
Profit Margin × Investment Turnover
21%
=
12% × Required Investment Turnover
or
25.0% Increase (0.35 ÷ 1.40)
CHAPTER 24 (FIN MAN); CHAPTER 10 (MAN) Evaluating Decentralized Operations
Prob. 24–5A (FIN MAN); Prob. 10–5A (MAN)
1.
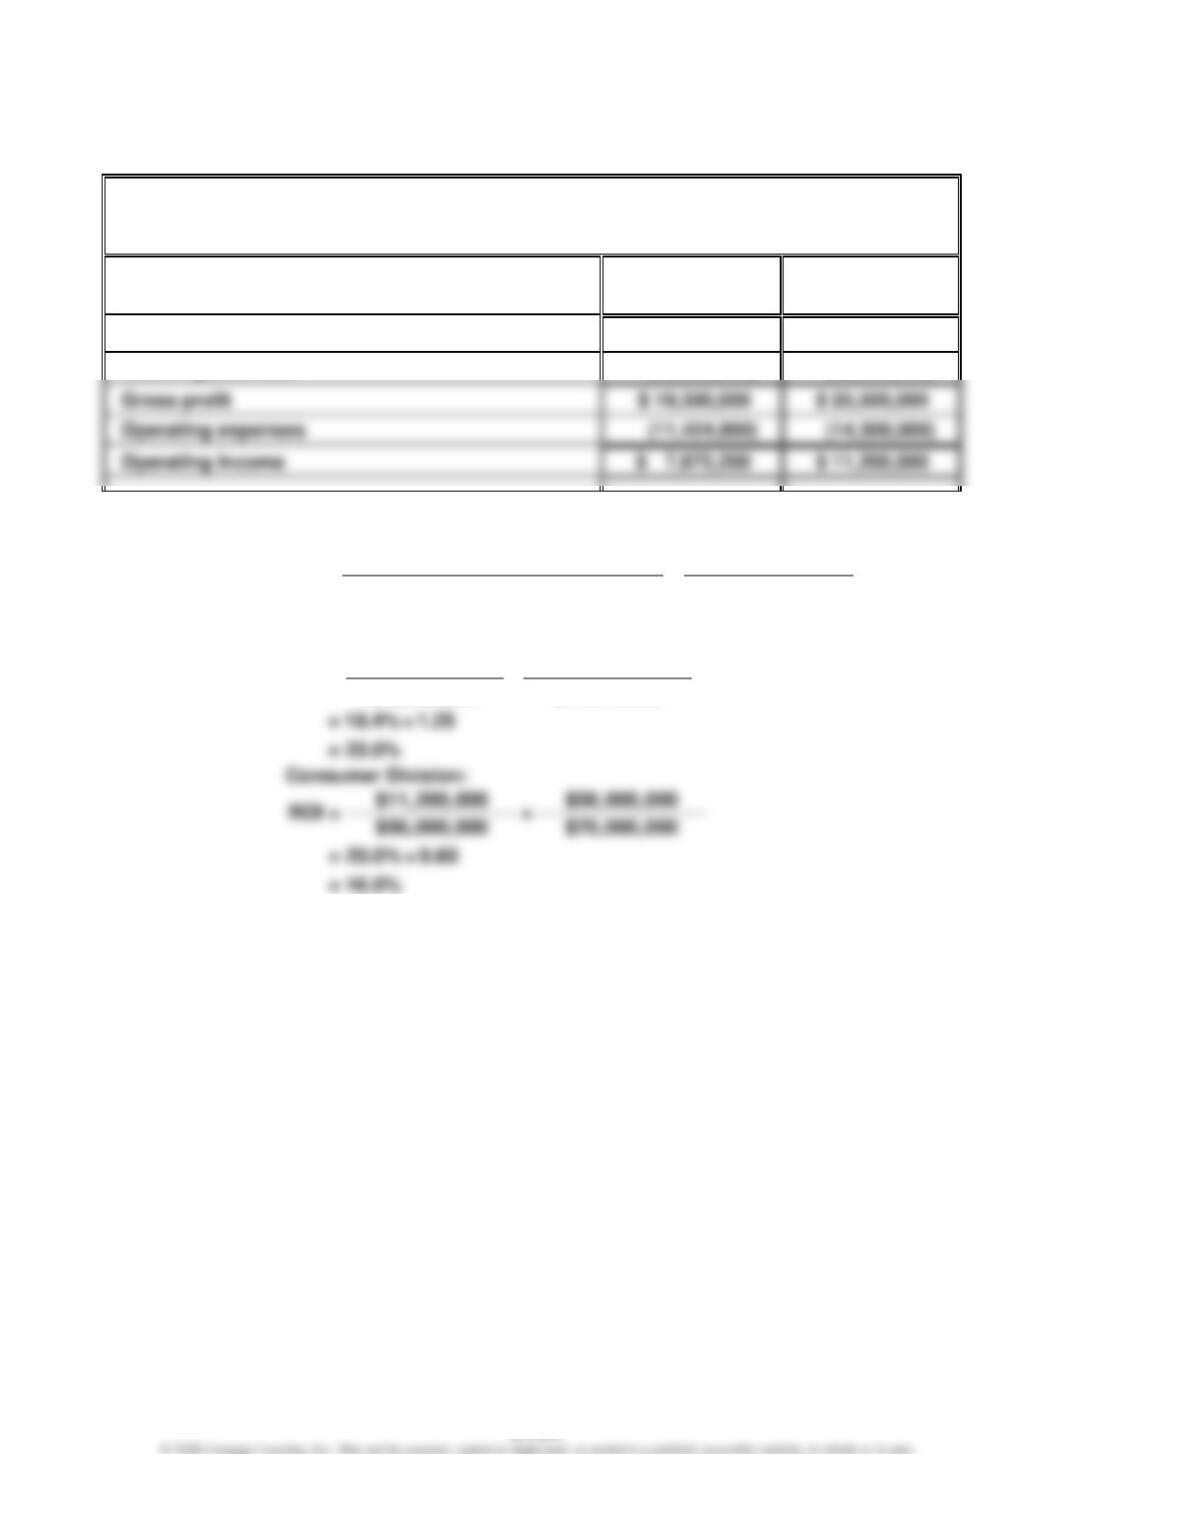
Recycling Industries
Divisional Income Statements
For the Year Ended December 31, 20Y8
Business
Division
Consumer
Division
Sales
$ 42,800,000
$ 56,000,000
Cost of goods sold
(23,500,000)
(30,500,000)
Gross profit
Operating expenses
(11,424,800)
(14,300,000)
2.
Return on Investment = Profit Margin× Investment Turnover
Operating Income Sales
Return on Investment = ×
Sales Invested Assets
Business Division:
$7,875,200 $42,800,000
ROI = ×
$42,800,000 $34,240,000
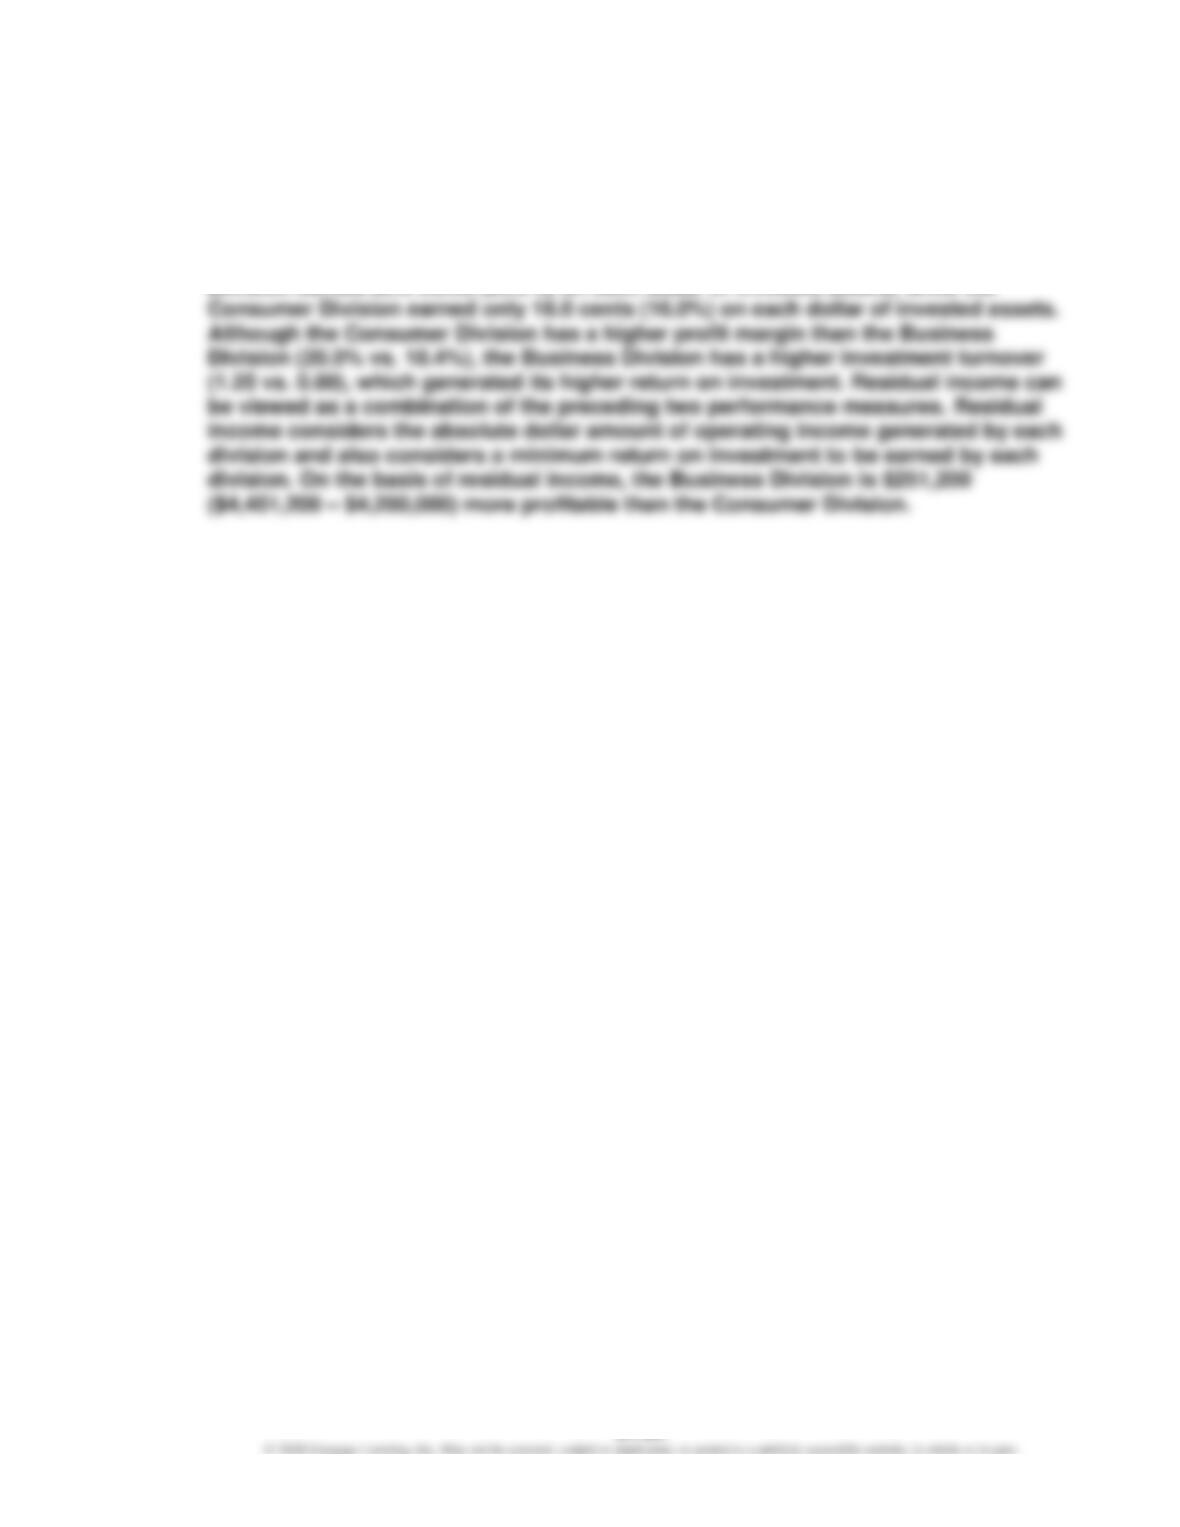
3. Business Division: $4,451,200 [$7,875,200 – ($34,240,000 × 10%)]
Consumer Division: $4,200,000 [$11,200,000 – ($70,000,000 × 10%)]
CHAPTER 24 (FIN MAN); CHAPTER 10 (MAN) Evaluating Decentralized Operations
Prob. 24–5A (FIN MAN); Prob. 10–5A (MAN) (Concluded)
4. On the basis of operating income, the Consumer Division generated $3,324,800
($11,200,000 – $7,875,200) more operating income than did the Business Division.
However, operating income does not consider the amount of amount of invested
assets in each division. On the basis of the return on investment, the Business
CHAPTER 24 (FIN MAN); CHAPTER 10 (MAN) Evaluating Decentralized Operations
Prob. 24–6A (FIN MAN); Prob. 10–6A (MAN)
1. No. When unused capacity exists in the supplying division (the Consumer
Division), the use of the market price approach may not lead to the maximization of
total company income.
2. The Consumer Division’s operating income would increase by $31,680:
Transferred
=
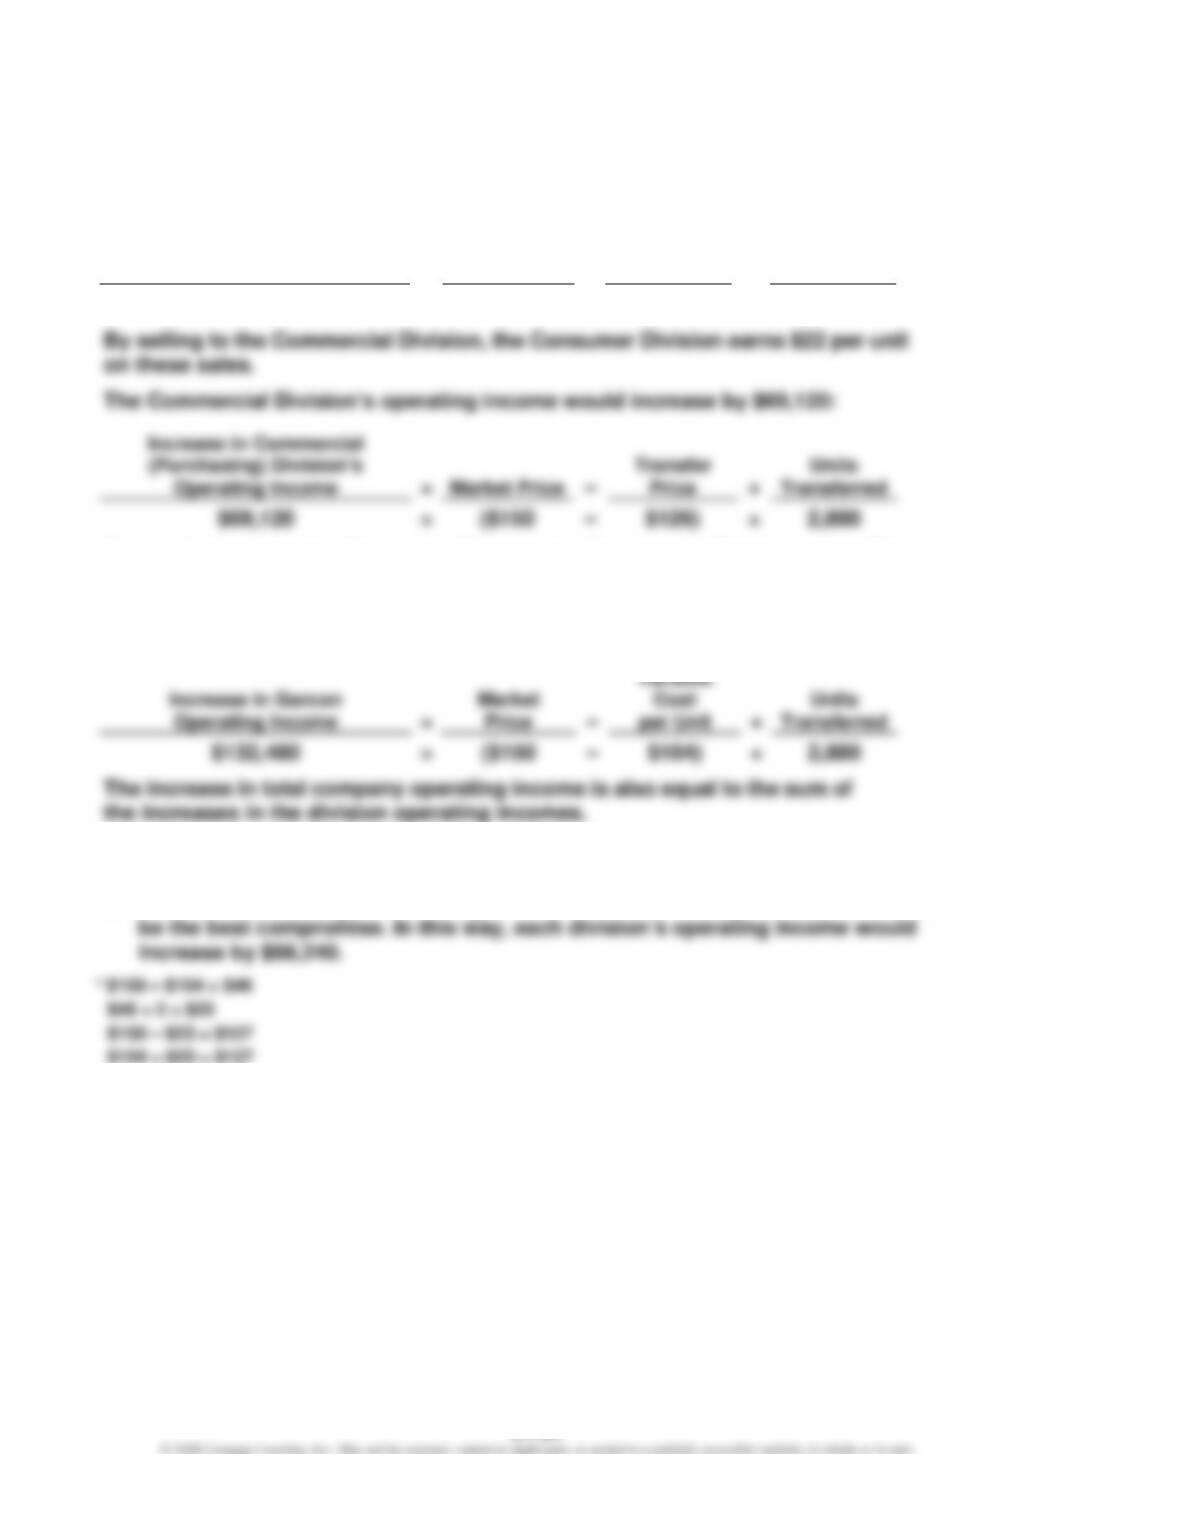
The Commercial Division’s operating income would increase by $100,800:
Increase in Commercial
(Purchasing) Division’s
Operating Income
Market
Price
Transfer
Price
Units
Transferred
=
–
×
$100,800
=
($150
–
$115)
×
2,880
CHAPTER 24 (FIN MAN); CHAPTER 10 (MAN) Evaluating Decentralized Operations
Prob. 24–6A (FIN MAN); Prob. 10–6A (MAN) (Continued)
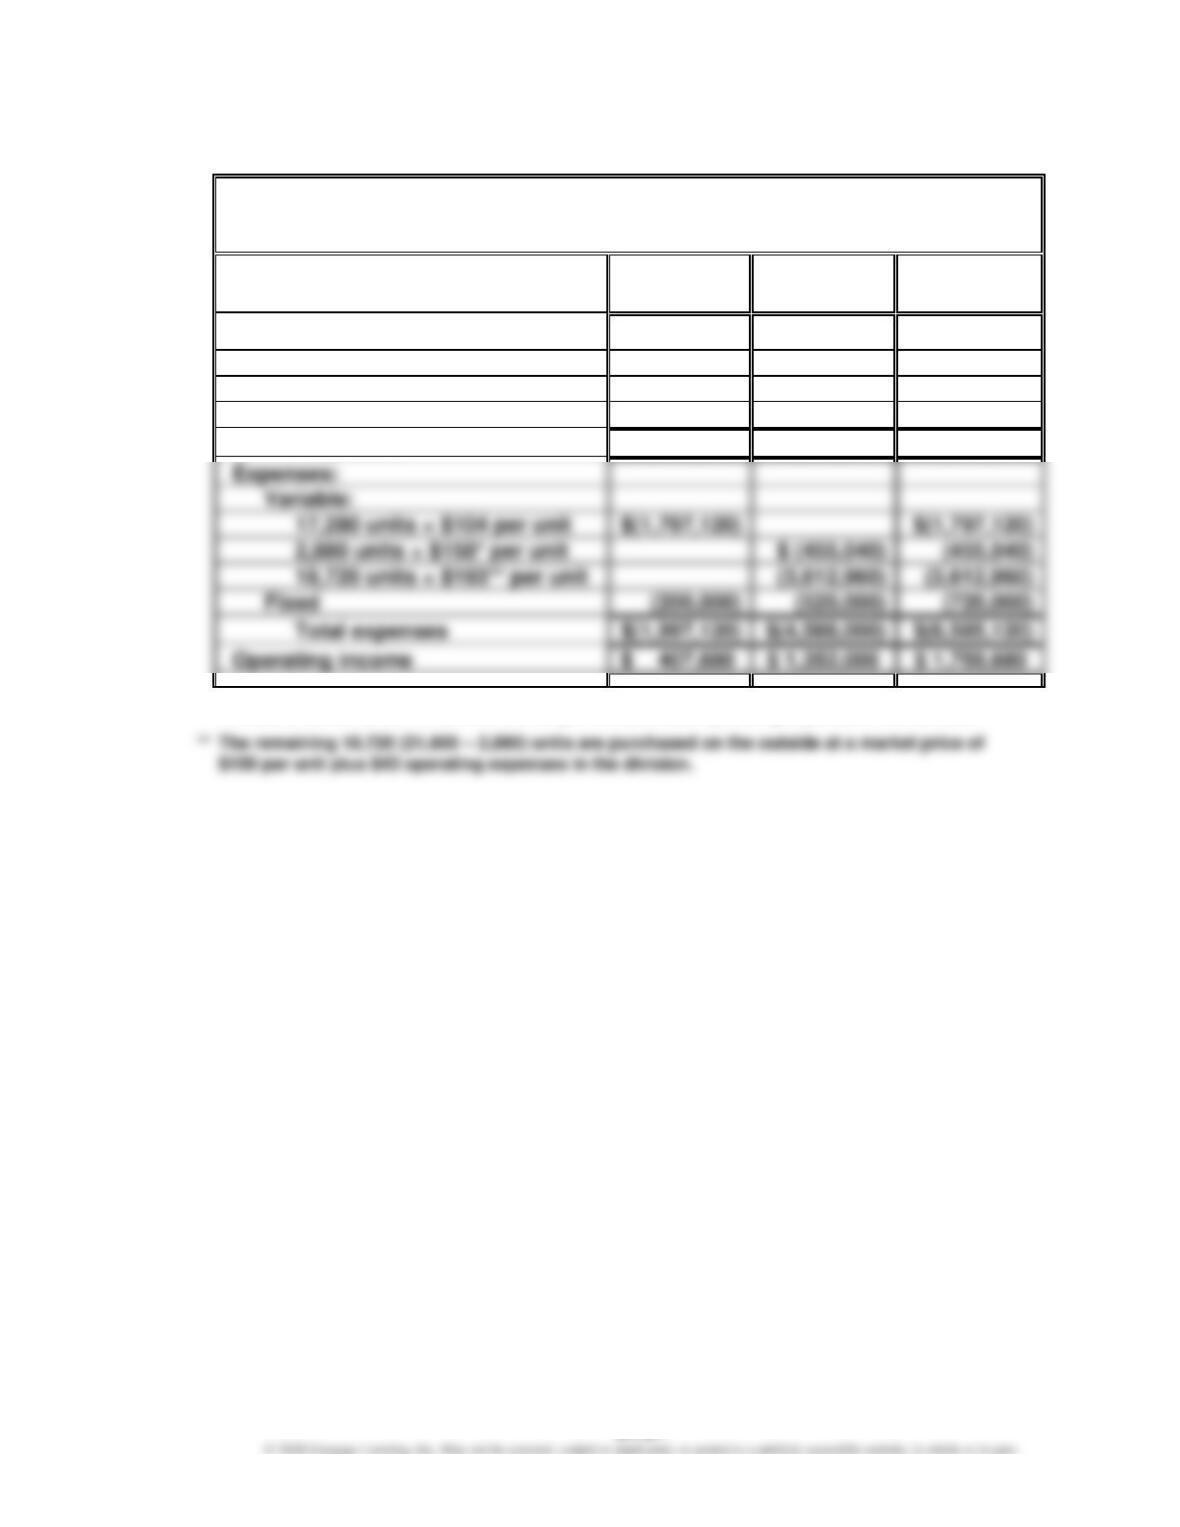
3.
Garcon Inc.
Divisional Income Statements
For the Year Ended December 31, 20Y2
Consumer
Division
Commercial
Division
Total
Sales:
14,400 units × $144 per unit
$ 2,073,600
$ 2,073,600
2,880 units × $115 per unit
331,200
331,200
21,600 units × $275 per unit
$ 5,940,000
5,940,000
Total sales
$ 2,404,800
$ 5,940,000
$ 8,344,800
2,880 units × $158* per unit
18,720 units × $193** per unit
Operating income
$ 1,352,000
$ 1,759,680
*
The 2,880 units are transferred in at $115 per unit plus $43 operating expense in the division.
CHAPTER 24 (FIN MAN); CHAPTER 10 (MAN) Evaluating Decentralized Operations
Prob. 24–6A (FIN MAN); Prob. 10–6A (MAN) (Concluded)
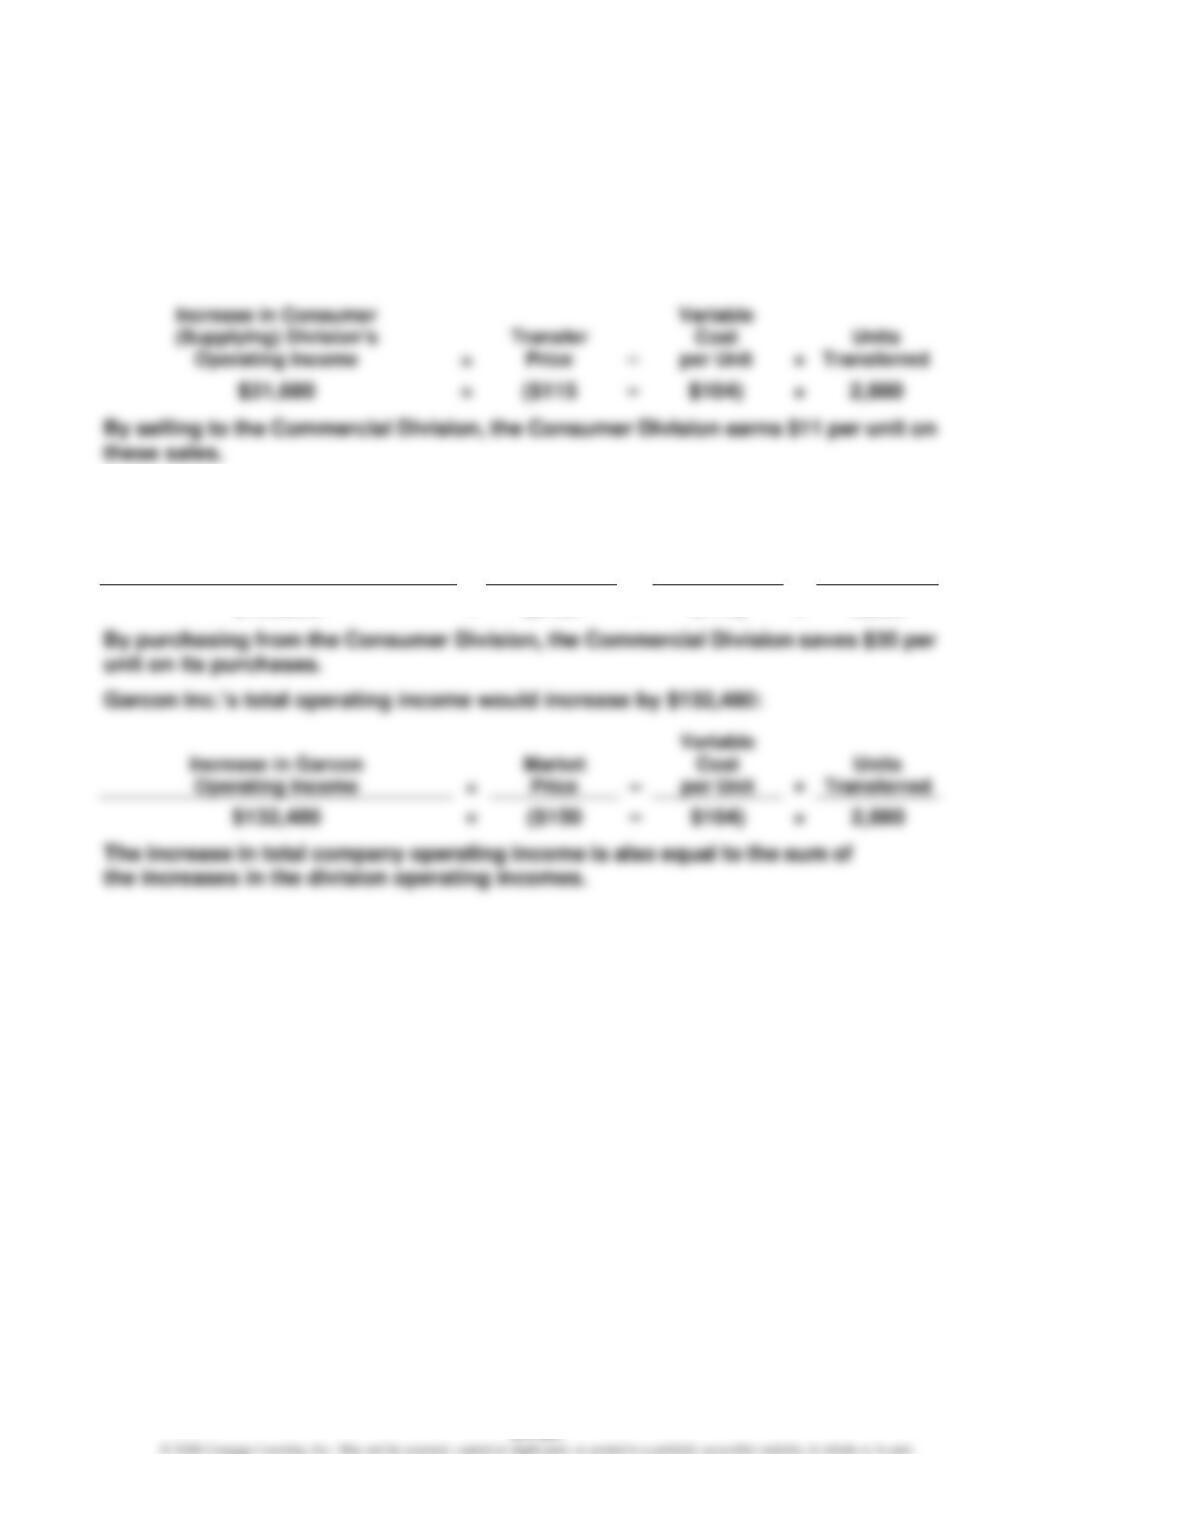
4. The Consumer Division’s operating income would increase by $63,360:
Increase in Consumer
(Supplying) Division’s
Operating Income
Transfer
Price
Variable
Cost
per Unit
Units
Transferred
=
–
×
$63,360
=
($126
–
$104)
×
2,880
Operating Income
Price
By purchasing from the Consumer Division, the Commercial Division saves $24 per
unit on its purchases.
Garcon Inc.’s total operating income would increase by the same amount as
in part (2), $132,480:
Operating Income
Transferred
5. a. Any transfer price greater than the Consumer Division’s variable expenses per
unit of $104 but less than the market price of $150 would be acceptable.
b. If the division managers cannot agree on a transfer price, a price of $127* would
CHAPTER 24 (FIN MAN); CHAPTER 10 (MAN) Evaluating Decentralized Operations
Prob. 24–1B (FIN MAN); Prob. 10–1B (MAN)
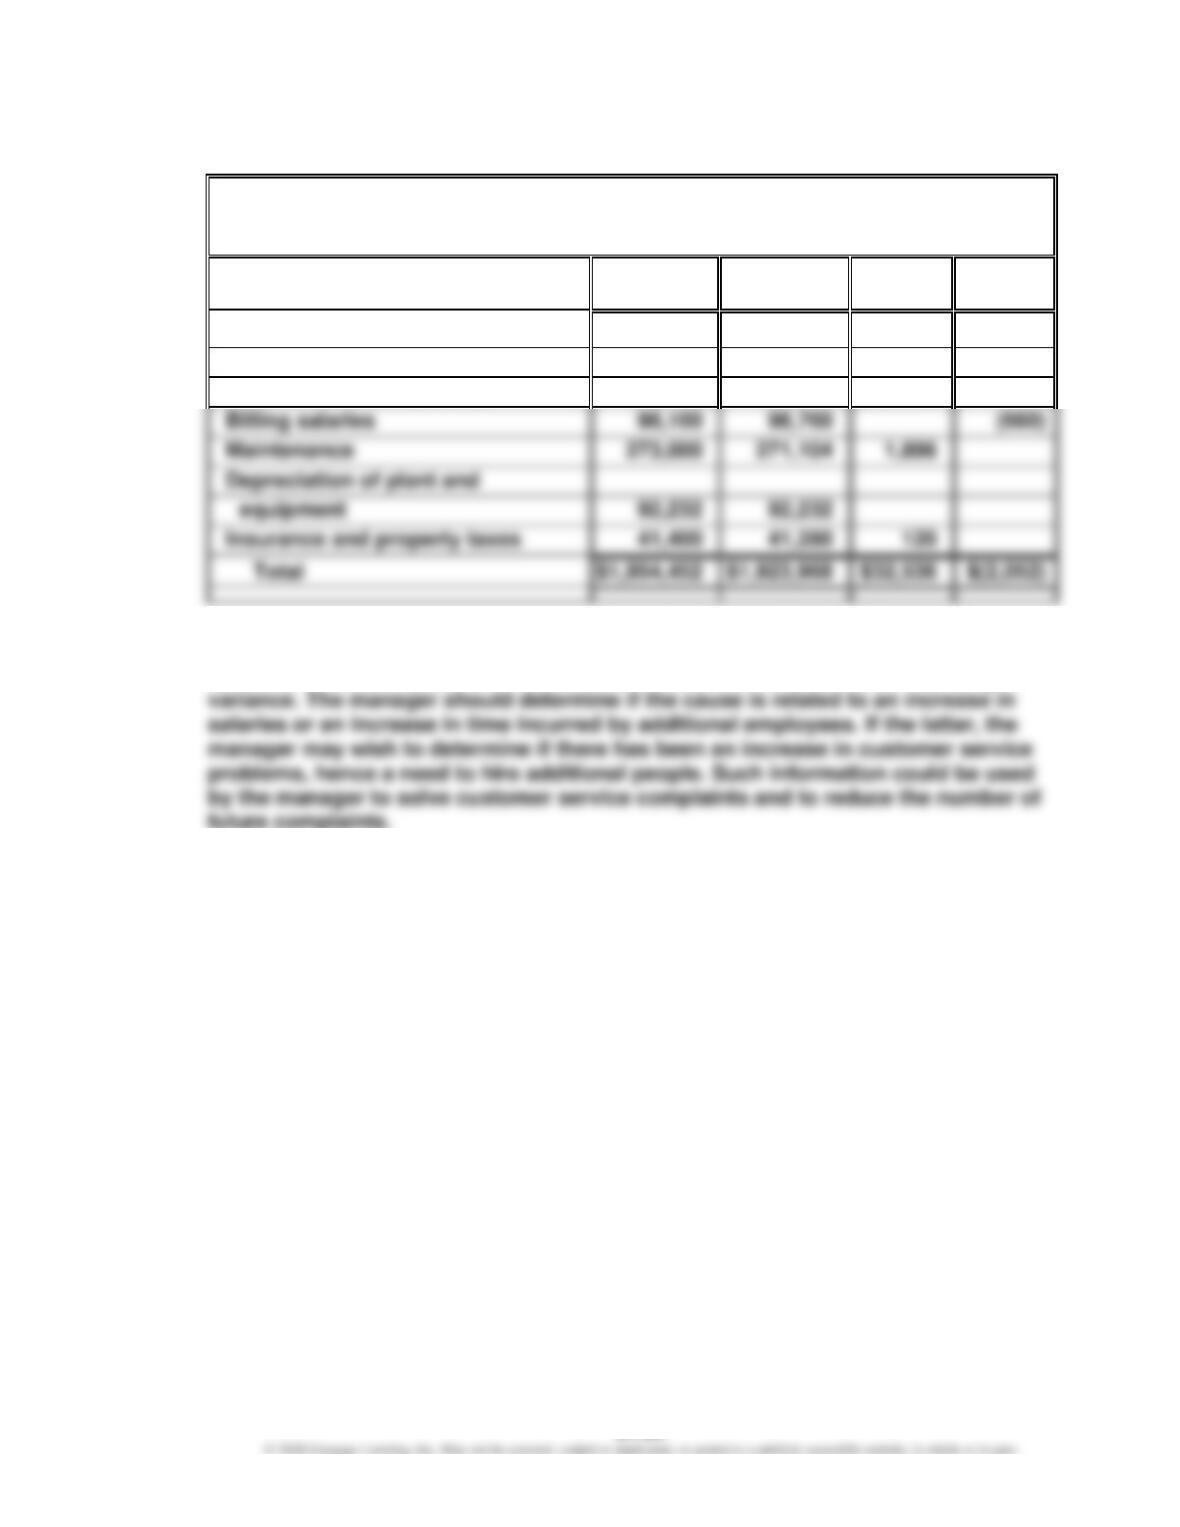
1.
Adelson Inc.
Budget Performance Report—Manager, Eastern District
For the Month Ended December 31
Actual
Budget
Over
Budget
(Under)
Budget
Sales salaries
$ 818,880
$ 819,840
$ (960)
System administration salaries
447,720
448,152
(432)
Customer service salaries
183,120
152,600
$30,520
Billing salaries
(660)
273,000
271,104
Insurance and property taxes
2. The customer service salaries exceed the budget by 20% of budget ($30,520 ÷
$152,600). The manager should request additional detailed information about the
customer service department. There are several possible reasons for the budget
CHAPTER 24 (FIN MAN); CHAPTER 10 (MAN) Evaluating Decentralized Operations
Prob. 24–2B (FIN MAN); Prob. 10–2B (MAN)
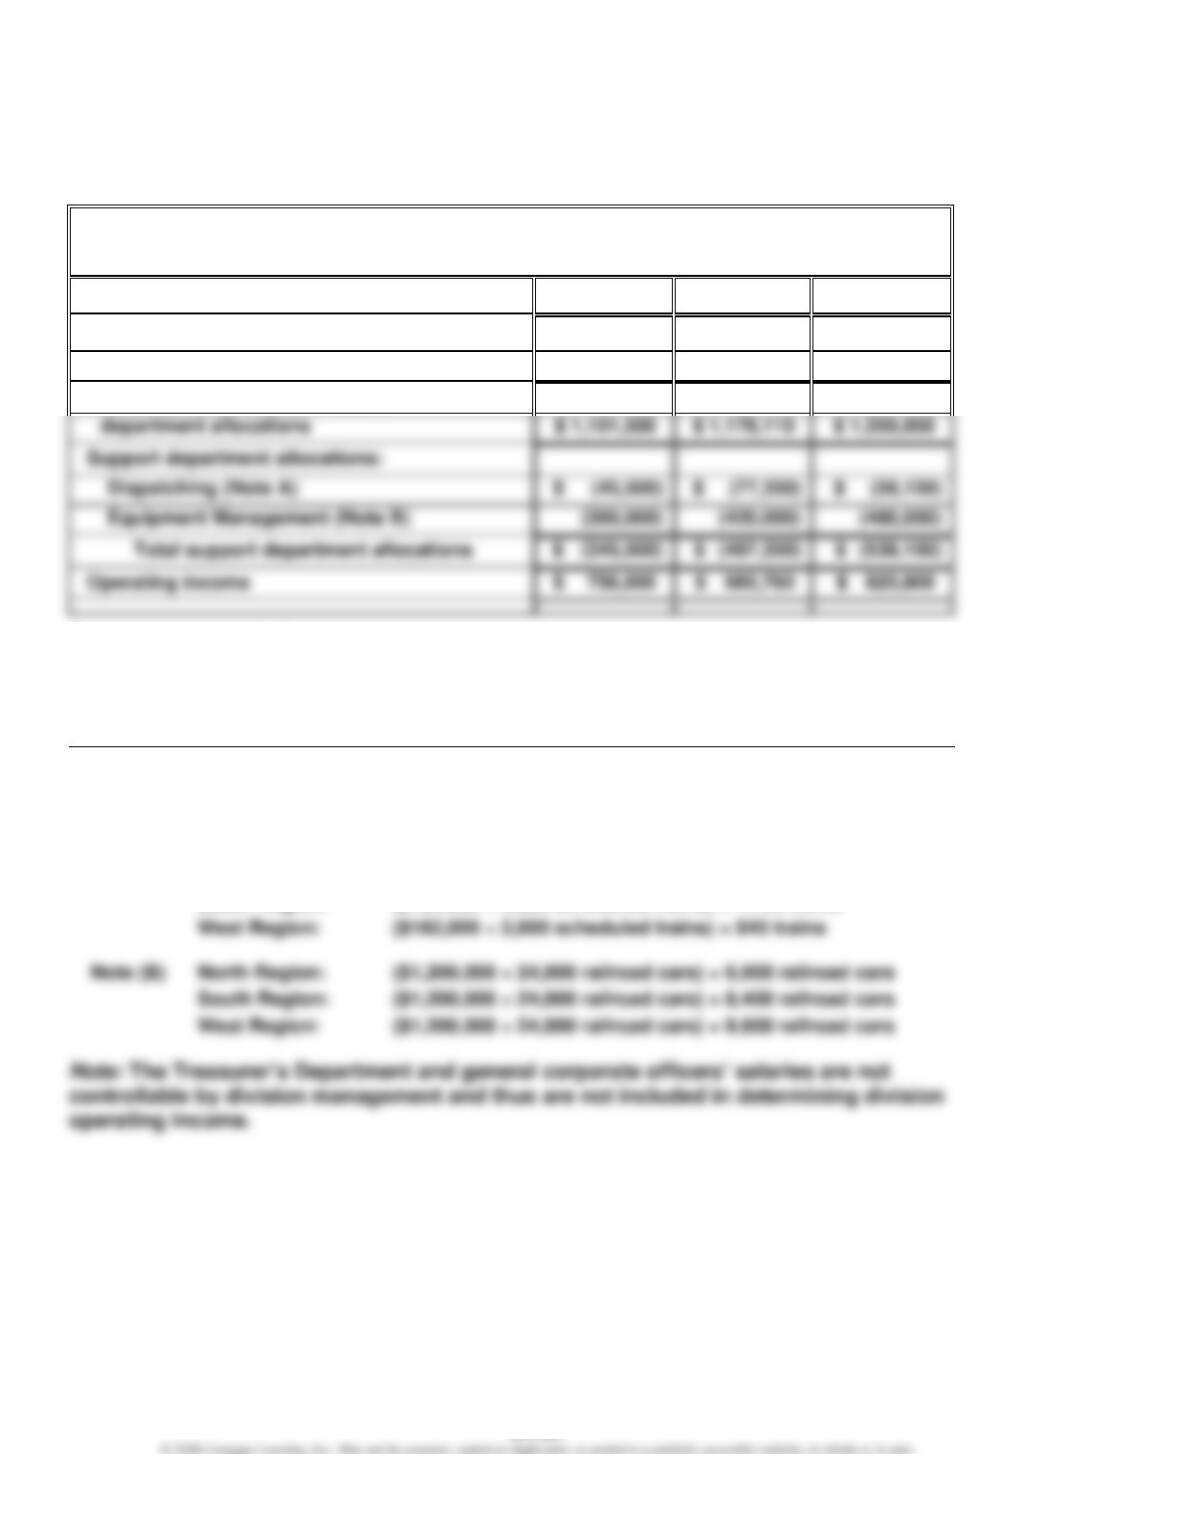
1.
Thomas Railroad Company
Divisional Income Statements
For the Quarter Ended December 31
North
South
West
Revenues
$ 3,780,000
$ 5,673,000
$ 5,130,000
Operating expenses
(2,678,500)
(4,494,890)
(3,770,050)
Operating income before support
Supporting computations:
Support department allocations rates for Dispatching and Equipment Management are
determined as follows:
North
South
West
Total
Number of scheduled trains ……………..
650
1,105
845
2,600
Number of railroad cars in
Inventory ………………………………………
6,000
8,400
9,600
24,000
Note (A)
North Region:
($182,000 ÷ 2,600 scheduled trains) × 650 trains
CHAPTER 24 (FIN MAN); CHAPTER 10 (MAN) Evaluating Decentralized Operations
Prob. 24–2B (FIN MAN); Prob. 10–2B (MAN) (Concluded)
2. The CEO evaluates the three regions using operating income as a percent of revenues.
This measure is calculated for the three regions as follows:
North Region:
20% ($756,000 ÷ $3,780,000)
3. To: CEO
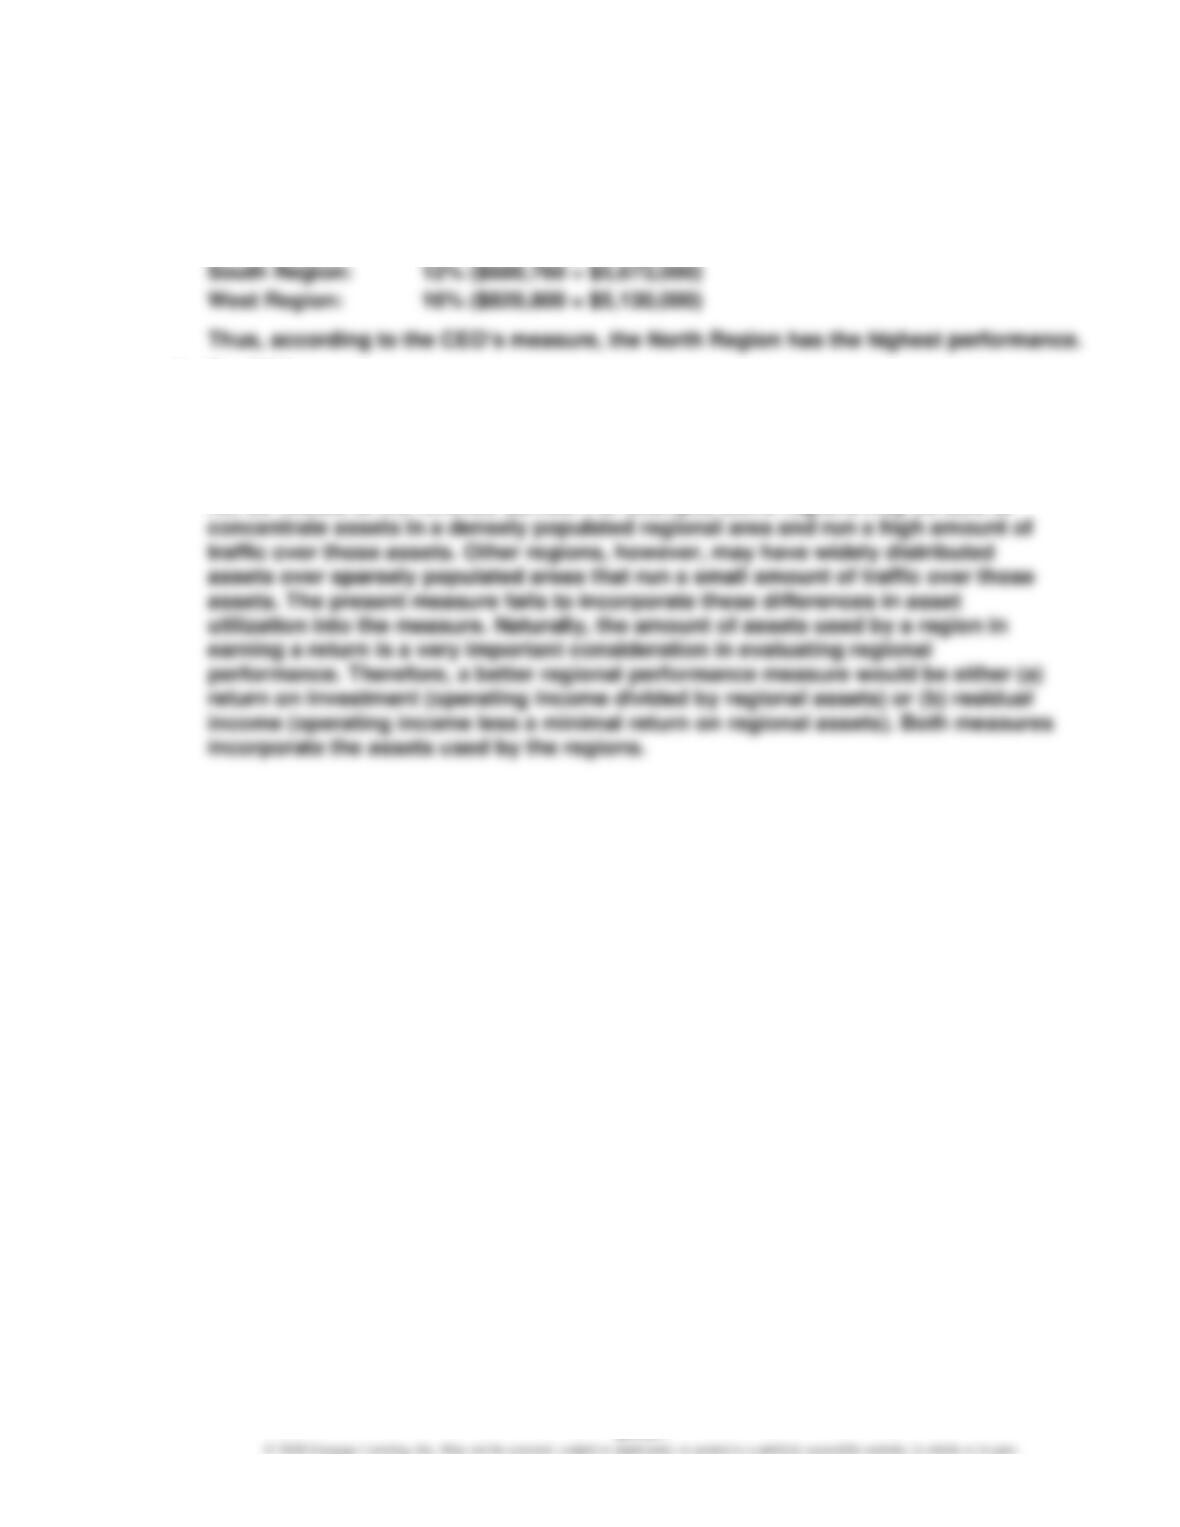
The method used to evaluate the performance of the regions should be reevaluated.
The present method identifies the amount of operating income per dollar of earned
revenue. However, a railroad company requires a significant investment in fixed
assets, such as track, engines, and railcars. In addition, the amount of assets may
CHAPTER 24 (FIN MAN); CHAPTER 10 (MAN) Evaluating Decentralized Operations
Prob. 24–3B (FIN MAN); Prob. 10–3B (MAN)
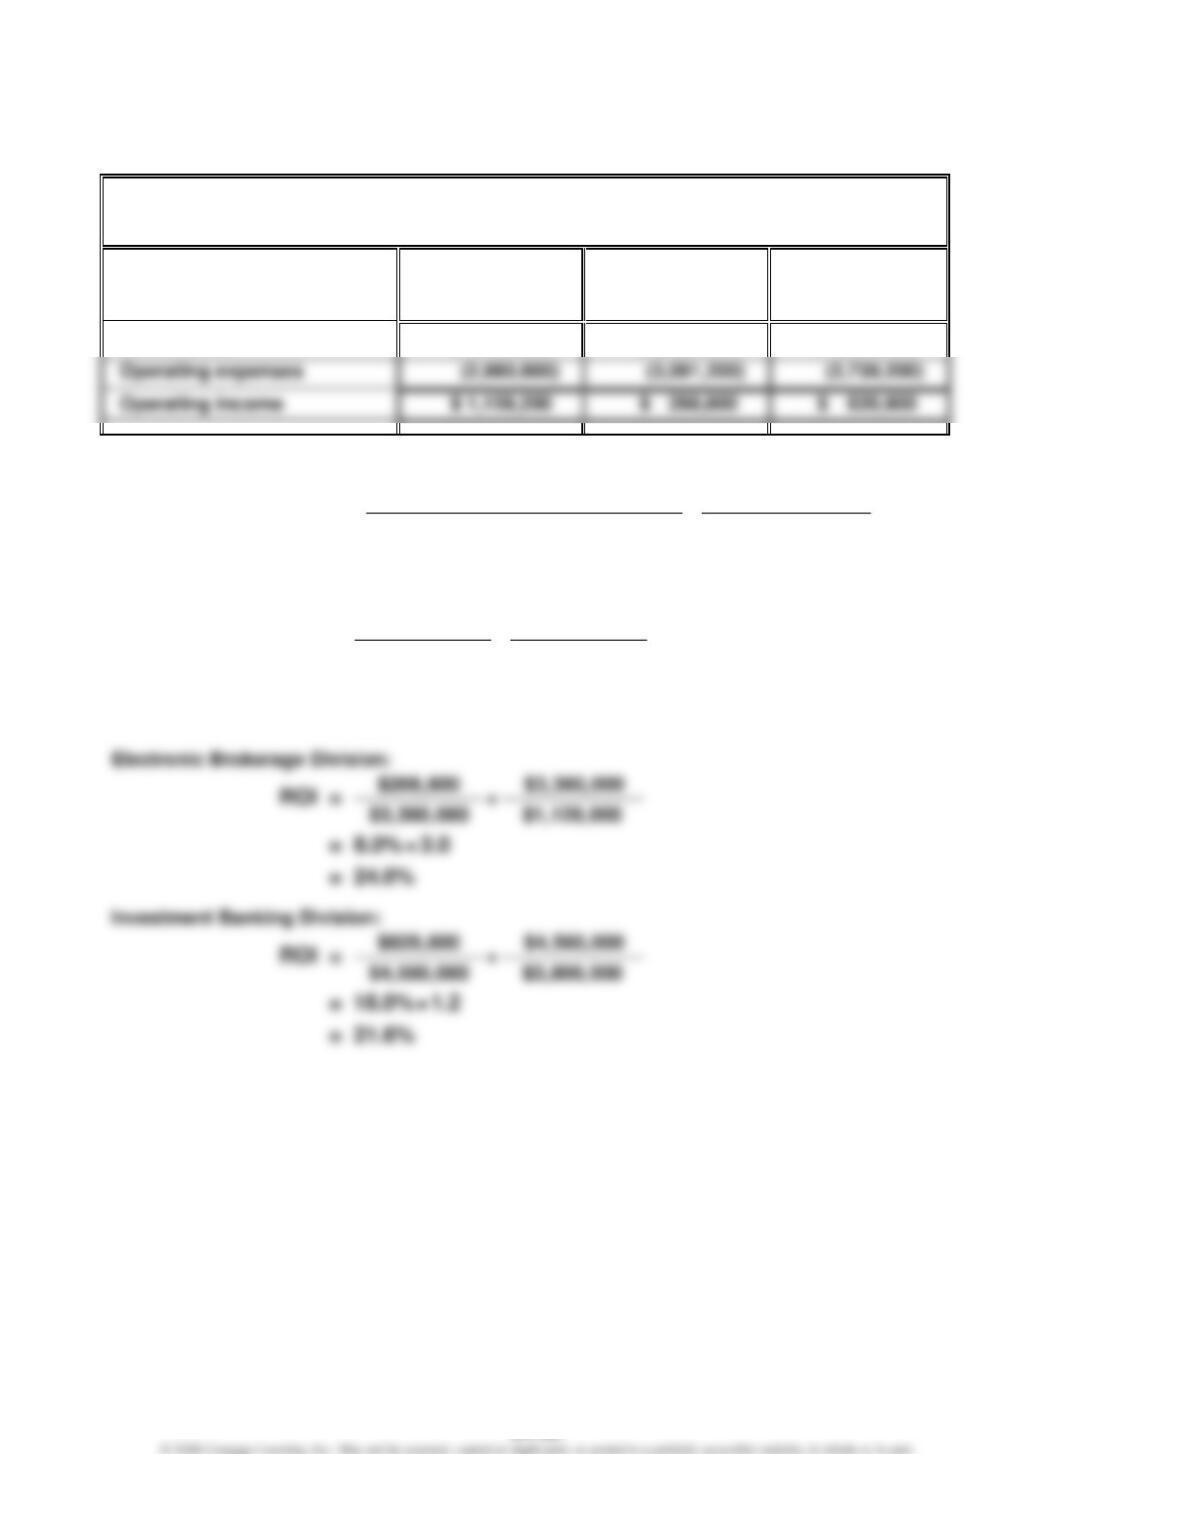
1.
E.F. Lynch Company
Divisional Income Statements
For the Year Ended June 30, 20Y8
Mutual
Fund
Division
Electronic
Brokerage
Division
Investment
Banking
Division
Fee revenue
$ 4,140,000
$ 3,360,000
$ 4,560,000
2.
Operating Income Sales
×
Sales Invested Assets
Return on Investment = Profit Margin× Investment Turnover
Return on Investment =
Mutual Fund Division:
$1,159,200 $4,140,000
×
$4,140,000 $5,175,000
ROI =
= 28.0%× 0.8
= 22.4%
CHAPTER 24 (FIN MAN); CHAPTER 10 (MAN) Evaluating Decentralized Operations
Prob. 24–3B (FIN MAN); Prob. 10–3B (MAN) (Concluded)
3. Per dollar of invested assets, the Electronic Brokerage Division is the most
profitable of the three divisions. Assuming that the returns on investment do not
change in the future, an expansion of the Electronic Brokerage Division will return
Note to Instructors: The Mutual Fund Division has excellent profit margins, but the
investment turnover is low. The investment in the “bricks and mortar” of the Mutual
Fund Division offices causes the investment turnover and return on investment to
CHAPTER 24 (FIN MAN); CHAPTER 10 (MAN) Evaluating Decentralized Operations
Prob. 24–4B (FIN MAN); Prob. 10–4B (MAN)
1.
Operating Income Sales
×
Sales Invested Assets
Return on Investment = Profit Margin×Investment Turnover
Return on Investment =
2.
Gihbli Industries Inc.—Electronics Division
Estimated Income Statements
For the Year Ended December 31, 20Y9
Proposal 1
Proposal 2
Proposal 3
Sales
$1,575,000
$1,395,0003
$1,575,000
Cost of goods sold
(859,600)1
(771,450)4
(702,000)7
Gross profit
$ 715,400
$ 623,550
$ 873,000
1
$891,000 – $31,400
2
$1,050,000 – $300,000
3
$1,575,000 – $180,000
4
$891,000 – $119,550
5
$558,000 – $60,000
6
$1,050,000 – $112,500
7
$891,000 – $189,000
CHAPTER 24 (FIN MAN); CHAPTER 10 (MAN) Evaluating Decentralized Operations
Prob. 24–4B (FIN MAN); Prob. 10–4B (MAN) (Concluded)
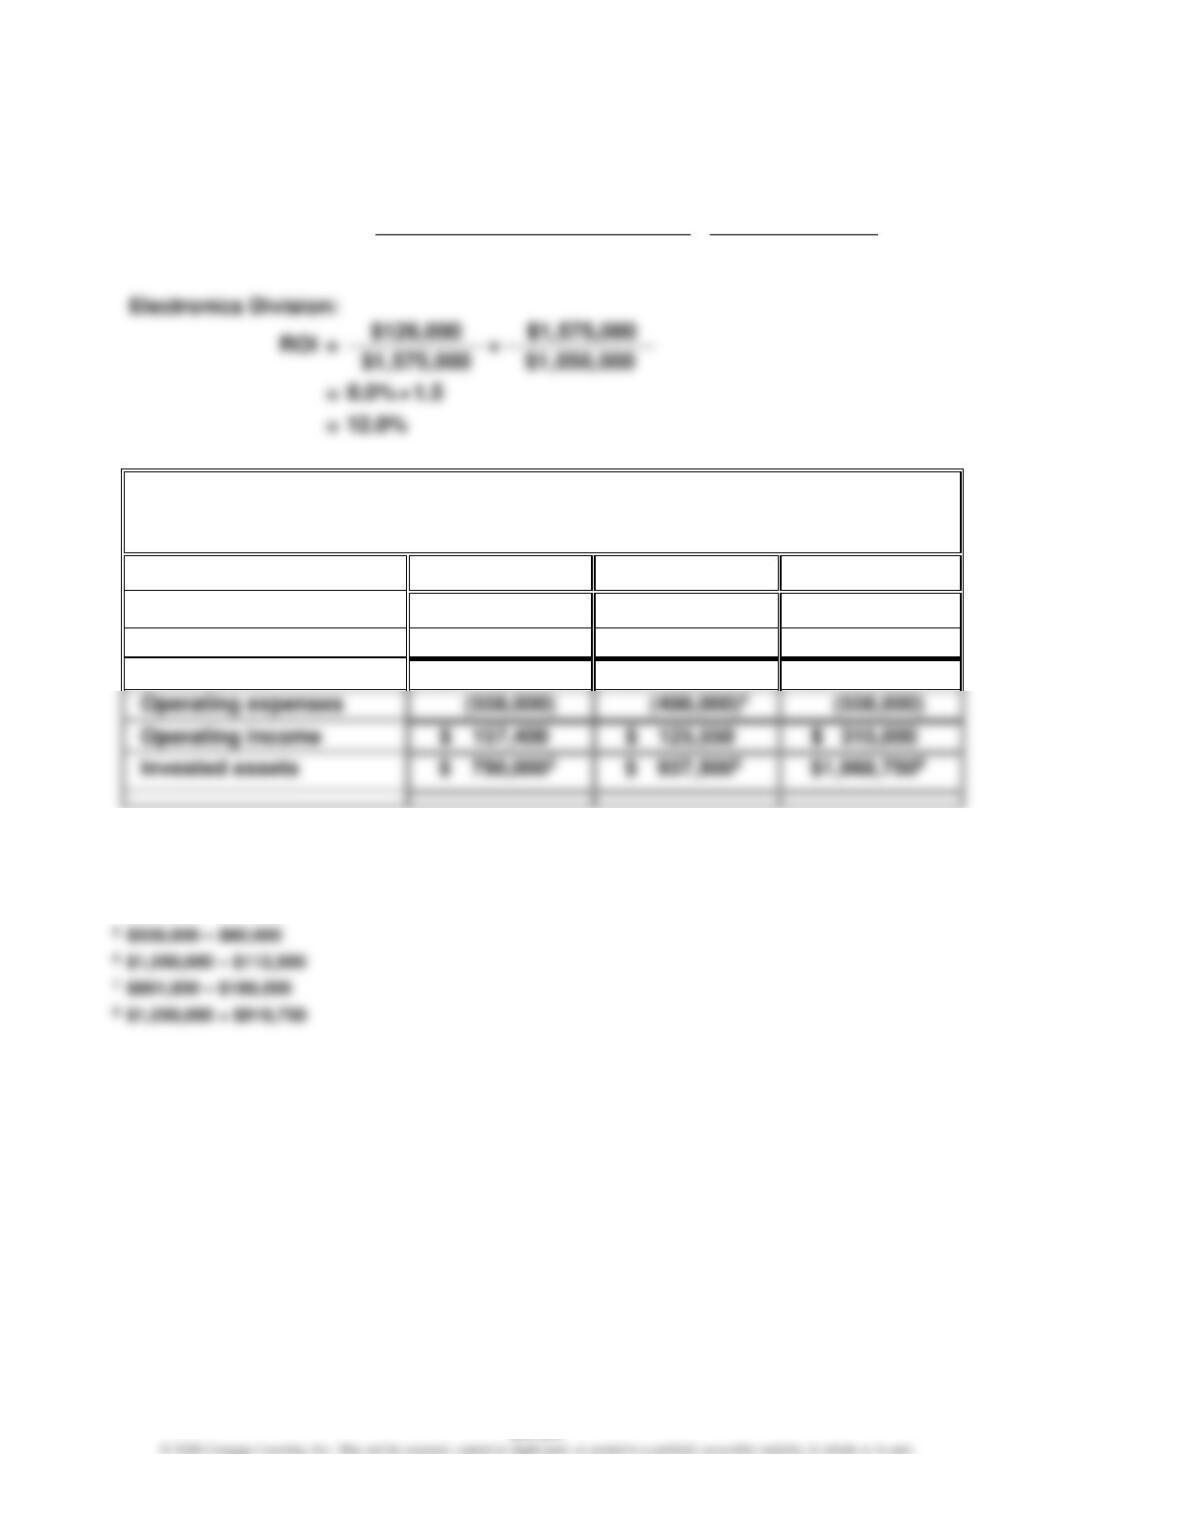
3.
Operating Income Sales
×
Sales Invested Assets
Return on Investment = Profit Margin×Investment Turnover
Return on Investment =
Proposal 1:
$157,400 $1,575,000
×
$1,575,000 $750,000
ROI =
= 10.0%× 2.1
= 21.0%
4.
Proposal 1 would yield a return on investment of 21.0%.
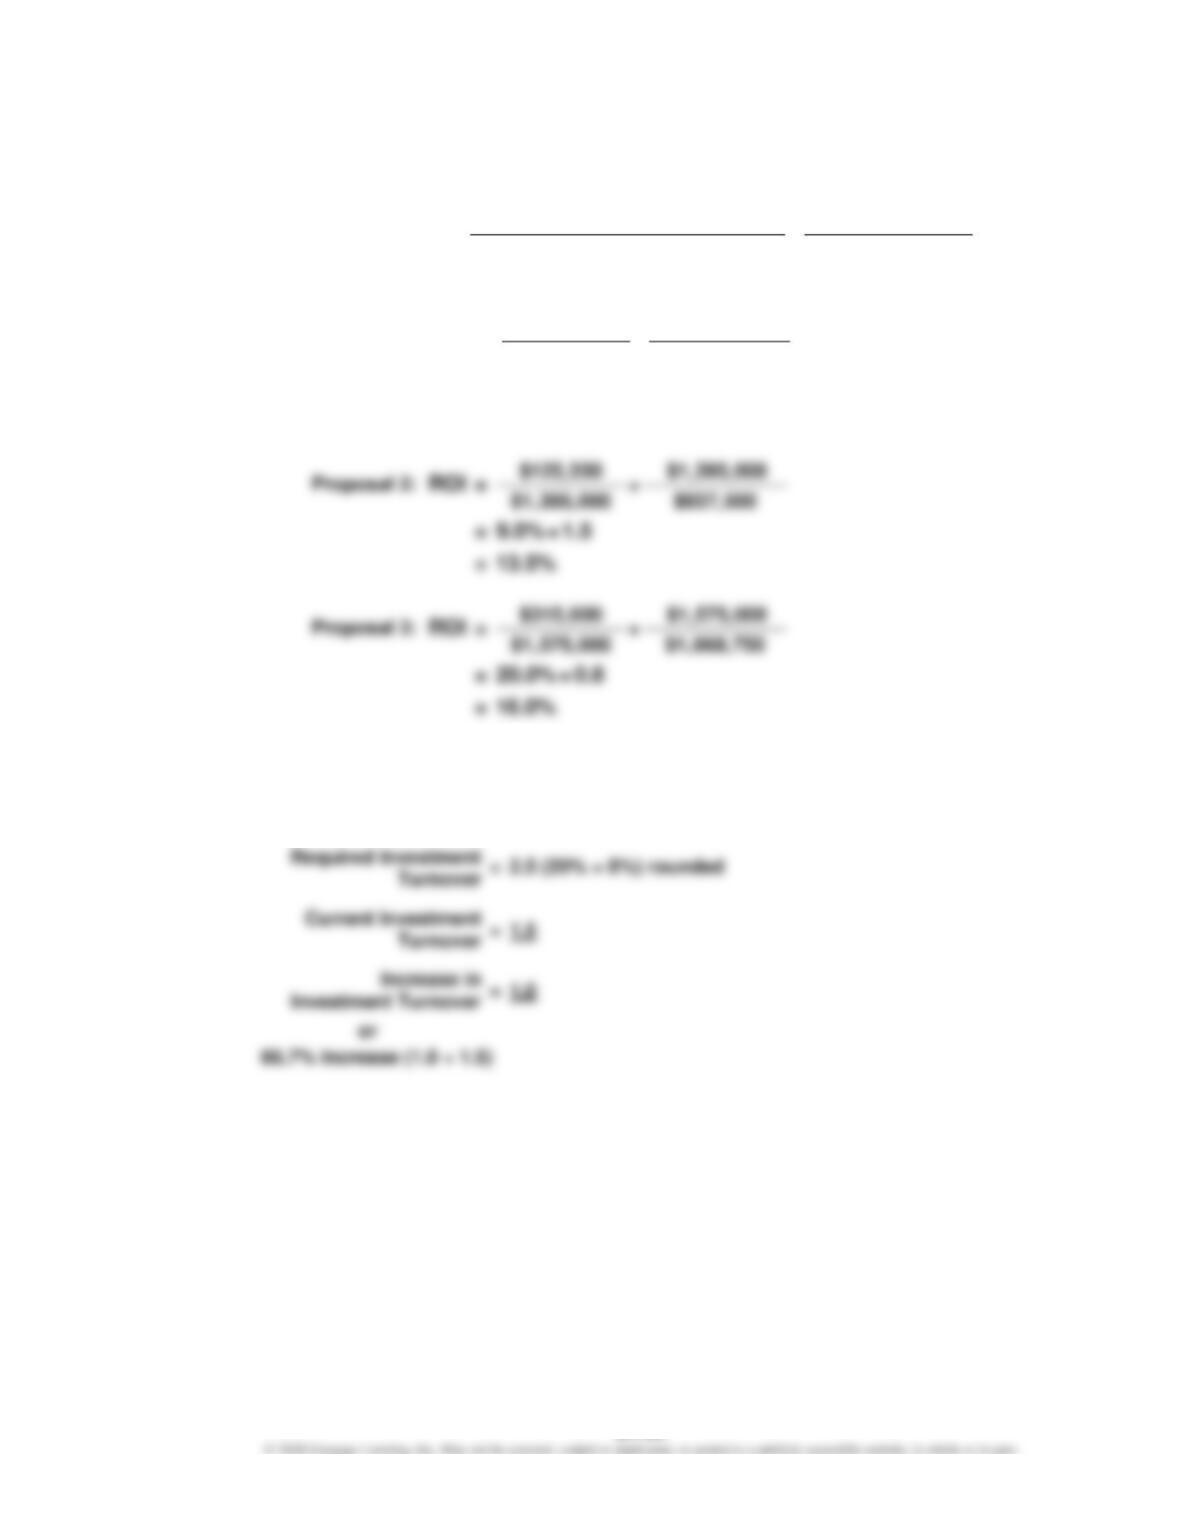
5.
Return on Investment
=
Profit Margin × Required Investment Turnover
20%
=
8% × Required Investment Turnover
CHAPTER 24 (FIN MAN); CHAPTER 10 (MAN) Evaluating Decentralized Operations
Prob. 24–5B (FIN MAN); Prob. 10–5B (MAN)
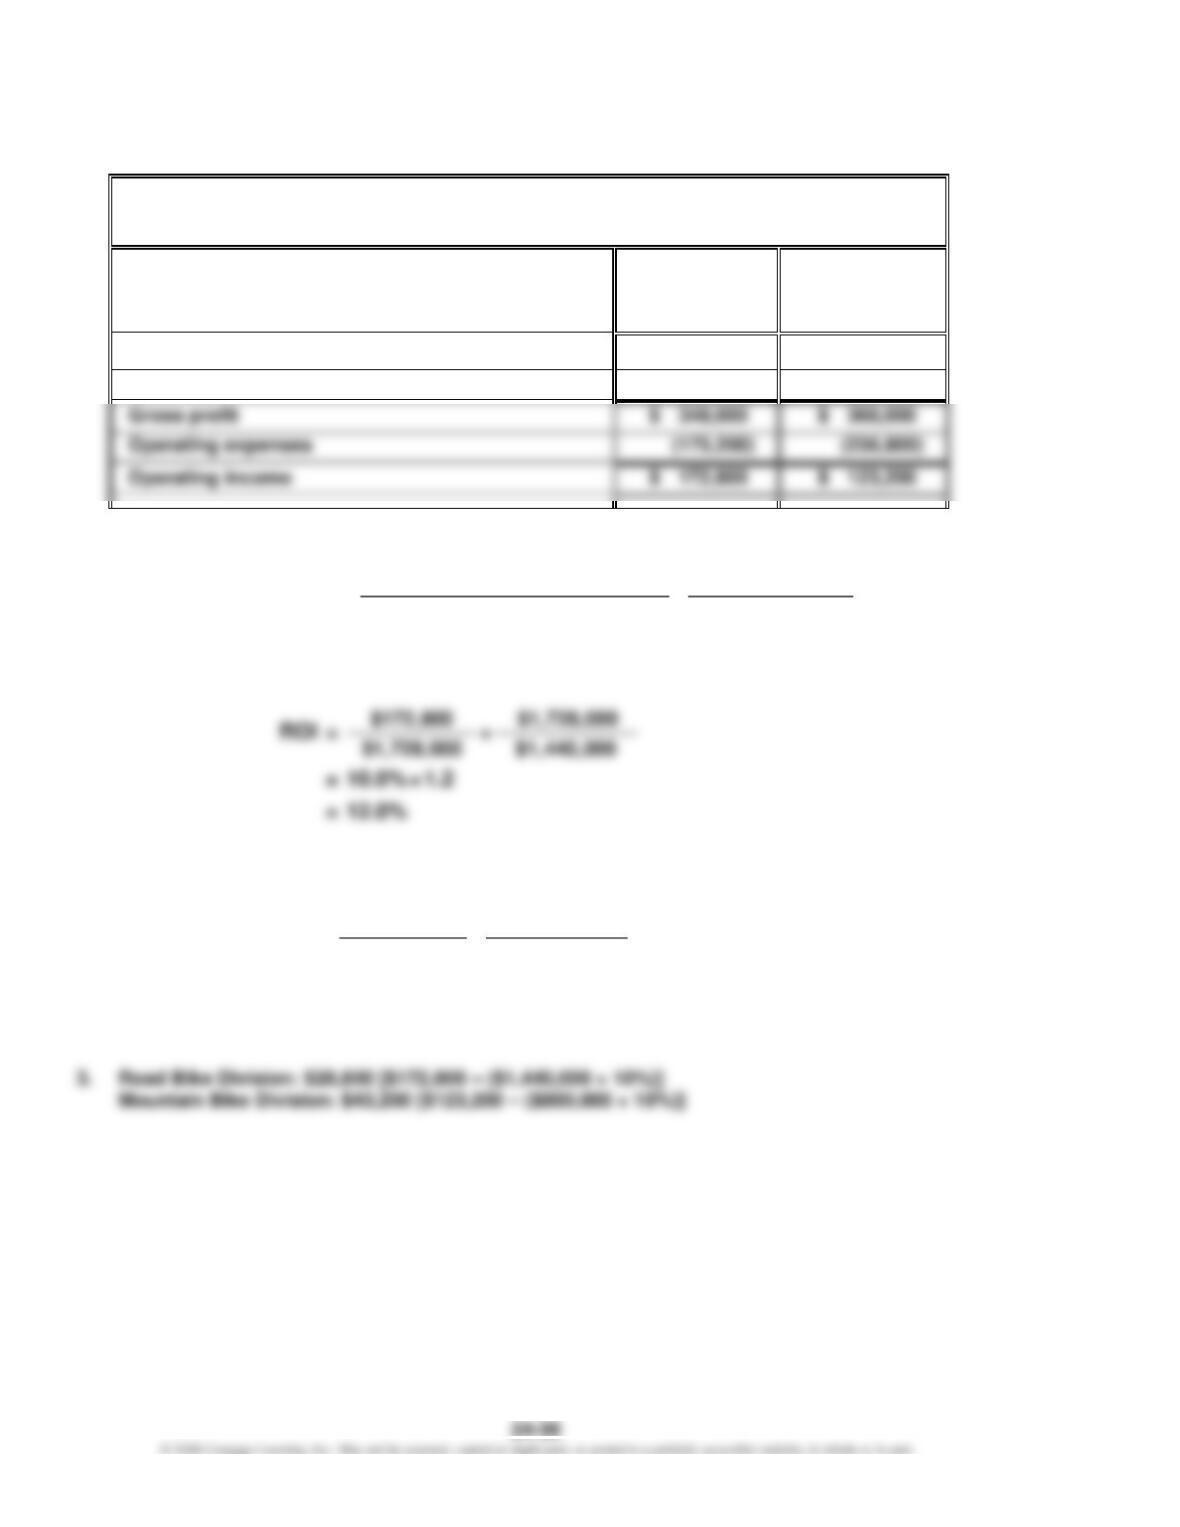
1.
Free Ride Bike Company
Divisional Income Statements
For the Year Ended December 31, 20Y7
Road
Bike
Division
Mountain
Bike
Division
Sales
$ 1,728,000
$ 1,760,000
Cost of goods sold
(1,380,000)
(1,400,000)
Gross profit
Operating expenses
2.
Operating Income Sales
×
Sales Invested Assets
Return on Investment = Profit Margin×Investment Turnover
Return on Investment =
Road Bike Division:
$172,800 $1,728,000
×
ROI =
= 12.0%
Mountain Bike Division:
$123,200 $1,760,000
×
$1,760,000 $800,000
ROI =
= 7.0%× 2.2
= 15.4%