Chapter 10
Budgetary Planning and Control
QUESTIONS
1. Budgets are useful in the planning process because they increase communication
3. In a top-down approach, budgets are prepared by high level managers without
4. In a zero-based budget, expenses are justified afresh in each budgeting period.
Thus, no continuing project or activity receives funding automatically.
5. A spreadsheet allows you to change assumptions quickly and easily, facilitating
7. A static budget is a budget for one anticipated level of business activity. A flexible
10. Effective planning requires that managers provide truthful information and
Jiambalvo Managerial Accounting
10-2
EXERCISES
E1. [LO 3]
If a manager knows that income will exceed the upper bound, he/she may shift
E2. [LO 3]
E3. [LO 2]
E4. [LO 2]
Locksafe Company
Sales Budget
For the Year Ending December 31, 2018
First Second Third Fourth
Quarter Quarter Quarter Quarter Year
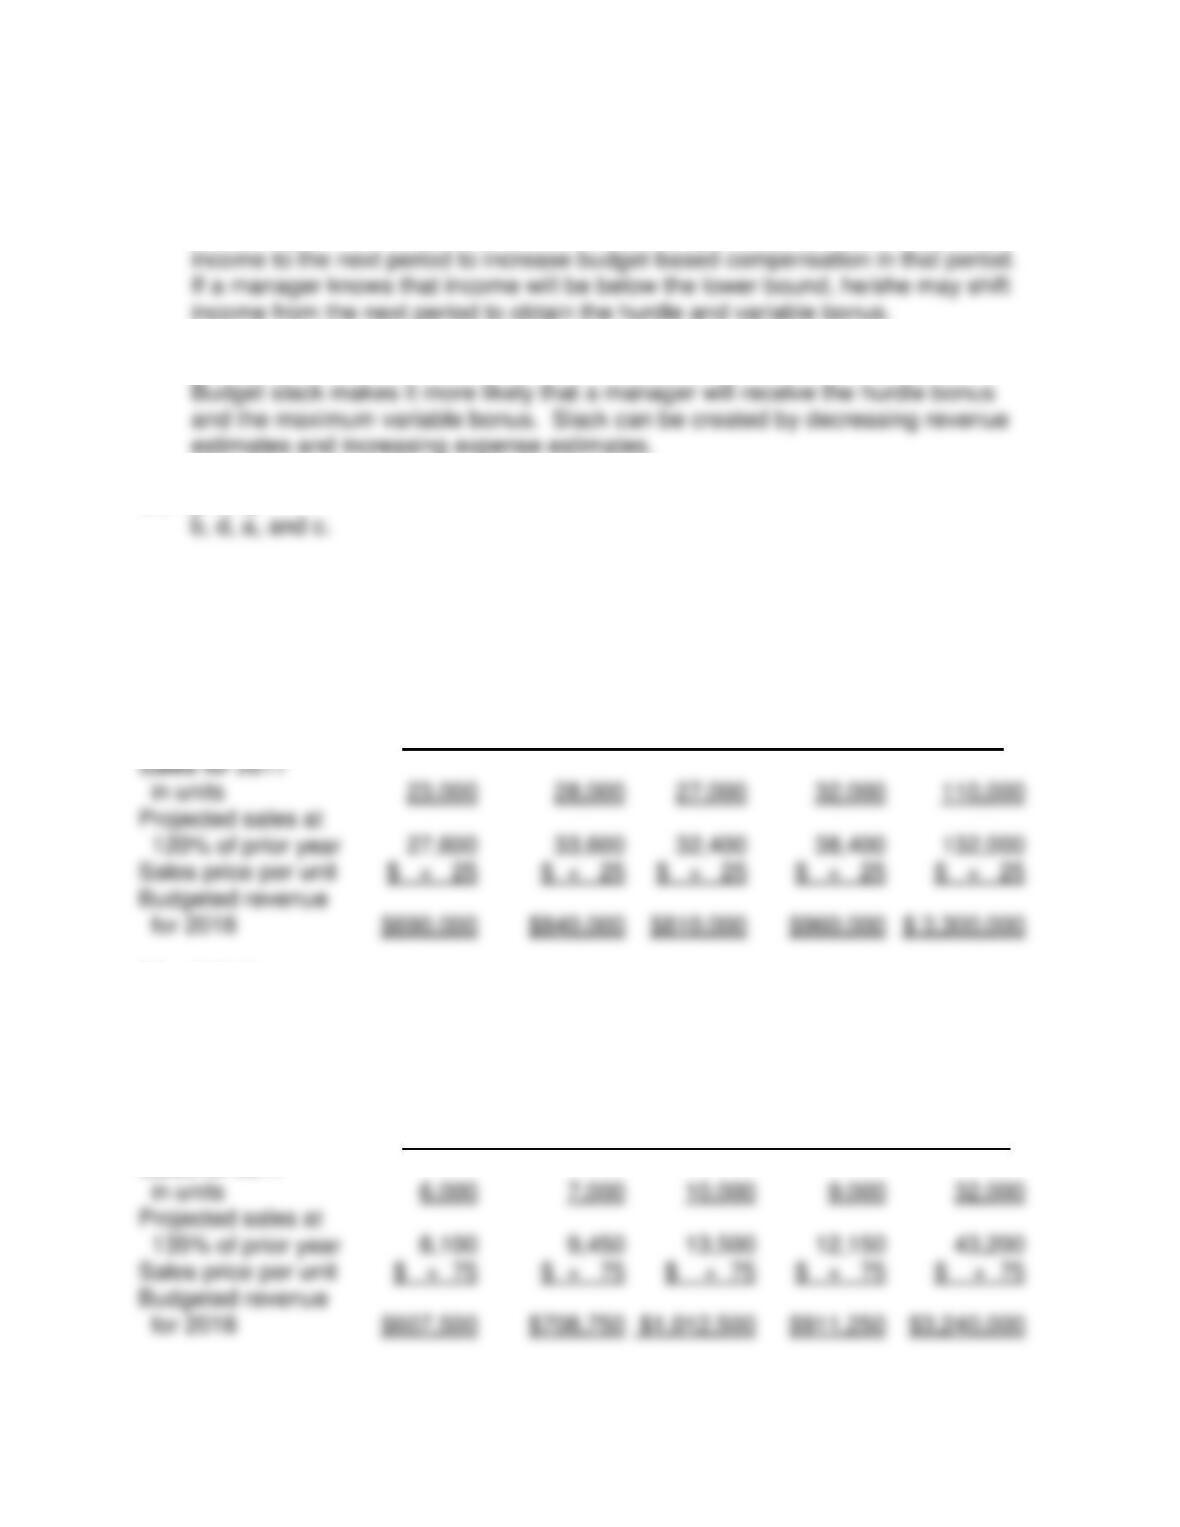
E5. [LO 2]
Oregon Adventures
Sales Budget
For the Year Ending December 31, 2018
First Second Third Fourth
Quarter Quarter Quarter Quarter Year
Sales for 2017
E6. [LO 2]
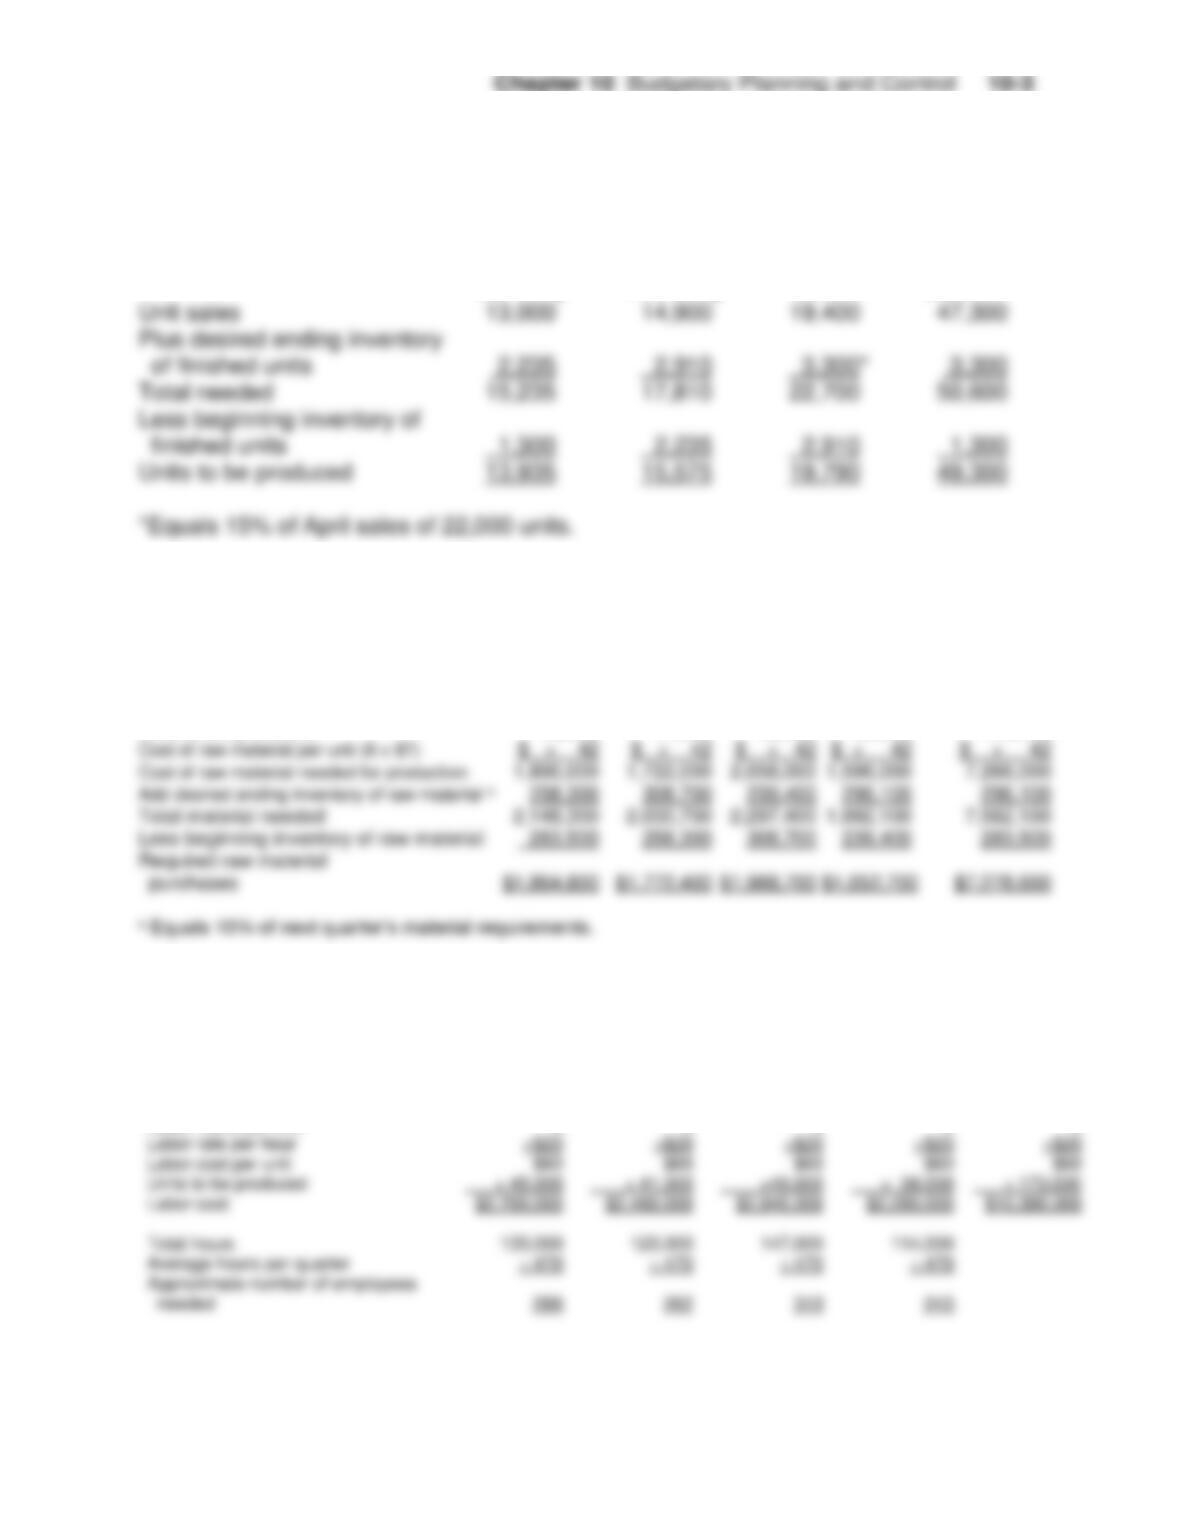
VitaPup
Production Budget
For the months of January, February, and March
January February March Quarter
E7. [LO 2]
Roehler Industrial
Direct Materials Purchases Budget
For the Year Ending December 31, 2017
Quarter 1 Quarter 2 Quarter 3 Quarter 4 Year
Units to be produced 45,000 41,000 49,000 38,000 173,000
E8. [LO 2]
Roehler Industrial
Direct Labor Budget
For the Year Ending December 31, 2017
Quarter 1
Quarter 2
Quarter 3
Quarter 4
Year
Labor hours per unit
3
3
3
3
3
Labor cost per unit
Units to be produced
Labor cost
Average hours per quarter
Approximate number of employees
Jiambalvo Managerial Accounting
10-4
E9. [LO 2]
Roehler Industrial
Manufacturing Overhead Budget
For the Year Ending December 31, 2017
Quarter 1
Quarter 2
Quarter 3
Quarter 4
Year
Units to be produced
45,000
41,000
49,000
38,000
173,000
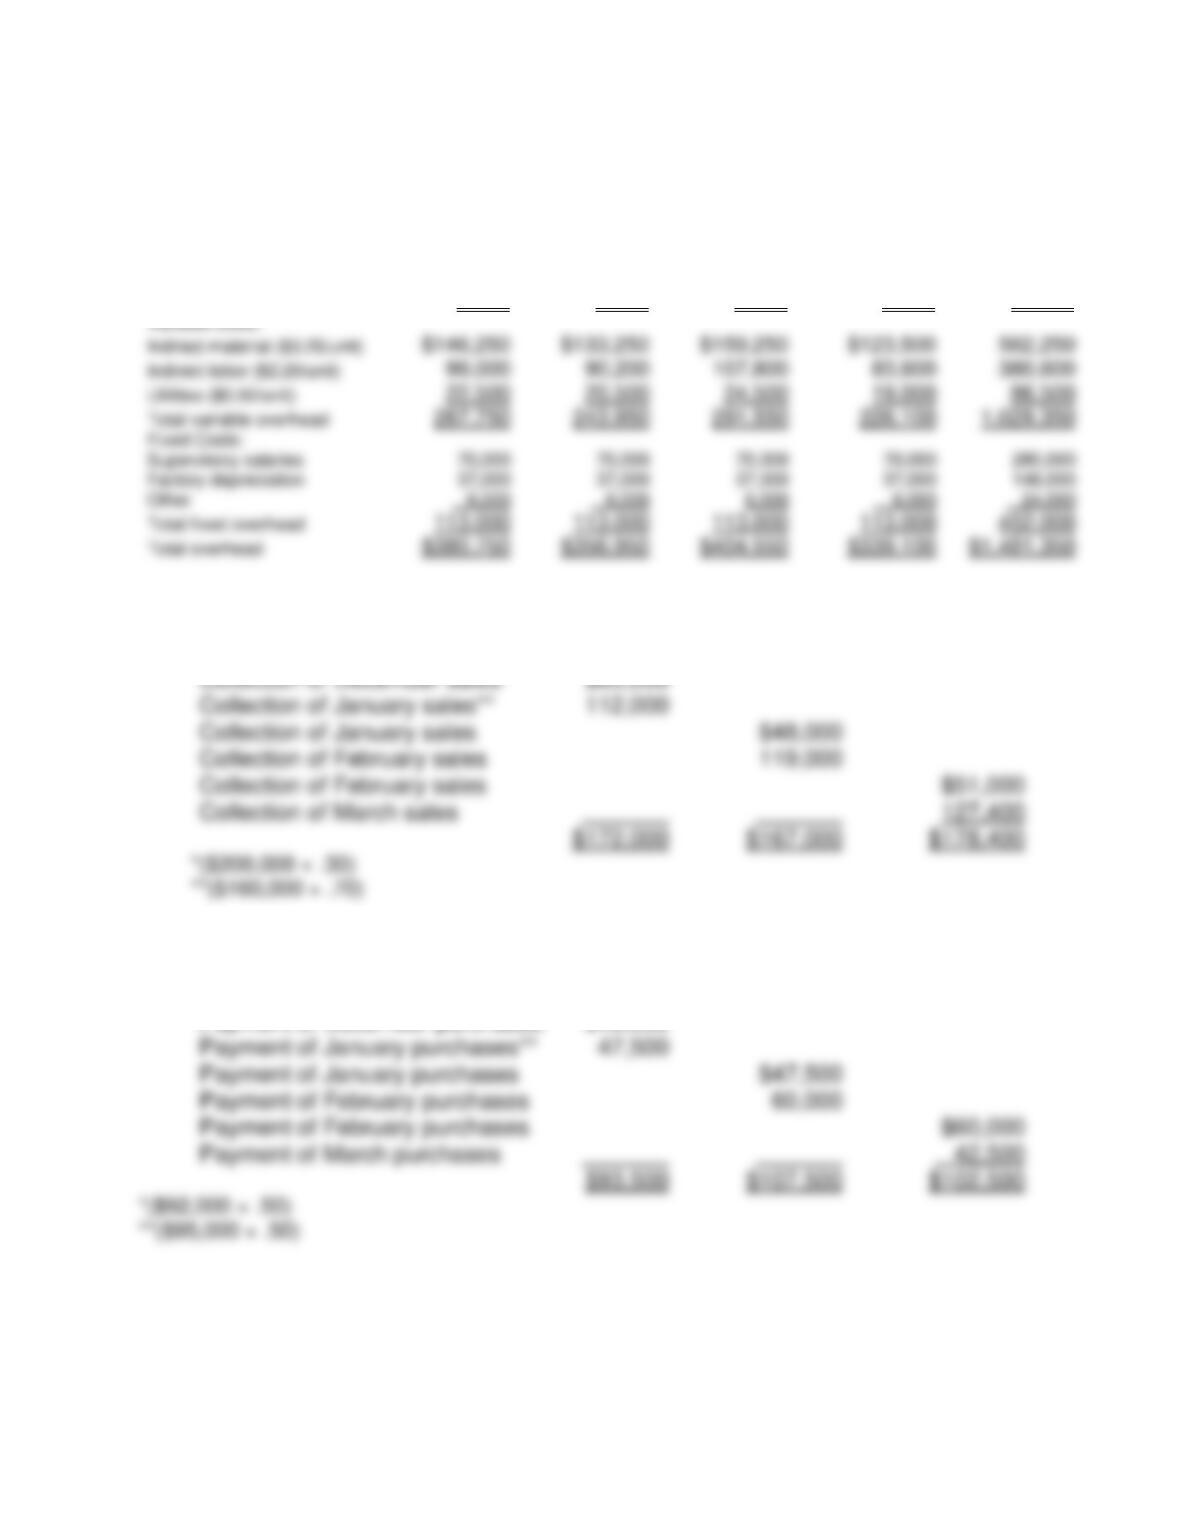
E10. [LO 2]
January February March
Collection of credit sales
E11. [LO 2]
Cash disbursements
for purchases January February March
Payment of December purchases* $46,000
Indirect material ($3.25/unit)
Utilities ($0.50/unit)
Total variable overhead
Supervisory salaries
70,000
70,000
70,000
70,000
280,000
Factory depreciation
37,000
37,000
37,000
37,000
148,000
Other
6,000
Total fixed overhead
Total overhead
Chapter 10 Budgetary Planning and Control
10-5
E12. [LO 2]
April May June
Collection of credit sales
E13. [LO 2]
Cash disbursements
for purchases April May June
Payment of March purchases* $16,500
E14. [LO 3]
Variable costs:
Direct material $ 8.00
Direct labor 3.50
Jiambalvo Managerial Accounting
10-6
E15. [LO 3]
Flexible
Budget Actual Variance
Number of units 13,000 13,000 0
E16. [LO 2, 3]
The following performance report assumes that material and labor are variable
costs and the remaining costs are fixed.
Flexible
Budget Actual Difference
Sales $660,000 $660,000 $ 0
Variable costs:
E17. [LO 3]
Walter has an incentive to understate revenue and overstate expense in his
Chapter 10 Budgetary Planning and Control
10-7
PROBLEMS
P1. [LO 2]
Preston Manufacturing Company
Budgeted Income Statement for the Quarter
Ended March 31, 2018
a.
Sales $616,000 12% increase over prior quarter
b.
Preston Manufacturing Company
Cash Budget
For the Quarter Ended March 31, 2018
Cash collected from sales:
(.4 x $550,000) + (.6 x $616,000) $589,600
Cash payments:
Payment of material
Jiambalvo Managerial Accounting
10-8
c.
Preston Manufacturing Company
Budgeted Balance Sheet
March 31, 2018
Assets:
Cash $ 197,786
P2. [LO 2]
a
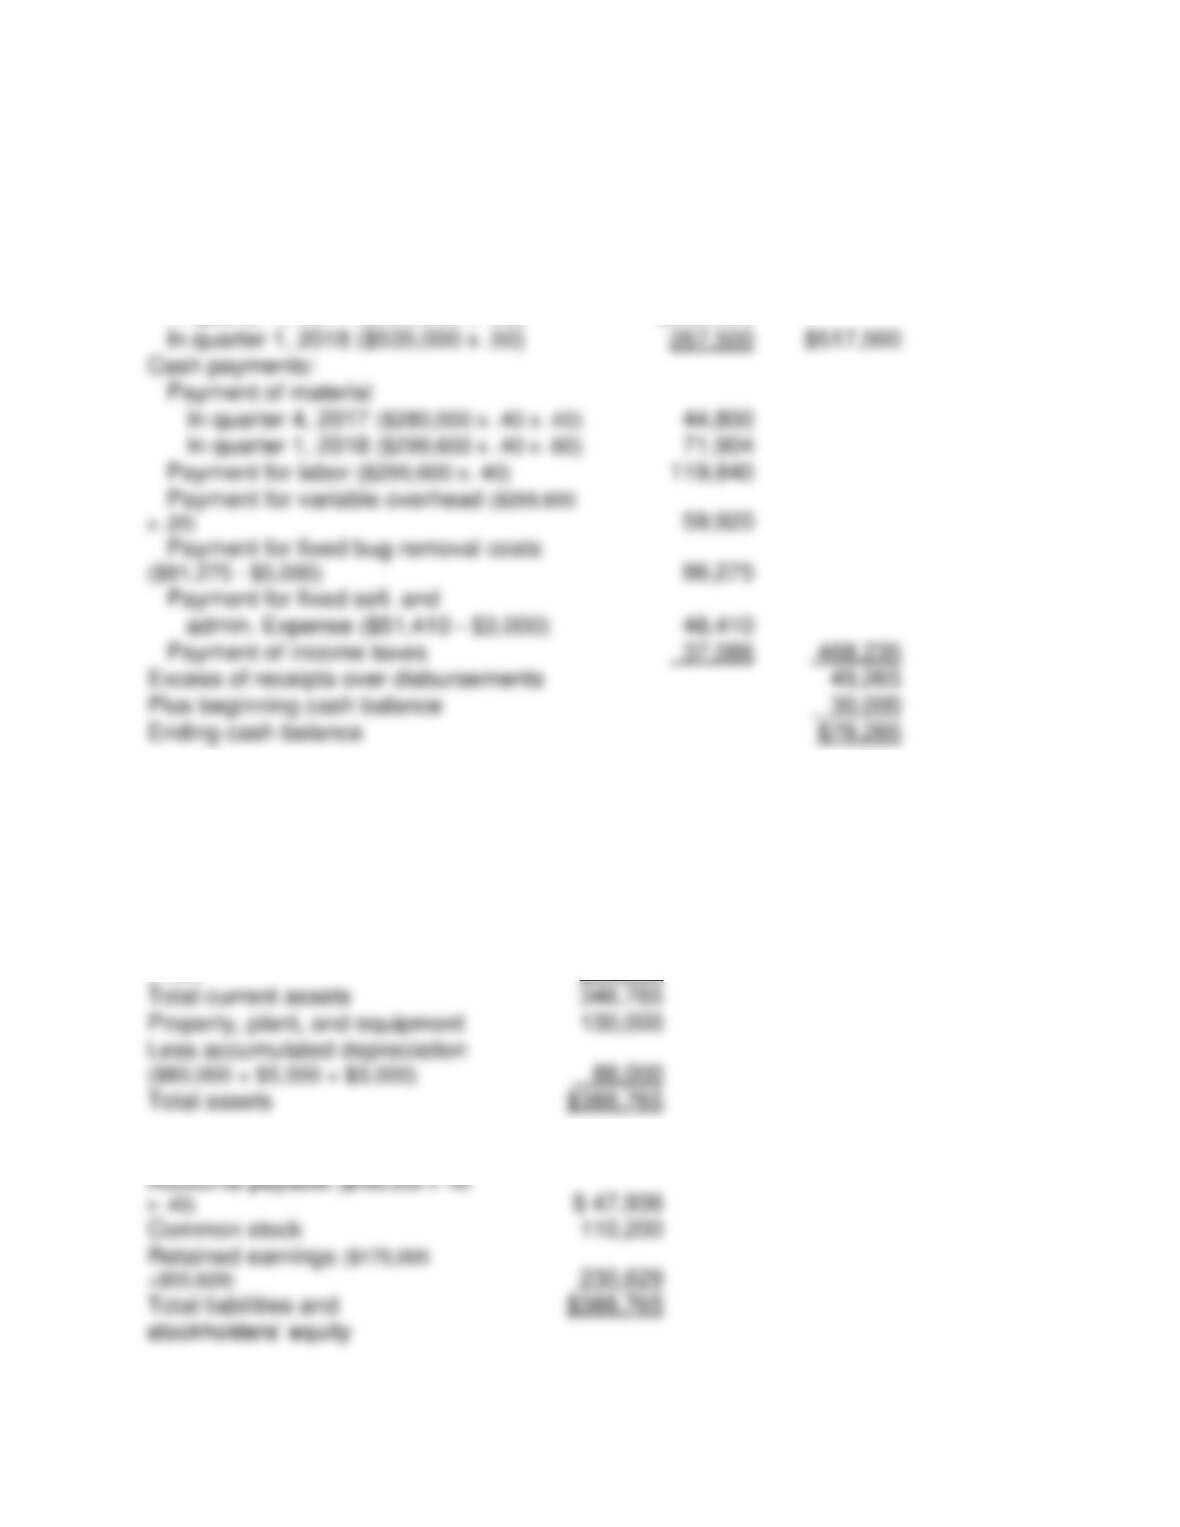
Garret Bug Spray Manufacturing Company
Budgeted Income Statement
For the First Quarter of 2018
Sales of bug spray ($500,000 × 1.07)
$535,000
Less variable cost of goods sold ($280,000 × 1.07)
Income before taxes
Less taxes on income
Net income
Chapter 10 Budgetary Planning and Control
10-9
b.
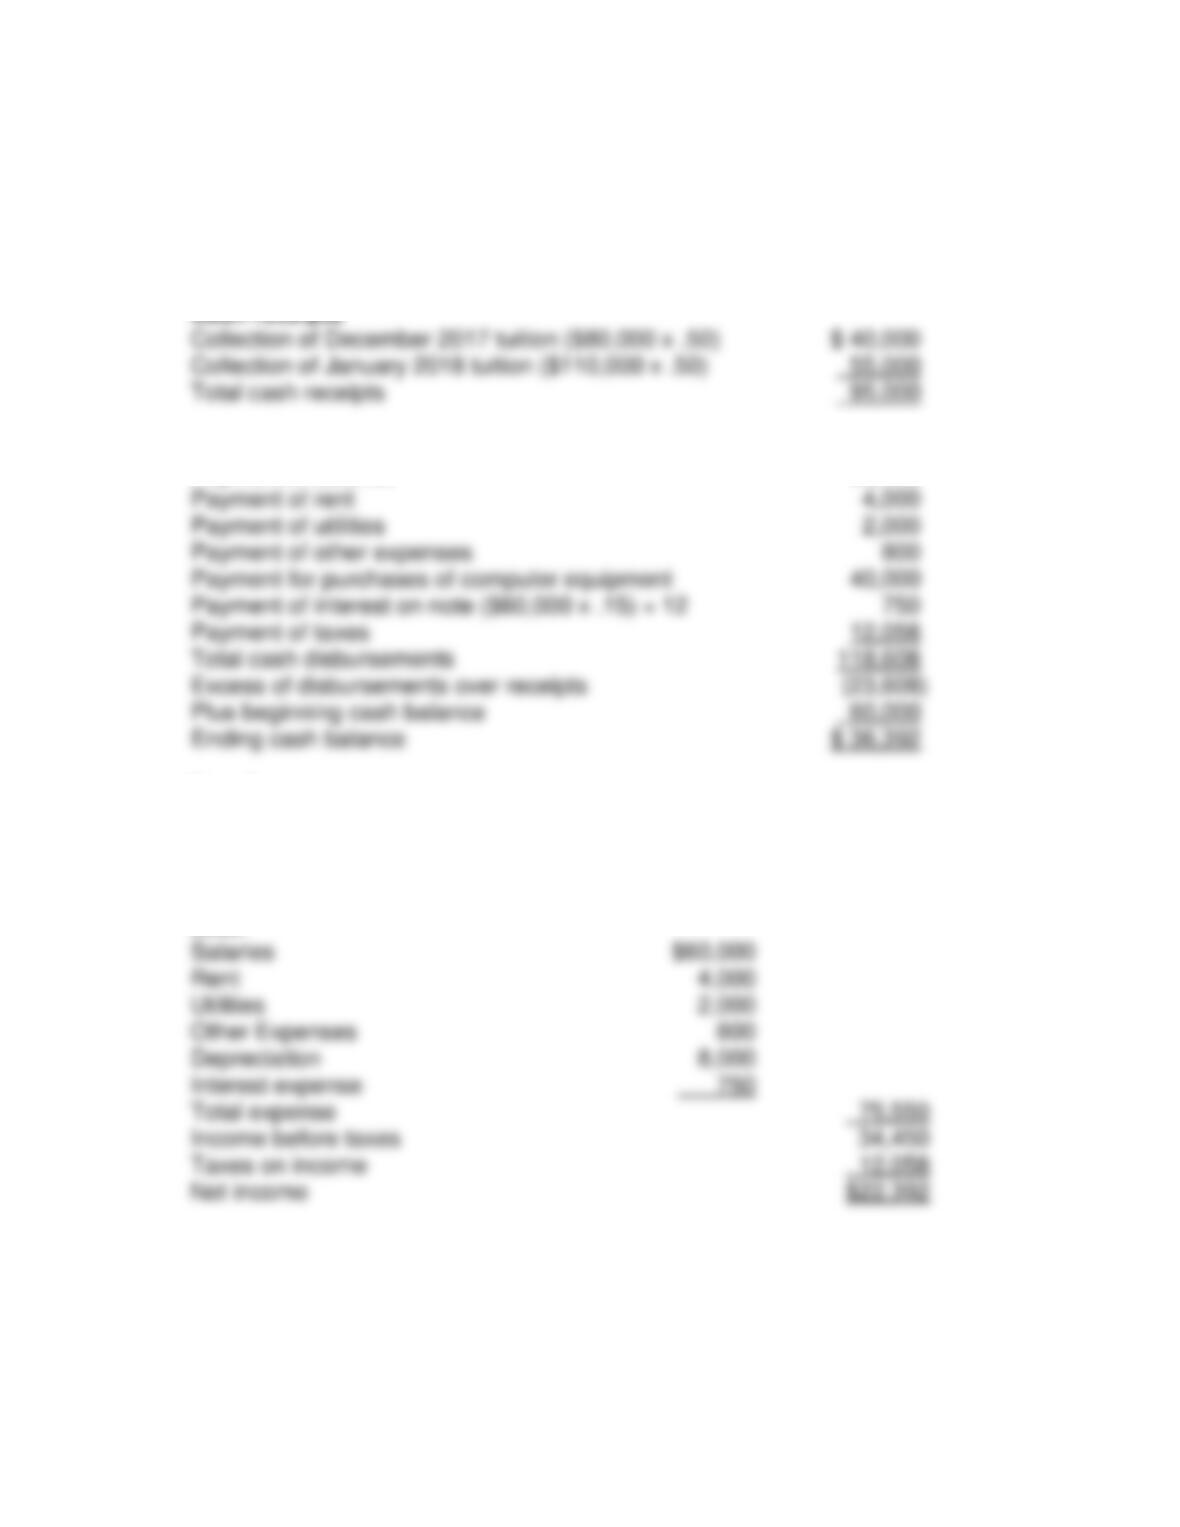
Garret Bug Spray Manufacturing Company
Cash Budget
For the First Quarter, 2018
Cash collected from sales:
In quarter 4, 2017 ($500,000 x .50)
$250,000
c.
Garret Bug Spray Manufacturing Company
Budgeted Balance Sheet
For the First Quarter, 2018
Assets:
Cash
$79,265
Accounts receivable ($535,000
x .50)
267,500
Total current assets
346,765
Property, plant, and equipment
130,000
Total assets
$388,765
Liabilities and stockholders’ equity
Common stock
110,200
Total liabilities and
$388,765
In quarter 1, 2018 ($535,000 x .50)
Cash payments:
Payment of material
In quarter 4, 2017 ($280,000 x .40 x .40)
In quarter 1, 2018 ($299,600 x .40 x .60)
Payment for labor ($299,600 x. 40)
admin. Expense ($51,410 – $3,000)
Payment of income taxes
Excess of receipts over disbursements
Plus beginning cash balance
Ending cash balance
Jiambalvo Managerial Accounting
10–10
P3. [LO 2]
Part A:
TechLabs Cash Budget
For January 2018
Cash Disbursements
Payment of salaries 60,000
Part B.
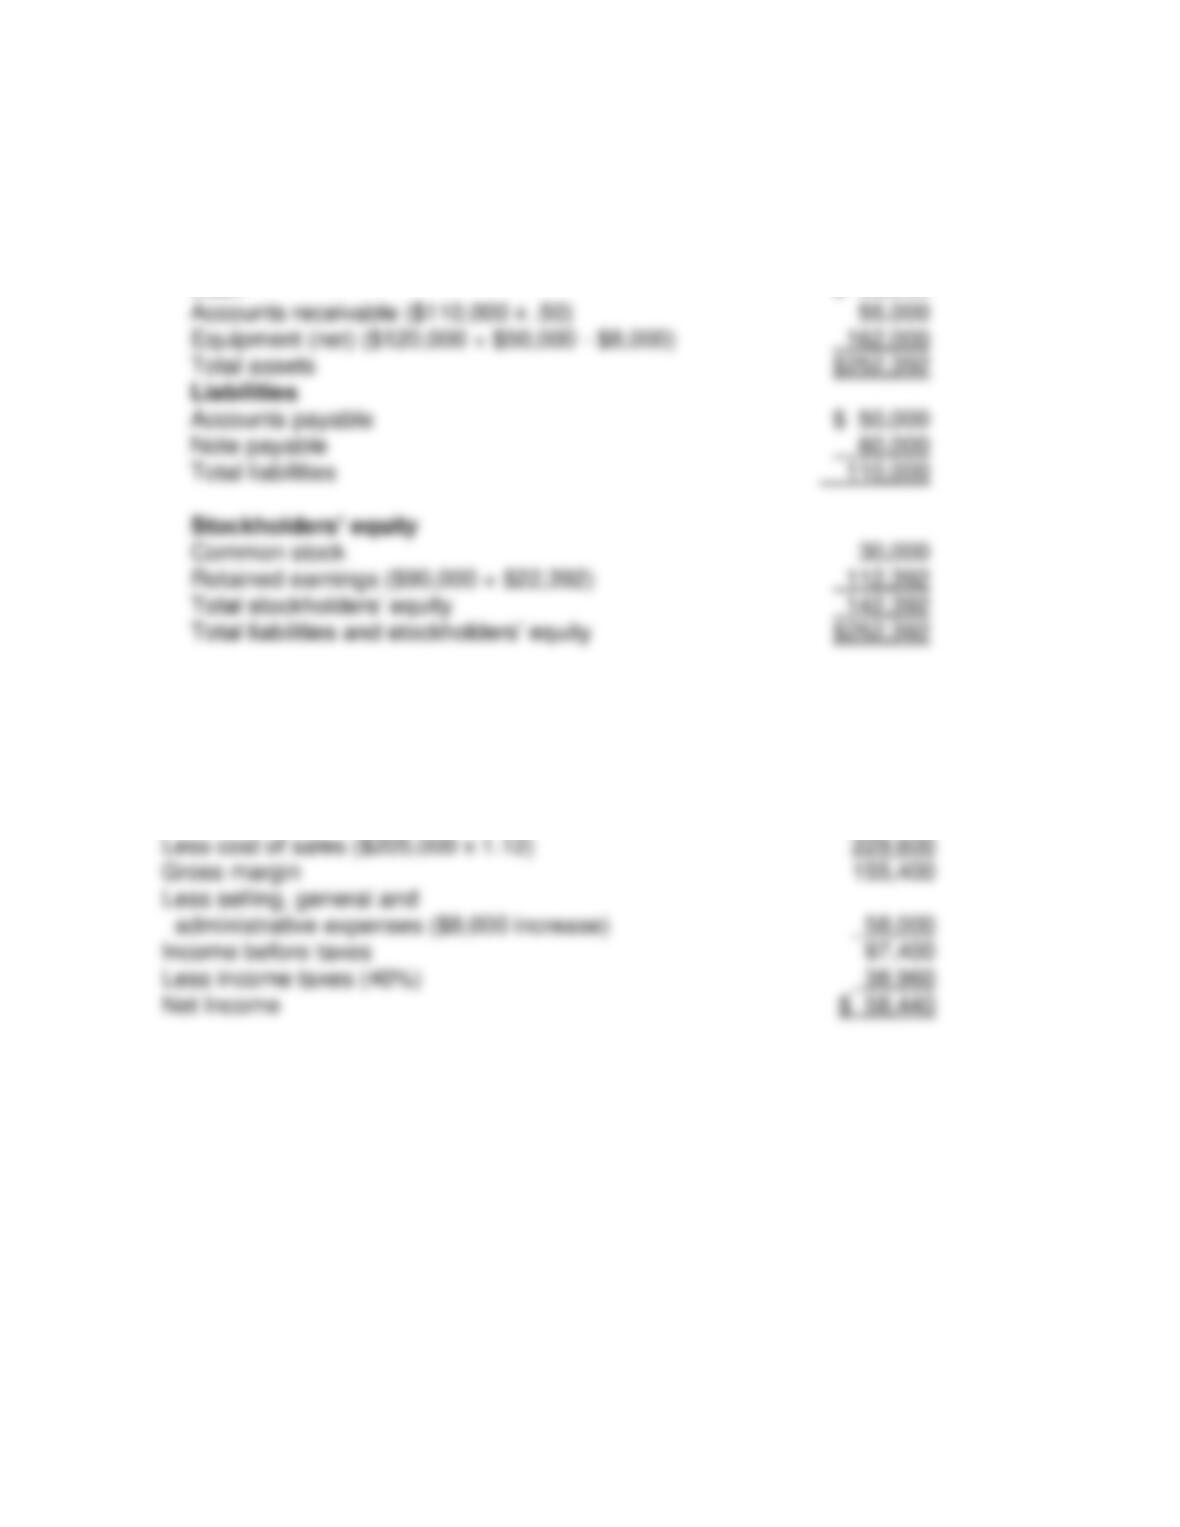
TechLabs Budgeted Income Statement
For January 2018
Tuition revenue $110,000
Less:
Chapter 10 Budgetary Planning and Control
10–11
Part C.
TechLabs Budgeted Balance Sheet
As of January 31, 2018
Assets
Cash $ 35,392
P4. [LO 2]
a. Schrödinger Science Store
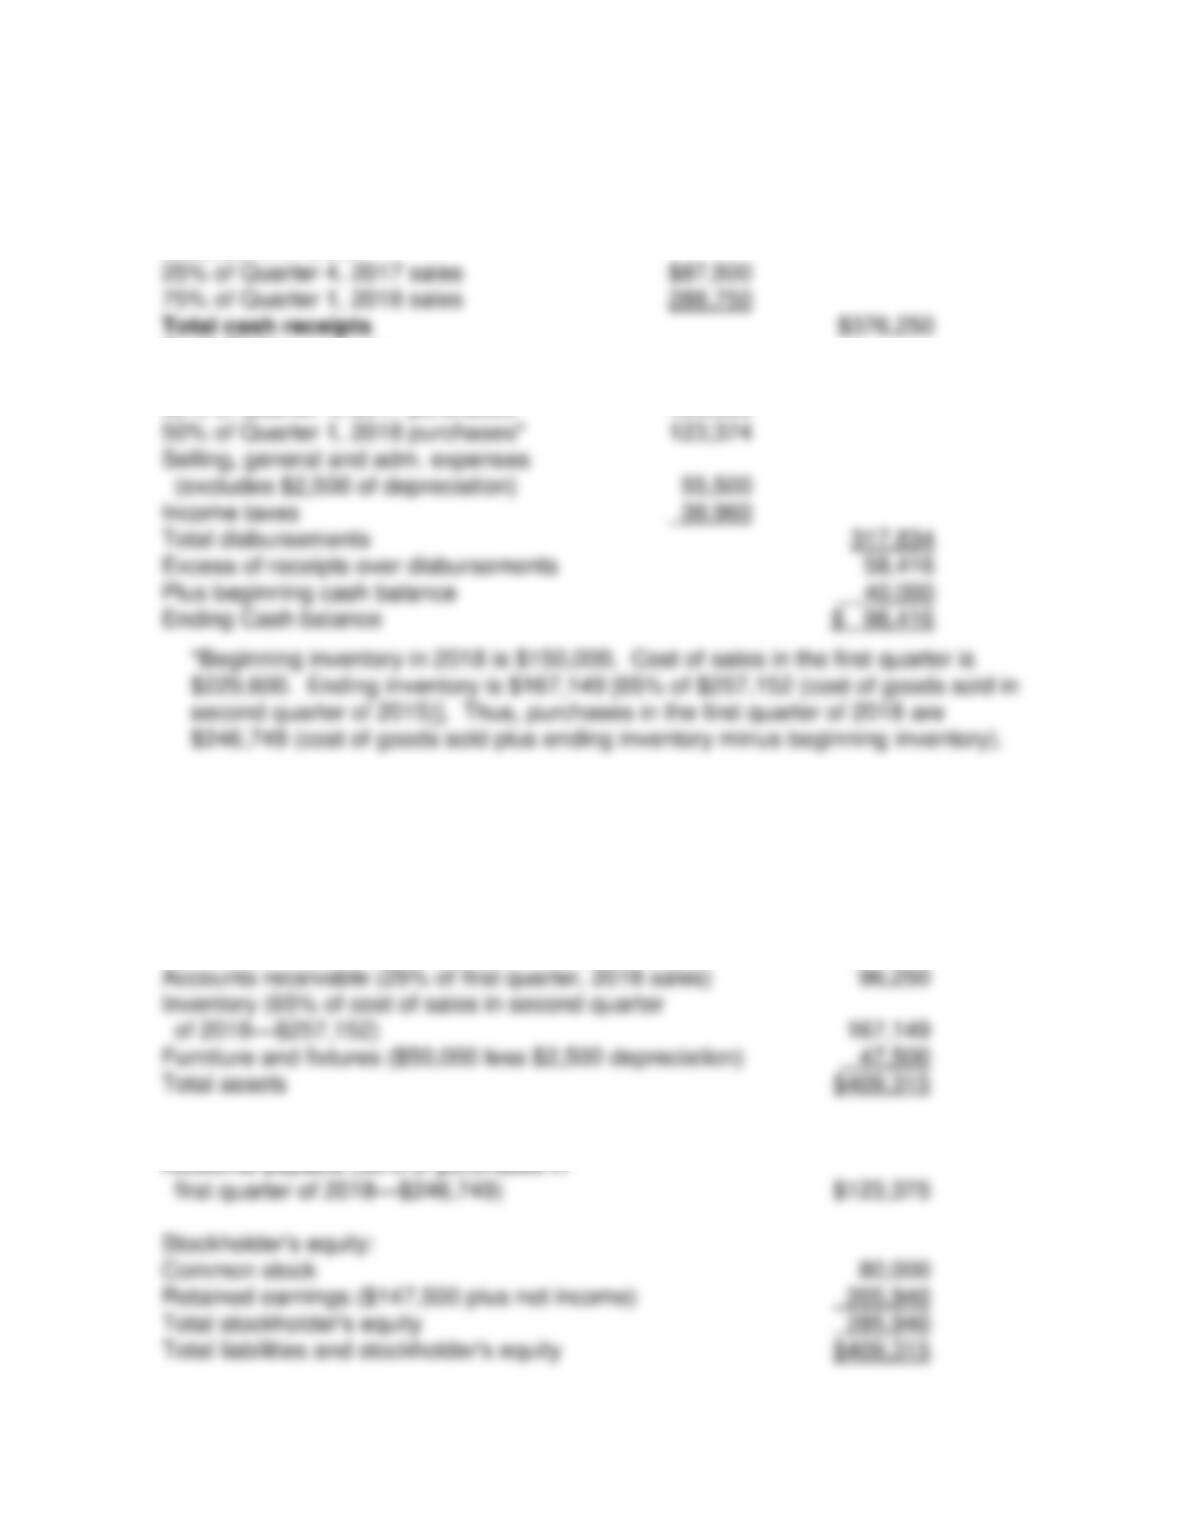
Budgeted Income Statement for the Quarter Ended March 31, 2018
Sales ($350,000 x 1.10)
$385,000
Less cost of sales ($205,000 x 1.12)
Gross margin
Less selling, general and
Income before taxes
Less income taxes (40%)
Net Income
Jiambalvo Managerial Accounting
10–12
b. Schrödinger Science Store
Cash Budget for the Quarter Ended March 31, 2018
Cash Receipts
Collections of sales:
Cash Disbursements
Payment for inventory purchases
50% of Quarter 4, 2017 purchases
100,000
50% of Quarter 1, 2018 purchases*
123,374
Selling, general and adm. expenses
Income taxes
Total disbursements
Excess of receipts over disbursements
Plus beginning cash balance
Ending Cash balance
c.
Schrödinger Science Store
Budgeted Balance Sheet
March 31, 2018
Assets:
Cash (from cash receipts and disbursements budget)
$98,416
Accounts receivable (25% of first quarter, 2018 sales)
Inventory (65% of cost of sales in second quarter
Furniture and fixtures ($50,000 less $2,500 depreciation)
Total assets
Liabilities:
Accounts payable (50% of purchases in
Stockholder’s equity:
Common stock
Retained earnings ($147,500 plus net income)
25% of Quarter 4, 2017 sales
75% of Quarter 1, 2018 sales
288,750
Total cash receipts
Chapter 10 Budgetary Planning and Control
10–13
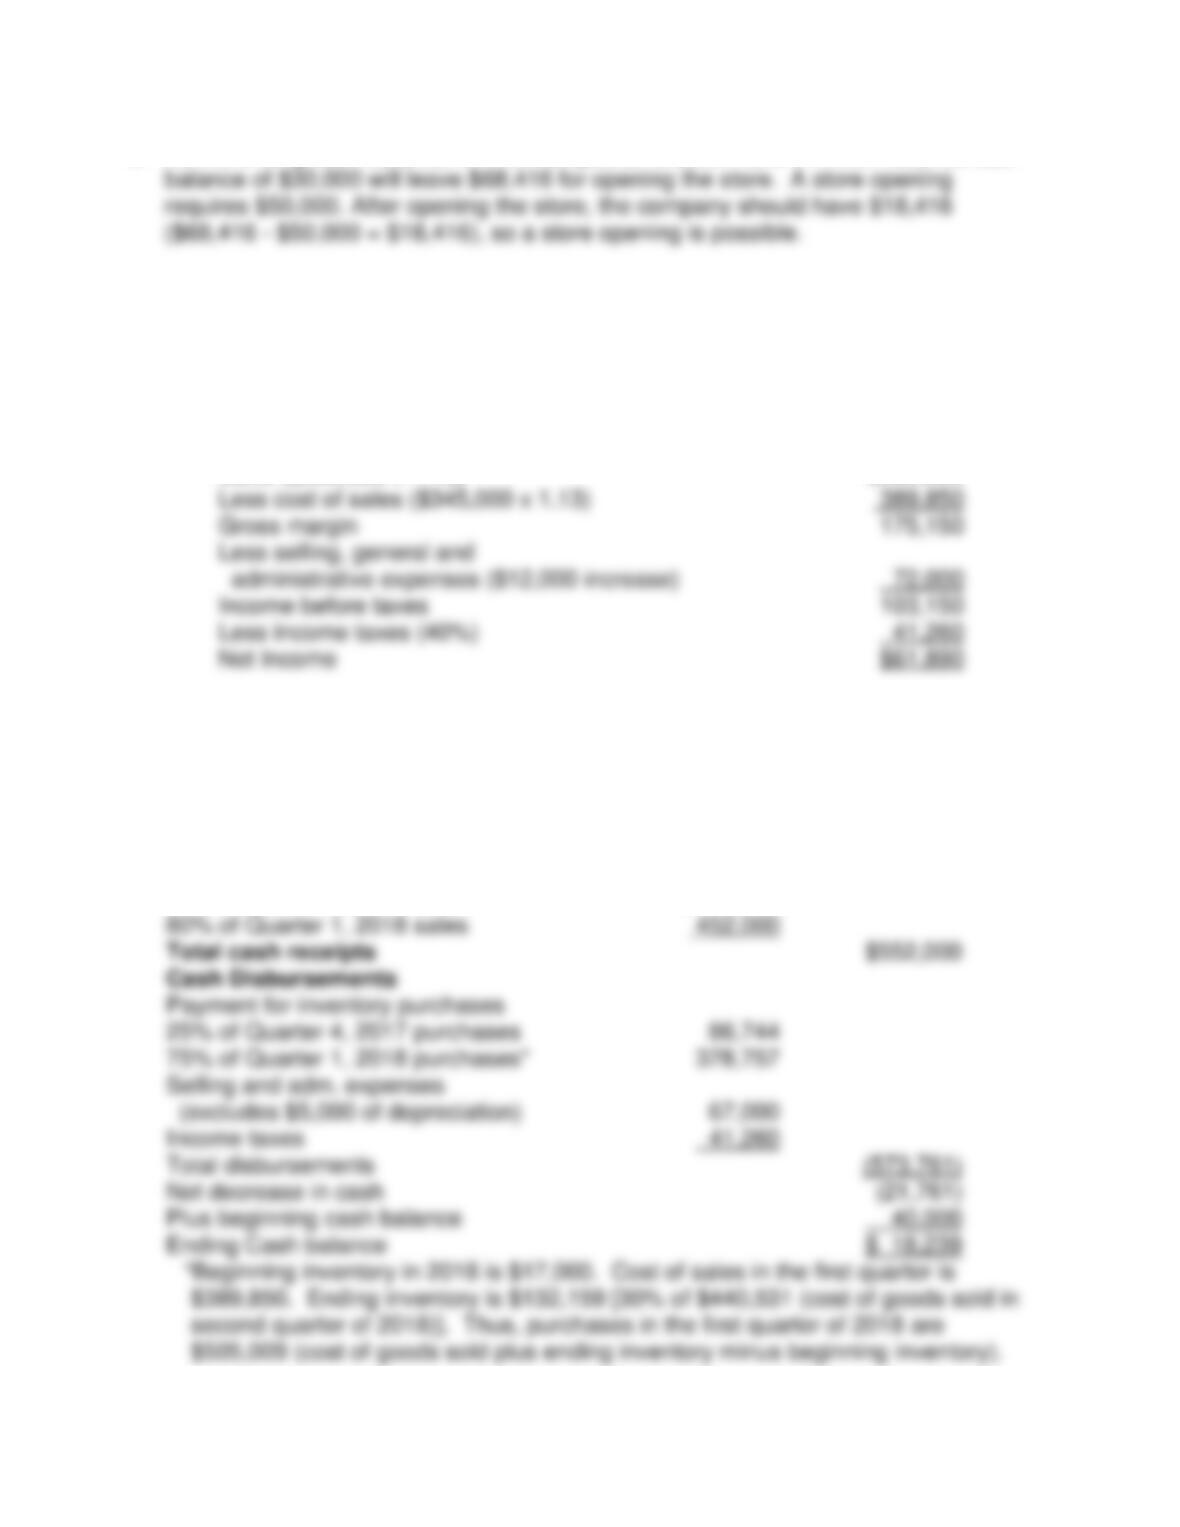
d. As the ending cash balance for the first quarter is $98,416, a minimum desired cash
P5. [LO 2]
a.
The World Restaurant
Budgeted Income Statement
For the First Quarter, 2018
Sales ($500,000 x 1.13)
$565,000
Less cost of sales ($345,000 x 1.13)
Gross margin
Less selling, general and
Income before taxes
Less income taxes (40%)
Net Income
b.
The World Restaurant
Cash Budget
for the First Quarter, 2018
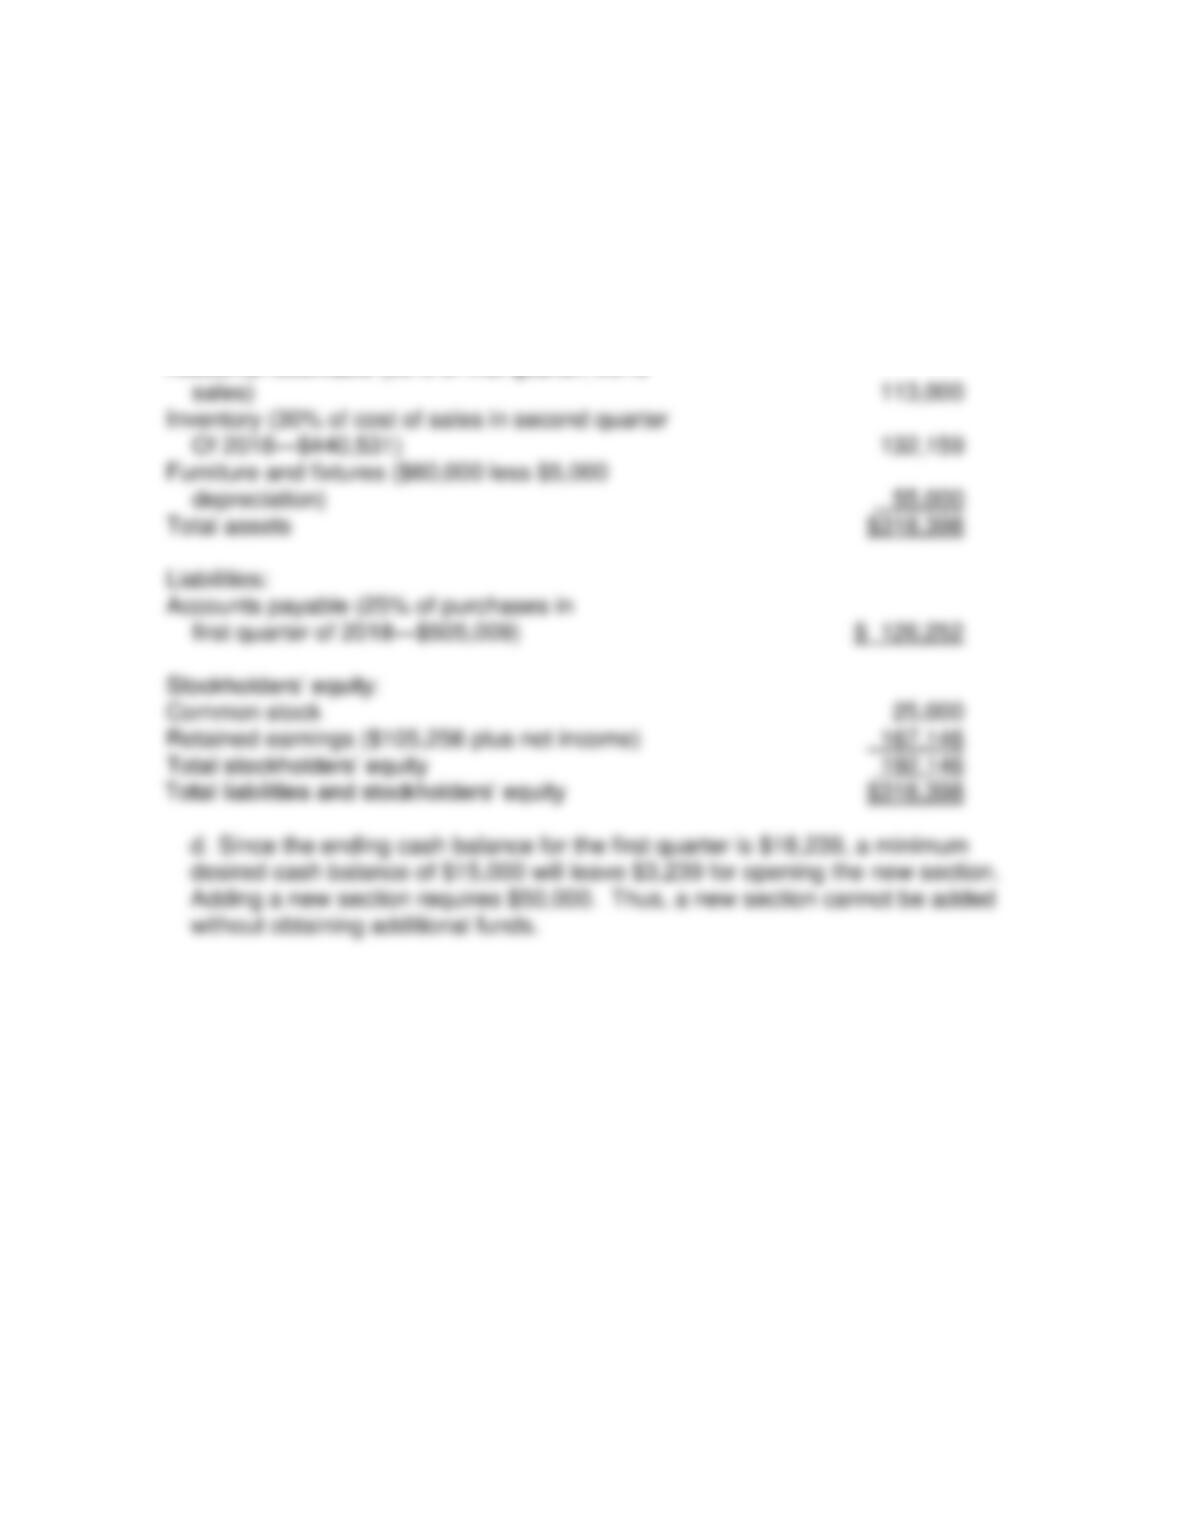
Cash Receipts
Collections of sales:
20% of Quarter 4, 2017 sales
$100,000
80% of Quarter 1, 2018 sales
Total cash receipts
$552,000
Cash Disbursements
Payment for inventory purchases
25% of Quarter 4, 2017 purchases
75% of Quarter 1, 2018 purchases*
Selling and adm. expenses
Income taxes
Total disbursements
Net decrease in cash
Plus beginning cash balance
Ending Cash balance
$ 18,239
Jiambalvo Managerial Accounting
10–14
c.
The World Restaurant
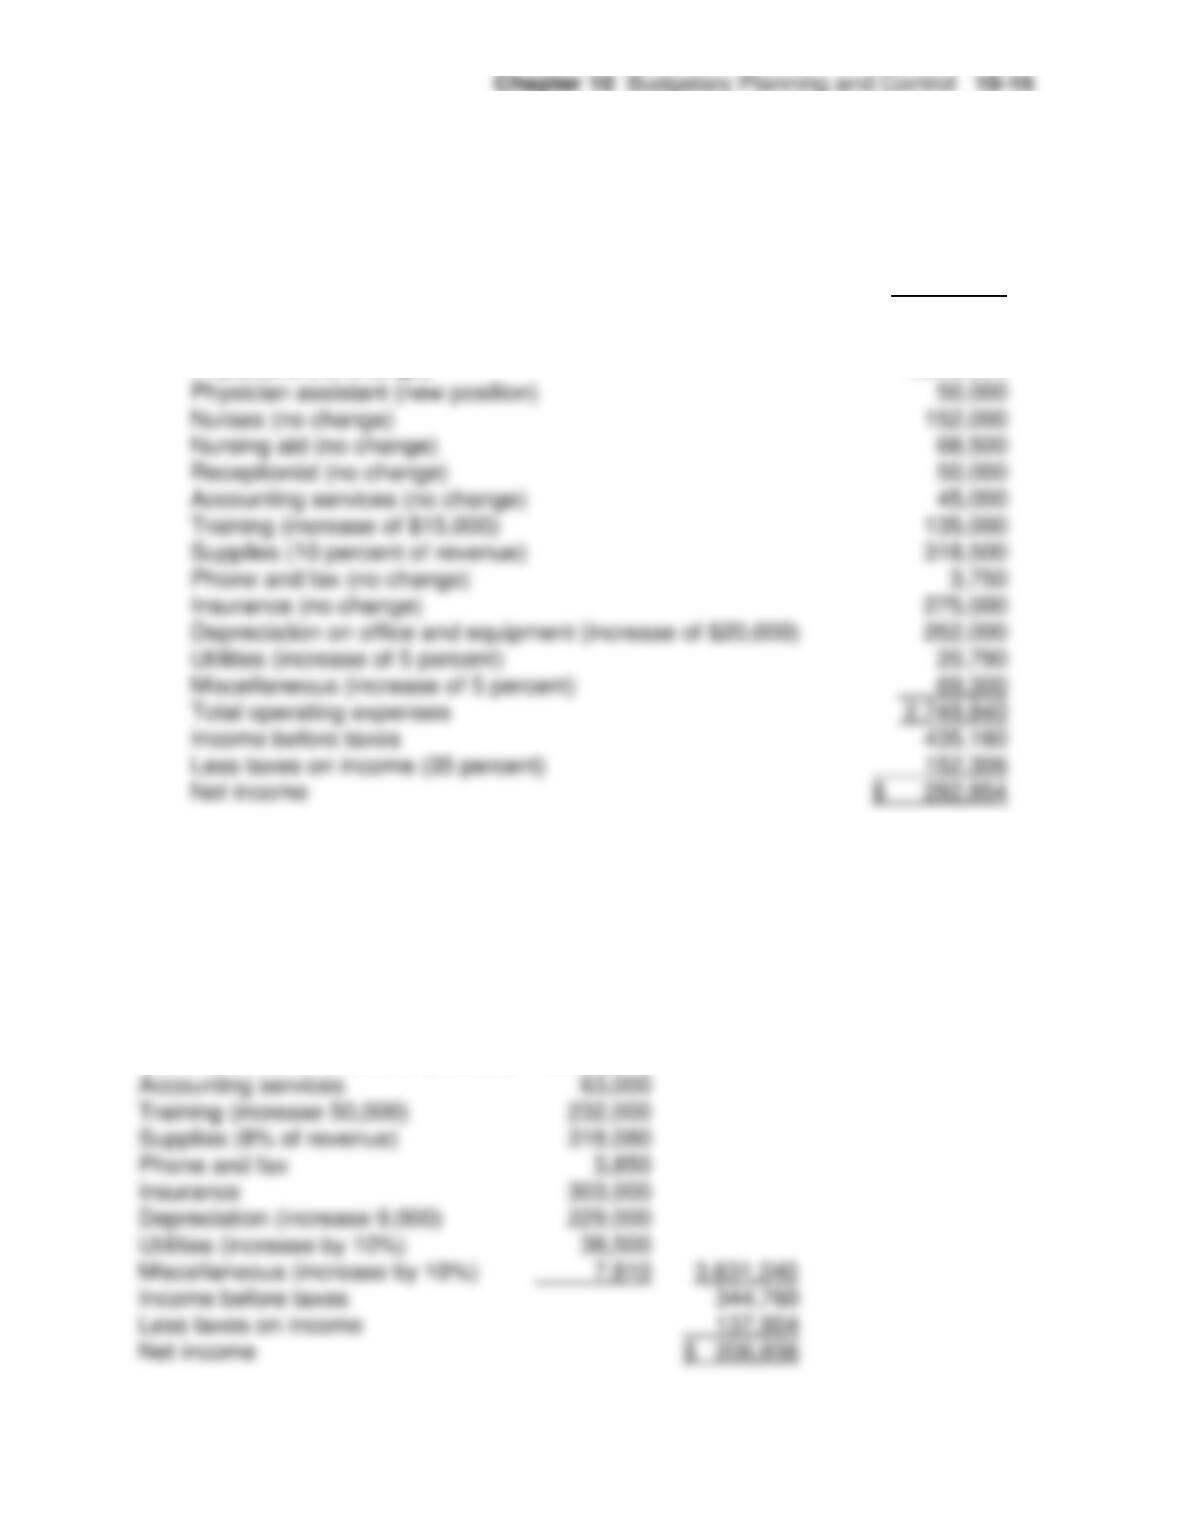
Budgeted Balance Sheet
End of First Quarter, 2018
Assets:
Cash (from cash receipts and disbursements budget)
$ 18,239
Accounts receivable (20% of first quarter, 2018
Inventory (30% of cost of sales in second quarter
Furniture and fixtures ($60,000 less $5,000
Total assets
Liabilities:
Accounts payable (25% of purchases in
Common stock
Retained earnings ($105,256 plus net income)
P6. [LO 2]
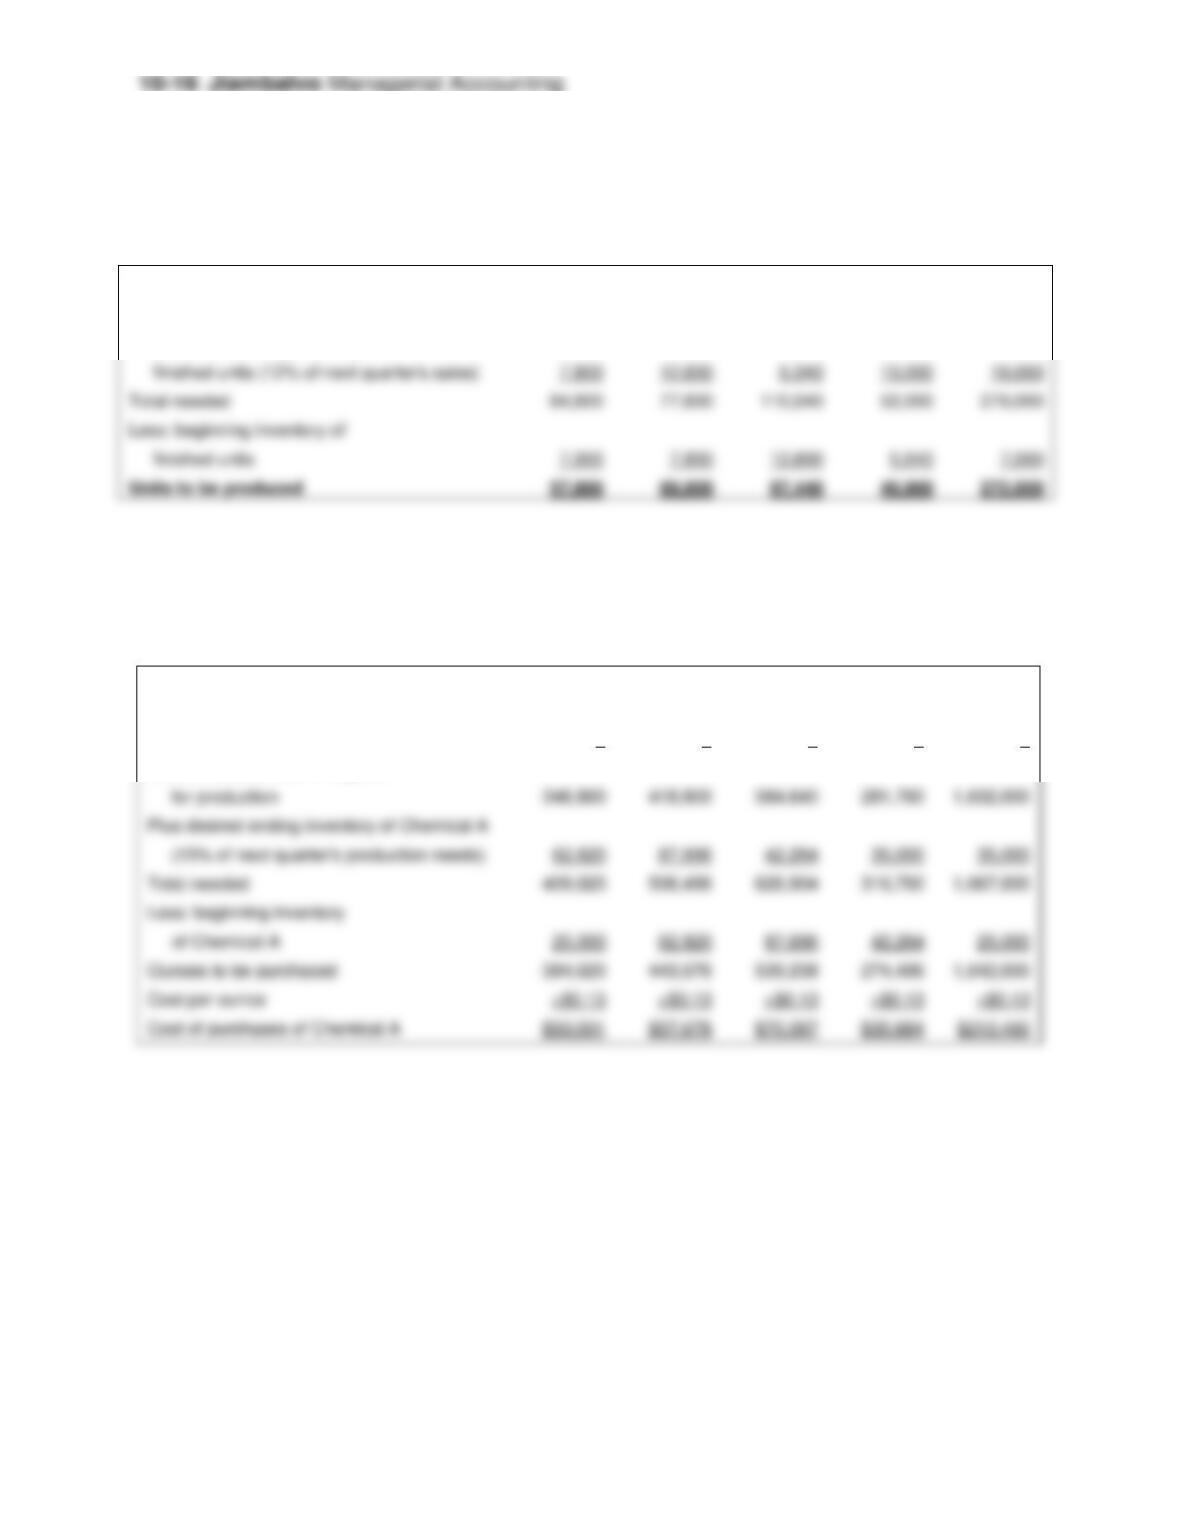
Modern Healthcare
Budgeted Income for the Year 2018
Revenue (decrease of 2 percent) $3,185,000
Less operating expenses:
Salaries
Physicians (no change) 1,300,000
P7. [LO 2]
Pinnacle Engineering
Budgeted Income Statement
For Fiscal Year 2018
Revenue (increase 12%) $3,976,000
Less operating expenses:
Salaries expense (increase $36,000) 2,436,000
P8. [LO 2]
a.
Super Clean, Inc.
Production Budget for 2018
Quarter 1
Quarter 2
Quarter 3
Quarter 4
Year
Unit sales
57,000
65,000
105,000
42,000
269,000
Plus: Desired ending inventory of
12,600
10,000
10,000
Total needed
64,800
77,600
110,040
52,000
279,000
Less: beginning inventory of
12,600
272,000
b.
Super Clean, Inc.
Material Purchases Budget for 2018
Chemical A
Quarter 1
Quarter 2
Quarter 3
Quarter 4
Year
Units to be produced
57,800
69,800
97,440
46,960
272,000
Ounces of Chemical A per unit
6
6
6
6
6
Ounces of Chemical A required
346,800
418,800
584,640
281,760
Plus desired ending inventory of Chemical A
62,820
87,696
42,264
35,000
35,000
Total needed
409,620
506,496
626,904
316,760
Less: beginning inventory
25,000
62,820
87,696
42,264
25,000
Ounces to be purchased
384,620
443,676
539,208
274,496
Cost per ounce
×$0.13
×$0.13
×$0.13
×$0.13
×$0.13
Cost of purchases of Chemical A