CHAPTER 10
SOLUTIONS TO EXERCISES—SET B
EXERCISE 10-1B
(a) MONICA COMPANY
Selling Expense Report
For March
By Month
Year–to–Date
Month
Budget
Actual
Difference
Budget
Actual
Difference
January
$31,000
$29,000
$2,000 F
$ 31,000
$ 29,000
$2,000 F
February
$38,500
$1,500 U
$ 68,000
$ 67,500
March
$37,000
$8,000 F
$104,500
$8,500 F
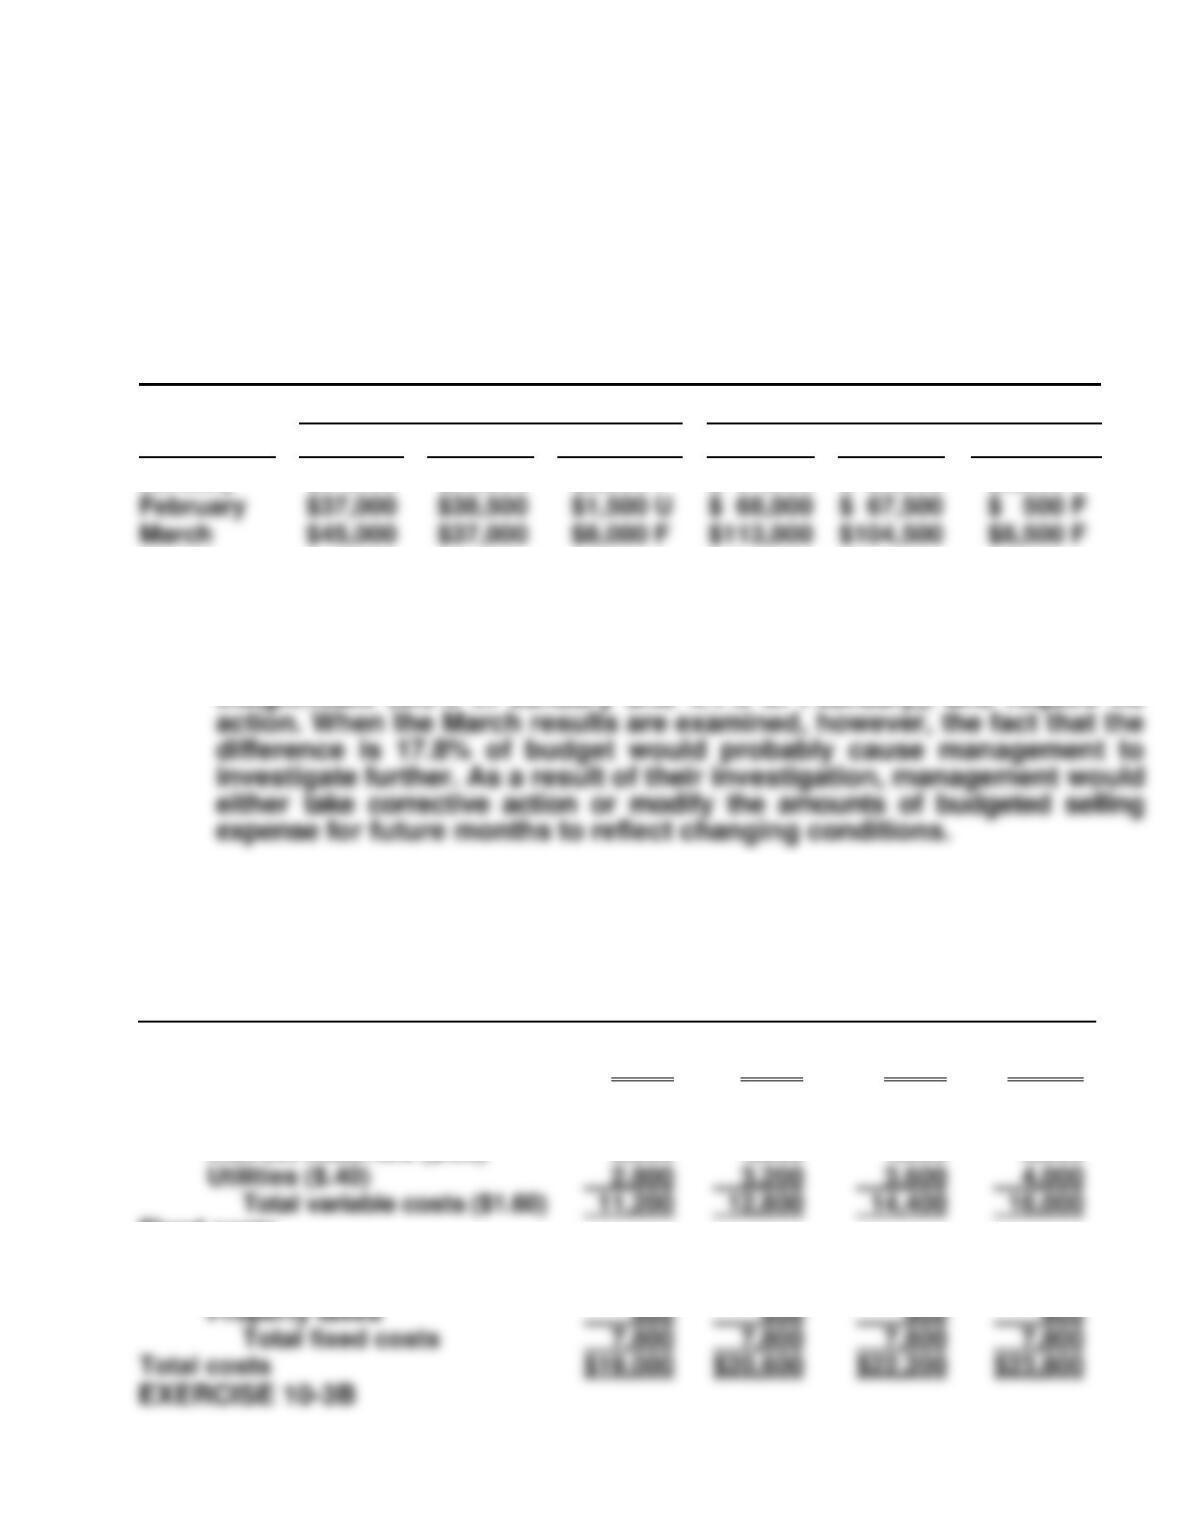
(b) The purpose of the Selling Expense Report is to help management
control selling expenses. The primary recipient is the sales manager.
(c) Most likely, when management scrutinized the results for January and
February, they would determine that the difference was fairly
insignificant (6.5% in January and 4.1% in February), and require no
EXERCISE 10-2B
CUBAN COMPANY
Monthly Flexible Manufacturing Overhead Budget
For the Year 2016
Activity level
Direct labor hours
Variable costs
Indirect labor ($.70)
Indirect materials ($.50)
Fixed costs
Supervision
Depreciation
7,000
$ 4,900
3,500
4,000
3,000
8,000
$ 5,600
4,000
4,000
3,000
9,000
$ 6,300
4,500
4,000
3,000
10,000
$ 7,000
5,000
4,000
3,000
(a) CUBAN COMPANY
Manufacturing Overhead Budget Report (Flexible)
For the Month Ended July 31, 2017
Difference
Direct labor hours (DLH)
Variable costs
Indirect labor ($.70)
Indirect materials ($.50)
Fixed costs
Supervision
Depreciation
Budget at
9,000 DLH
$ 6,300
4,500
4,000
3,000
Actual Costs
9,000 DLH
$ 6,100
4,300
4,000
3,000
Favorable F
Unfavorable U
$200 F
200 F
—
—
(b) CUBAN COMPANY
Manufacturing Overhead Budget Report (Flexible)
For the Month Ended July 31, 2017
Difference
Direct labor hours (DLH)
Variable costs
Indirect labor ($.70)
Indirect materials ($.50)
Fixed costs
Supervision
Budget at
8,500 DLH
$ 5,950
4,250
4,000
Actual Costs
8,500 DLH
$ 6,100
4,300
4,000
Favorable F
Unfavorable U
$150 U
50 U
—
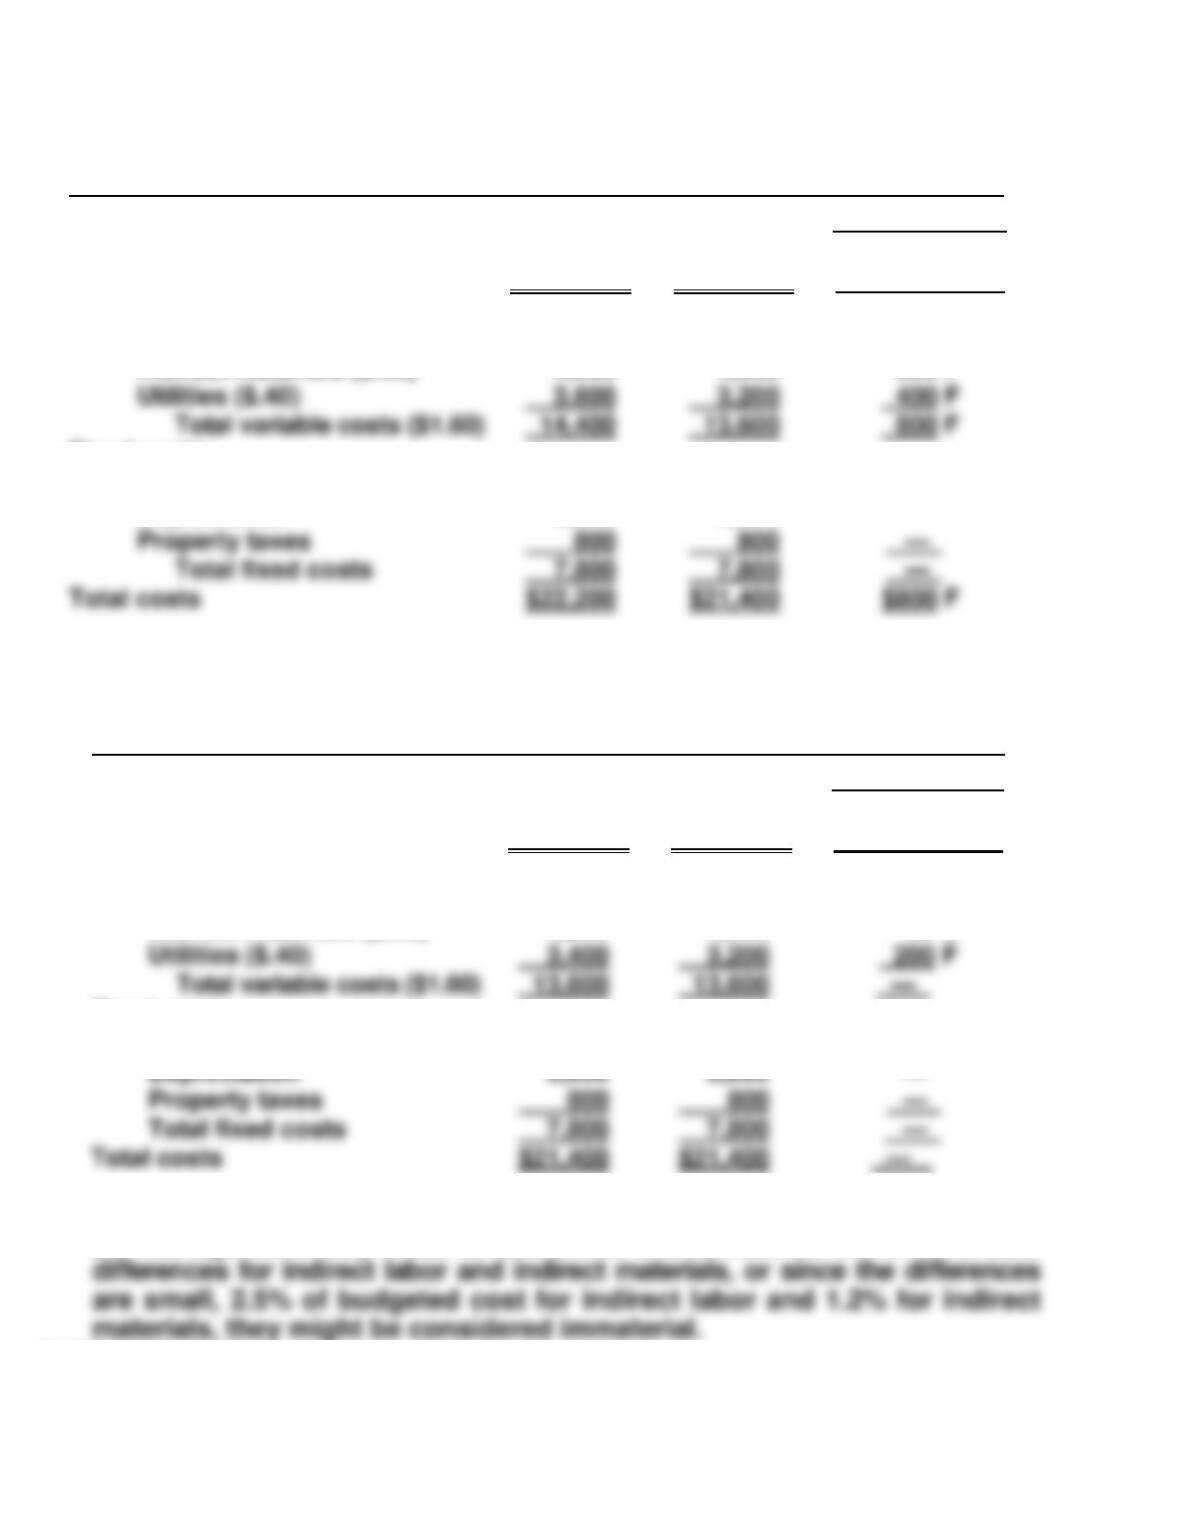
(c) In case (a) the performance for the month was satisfactory. In case
(b) management may need to determine the causes of the unfavorable
EXERCISE 10-4B
PARADISE COMPANY
Monthly Flexible Selling Expense Budget
For the Year 2017
Activity level
Sales
Variable expenses
Sales commissions (6%)
Advertising (4%)
Fixed expenses
Sales salaries
Depreciation
$170,000
$ 10,200
6,800
35,000
7,000
$180,000
$ 10,800
7,200
35,000
7,000
$190,000
$ 11,400
7,600
35,000
7,000
$200,000
$ 12,000
8,000
35,000
7,000
EXERCISE 10-5B
(a) PARADISE COMPANY
Selling Expense Budget Report (Flexible)
For the Month Ended March 31, 2017
Difference
Sales
Variable expenses
Sales commissions
Advertising
Fixed expenses
Sales salaries
Depreciation
Budget
$170,000
$ 10,200
6,800
35,000
7,000
Actual
$170,000
$ 11,000
7,000
35,000
7,000
Favorable F
Unfavorable U
$ 800 U
200 U
0 U
0 U
EXERCISE 10-5B (Continued)
(b) PARADISE COMPANY
Selling Expense Budget Report (Flexible)
For the Month Ended March 31, 2017
Difference
Sales
Variable expenses
Sales commissions
Advertising
Fixed costs
Sales salaries
Depreciation
Budget
$180,000
$ 10,800
7,200
35,000
7,000
Actual
$180,000
$ 11,000
7,000
35,000
7,000
Favorable F
Unfavorable U
$200 U
200 F
0 U
0 U
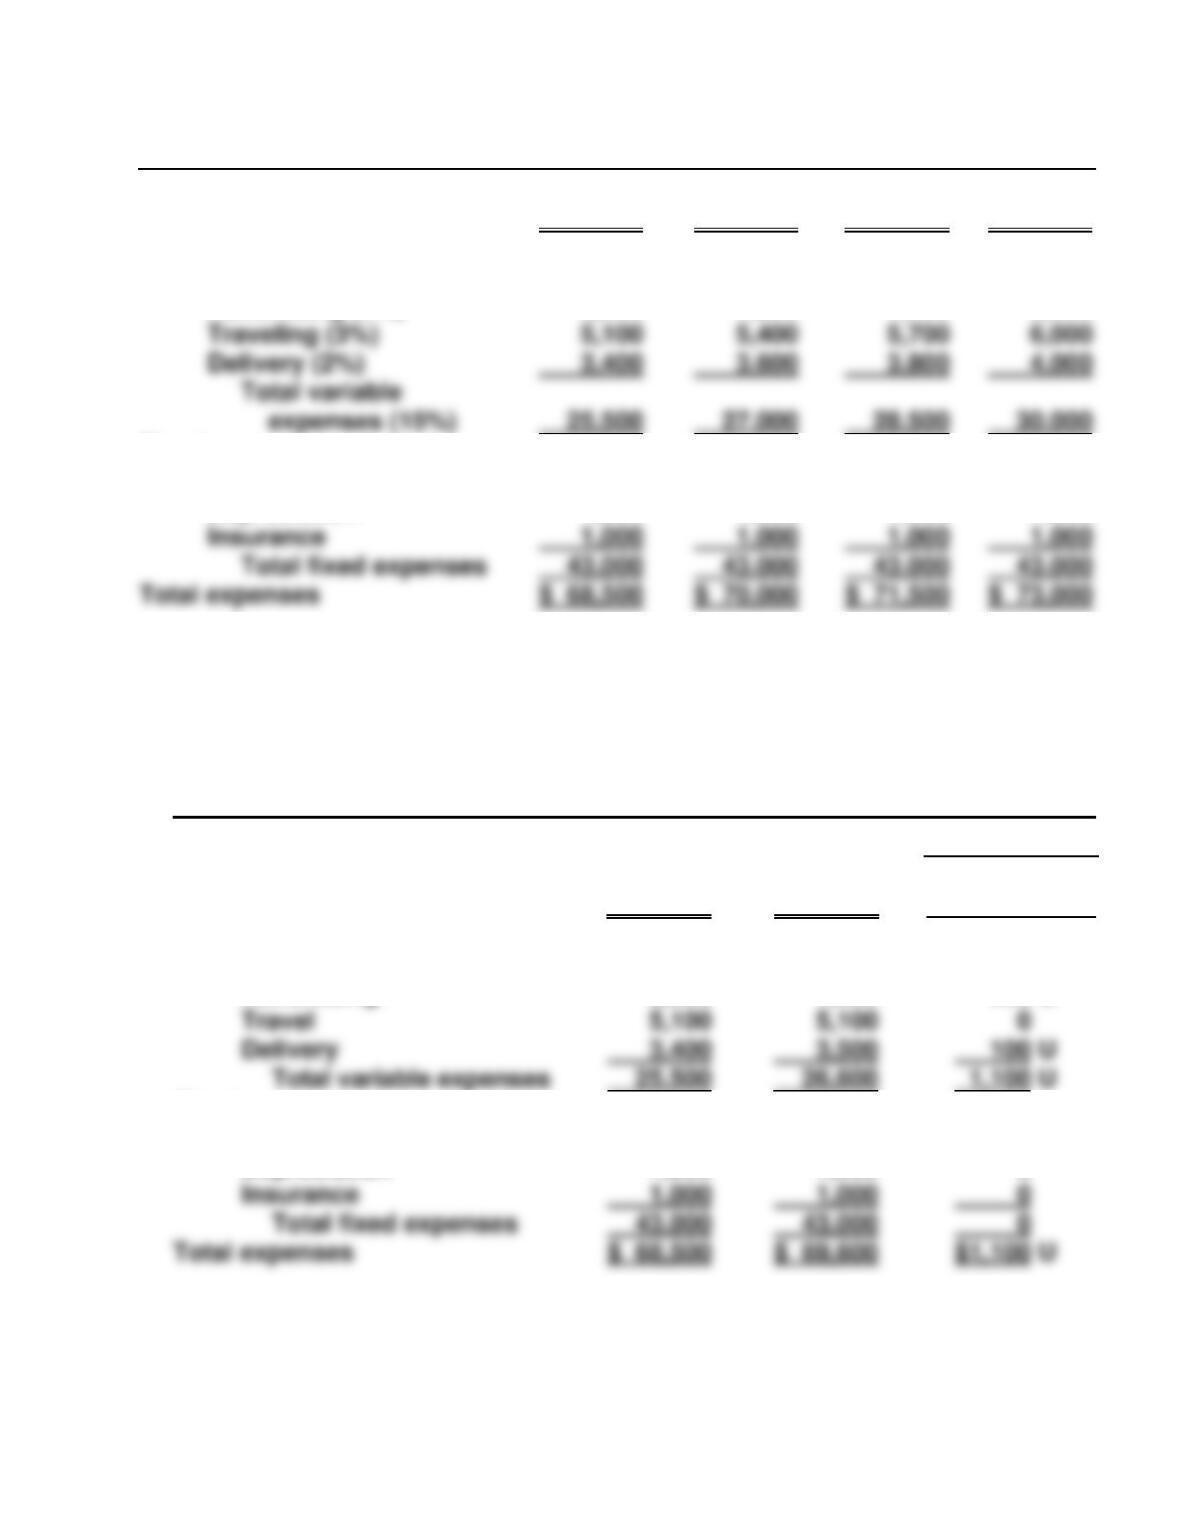
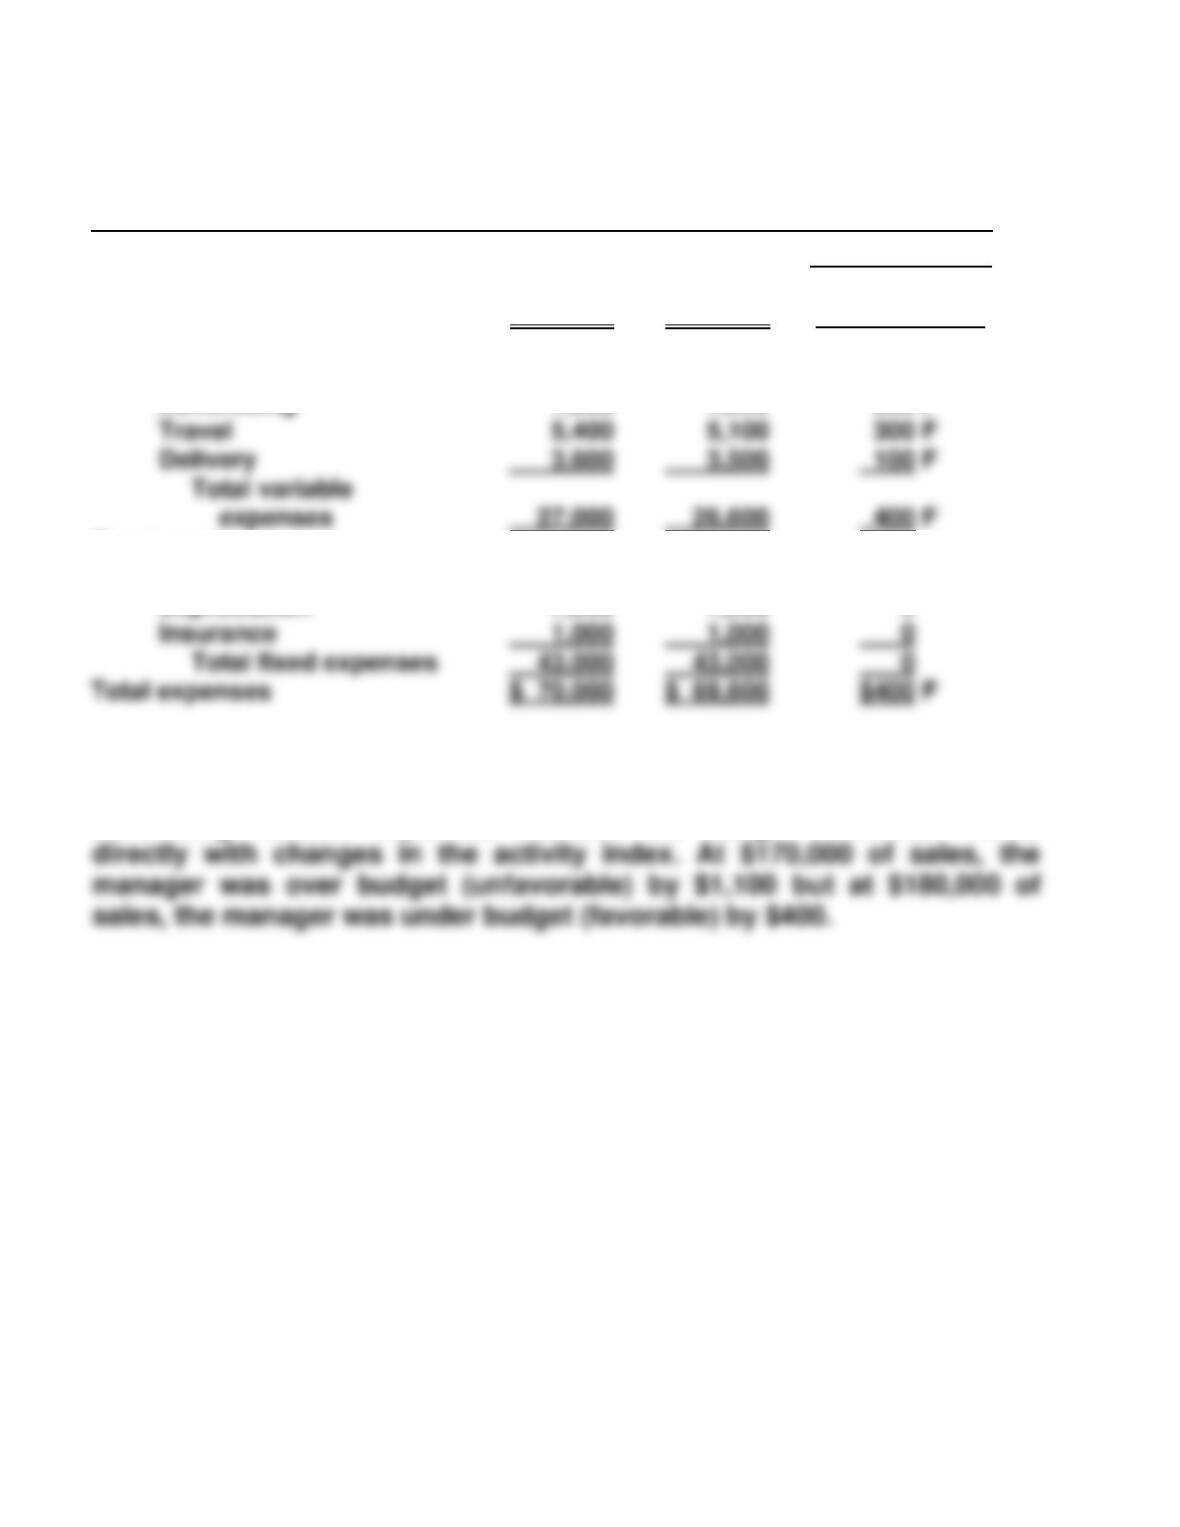
(c) Flexible budgets are essential in evaluating a manager’s performance in
controlling variable expenses because the budget allowance varies
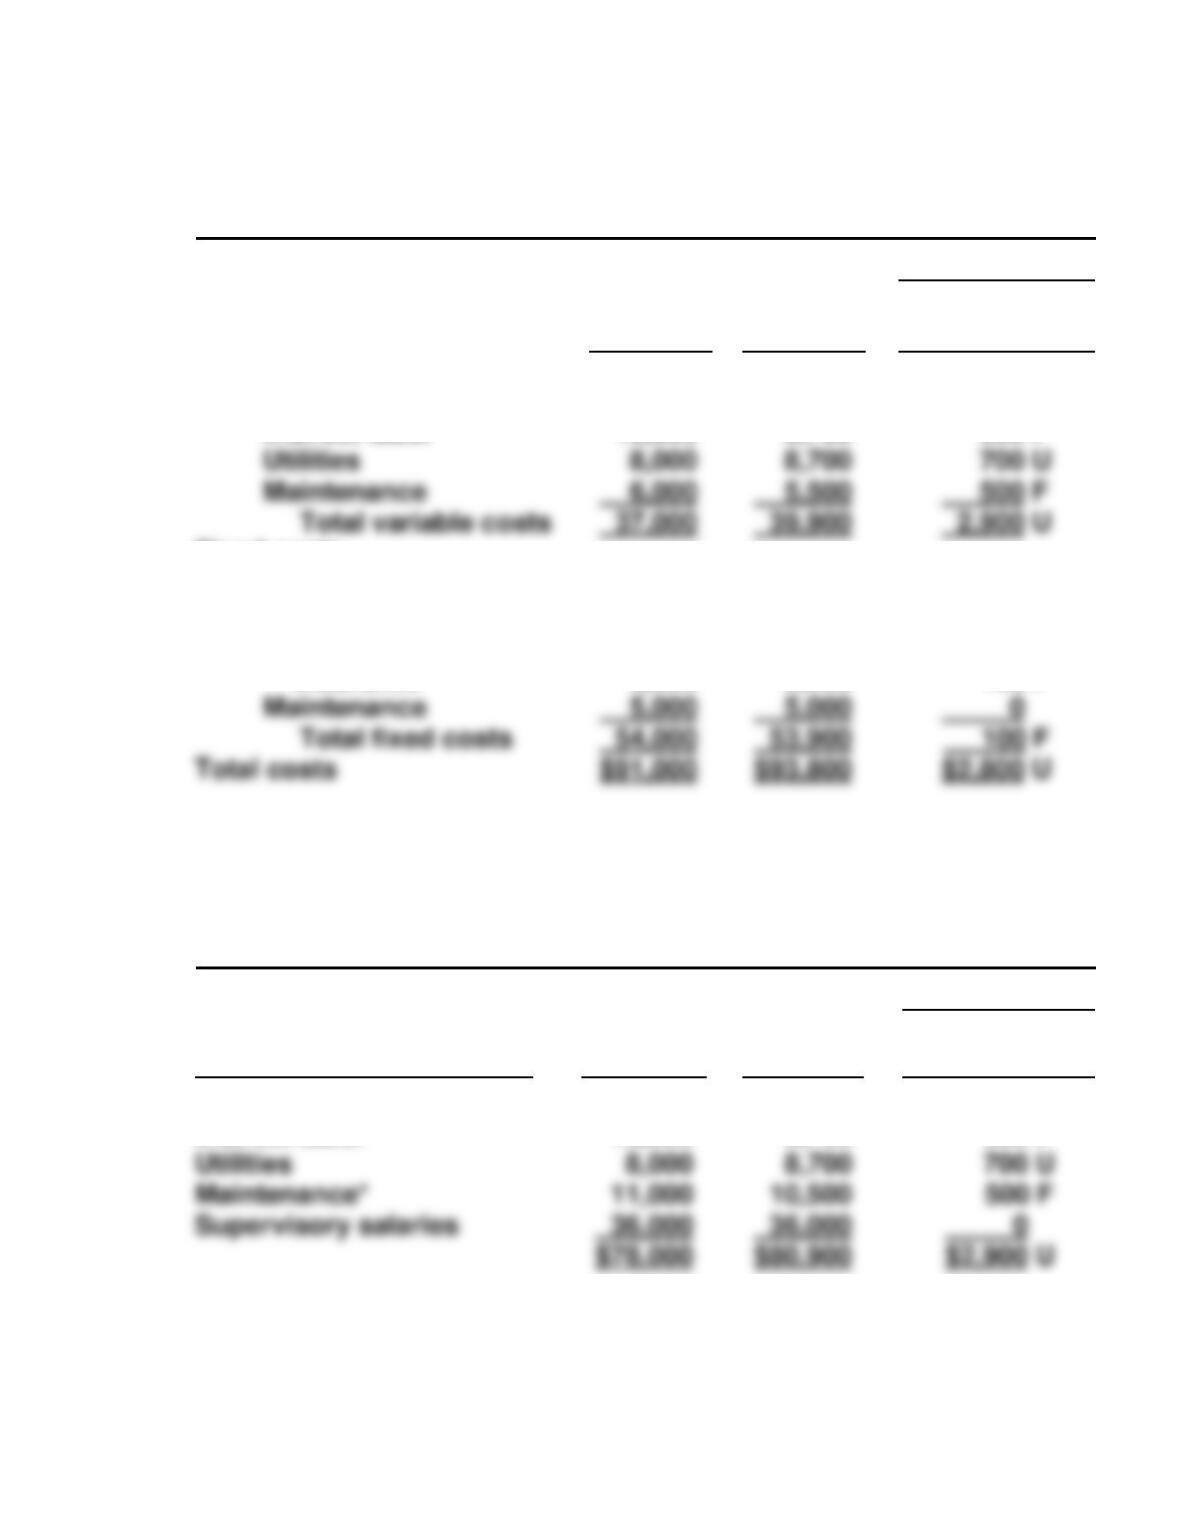
EXERCISE 10-6B
(a) SOPHIA COMPANY
Manufacturing Overhead Budget Report (Flexible)
For the Quarter Ended March 31, 2017
Difference
Budget
Actual
Favorable F
Unfavorable U
Variable costs
Indirect materials
Indirect labor
Fixed costs
Supervisory salaries
Depreciation
Property taxes and
insurance
$13,000
10,000
36,000
7,000
6,000
$16,000
9,700
36,000
7,000
5,900
$3,000 U
300 F
0 U
0 U
100 F
(b) SOPHIA COMPANY
Manufacturing Overhead Responsibility Report
For the Quarter Ended March 31, 2017
Difference
Controllable Costs
Budget
Actual
Favorable F
Unfavorable U
Indirect materials
Indirect labor
$13,000
10,000
$16,000
9,700
$3,000 U
300 F
*Includes variable and fixed costs
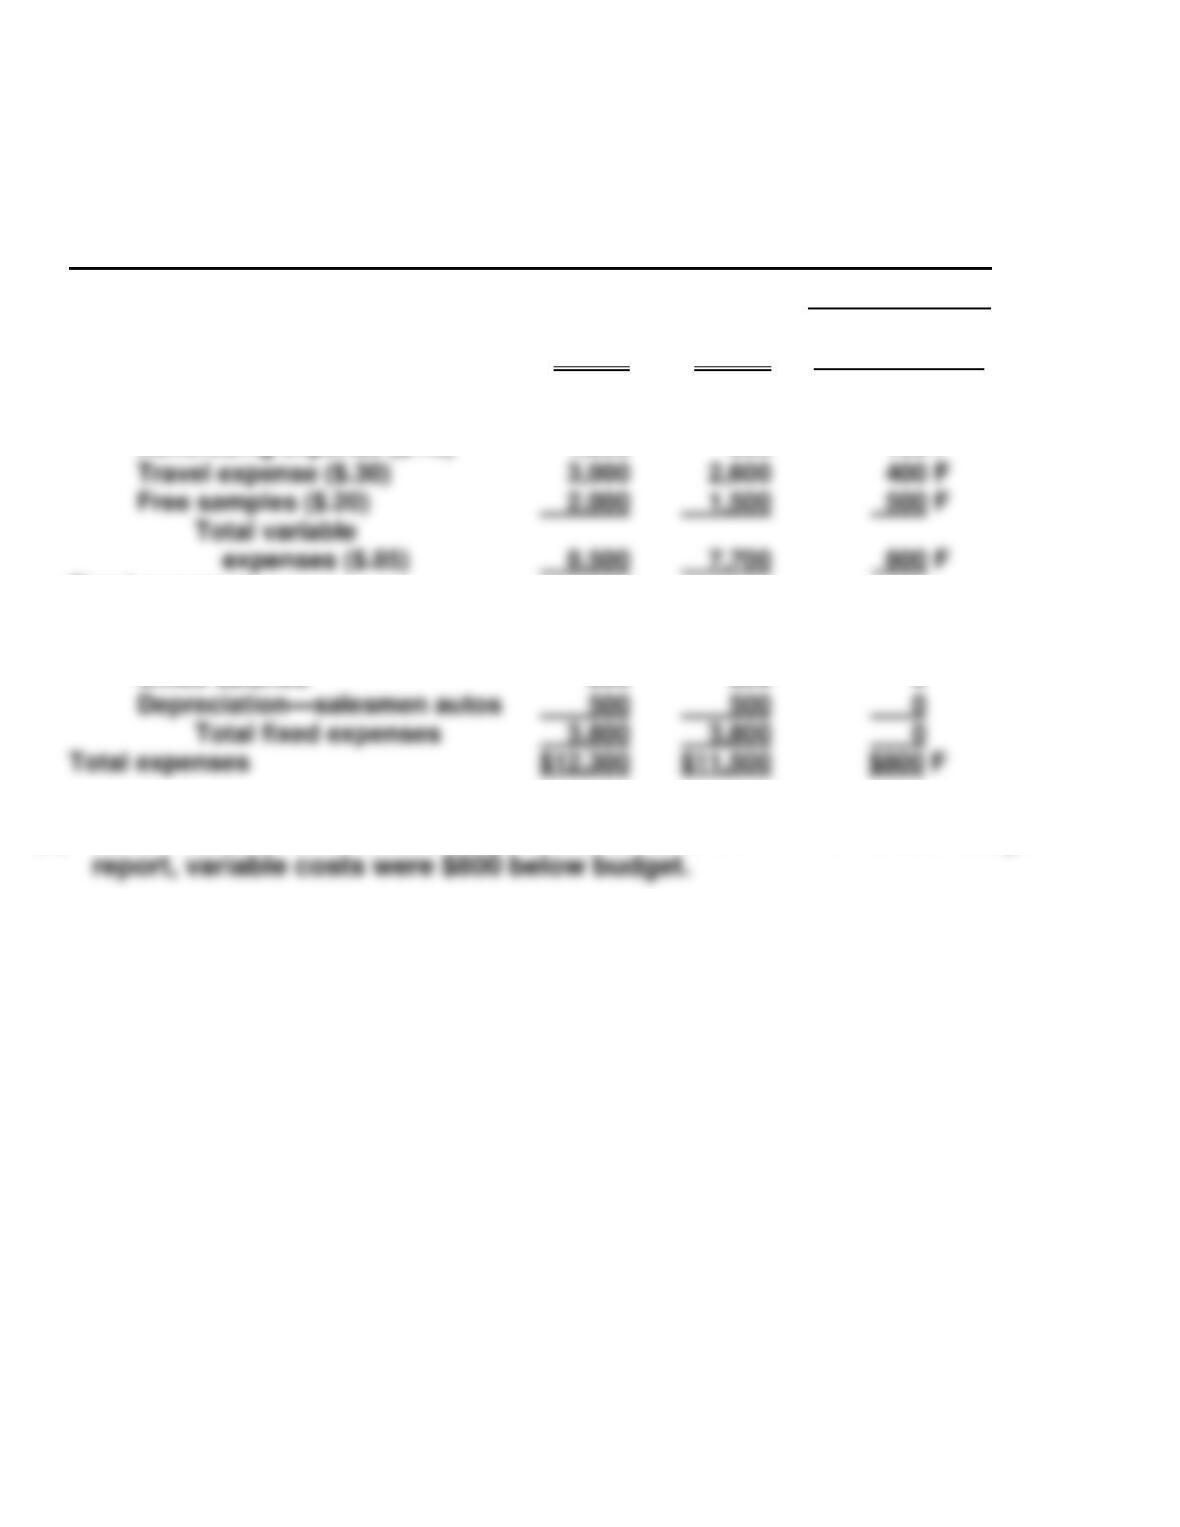
EXERCISE 10-7B
(a) HARMON COMPANY
Selling Expense Budget Report (Flexible)
Clothing Department
For the Month Ended October 31, 2017
Difference
Sales in units
Variable expenses
Sales commissions ($.25)
Advertising expense ($.10)
Fixed expenses
Rent
Sales salaries
Office salaries
Budget
10,000
$ 2,500
1,000
1,500
1,000
800
Actual
10,000
$ 2,700
900
1,500
1,000
800
Favorable F
Unfavorable U
$200 U
100 F
0
0
0
(b) Lance should not have been reprimanded. As shown in the flexible budget
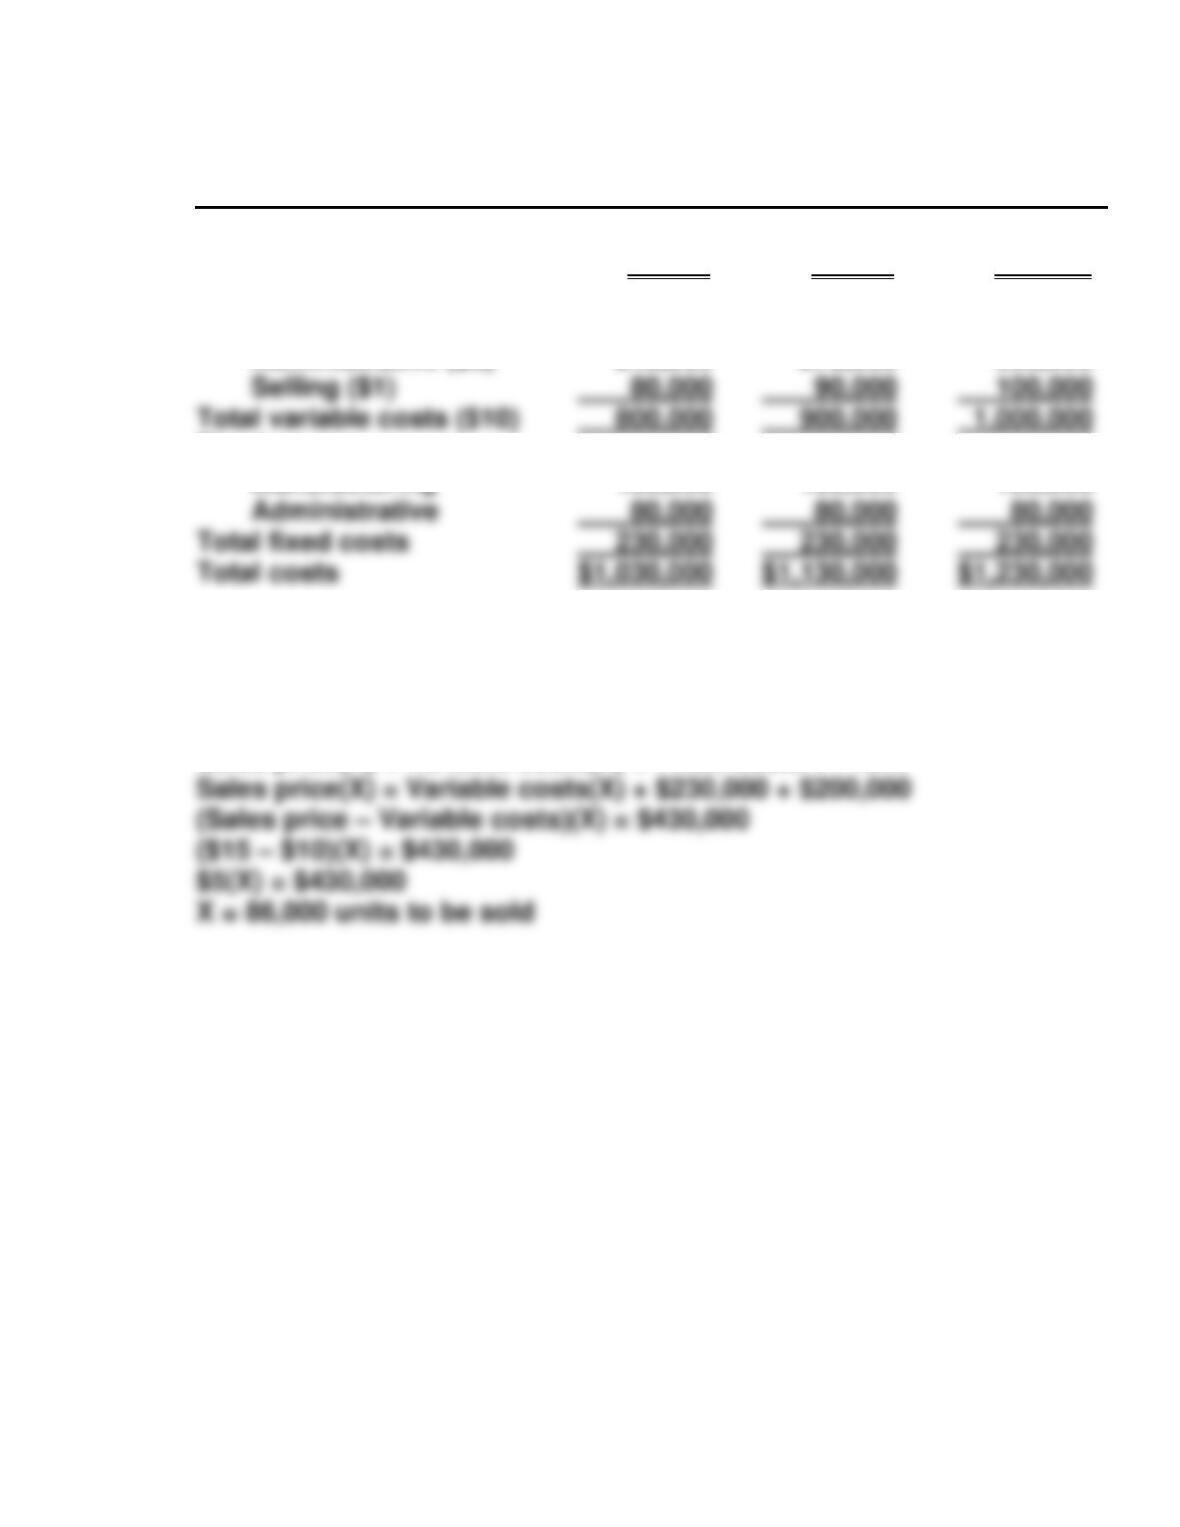
EXERCISE 10-8B
(a) REDSTONE INC.
Flexible Production Cost Budget
Activity level
Production levels 80,000 90,000 100,000
Variable costs:
Manufacturing ($6) $ 480,000 $ 540,000 $ 600,000
Administrative ($3) 240,000 270,000 300,000
Fixed costs:
Manufacturing 150,000 150,000 150,000
(b) $200,000 profit before taxes calculation in units:
Let (X) represent number of units
Sales price(X) = Variable costs(X) + Fixed costs + Profit
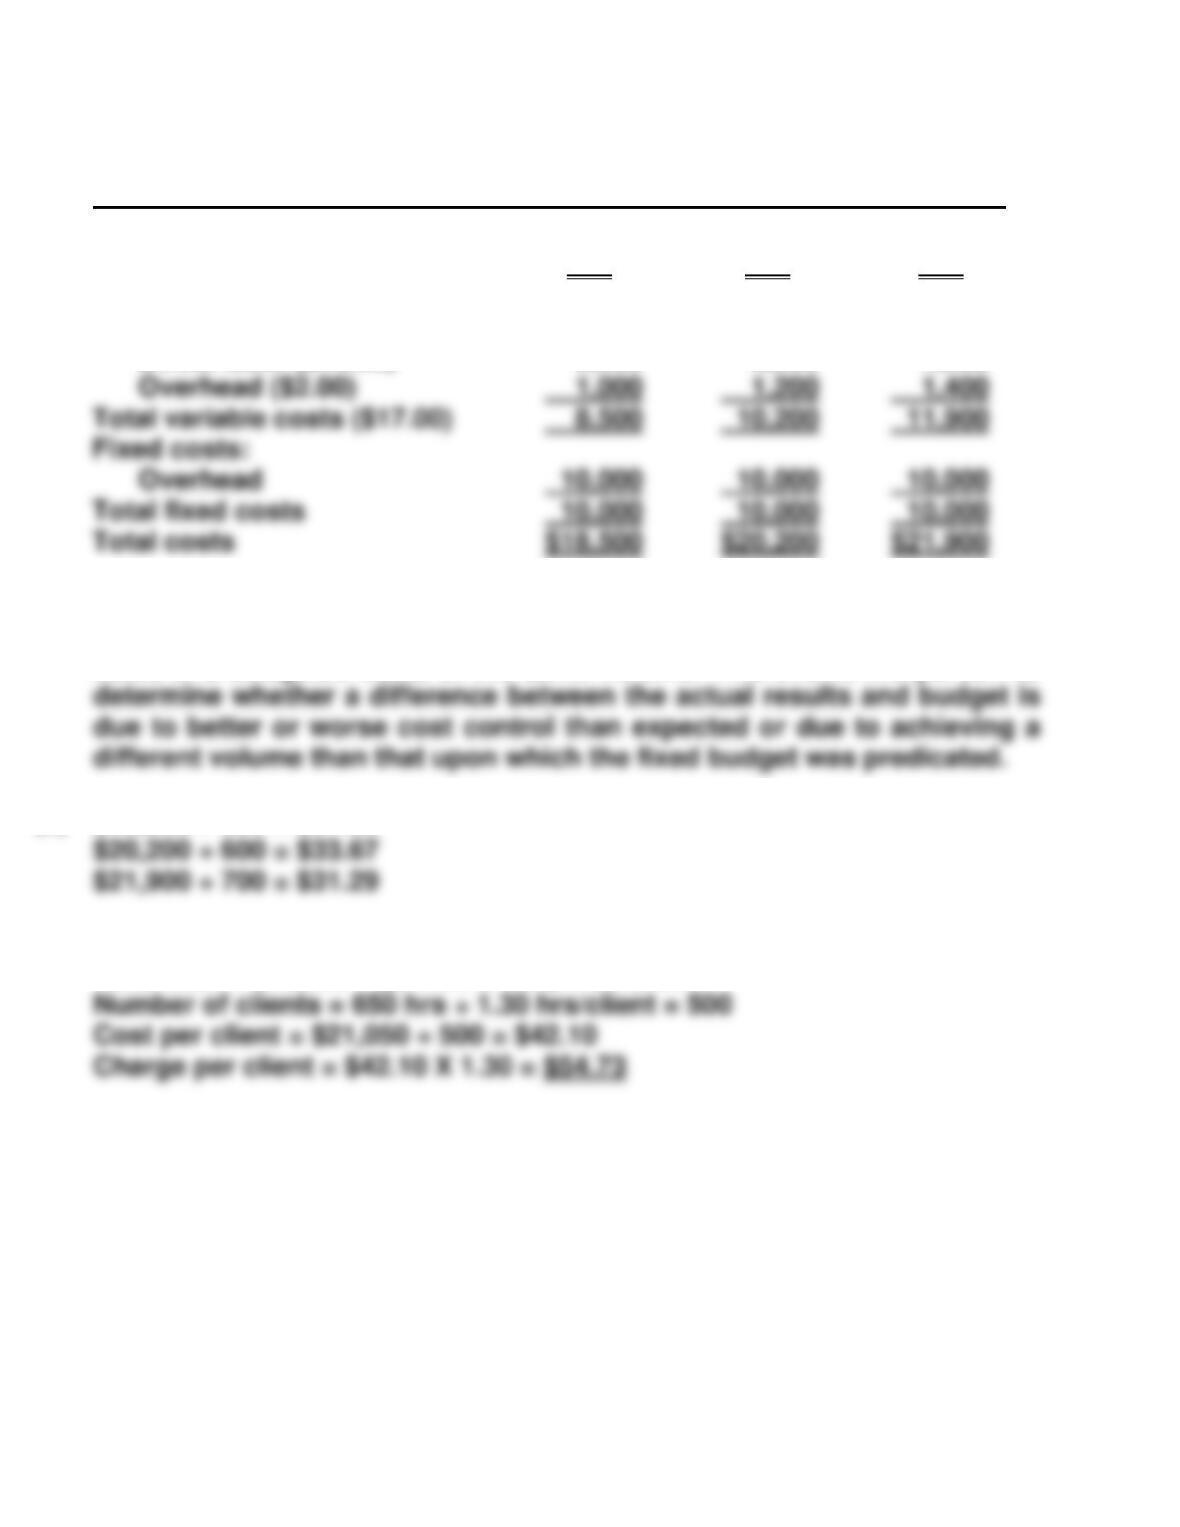
EXERCISE 10-9B
(a) MARKET GROOMERS
Flexible Budget
Activity level
Direct labor hours 500 600 700
Variable costs:
Grooming supplies ($5.00) $ 2,500 $ 3,000 $ 3,500
Direct labor ($10.00) 5,000 6,000 7,000
(b) A flexible budget presents expected costs at various levels of production
volume, not just one, so that comparisons can be made between actual
costs and budgeted costs at the same volume. This allows the person to
(c) $18,500 ÷ 500 = $37.00
(d) Cost formula is $10,000 + [$17.00(X)], where (X) = direct labor hours
Total cost = $10,000 + ($17.00 X 650) = $21,050.
EXERCISE 10-10B
(a) MEEKS PLUMBING COMPANY
Home Plumbing Services Segment
Responsibility Report
For the Quarter Ended March 31, 2017
Budget
Actual
Difference
Favorable F
Unfavorable U
Service revenue
$30,000
$31,500
$1,500 F
Variable costs:
Material and supplies
1,500
1,300
200 F
Wages
4,000
4,200
200 U
Controllable fixed costs:
Supervisory salaries
10,000
10,500
500 U
4,000
3,300
Total controllable fixed costs
500 F
Controllable margin
(b)
MEMO
TO: Karen Meeks
FROM: Student
SUBJECT: The Reporting Principles of Performance Reports
When evaluating the performance of a company’s segments, the performance reports
should:
1. Contain only data that are controllable by the segment’s manager.
2. Provide accurate and reliable budget data to measure performance.
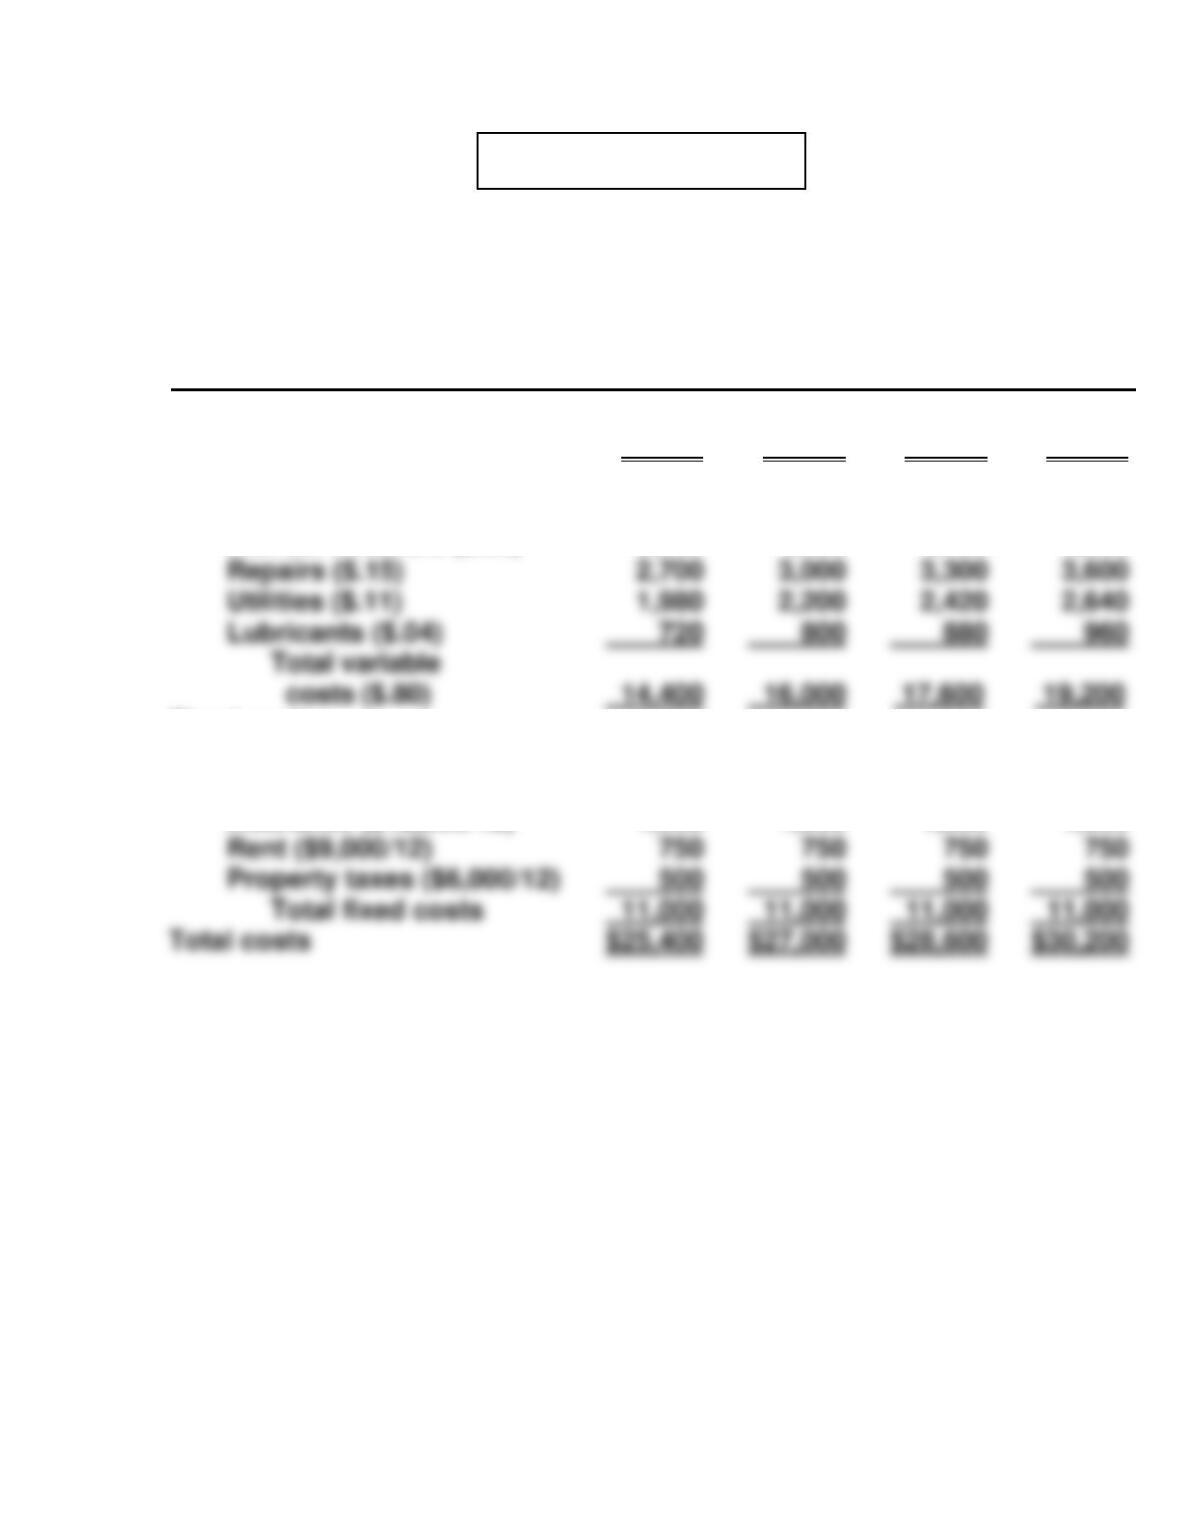
EXERCISE 10-11B
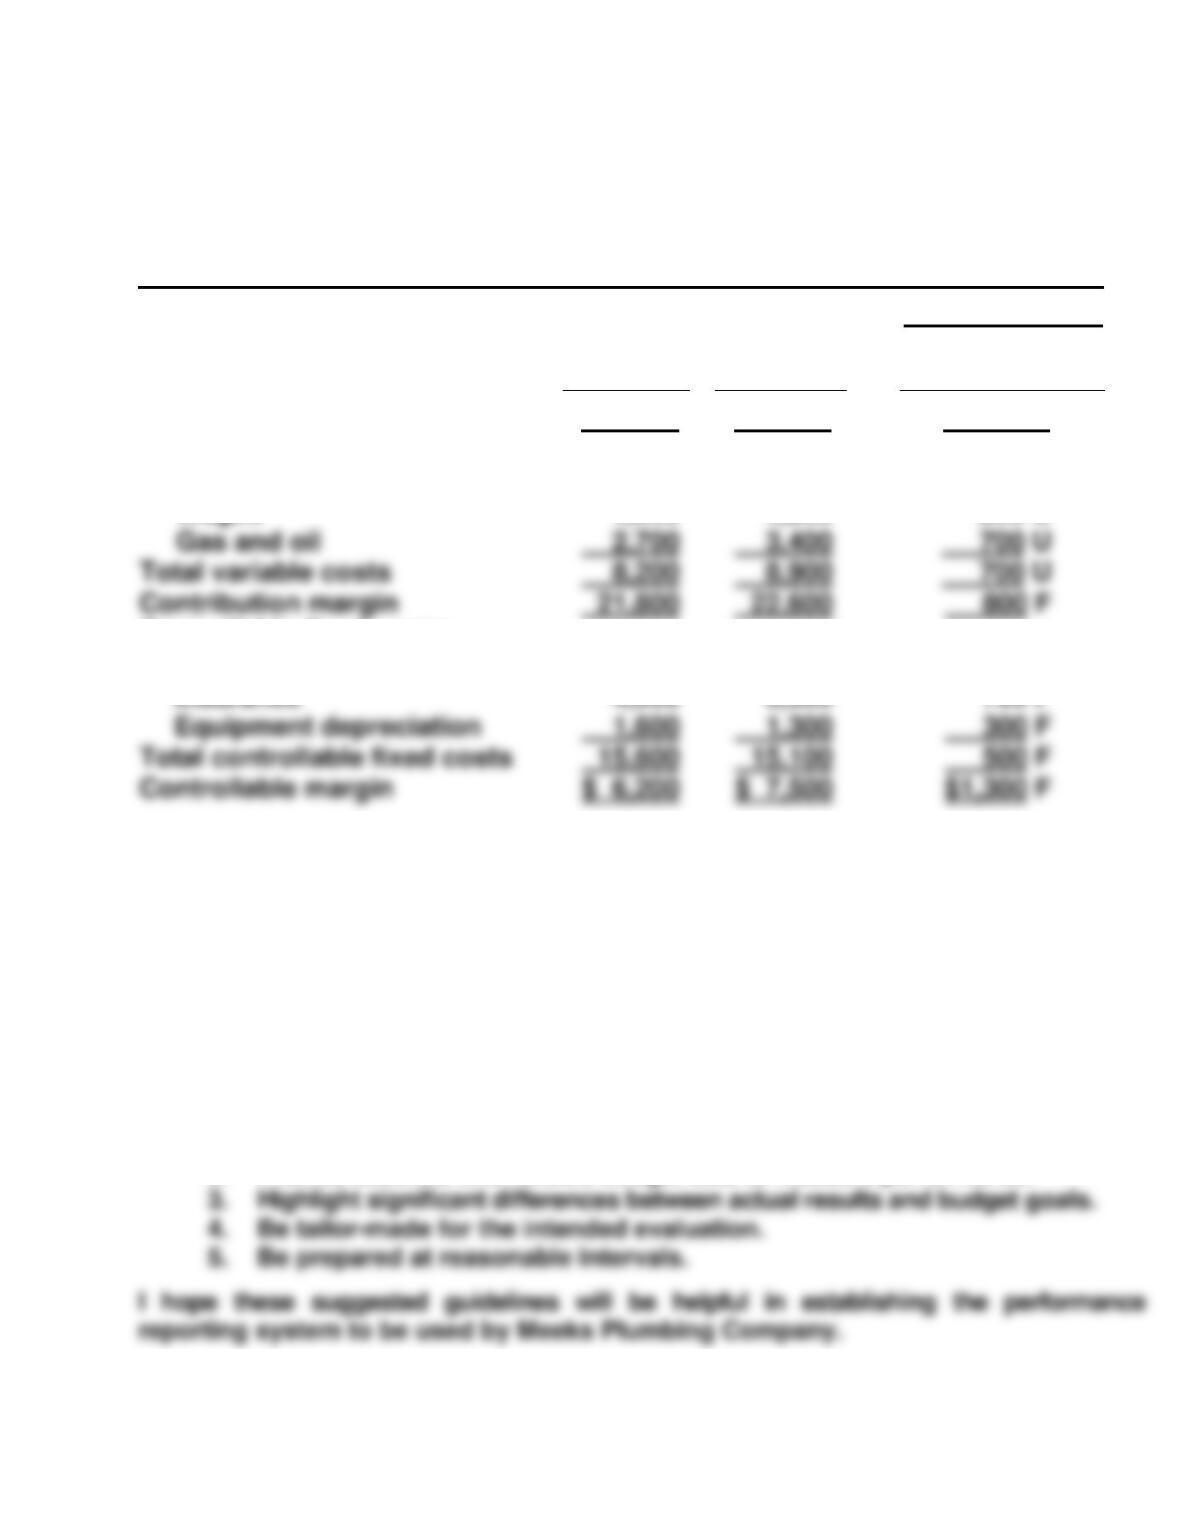
Gas and oil
Total variable costs
8,200
8,900
Contribution margin
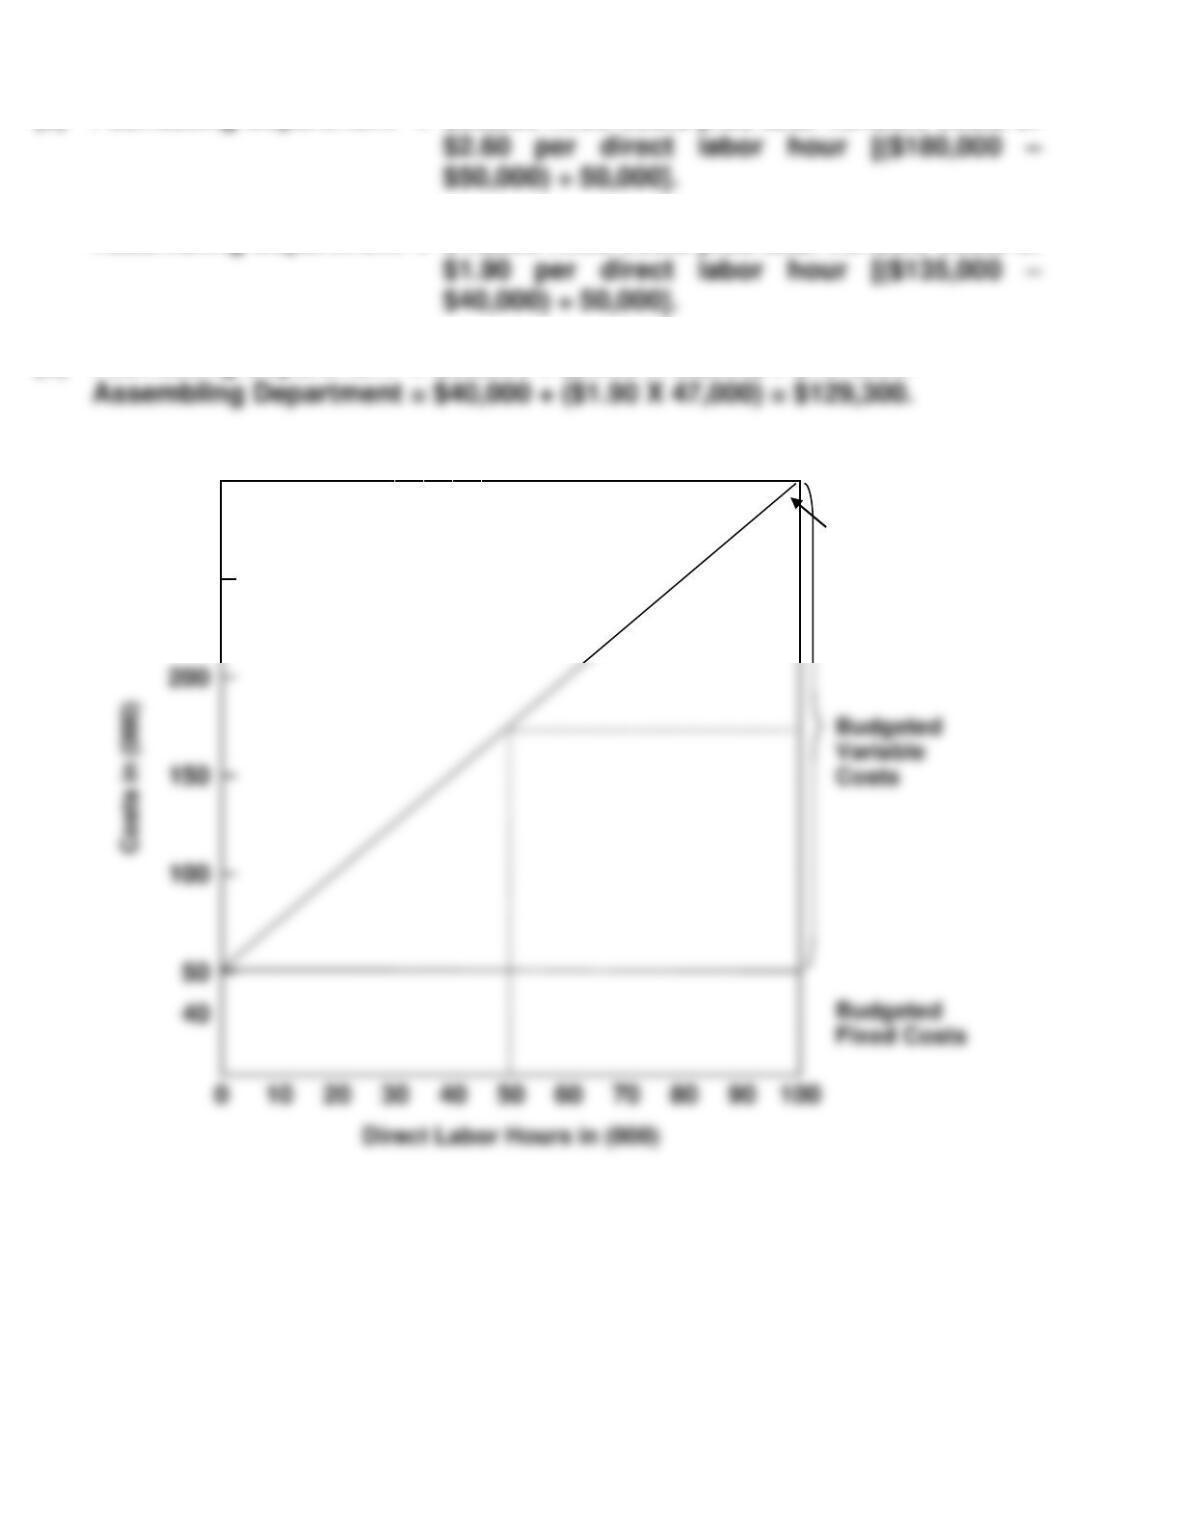
(a) Fabricating Department = $50,000 fixed costs plus total variable costs of
Assembling Department = $40,000 fixed costs plus total variable costs of
(b) Fabricating Department = $50,000 + ($2.60 X 53,000) = $187,800.
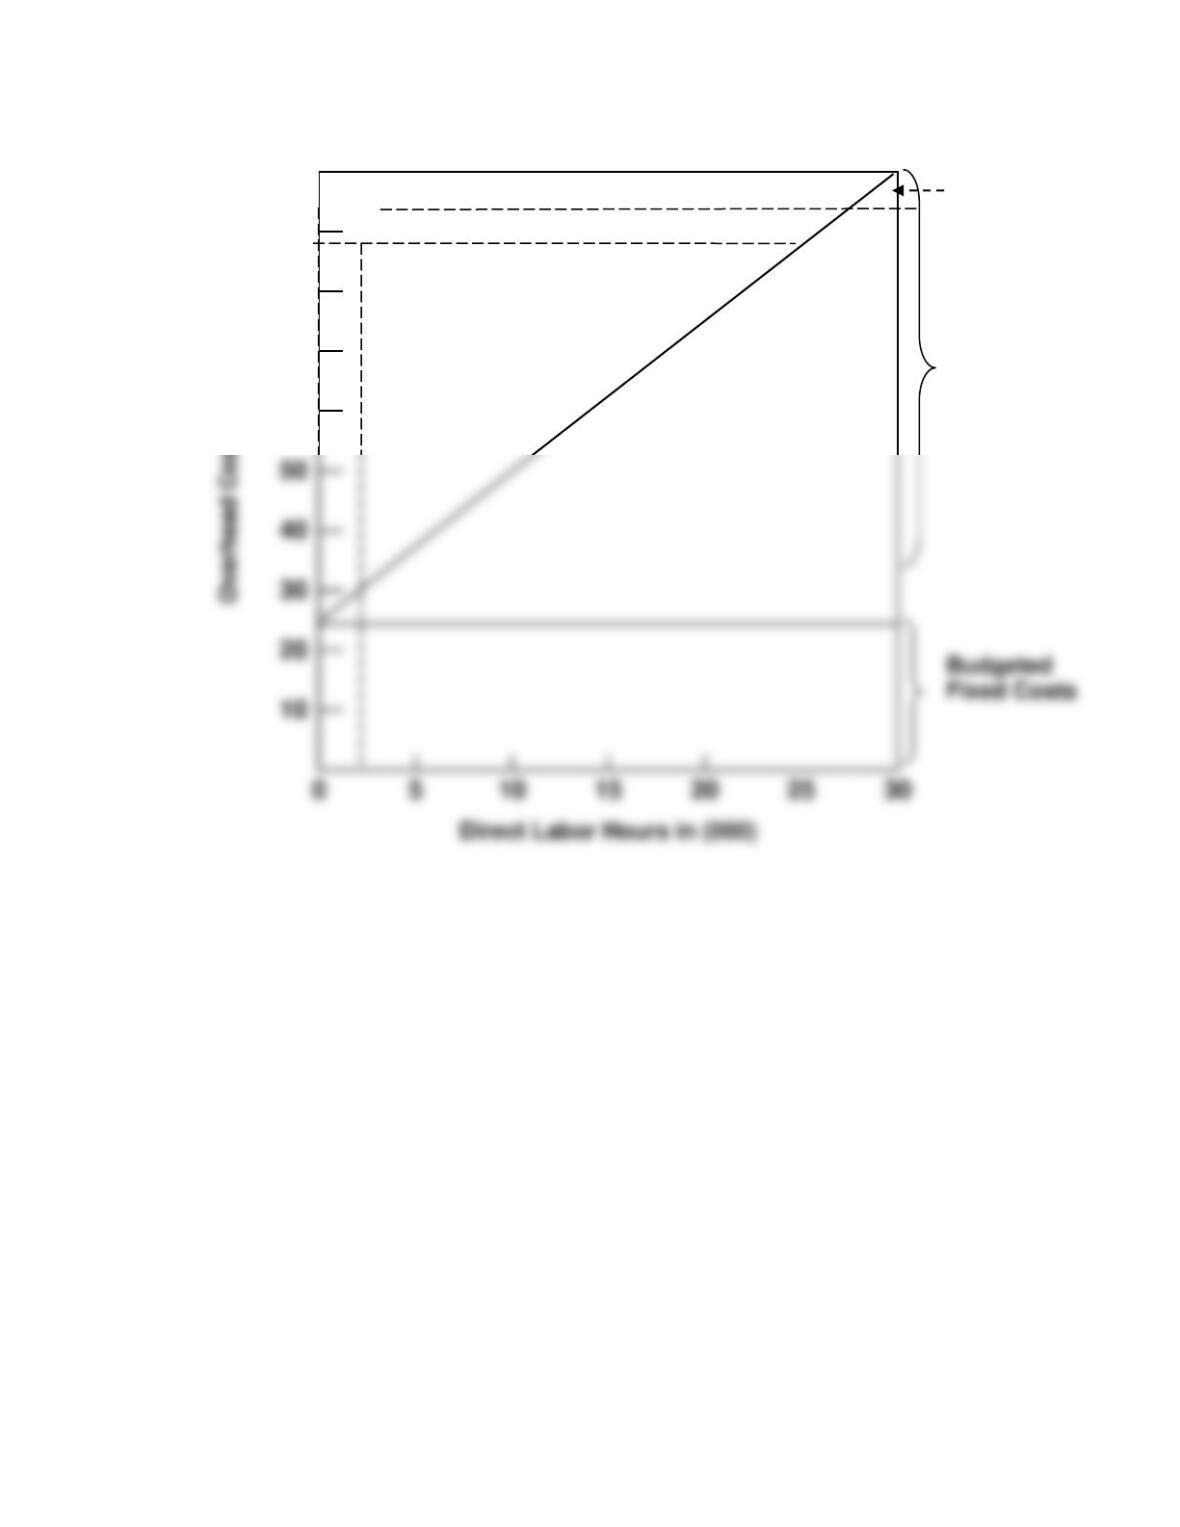
(c)
$300
200
100
Total
Budgeted
Cost Line
250
EXERCISE 10-12B
(a)
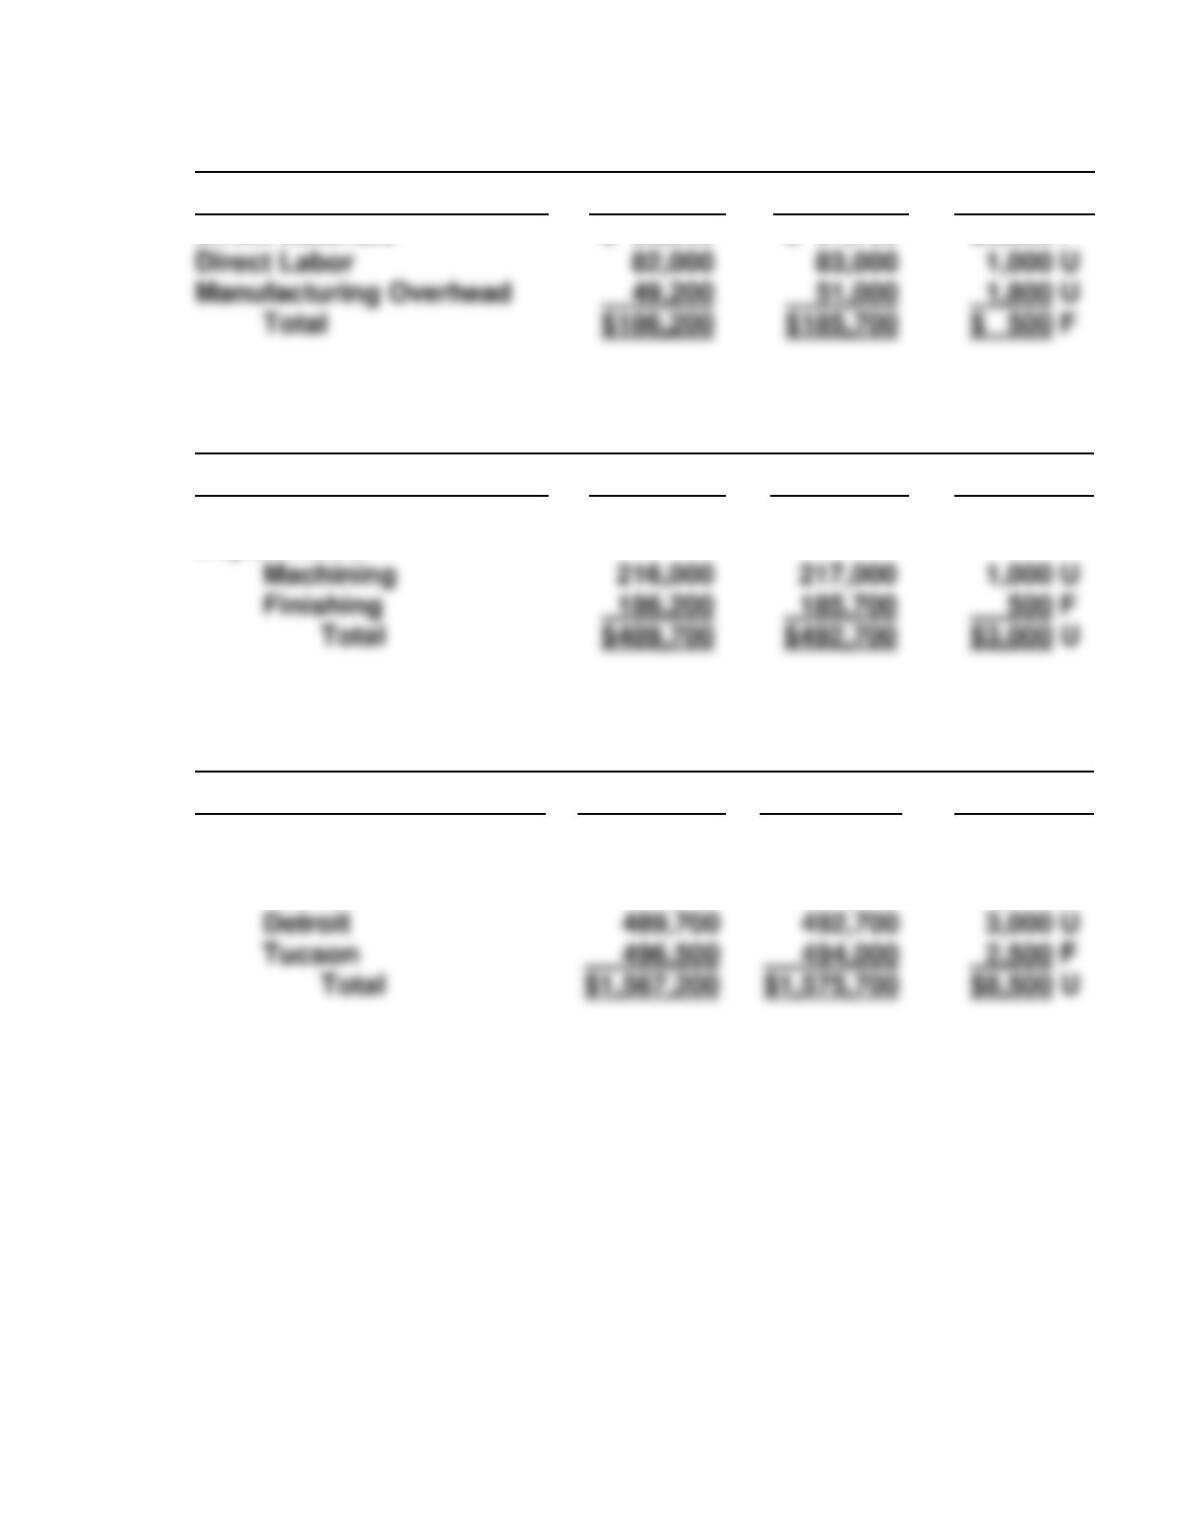
To Detroit Department Manager—Finishing Month: July
Controllable Costs:
Budget
Actual
Fav/Unfav
Direct Materials
$ 55,000
$ 51,700
$3,300 F
(b)
To Assembly Plant Manager—Detroit Month: July
Controllable Costs:
Budget
Actual
Fav/Unfav
Detroit Office
Departments:
$ 87,500
$ 90,000
$2,500 U
(c)
To Vice President—Production Month: July
Controllable Costs:
Budget
Actual
Fav/Unfav
V P Production
Assembly plants:
Atlanta
$ 160,000
421,000
$ 165,000
424,000
$5,000 U
3,000 U
EXERCISE 10-13B
(a) STARLIGHT COMPANY
Mixing Department
Responsibility Report
For the Month Ended January 31, 2017
Controllable Cost
Budget
Actual
Difference
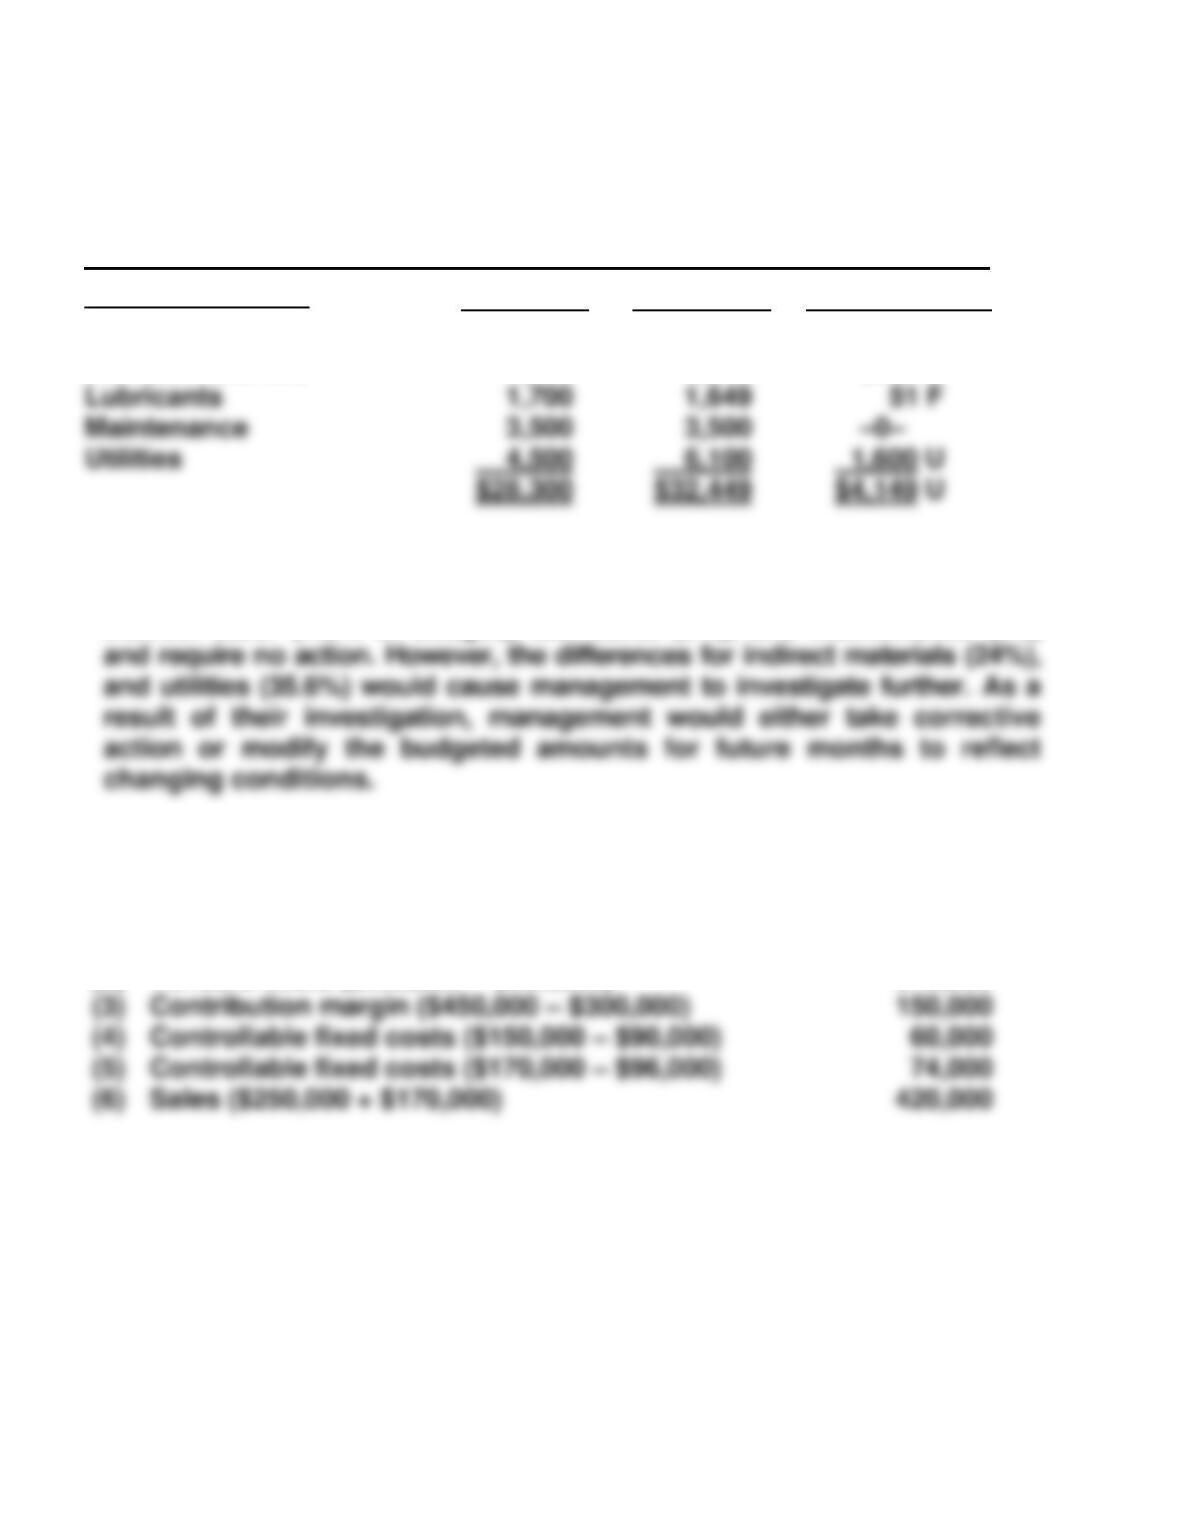
Indirect labor
Indirect materials
$11,100
7,500
$11,900
9,300
$ 800 UU
1,800 U
(b) Most likely, when management examined the responsibility report for
January, they would determine that the difference was insignificant for
indirect labor (7.2% of budget), lubricants (3%), and maintenance (0%)
EXERCISE 10-14B
(a) (1) Controllable margin ($260,000 – $100,000) $160,000
(2) Variable costs ($600,000 – $260,000) 340,000
EXERCISE 10-14B (Continued)
(b) BROGAN MANUFACTURING INC.
Women’s Shoe Division
Responsibility Report
For the Month Ended June 30, 2017
Difference
Budget
Actual
Favorable F
Unfavorable U
Sales
Variable costs
$600,000
335,000
$600,000
340,000
$ 0 U
5,000 U
EXERCISE 10-15B
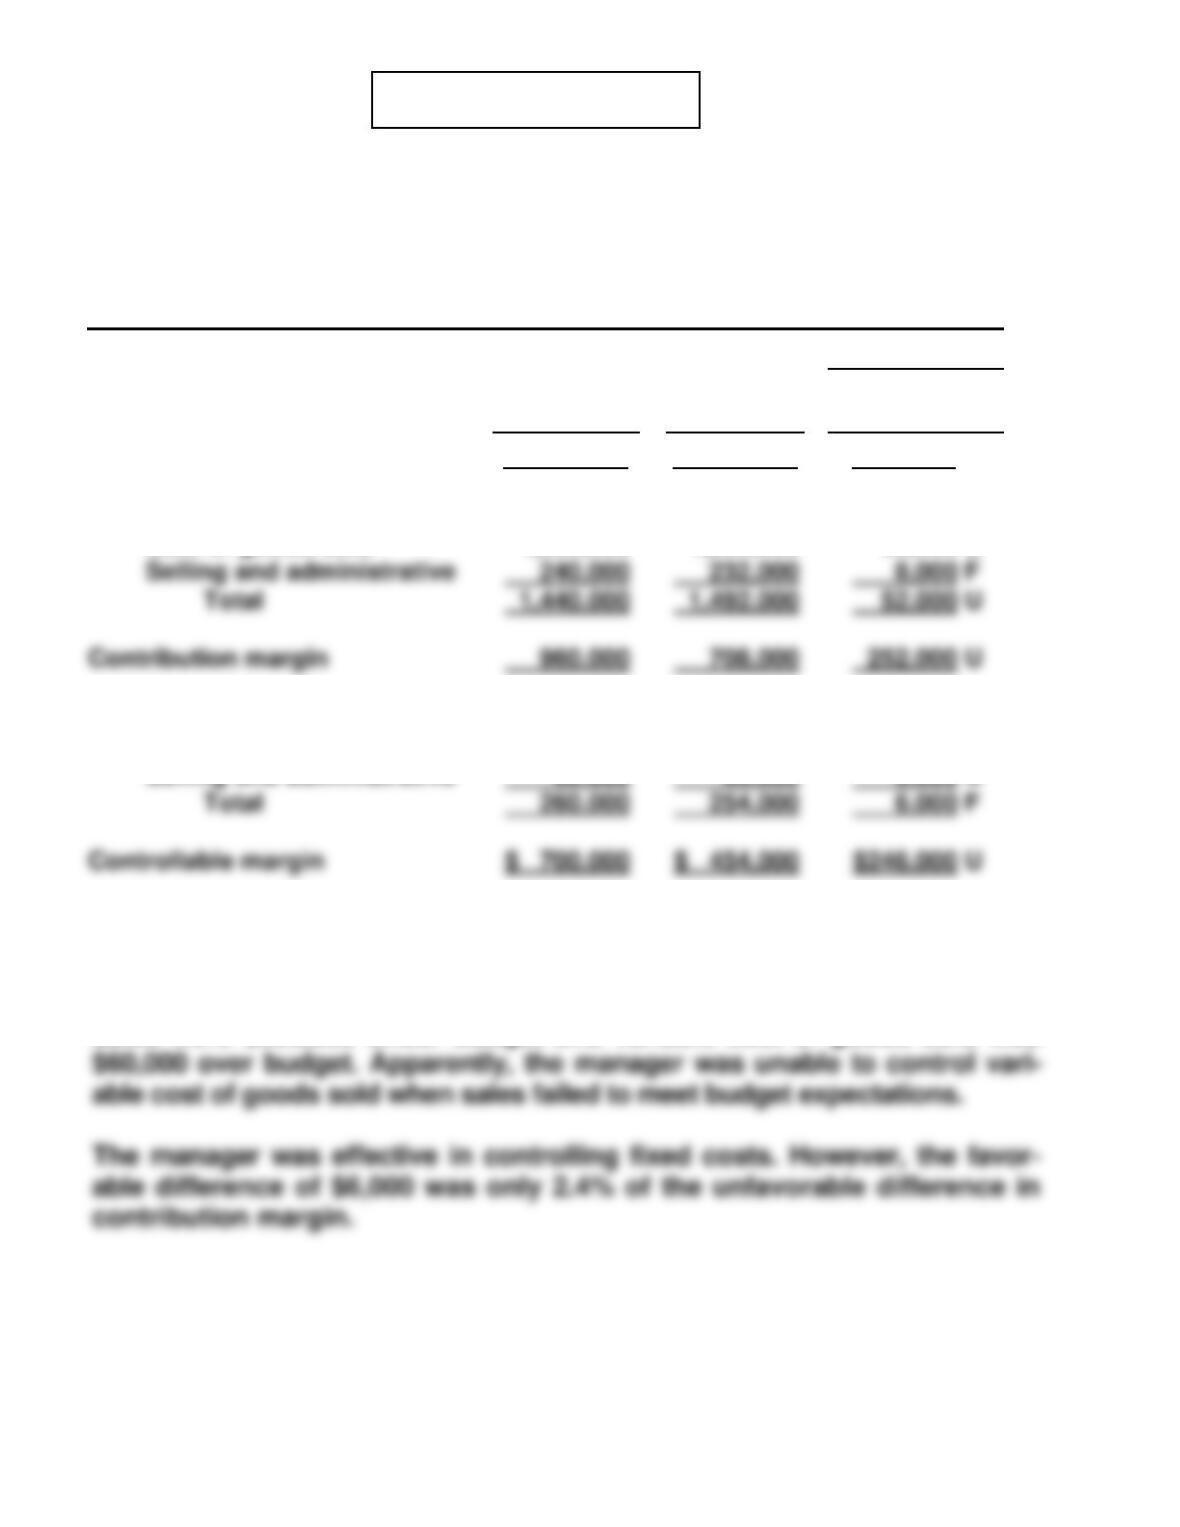
(a) SWENSON COMPANY
Sports Equipment Division
Responsibility Report
For the Year Ended December 31, 2017
Budget
Actual
Difference
Sales
$900,000
$870,000
$30,000 U
Variable costs
Cost of goods sold
440,000
405,000
35,000 F
Selling and administrative
60,000
62,000
2,000 U
Total
33,000 F
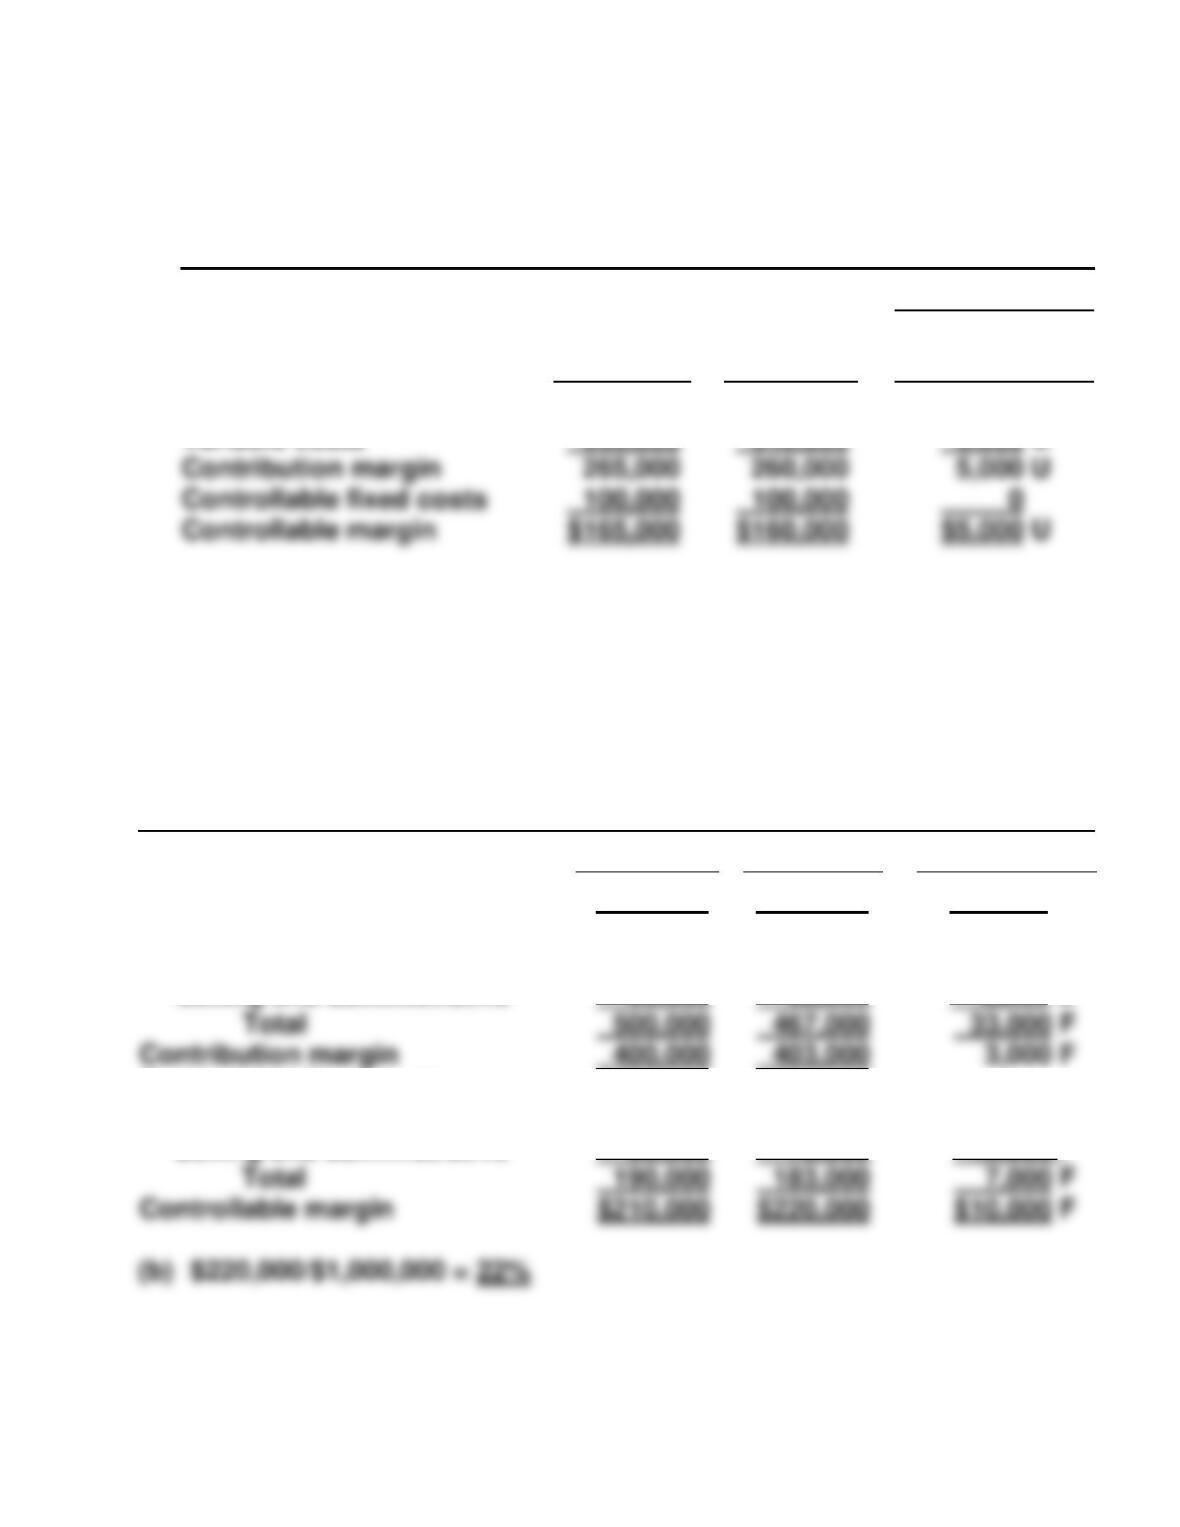
Contribution margin
403,000
3,000 F
Controllable fixed costs
Cost of goods sold
100,000
105,000
5,000 U
Selling and administrative
90,000
78,000
12,000 F
Total
7,000 F
Controllable margin
$210,000
$220,000
$10,000 F
EXERCISE 10-16B
(a) Controllable margin = ($3,200,000 – $2,500,000 – $400,000) = $300,000
(b) (1) Contribution margin percentage is 21.88%, or ($700,000 ÷ $3,200,000)
(2) ($300,000 + $100,000) ÷ $5,000,000 = 8%
EXERCISE 10-17B
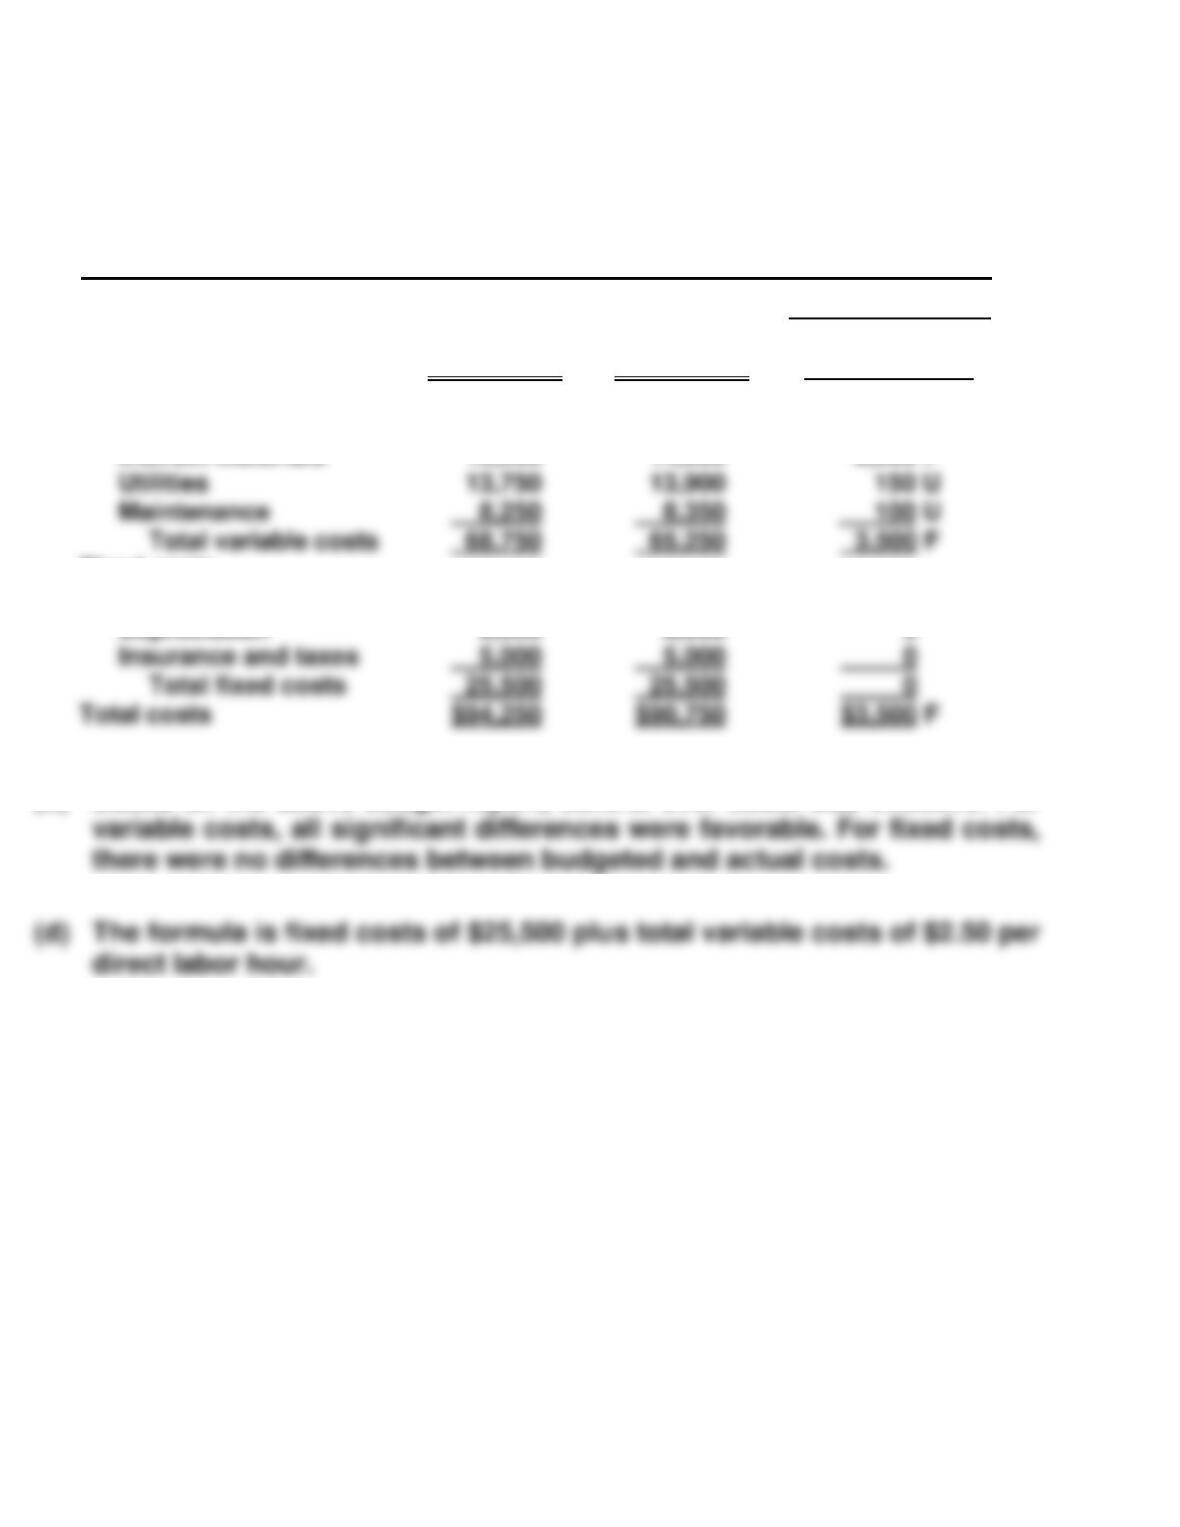
(a) MEND AND DONNER DENTAL CLINIC
Preventive Services
Responsibility Report
For the Month Ended May 31, 2017
Budget
Actual
Difference
Favorable F
Unfavorable U
Service revenue
$43,000
$45,000
$2,000 F
Variable costs
Filling materials
6,700
7,000
300 U
Novocain
3,800
4,000
200 U
Dental assistant wages
2,500
2,500
0
Supplies
2,250
2,000
250 F
Utilities
450
500
50 U
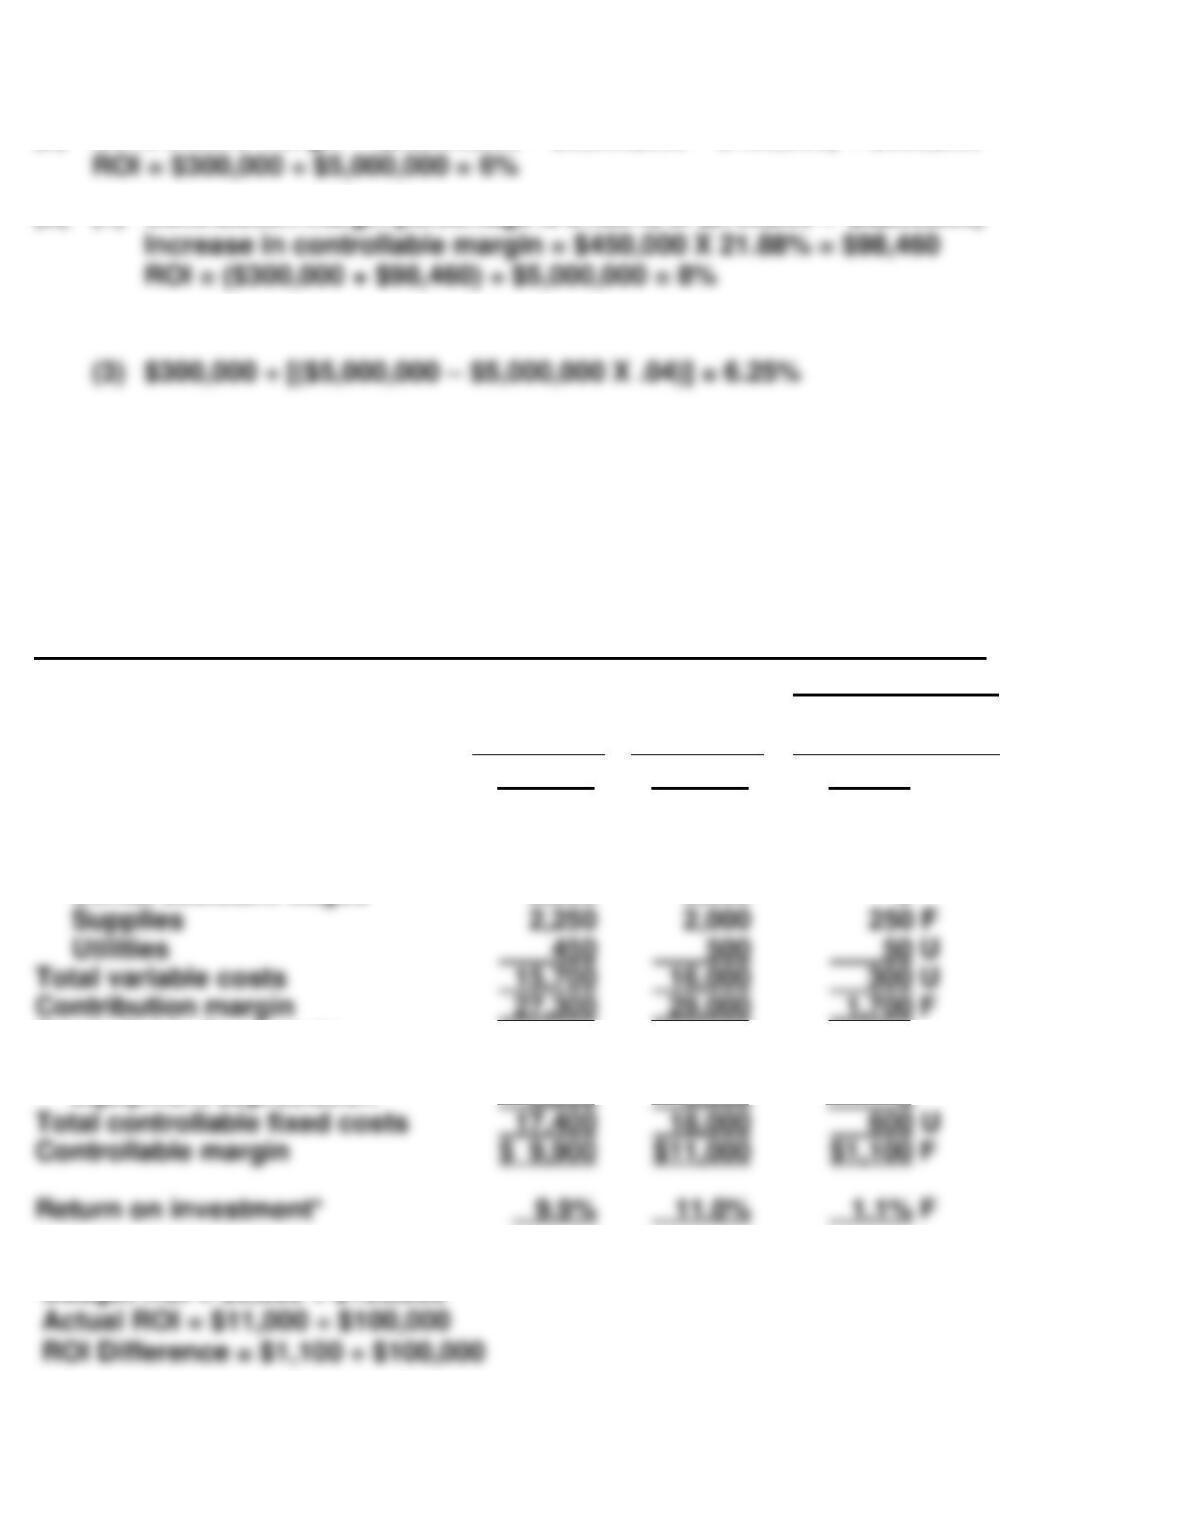
Total variable costs
300 U
Contribution margin
Controllable fixed costs
Dentist salary
11,400
12,000
600 U
Equipment depreciation
6,000
6,000
0
Controllable margin
$ 9,900
$11,000
$1,100 F
Return on investment*
1.1% F
*Average investment = ($102,400 + $97,600) ÷ 2 = $100,000
Budget ROI = $9,900 ÷ $100,000

EXERCISE 10-17B (Continued)
(b)
MEMO
TO: Drs. Richard Mend and Tommy Donner
FROM: Student
SUBJECT: Deficiencies in the Current Responsibility Reporting System
The current reporting system has the following deficiencies:
1. It does not clearly show both budgeted goals and actual performance.
2. It does not indicate the contribution margin generated by the center,
showing the amount available to go towards covering controllable
All of these deficiencies have been addressed in the recommended responsibility
report attached. As can be seen from that report, the Preventative Services
center is profitable. The service revenues generated in this center are adequate to
EXERCISE 10-18B
Jets:
ROI = Controllable margin ÷ Average operating assets
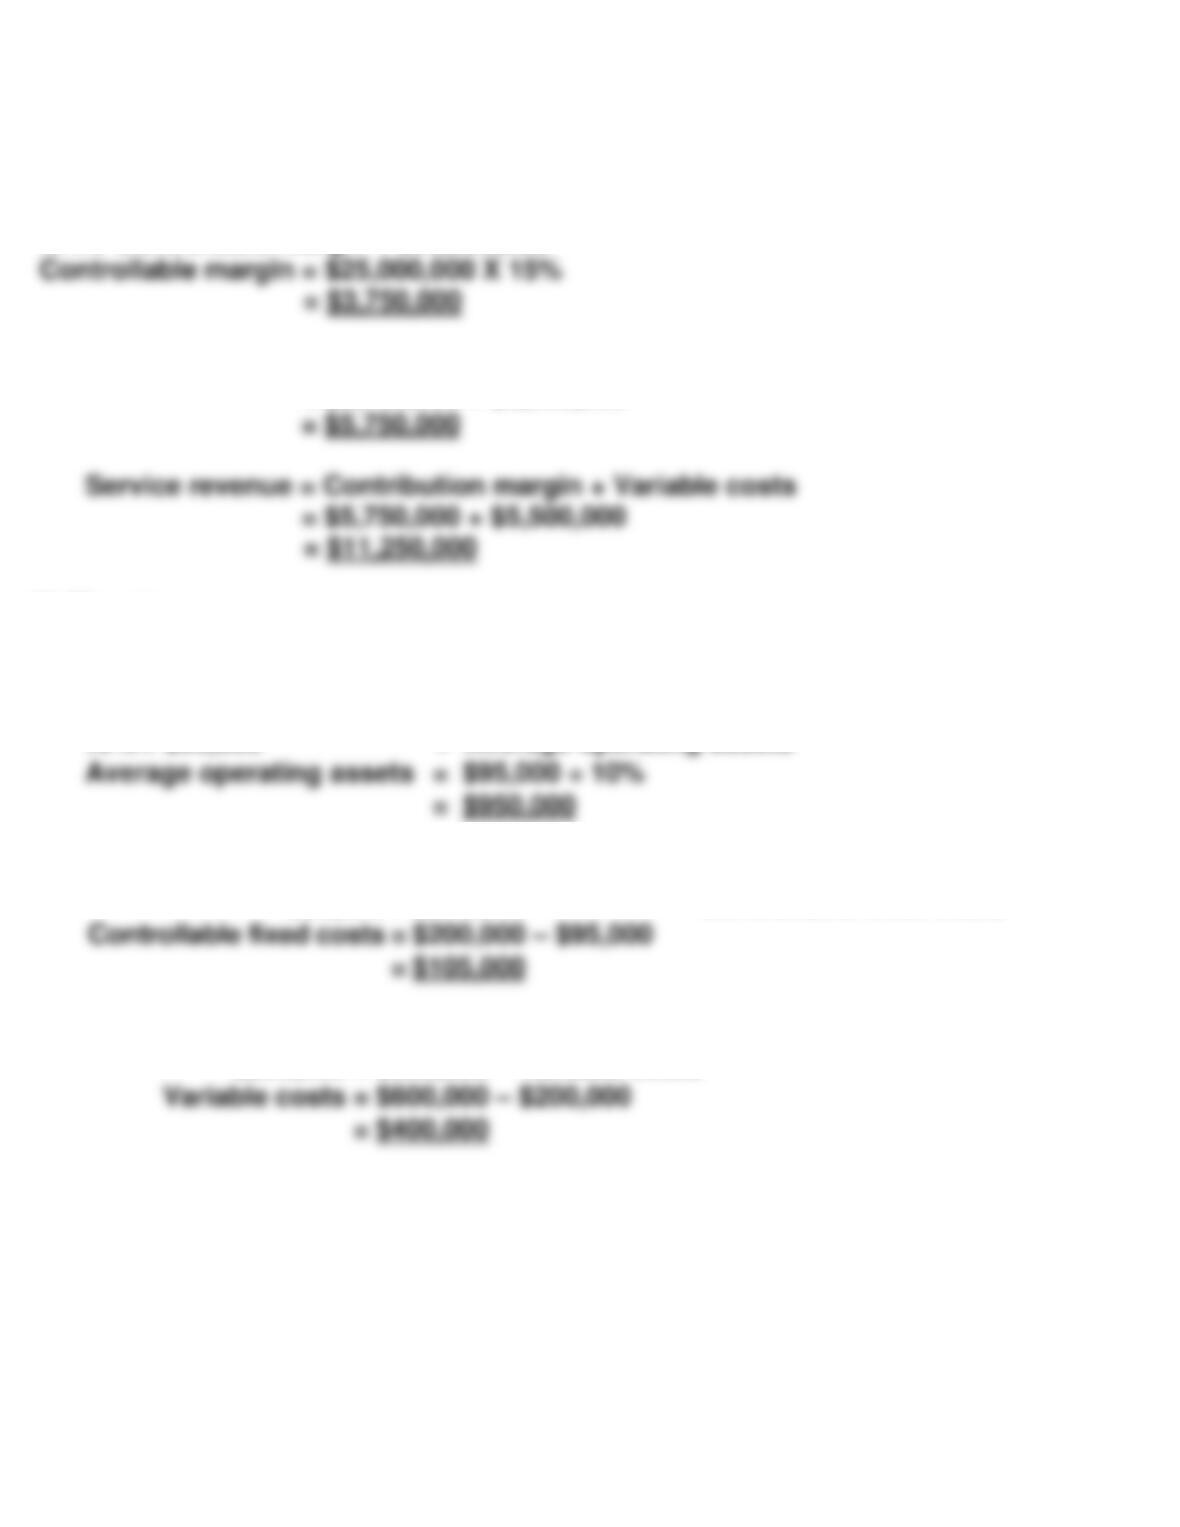
15% = Controllable margin ÷ $25,000,000
Contribution margin = Controllable margin + Controllable fixed costs
= $3,750,000 + $2,000,000
Hellicopters:
ROI
=
Controllable margin
÷
Average operating assets
10%
=
$95,000
÷
Average operating assets
Controllable marginin
=
Contribution margin
–
Controllable fixed costs
$95,000
=
$200,000
–
Controllable fixed costs
=
$105,000
Contribution margin
=
Service revenue – Variable costs
$200,000
=
$600,000 – Variable costs
=
$400,000
EXERCISE 10-18B (Continued)
Satellites:
Controllable margin
=
Contribution margin
–
Controllable fixed costs
Contribution margin
=
Service revenue
–
Variable costs
$820,000
EXERCISE 10-19B
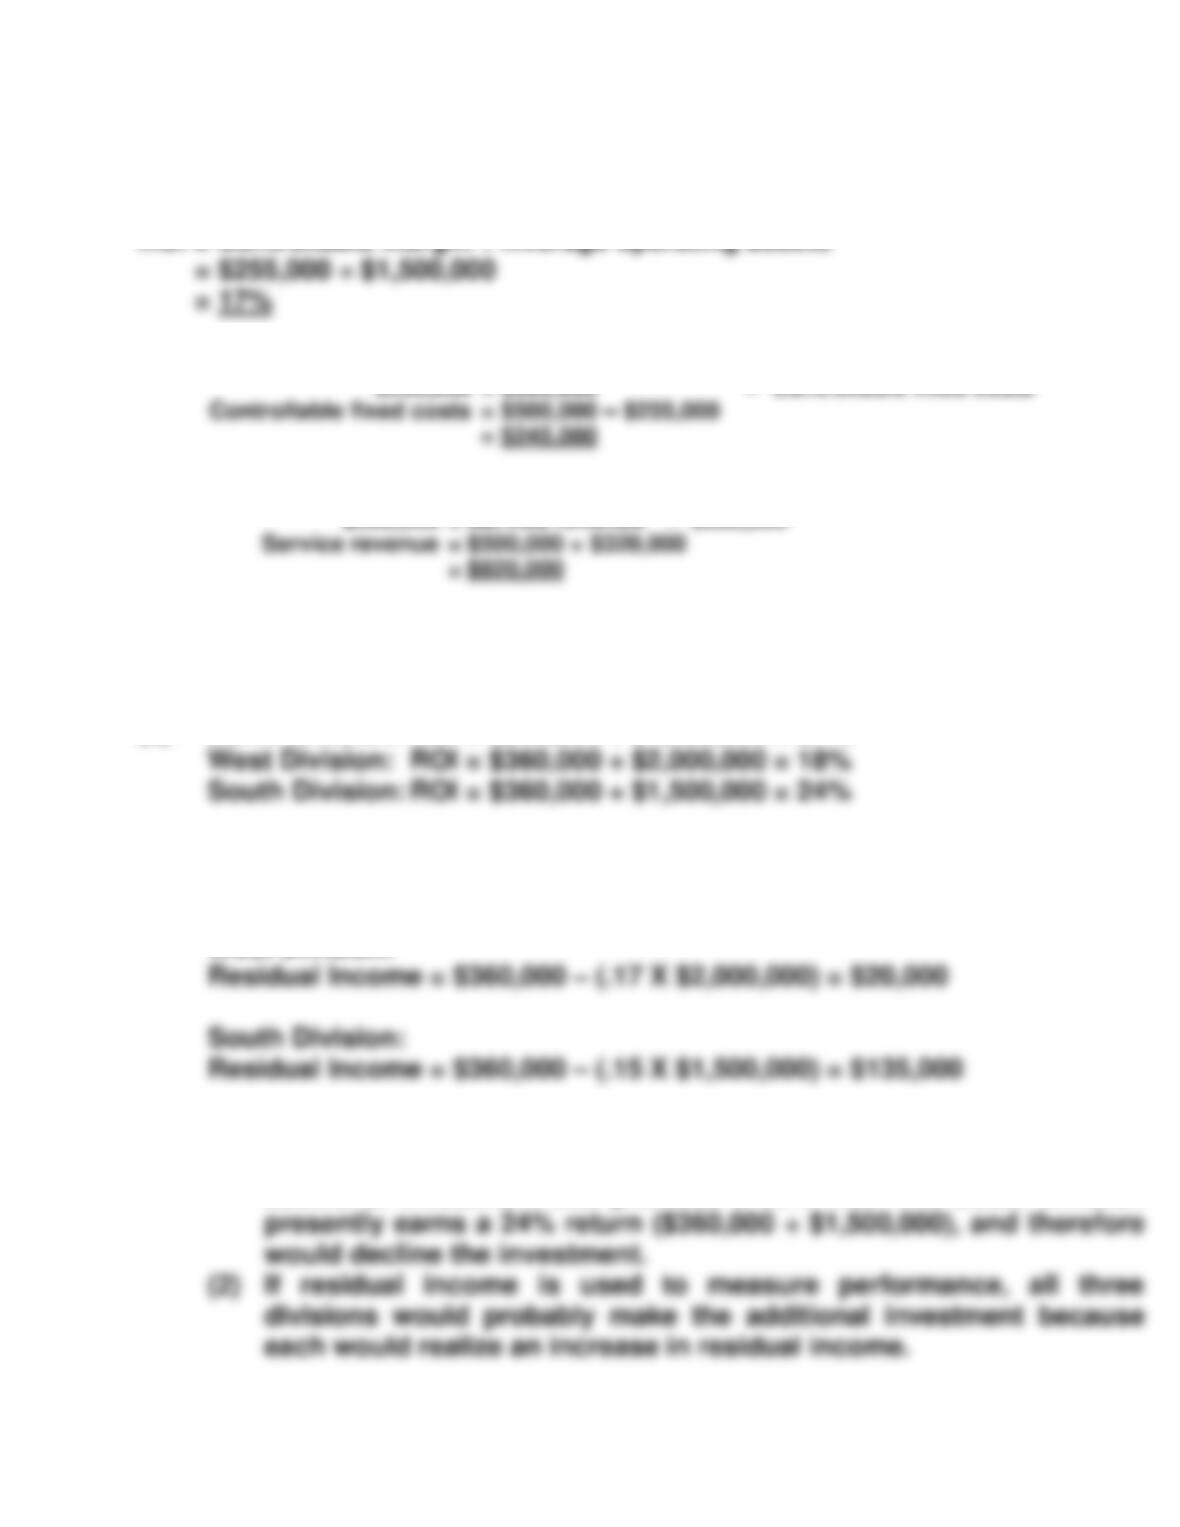
(a) North Division: ROI = $210,000 ÷ $1,000,000 = 21%
(b) North Division:
Residual Income = $210,000 – (.16 X $1,000,000) = $50,000
West Division:
(c) (1) If ROI is used to measure performance, only the North Division (with
an 21% ROI) and the West Division (with a 18% ROI) would make the
additional investment that provides a 22% ROI. The South Division
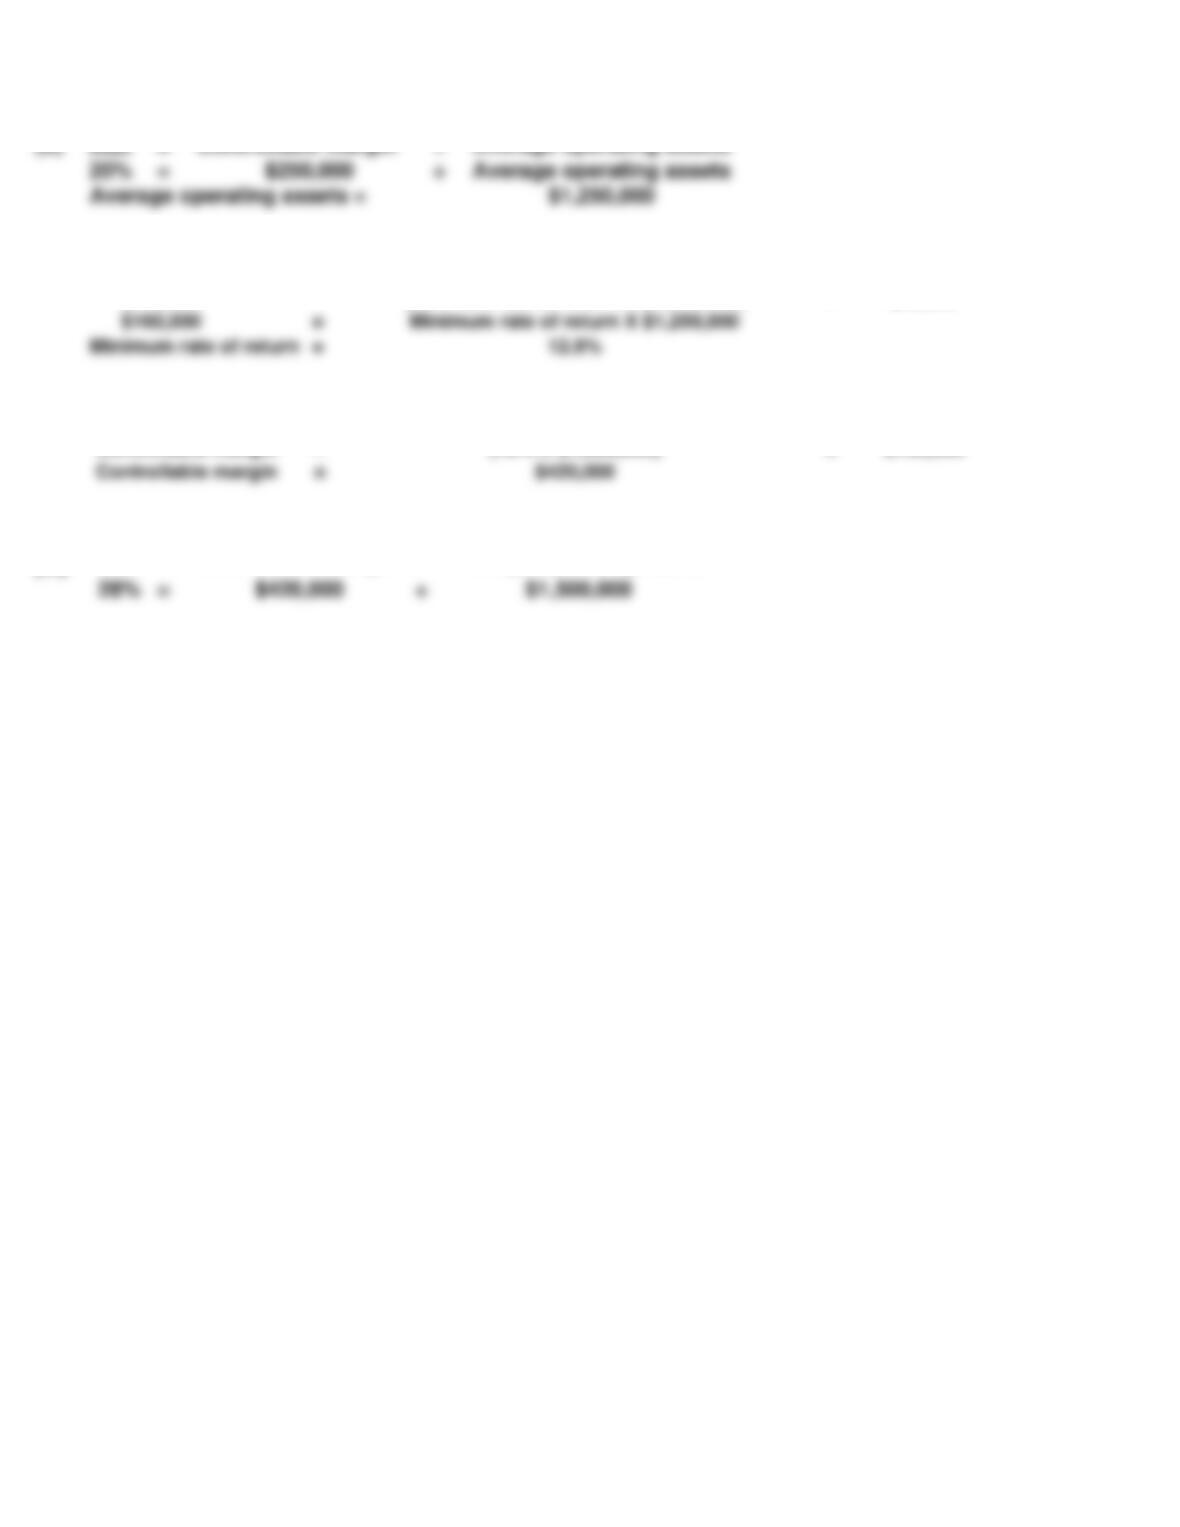
*EXERCISE 10-20B
(b)
Controllable margin
–
(Minimum rate of return X Average operating assets)
=
Residual income
$250,000
–
(Minimum rate of return X $1,250,000)
=
$90,000
=
Minimum rate of return
=
(c)
Controllable margin
–
(Minimum rate of return X Average operating assets)
=
Residual income
Controllable margin
–
(18% X $1,500,000)
=
$150,000
Controllable margin
=
(d)
ROI
=
Controllable margin
÷
Average operating assets
SOLUTIONS TO PROBLEMS—SET C
PROBLEM 10-1C
(a) DUNES COMPANY
Flexible Monthly Manufacturing Overhead Budget
Assembly Department
For the Year 2017
Activity level
Direct labor hours
Variable costs
Indirect labor ($.30)
Indirect materials ($.20)
Fixed costs
Supervision ($75,000/12)
Depreciation ($30,000/12)
Insurance ($12,000/12)
18,000
$ 5,400
3,600
6,250
2,500
1,000
20,000
$ 6,000
4,000
6,250
2,500
1,000
22,000
$ 6,600
4,400
6,250
2,500
1,000
24,000
$ 7,200
4,800
6,250
2,500
1,000
PROBLEM 10-1C (Continued)
(b) DUNES COMPANY
Manufacturing Overhead Budget Report (Flexible)
Assembly Department
For the Month Ended January 31, 2017
Difference
Direct labor hours (DLH)
Variable costs
Indirect labor
Indirect materials
Fixed costs
Supervision
Depreciation
Insurance
Budget at
20,000 DLH
$ 6,000
4,000
6,250
2,500
1,000
Actual Costs
20,000 DLH
$ 6,300
3,800
6,250
2,500
1,000
Favorable F
Unfavorable U
$300 U
200 F
0
0
0
(c) Control over both variable and fixed costs was good.
PROBLEM 10-2C
(a) WILLARD MANUFACTURING COMPANY
Flexible Monthly Manufacturing Overhead Budget
Assembly Department
For the Year 2017
Activity level
Direct labor hours
Variable costs
Indirect labor ($1.10)
Indirect materials ($.60)
Fixed costs
Supervision
Depreciation
22,500
$24,750
13,500
12,500
8,000
25,000
$27,500
15,000
12,500
8,000
27,500
$30,250
16,500
12,500
8,000
30,000
$ 33,000
18,000
12,500
8,000
PROBLEM 10-2C (Continued)
(b) WILLARD MANUFACTURING COMPANY
Assembly Department
Manufacturing Overhead Budget Report (Flexible)
For the Month Ended July 31, 2017
Difference
Direct labor hours (DLH)
Variable costs
Indirect labor
Indirect materials
Fixed costs
Supervision
Depreciation
Budget at
27,500 DLH
$30,250
16,500
12,500
8,000
Actual Costs
27,500 DLH
$29,000
14,000
12,500
8,000
Favorable F
Unfavorable U
$1,250 F
2,500 F
0 F
0 F
(c) Based on the above budget report, control over costs was effective. For
PROBLEM 10-2C (Continued)
(e)
$100
Total
Budgeted
Cost Line
90
80
70
Budgeted
Variable
Costs
60
40
30
20
10
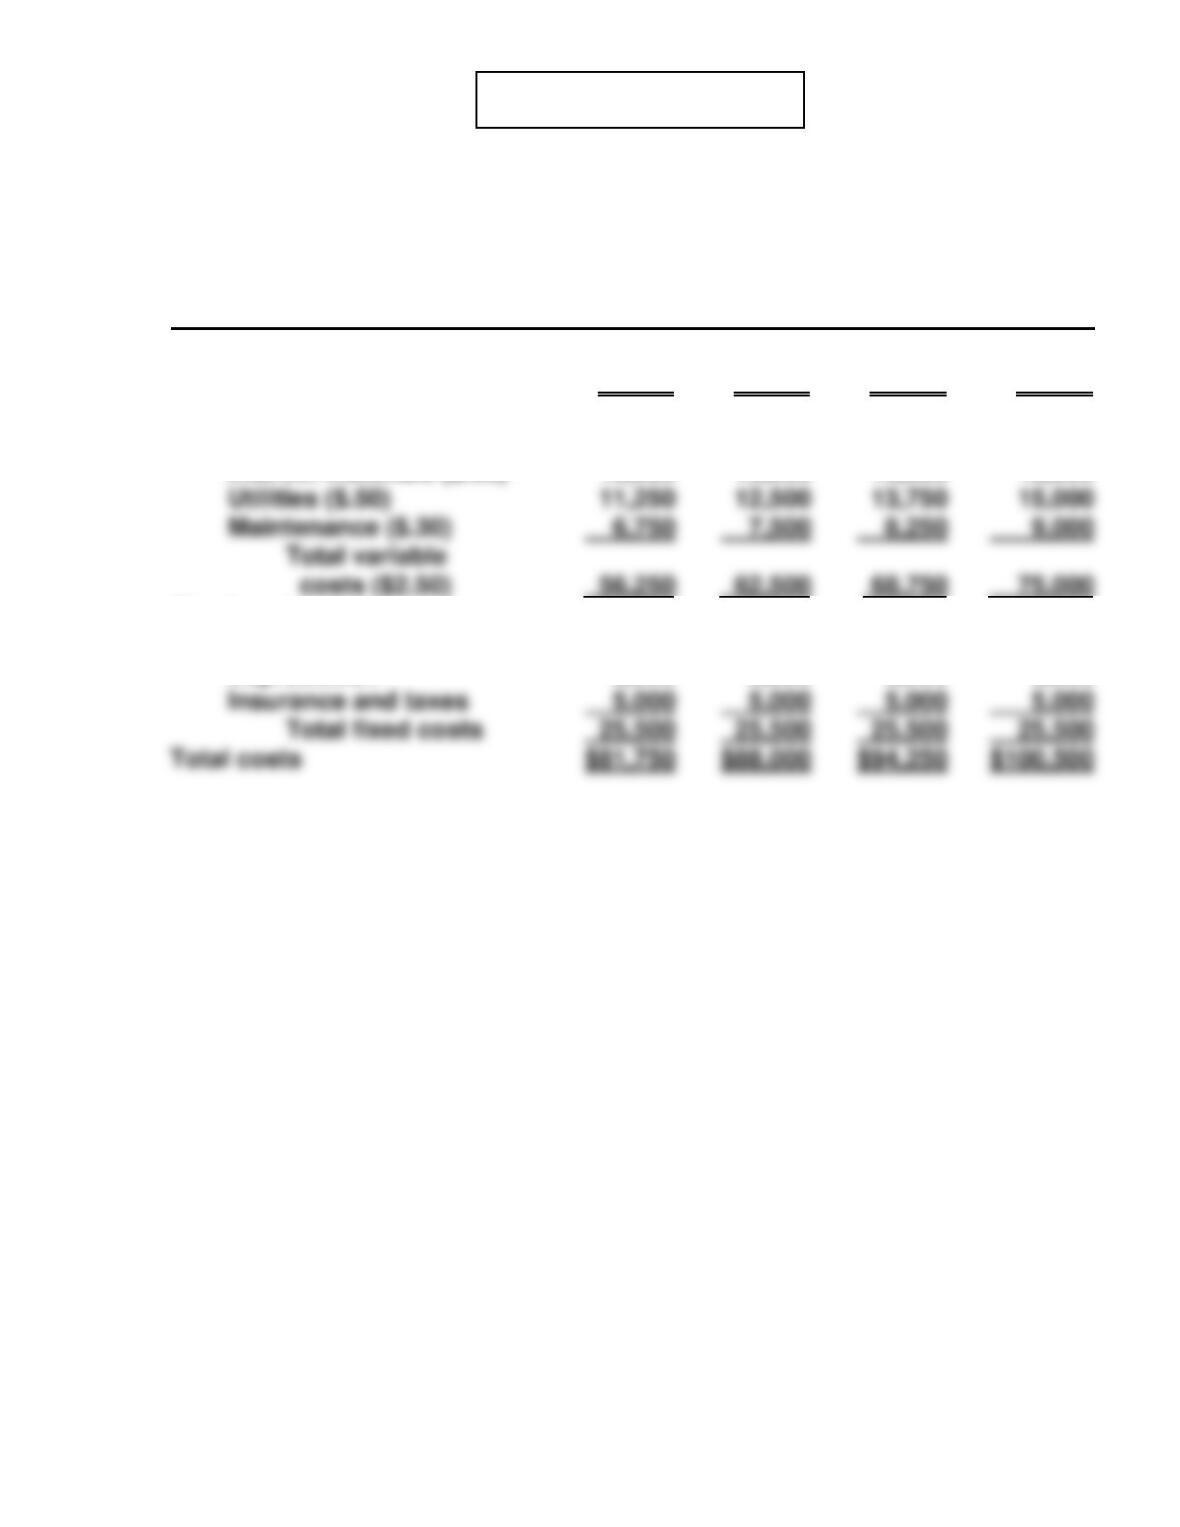
PROBLEM 10-3C
(a) The formula is fixed costs $22,000 plus total variable costs of $2.50 per
unit ($125,000 ÷ 50,000 units).
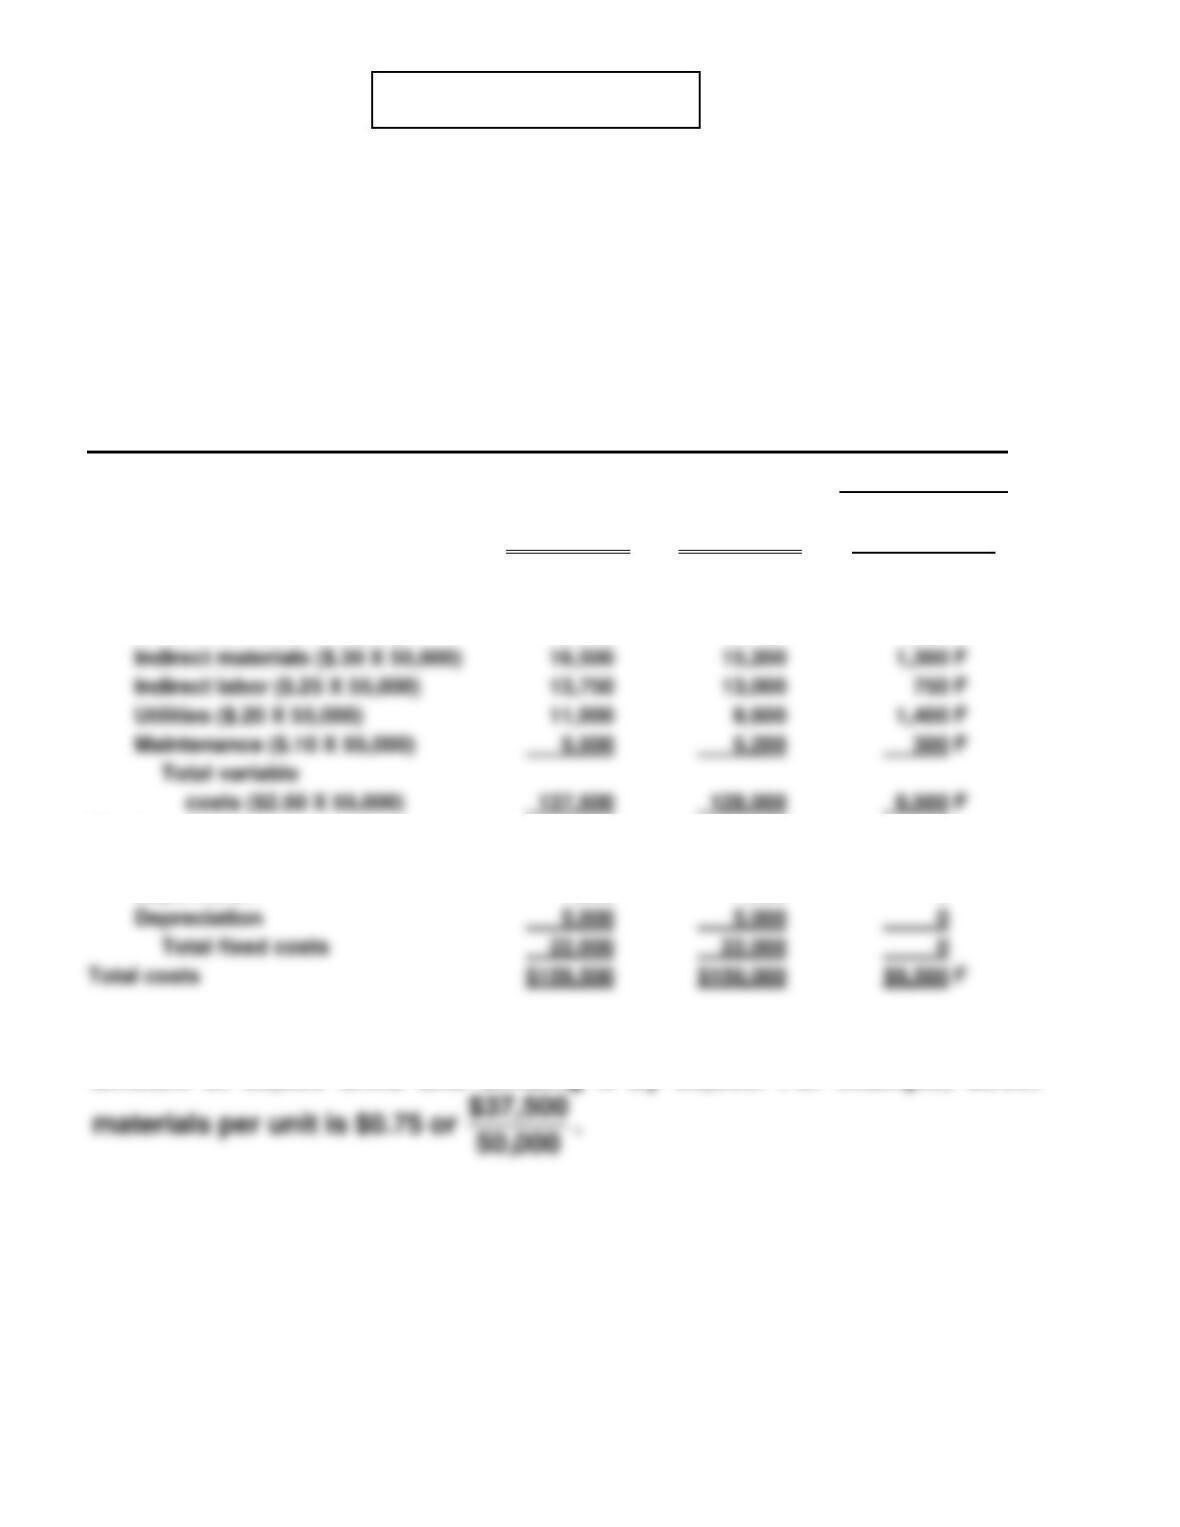
(b) ANSON COMPANY
Packaging Department
Budget Report (Flexible)
For the Month Ended May 31, 2017
Difference
Units
Variable costs*
Direct materials ($.75 X 55,000)
Direct labor ($.90 X 55,000)
Fixed costs
Rent
Supervision
Budget at
55,000 Units
$ 41,250
49,500
10,000
7,000
Actual Costs
55,000 Units
$ 38,000
47,000
10,000
7,000
Favorable F
Unfavorable U
$3,250 F
2,500 F
0 F
0 F
*Note that the per unit variable costs are computed by taking the budget
amount at 50,000 units and dividing it by 50,000. For example, direct
This report provides a better basis for evaluating performance because
the budget is based on the level of activity actually achieved.
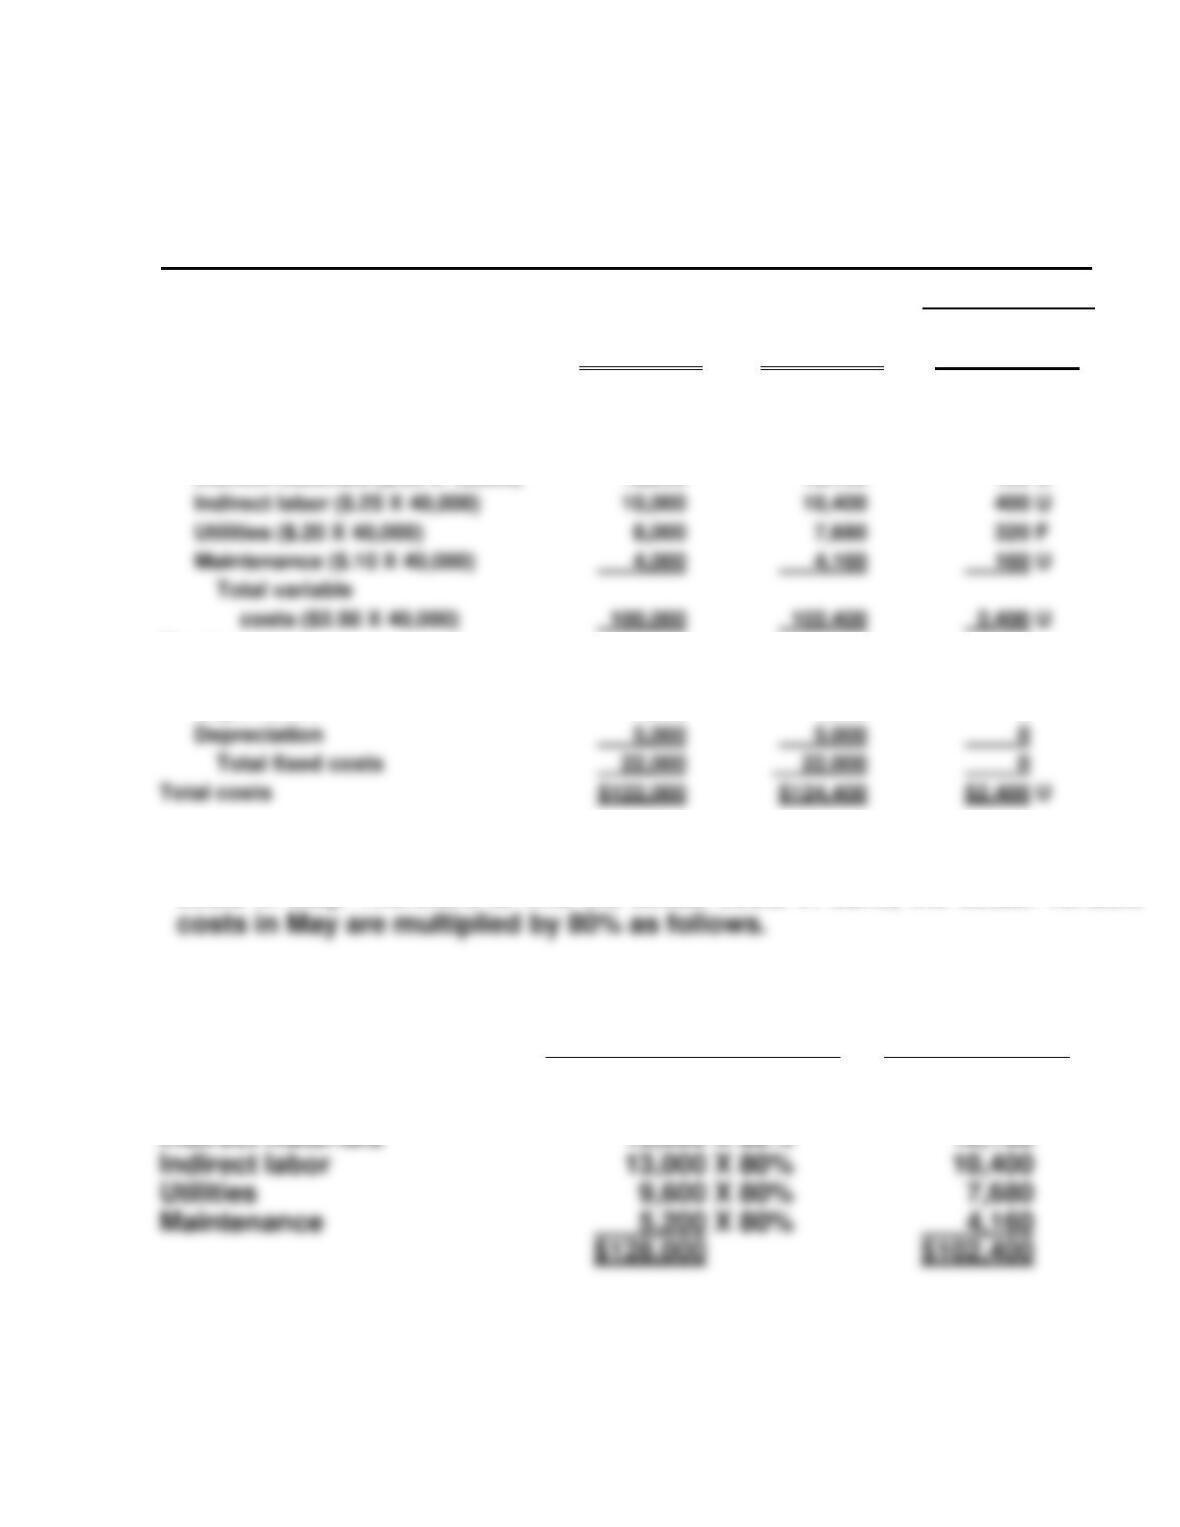
PROBLEM 10-3C (Continued)
(c) ANSON COMPANY
Packaging Department
Budget Report (Flexible)
For the Month Ended June 30, 2017
Difference
Units
Variable costs
Direct materials ($.75 X 40,000)
Direct labor ($.90 X 40,000)
Indirect materials ($.30 X 40,000)
Fixed costs
Rent
Supervision
Budget at
40,000 Units
$ 30,000
36,000
12,000
10,000
7,000
Actual Costs
40,000 Units
$ 30,400*
37,600
12,160
10,000
7,000
Favorable F
Unfavorable U
$ 400 U
1,600 U
160 U
0 U
0 U
*Note that the actual variable costs in June was 20% less than the actual
costs in May. Therefore to find the actual costs in June, the actual variable
May
(actual)
June
(actual)
Direct materials
Direct labor
$ 38,000 X 80%
47,000 X 80%
=
$ 30,400
37,600
PROBLEM 10-4C
(a) ARLEN MANUFACTURING INC.
Electronics Division
Responsibility Report
For the Year Ended December 31, 2017
Difference
Budget
Actual
Favorable F
Unfavorable U
Sales
Variable costs
Cost of goods sold
Controllable fixed costs
Cost of goods sold
Selling and administrative
$2,400,000
1,200,000
200,000
60,000
$2,200,000
1,260,000
191,000
63,000
$200,000 U
60,000 U
9,000 F
3,000 U
(b) The manager did not effectively control revenues and costs. Contribution
margin was $252,000 unfavorable and controllable margin was $246,000
unfavorable. Contribution margin was unfavorable primarily because
sales were $200,000 under budget and variable cost of goods sold was
(c) Two costs are excluded from the report: (1) noncontrollable fixed costs
and (2) indirect fixed costs. The reason is that neither cost is controllable by
the Electronics Division Manager.
PROBLEM 10-5C
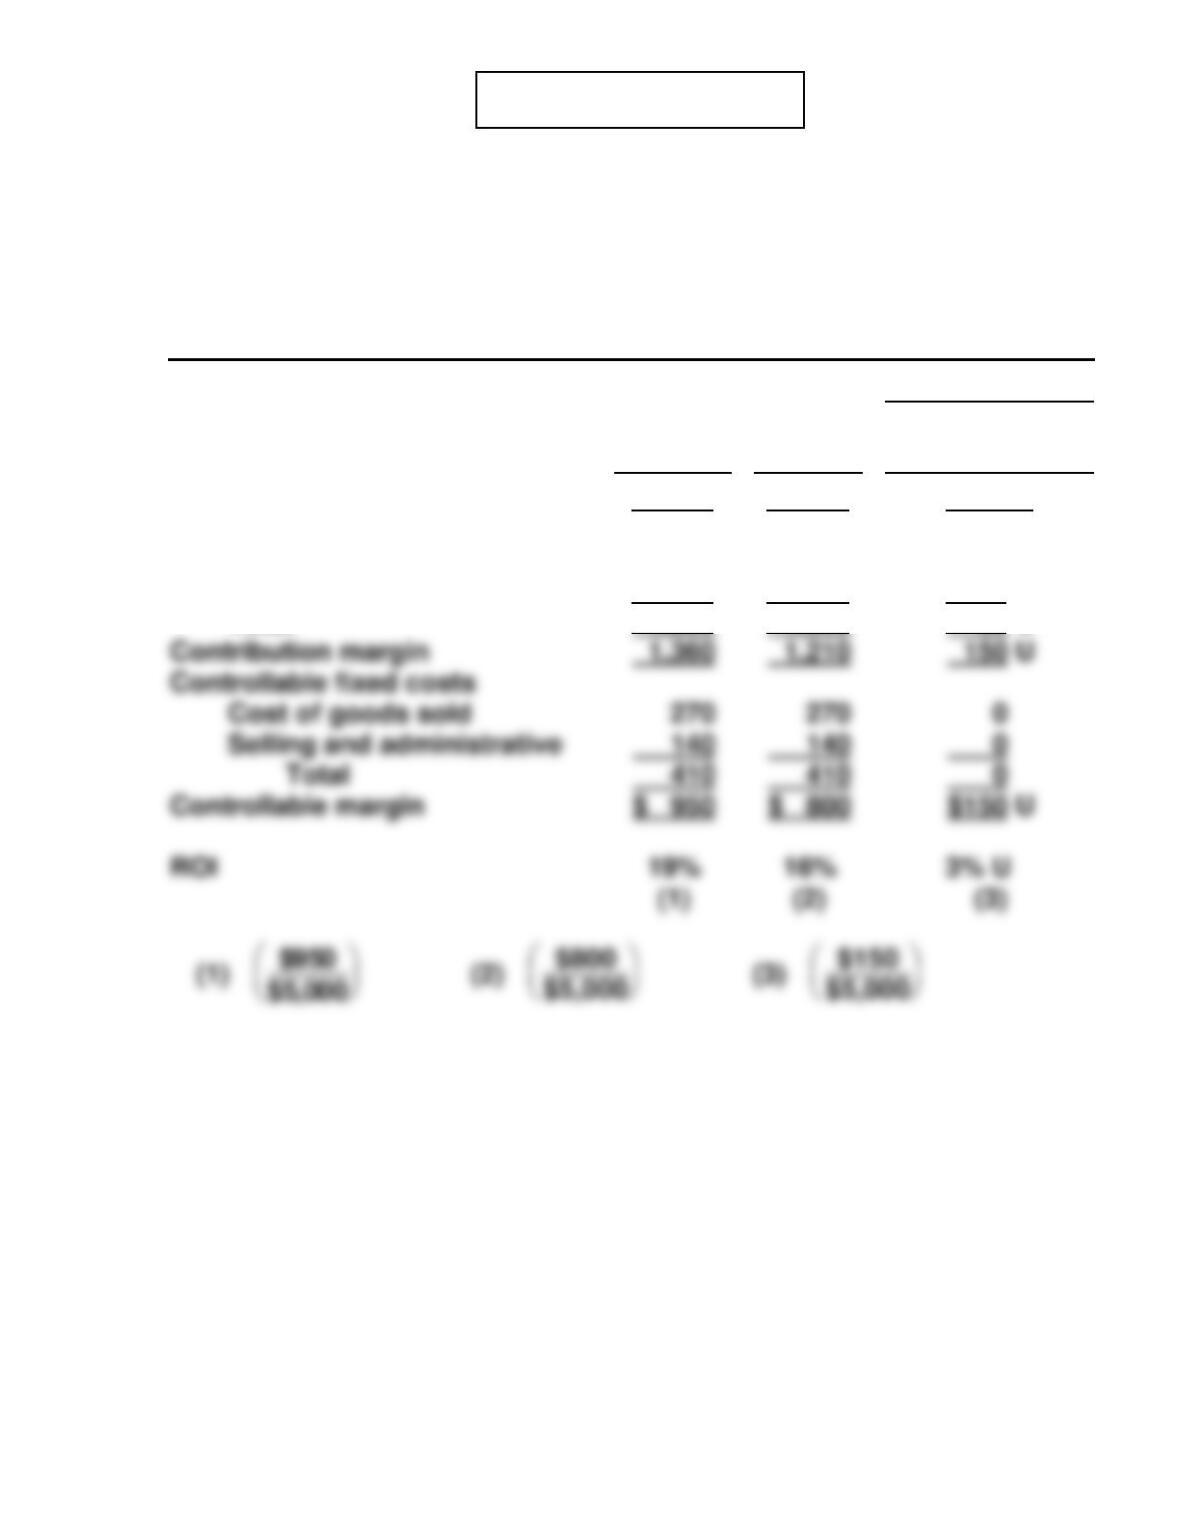
(a) MARX MANUFACTURING COMPANY
Weedeater Division
Responsibility Performance Report
For the Year Ended December 31, 2016
(in thousands of dollars)
Difference
Budget
Actual
Favorable F
Unfavorable U
Sales
Variable costs
Cost of goods sold
Selling and administrative
Total
$3,020
1,310
350
1,660
$2,900
1,400
290
1,690
$120 U
90 U
60 F
30 U
ROI
3% U
PROBLEM 10-5C (Continued)
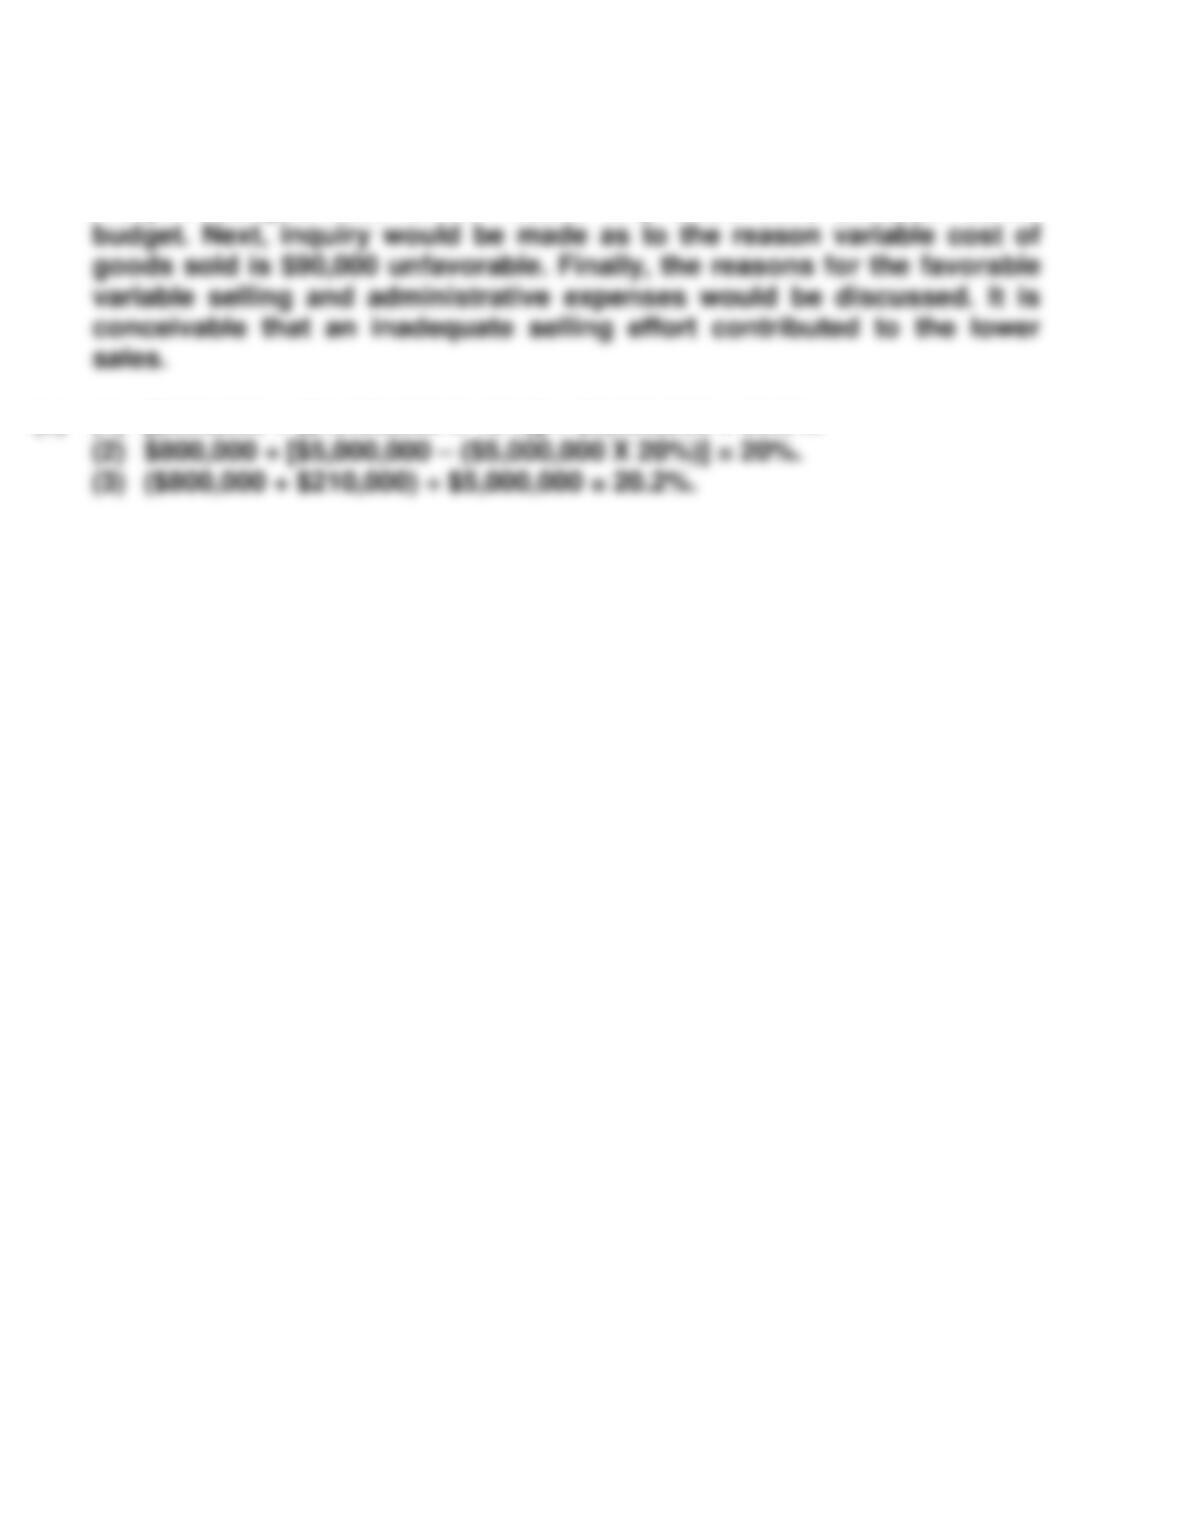
(b) The performance of the manager of the Weedeater Division was below
budget expectations for the year. The item that top management should
likely investigate first is the reason why sales were $120,000 below
(c) (1) [$800,000 + ($1,400,000 X 15%)] ÷ $5,000,000 = 20.2%.
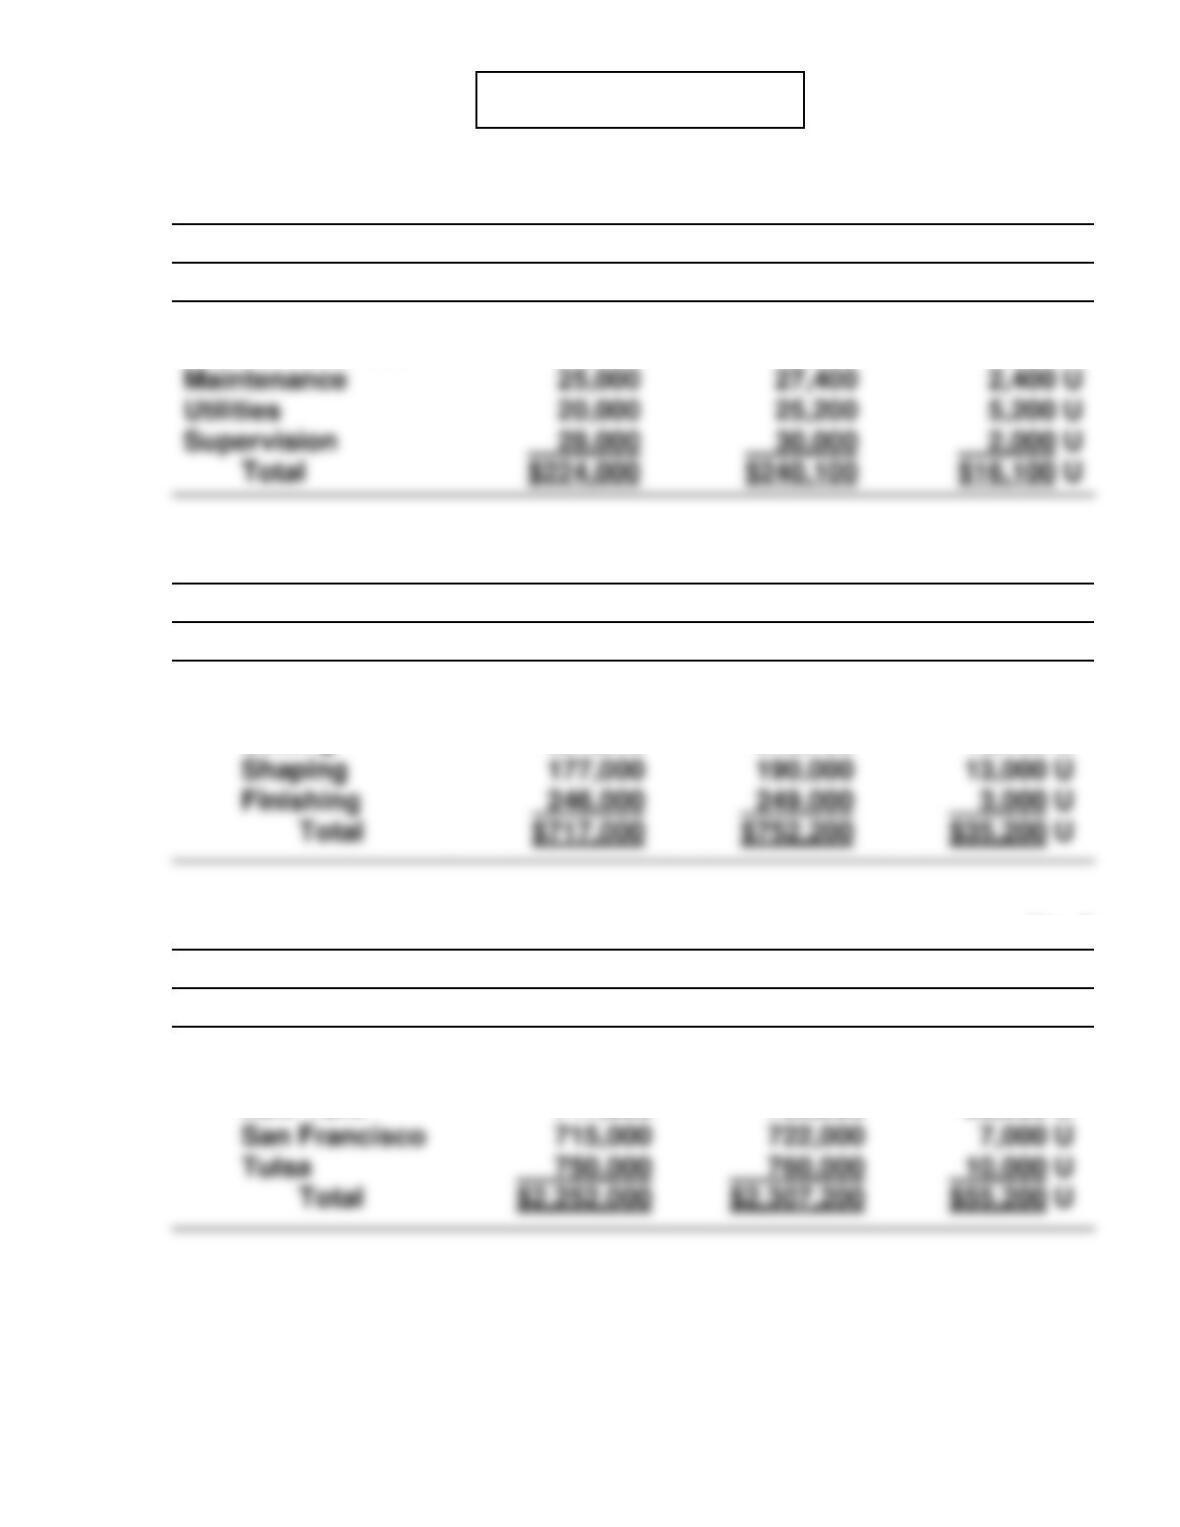
PROBLEM 10-6C
(a) No. 1
To Cutting Department Manager—New York Division Month: January
Controllable Costs:
Budget
Actual
Fav/Unfav
Indirect labor
Indirect materials
$ 90,000
61,000
$ 95,000
62,500
$ 5,000 U
1,500 U
No. 2
To Division Production Manager—New York Month: January
Controllable Costs:
Budget
Actual
Fav/Unfav
New York Division
Departments:
Cutting
$ 70,000
224,000
$ 73,100
240,100
$ 3,100 U
16,100 U
No. 3
To Vice-President—Production Month: January
Controllable Costs:
Budget
Actual
Fav/Unfav
V-P Production
Divisions:
New York
$ 70,000
717,000
$ 73,000
752,200
$ 3,000 U
35,200 U
PROBLEM 10-6C (Continued)
No. 4
To President Month: January
Controllable Costs:
Budget
Actual
Fav/Unfav
President
Vice-Presidents:
Production
$ 91,300
2,252,000
$ 96,200
2,307,200
$ 4,900 U
55,200 U
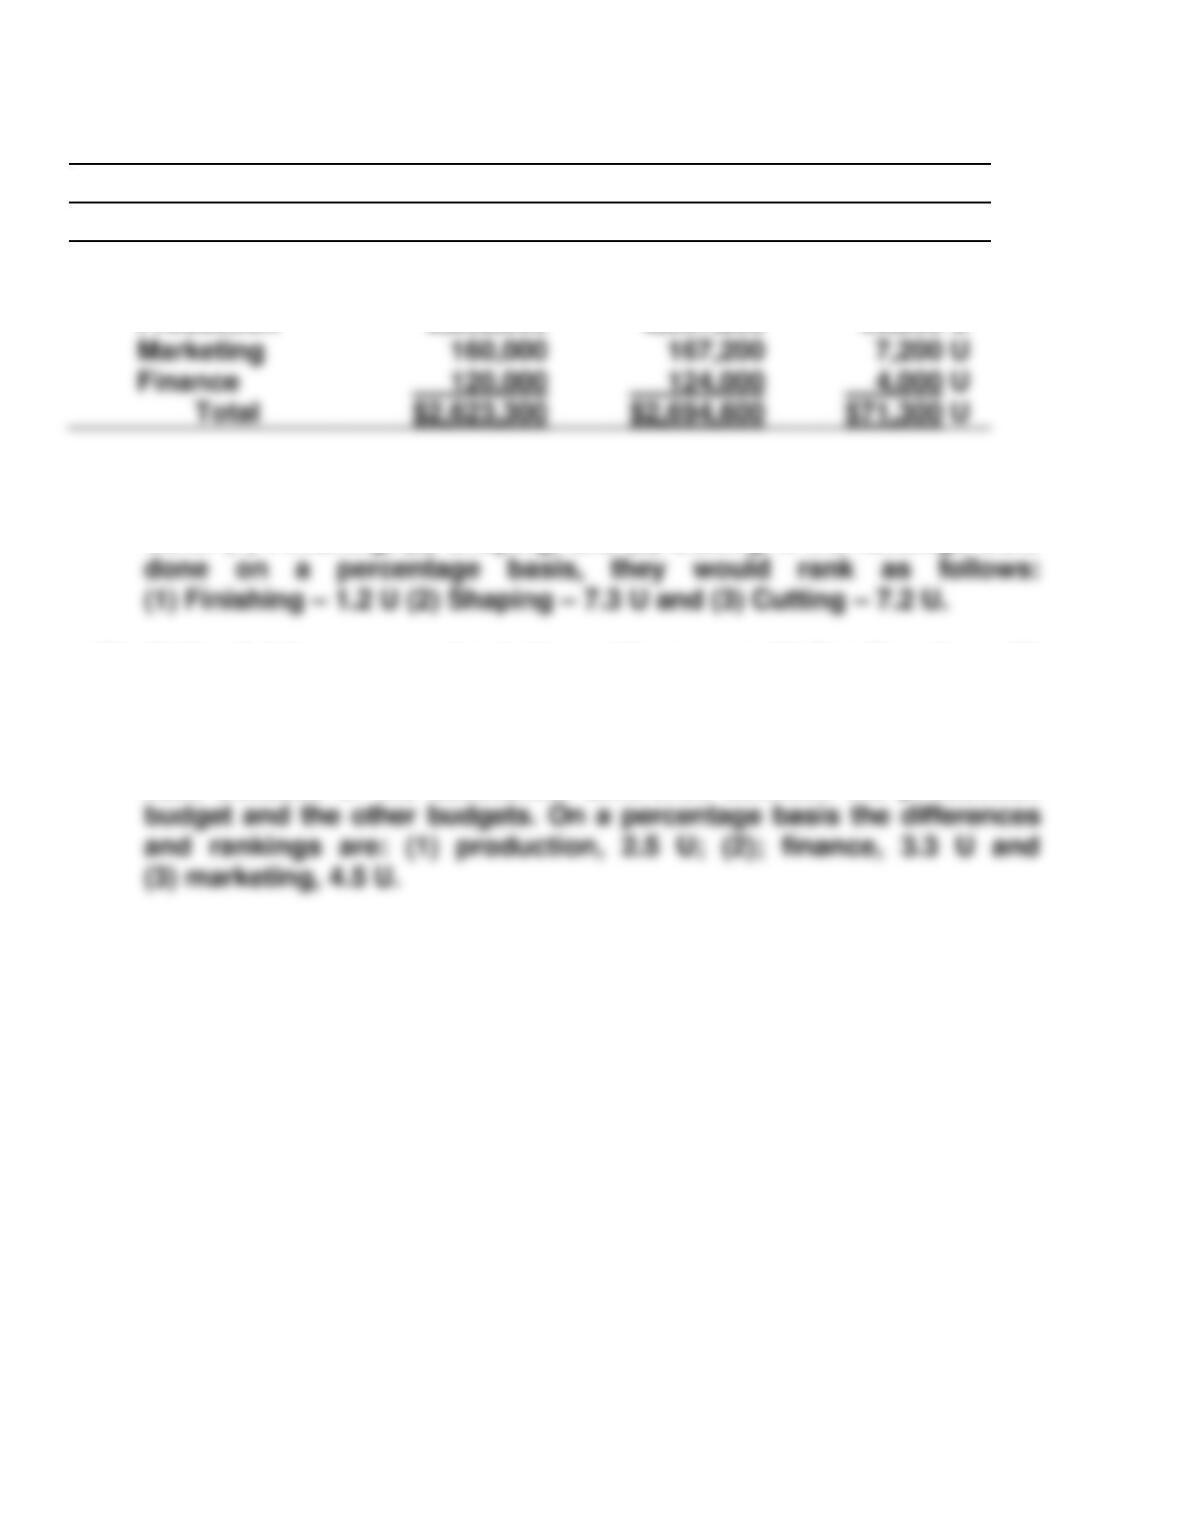
(b) (1) Within the New York division the rankings of the department managers
were: (1) Finishing, (2) Shaping, and (3) Cutting. If the rankings were
(2) At the division manager level, the rankings were: (1) San Francisco, (2)
Tulsa, and (3) New York.
(3) Rankings in terms of dollars may be somewhat misleading in this
case because of the substantial difference between the production
*PROBLEM 10-7C
(a) (1) ROI = Controllable Margin ÷ Average Operating Assets
(2) Residual Income = Controllable Margin – (Minimum Rate of Return X
Average Operating Assets)
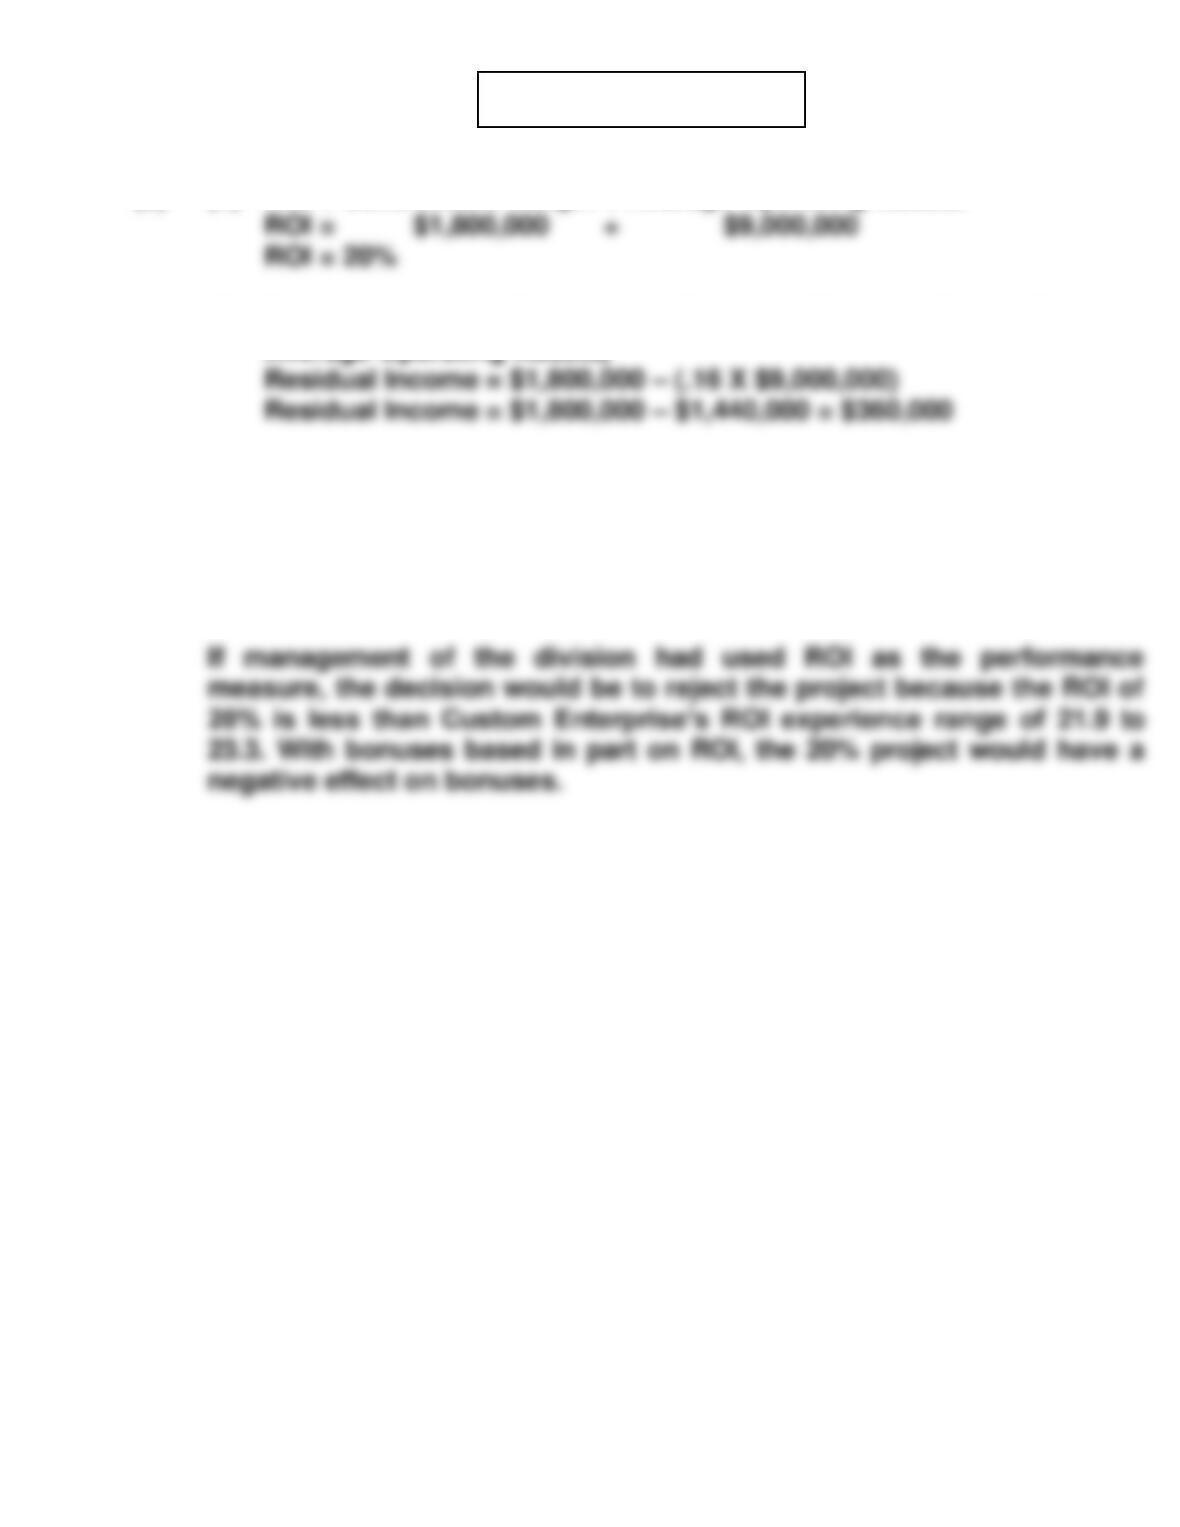
(b) The management of Custom Enterprises would clearly have accepted the
investment opportunity it had in 2017 if residual income had been used
as the performance measure because an increase in residual income
results from a project whose ROI is greater than the minimum rate of
return.
If management of the division had used ROI as the performance