10
Fundamentals of Cost Management
Solutions to Review Questions
10–1.
Activity-based costing provides management with detailed costing information about
10–2.
Activity-based management can be implemented without an activity-based costing
10–3.
Value-added activities add value to the product or service whereas nonvalue-added
10–4.
Customers affect costs by the way they interact with the company and place demands
10–5.
10–6.
Resources supplied represent the capacity of the organization. They are the resources
10–7.
Capacity costs, generally included in the fixed overhead allocation, affect reported
product costs. Managers use reported costs to make decisions such as what price to
10–8.
The cost of excess capacity should be assigned to products or customers if the reason
10–9.
Quality affects cost in two major ways. Conformance costs are those that the firm incurs
in order to ensure the product or service meets required quality levels. Examples
10–10.
The four categories of a cost of quality system are:
1. Prevention: Costs to ensure good quality (product design, training).
Solutions to Critical Analysis and Discussion Questions
10–11.
Answers will vary.
10–12.
10–13.
10–14.
Answers will vary.
10–15.
10–16.
10–17.
10–18.
Two important factors managers need to consider are what competitors will do and how
10–19.
There is an opportunity cost associated with idle capacity. Knowing that capacity is not
10–20.
10–21.
Answers will vary. The answer depends on why excess demand exists and what
10–22.
Answers will vary but should include reasons why the elements are not important. For
instance, when purchasing a low-cost item, like paint to touch up minor scratches,
10–23.
Answers will vary. One example follows. The quality-based view would encourage
continuous improvement of the production process and might offer incentives (i.e. cash

Solutions to Exercises
10–24. (10 min.) Activity-Based Cost Management in a College.
10–25. (10 min.) Activity-Based Cost Management for a Hotel.
1. b. Improves efficiency. Having guests check in on-line means less work for the
10–26. (10 min.) Cost Hierarchy for a Not-for-Profit.
10–27. (20 min.) Driver Identification.
a. Number of calls to new commercial customers; records kept by sales reps.
10–28. (20 min.) Driver Identification.
10–29. (20 min.) Activity-Based Costing of Customers: Marvin’s Kitchen Supply.
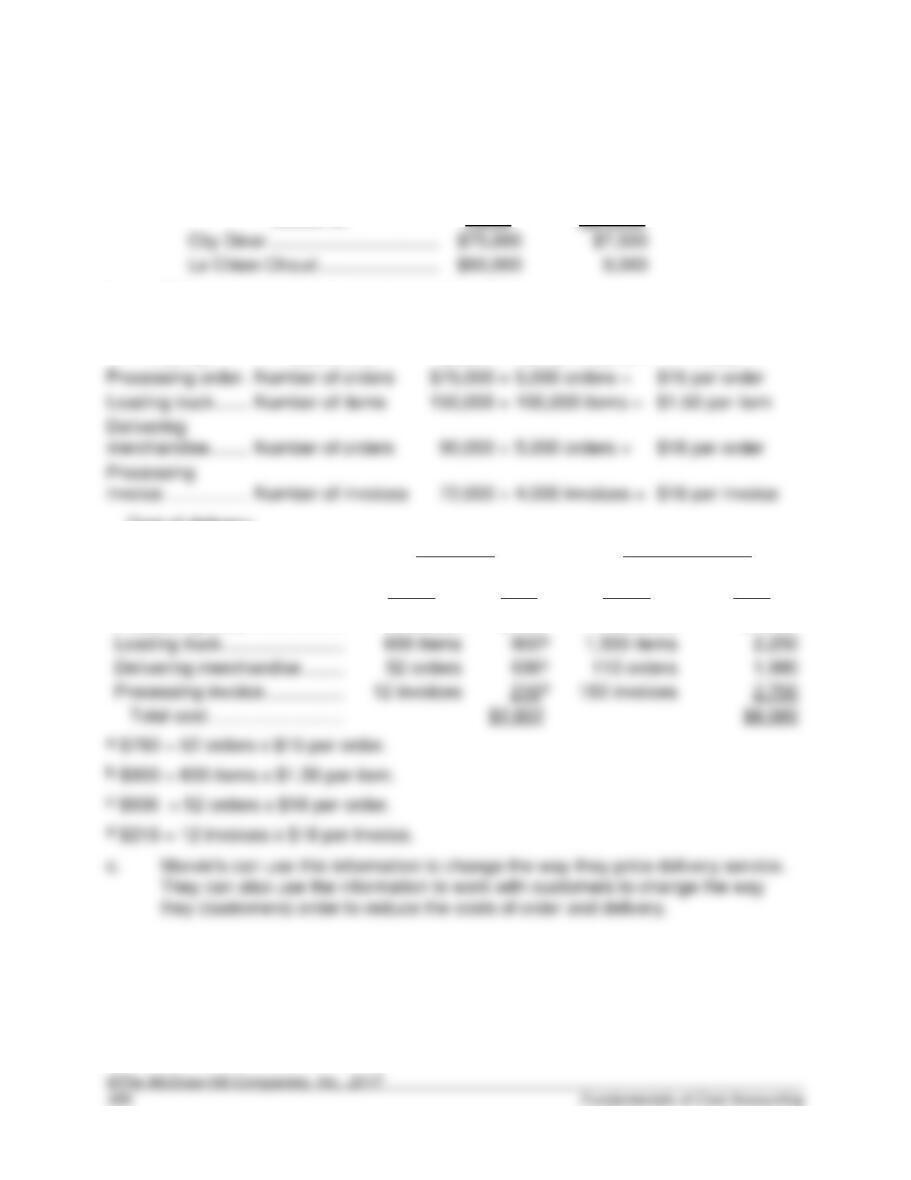
a. Delivery cost based on order value:
Customer
Order
Value
Delivery Charge
(@10%)
City Diner …………………………………………
Le Chien Chaud ……………………………..
b. Delivery cost based on activity-based costing:
Cost driver rates:
Activity
Cost Driver
Cost ÷
Driver Volume =
Rate
Cost of delivery:
City Diner
Le Chien Chaud
Activity
Units of Cost
Driver
Cost
Units of Cost
Driver
Cost
Processing order ………………
52 orders
$780a
110 orders
$1,650
Loading truck ……………………
600 items
Delivering merchandise ……..
Processing invoice …………….
12 invoices
$8,580
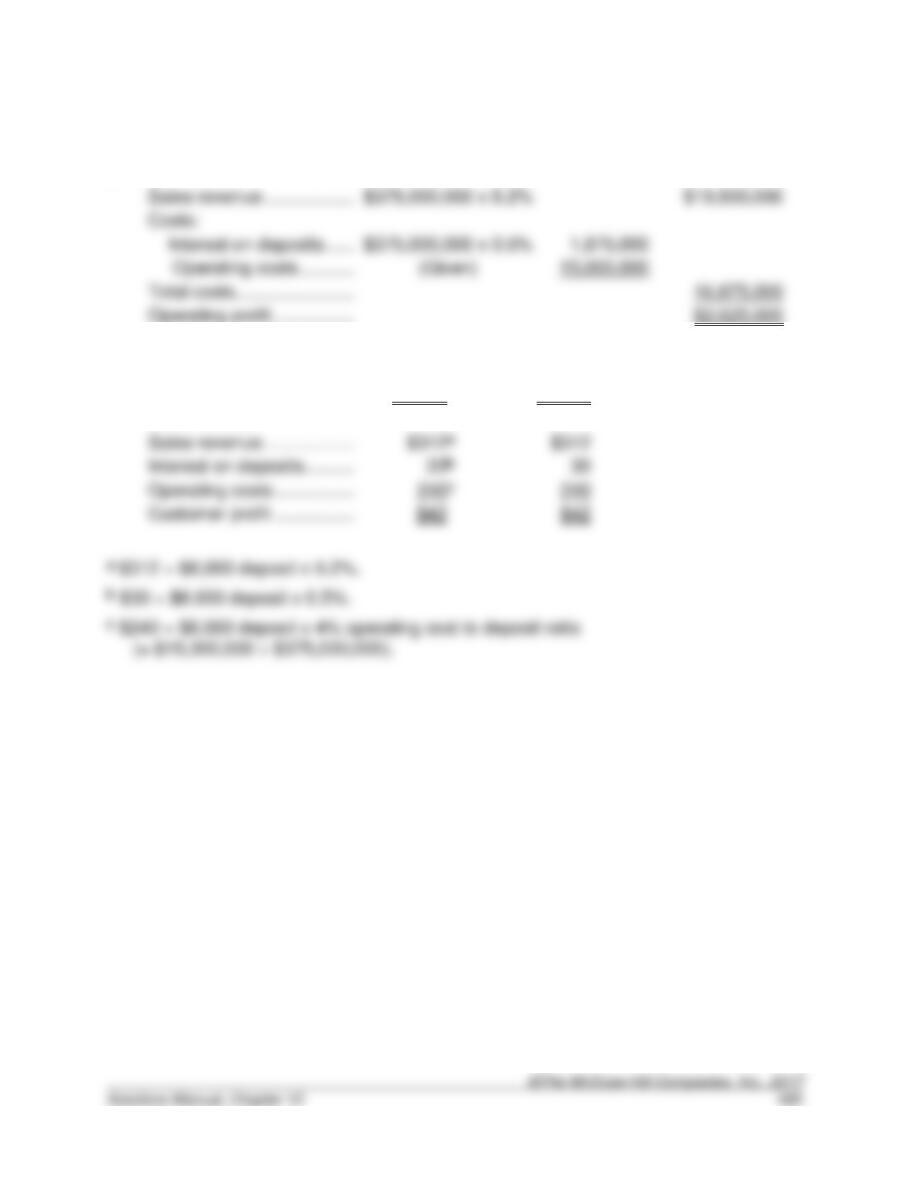
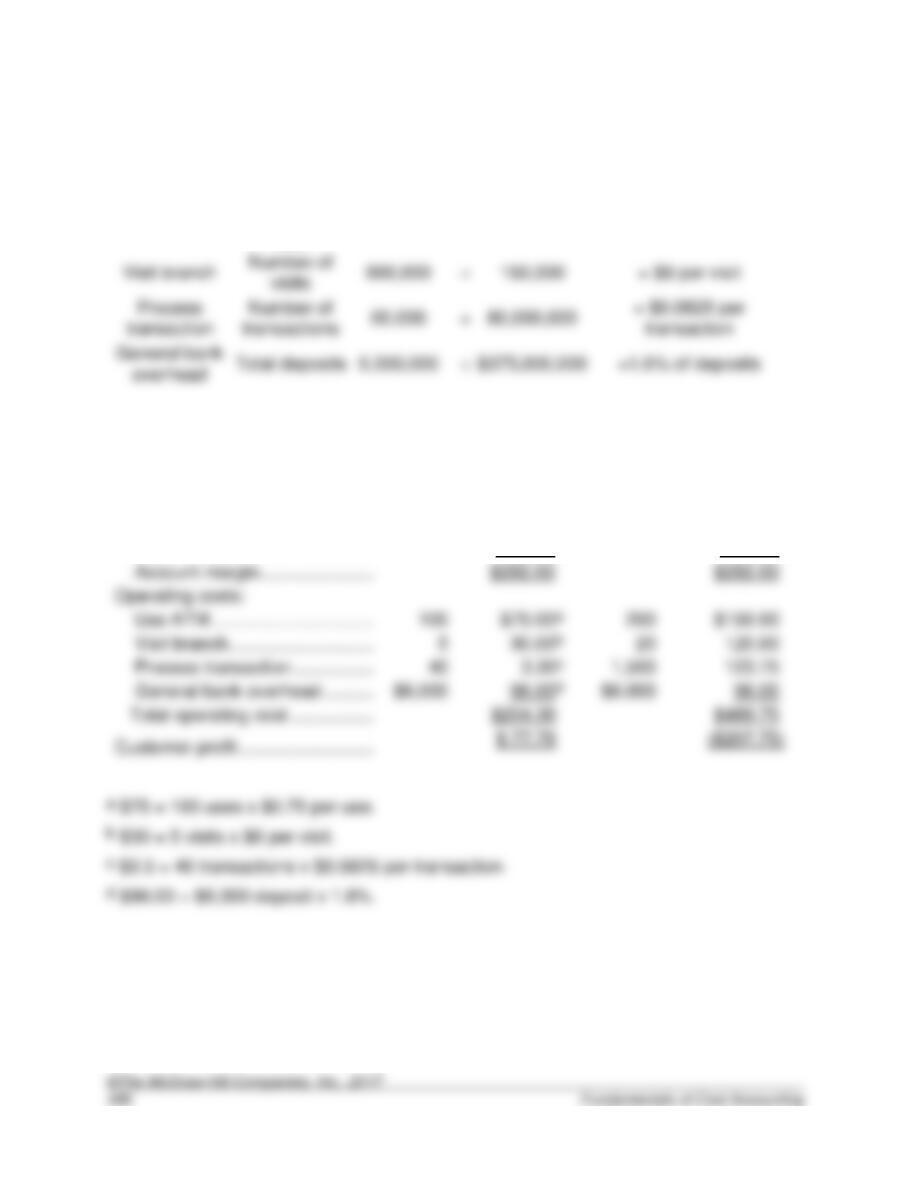
10–30. (30 min.) Activity-Based Costing of Customers: Rock Solid Bank & Trust.
a.
Sales revenue ……………….
Costs:
Total costs…………………….
Operating profit ……………..
$2,625,000
b.
Customer A
Customer B
Deposit …………………………..
$6,000
$6,000
Sales revenue …………………
Interest on deposits ………….
Operating costs ……………….
10–30. (continued)
c.
Activity
Cost Driver
Cost
Driver Volume
Rate
Use ATM
Number of
uses
$1,500,000
÷
2,000,000
= $0.75 per use
Number of
visits
transaction
Number of
transactions
÷
transaction
Customer A
Customer B
Activity
Units of
Cost
Driver
Units of
Cost
Driver
Sales revenue …………………………………………….
$312.00
$312.00
Interest on deposit ………………………………………
30.00
30.00
$282.00
$282.00
Operating costs:
1,500
$489.75
Customer profit …………………………………………..
10–31. (15 min.) Activity-Based Costing of Customers: Rock Solid Bank & Trust.
10–32. (15 min.) Activity-Based Costing of Customers—Ethical Issues: Red’s
Lumber.
a. Red could use the information to offer “discounts” for weekday orders, which is
equivalent to a premium for weekend orders. Before Red makes any changes, he
10–33. (15 min.) Activity-Based Costing of Customers—Ethical Issues: Central
State College.
a. Possible allocation bases include number of students, student hours in the lab,
b. This is a difficult question and answers will vary. The dean views the training
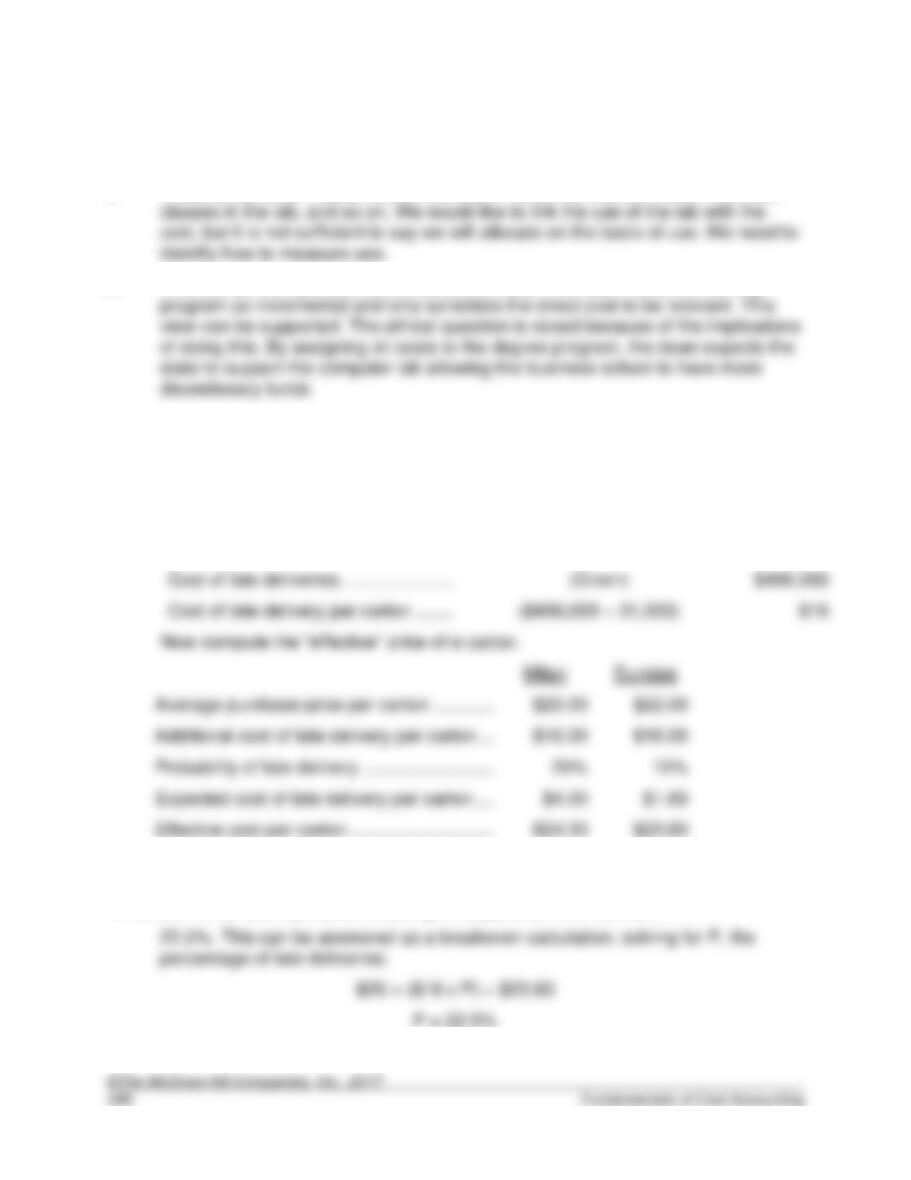
10–34. (15 min.) Activity-Based Costing of Suppliers: Hult Games.
This can be answered using the format of Exhibit 10.9. First compute the cost of
a late delivery.
Number of cartons delivered late
(100,000 x 25% + 60,000 x 10%)
31,000
Cost of late deliveries …………………….
Cost of late delivery per carton ………. per ton
Average purchase price per carton …………..
Additional cost of late delivery per carton …..
Probability of late delivery ……………………….
Expected cost of late delivery per carton ……
Effective cost per carton ………………………….
10–35. (10 min.) Activity-Based Costing of Suppliers: Hult Games.
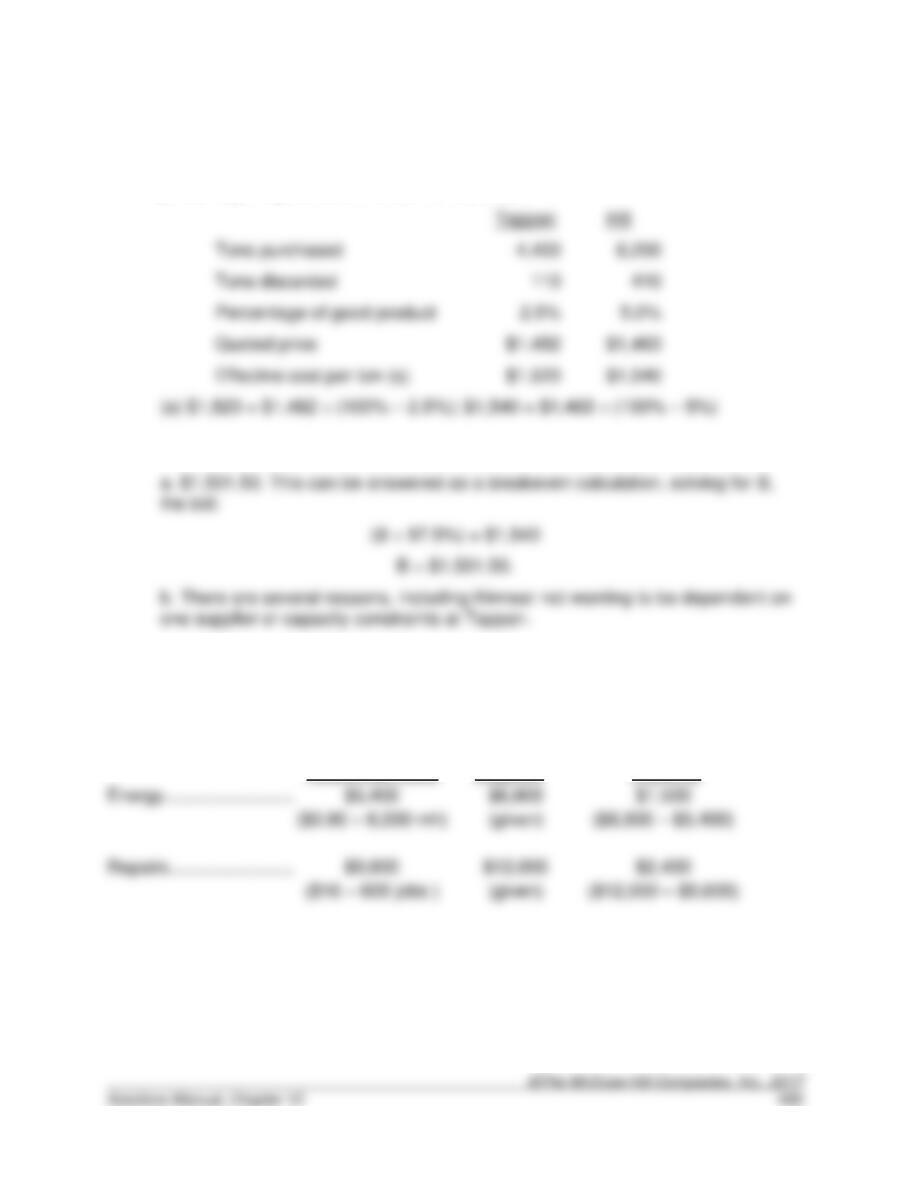
10–36. (20 min.) Activity-Based Costing of Suppliers: Kinnear Plastics.
The approach to this problem is to determine how much it costs to purchase a
ton of “good” plastic. The effective price is the quoted price divided by the
percentage of good tons that can be expected:
10–37. (10 min.) Activity-Based Costing of Suppliers: Kinnear Plastics.
10–38. (15 min.) Resources Used versus Resources Supplied: Tri-State Mill.
Resources Used
Resources
Supplied
Unused Resource
Capacity
Energy ……………………………………………………….
Repairs ………………………………………………………
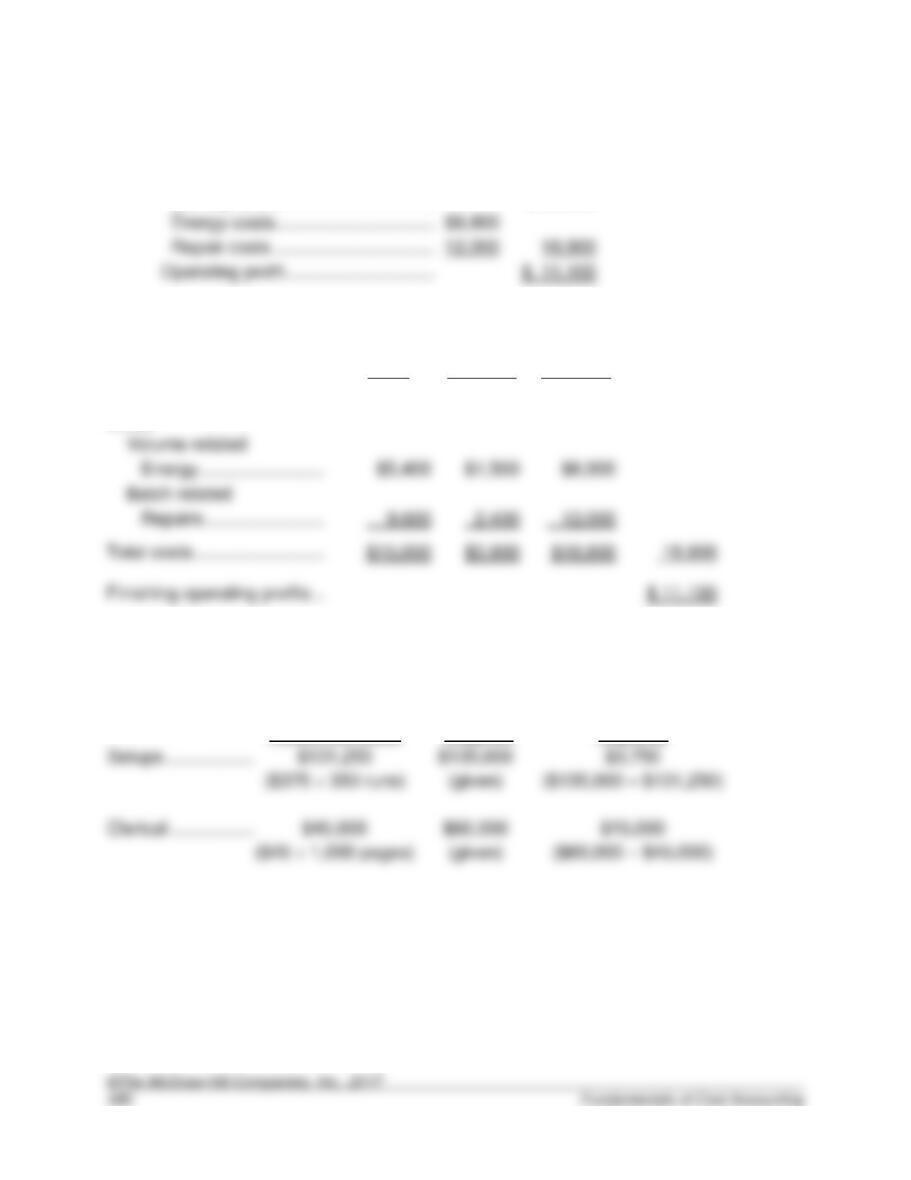
10–39. (10 min.) Resources Used versus Resources Supplied: Tri-State Mill.
a.
Finishing sales ……………………………..
$ 30,000
b.
Resources
Used
Unused
Resource
Capacity
Resources
Supplied
Finishing sales ……………….
$ 30,000
Costs
Repairs ……………………
10–40. (15 min.) Resources Used versus Resources Supplied: Conlon
Enterprises.
Resources Used
Resources
Supplied
Unused Resource
Capacity
$60,000
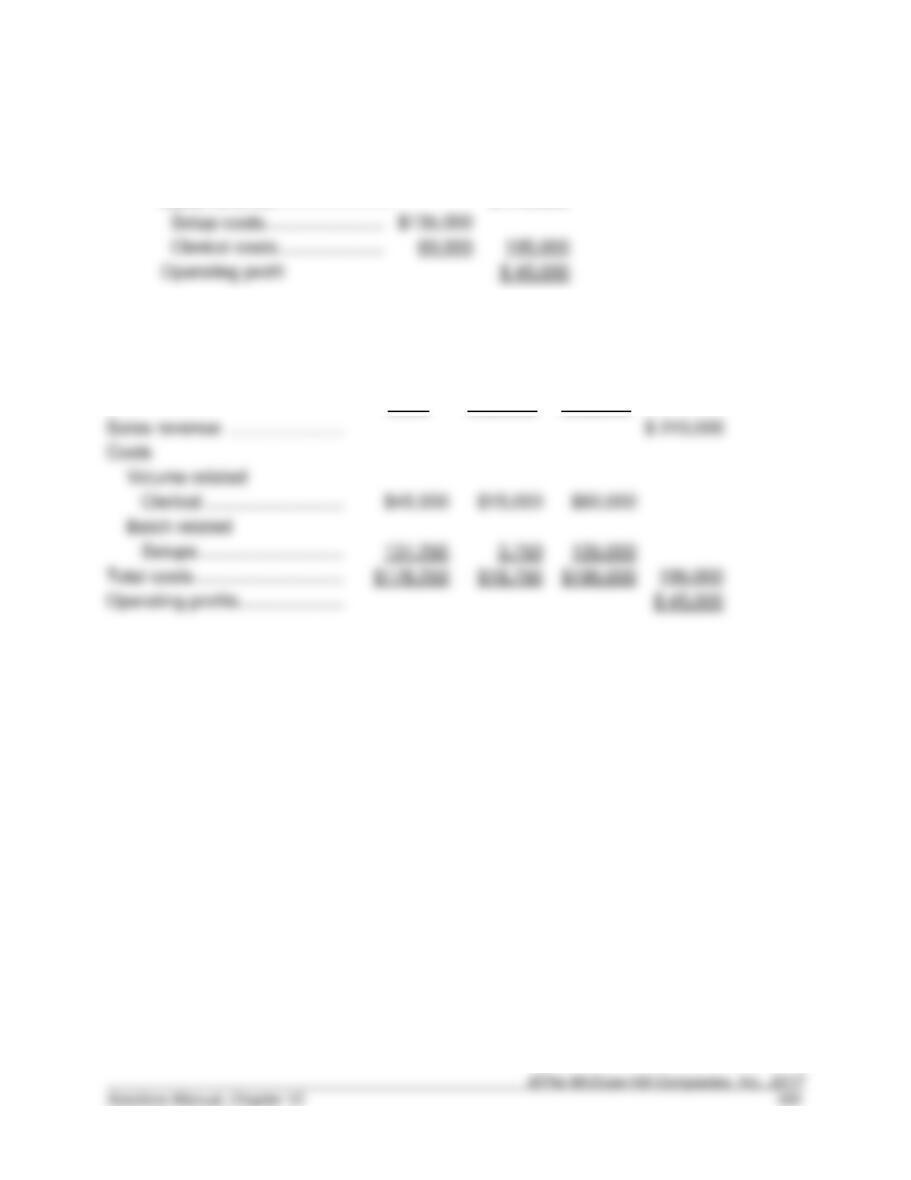
10–41. (10 min.) Resources Used versus Resources Supplied: Conlon Enterprises.
a.
Sales revenue …………………….
$ 240,000
b.
Resources
Used
Unused
Resource
Capacity
Resources
Supplied
Sales revenue …………………..
Clerical ……………………….
$176,250
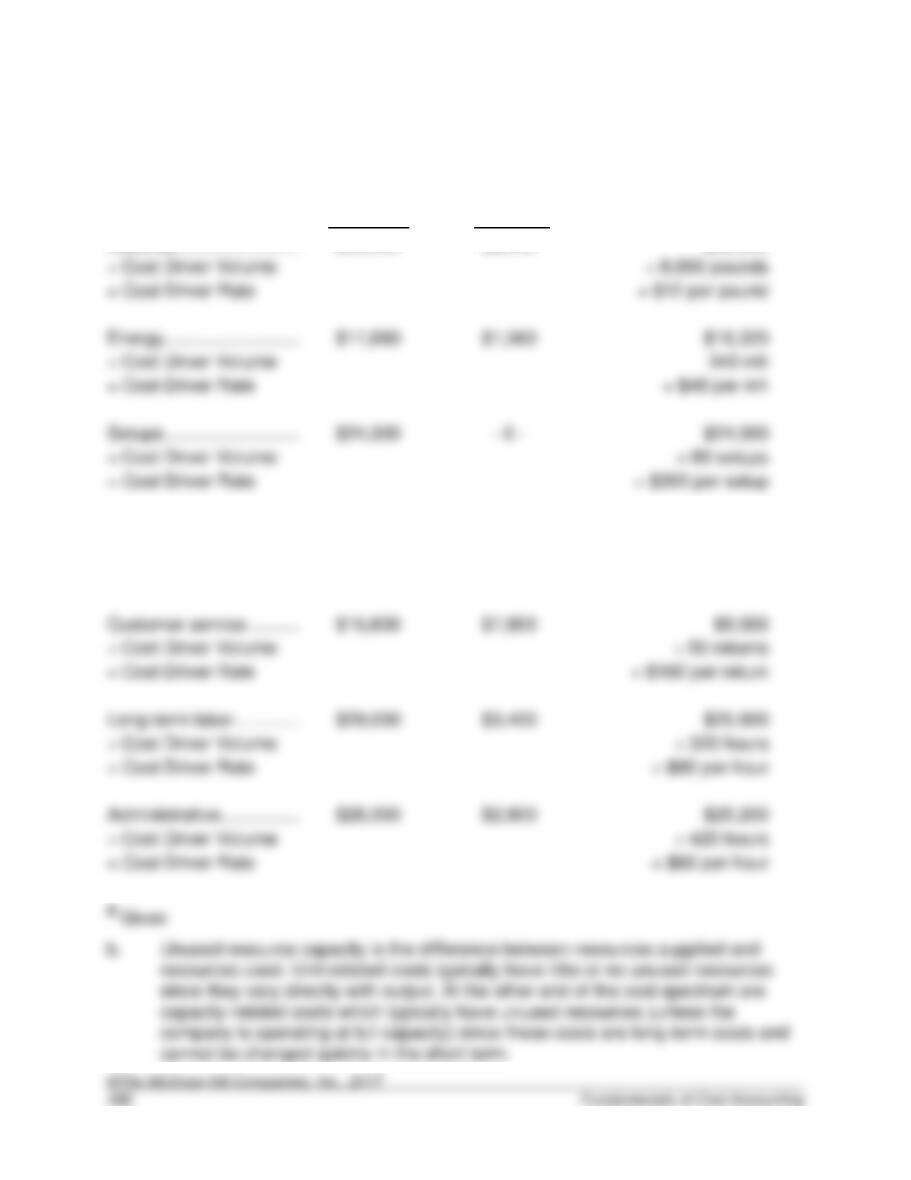
10–42. (40 min.) Resources Used versus Resources Supplied: Carbon Company.
a.
Resources
Supplieda
Unused Resource
Capacitya
Resources Used
÷ Cost Driver Volume
= Cost Driver Rate
= Cost Driver Rate
÷ Cost Driver Volume
Materials ……………………………………………………
$98,000
$2,000
$96,000
Purchasing …………………………………………………
÷ Cost Driver Volume
= Cost Driver Rate
$21,000
$1,800
÷ Cost Driver Volume
= Cost Driver Rate
÷ Cost Driver Volume
$19,200
÷ 80 orders
= $240 per order
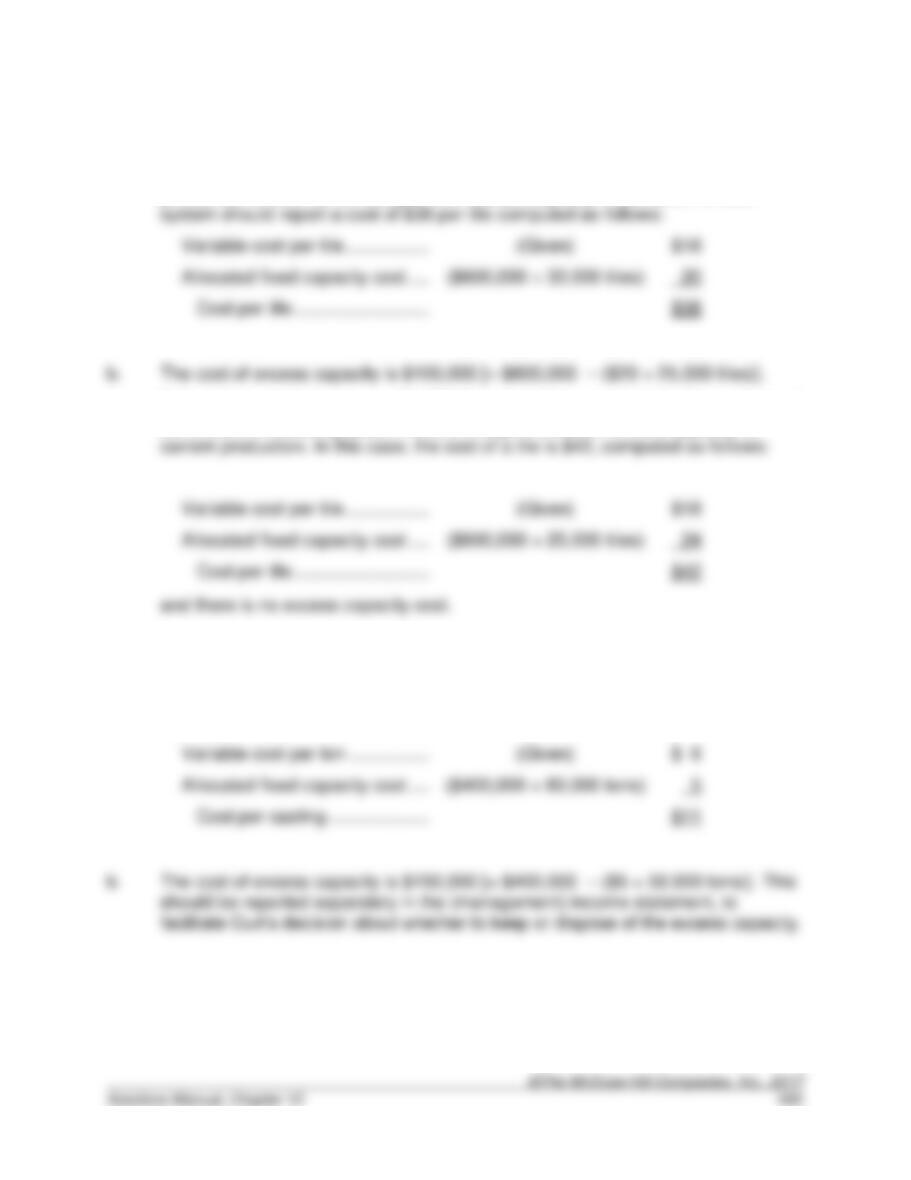
10–43. (20 min.) Assigning Cost of Capacity: Mimi’s Fixtures.
a. Because the plant was purchased with excess capacity for future growth, current
production should not be charged with excess capacity. Therefore, the cost
c. If the minimum plant size was 30,000 tiles, then the capacity is for the customers’
benefit and the costing system should charge the cost of excess capacity to
10–44. (20 min.) Assigning Cost of Capacity: Curt’s Castings.
a. Because the plant was purchased for the benefit of Curt, current production
should not be charged with excess capacity. Therefore, the cost system should
report a cost of $8 per ton computed as follows:
10–45. (15 min.) Costs of Quality: Waterloo Company.
Customer complaints
EF
Materials inspection
Process inspection
Rework
Testing equipment
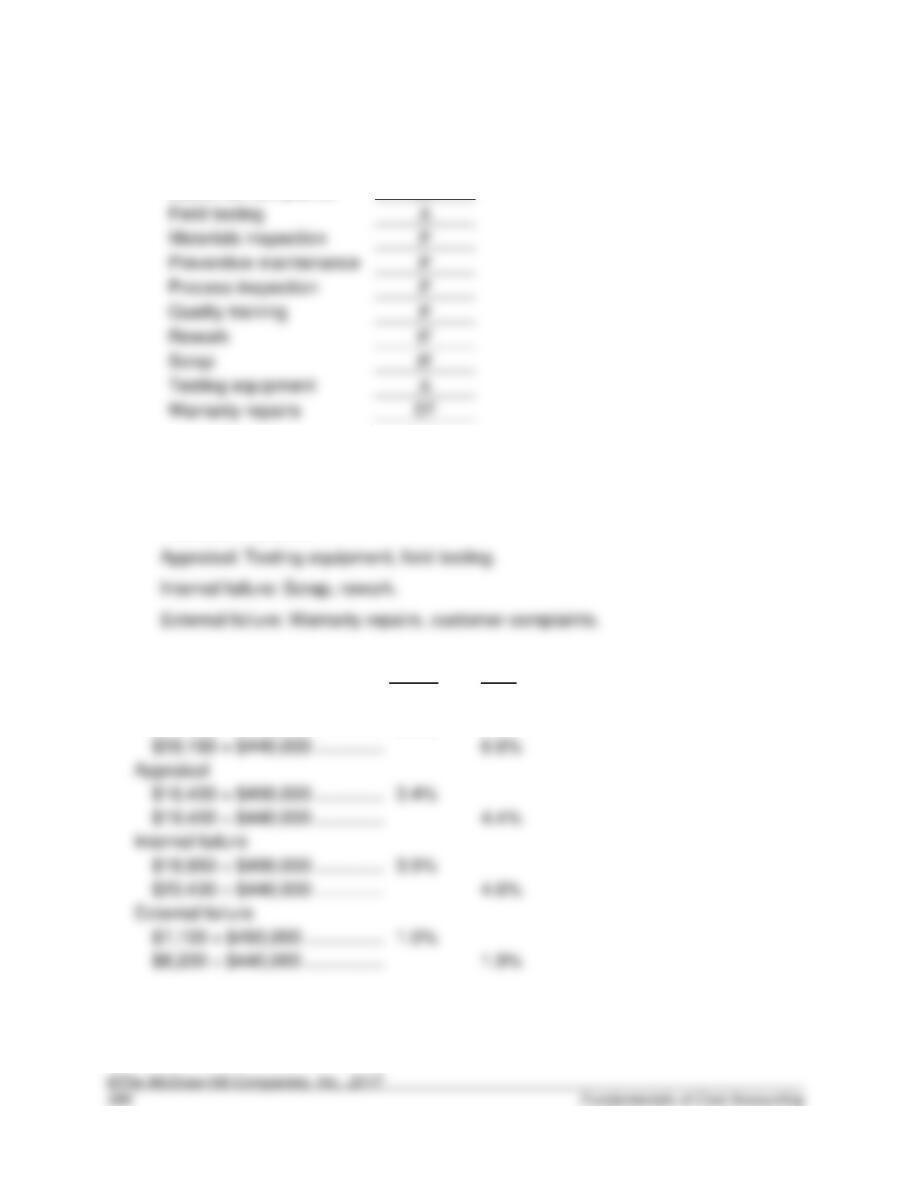
10–46. (20 min.) Costs of Quality: Domingo Corporation.
a. Prevention: Process inspection, quality training, preventive maintenance,
materials inspection.
b.
March
April
Prevention
$41,450 ÷ $490,000 …………………………………
8.5%
$29,180 ÷ $440,000 …………………………………
6.6%
Appraisal
$16,400 ÷ $490,000 …………………………………
$19,400 ÷ $440,000 …………………………………
Internal failure
$20,430 ÷ $440,000 …………………………………
External failure
$7,100 ÷ $490,000 …………………………………..
$8,200 ÷ $440,000 …………………………………..
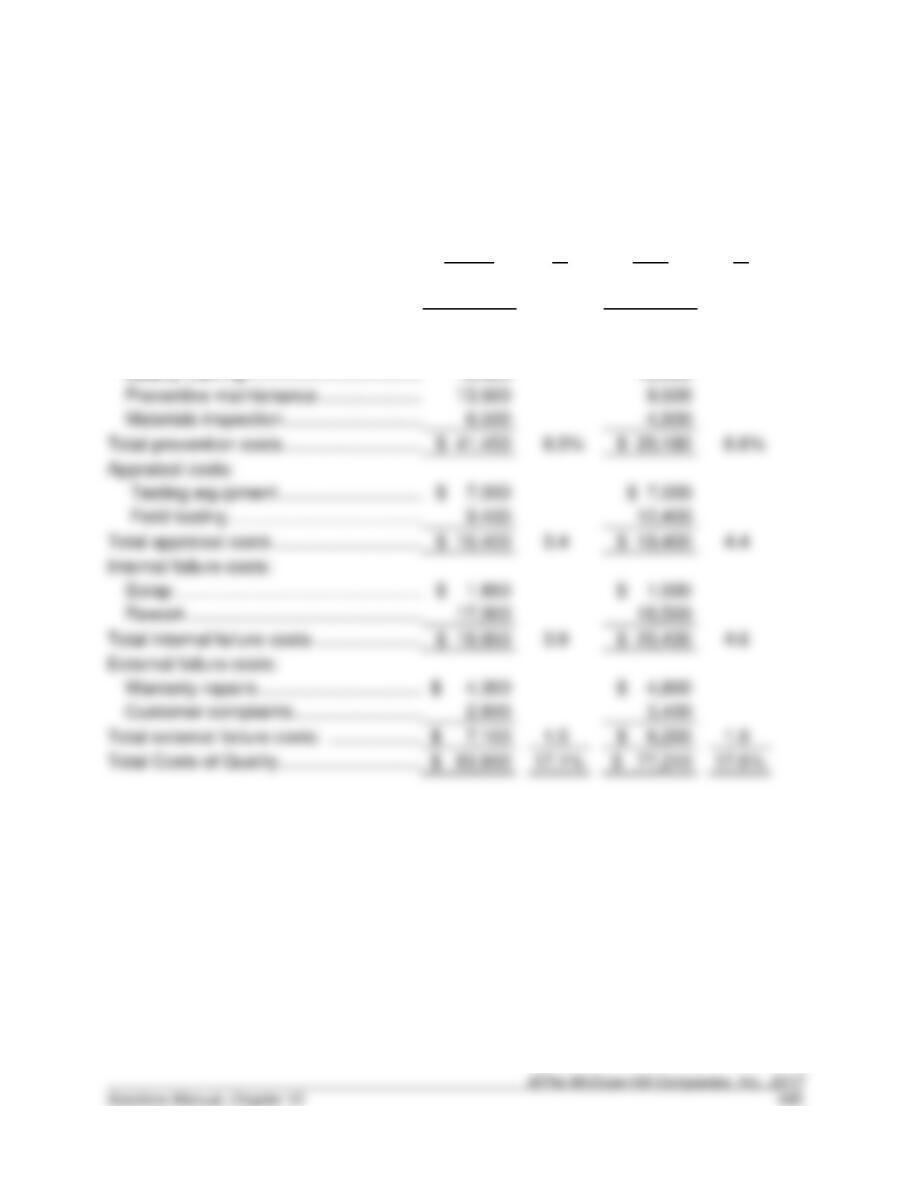
10–47. (30 min.) Trading-Off Costs of Quality: Domingo Corporation.
Domingo Corporation
Cost of Quality Report
March
%
April
%
Sales revenue …………………………………………….
$490,000
$440,000
Prevention costs:
Process inspection …………………………………..
$ 1,650
$ 1,880
Quality training …………………………………………
19,800
13,000
Materials inspection ………………………………….
Total prevention costs ………………………………….
$ 41,450
$ 29,180
Appraisal costs:
Testing equipment …………………………..………
$ 7,000
Total appraisal costs ……………………………………
$ 16,400
$ 19,400
Internal failure costs:
Scrap ……………………………………………………..
$ 1,850
$ 1,930
Total internal failure costs …………………………….
$ 18,850
$ 20,430
External failure costs:
Warranty repairs ………………………………………
$ 4,800
Customer complaints ………………………………..
Total external failure costs: ………………………….
$ 8,200
Total Costs of Quality …………………………………..
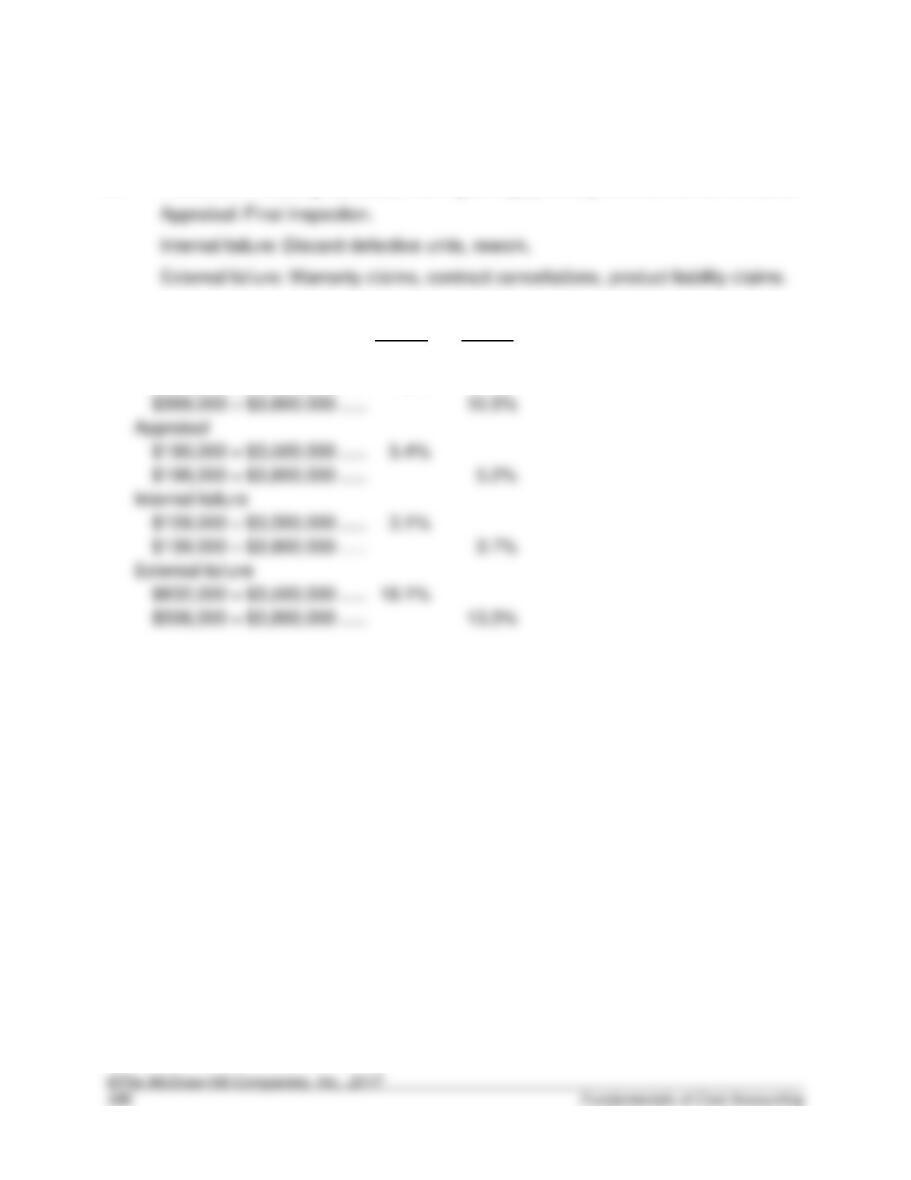
10–48. (20 min.) Costs of Quality: Nuke-It-Now.
a. Prevention: Redesign process, training on equipment, preventative maintenance.
b.
Year 1
Year 2
Prevention
$393,000 ÷ $3,500,000 …………………………….
11.2%
Appraisal
$190,000 ÷ $3,500,000 …………………………….
Internal failure
$109,000 ÷ $3,500,000 …………………………….
External failure
$632,000 ÷ $3,500,000 …………………………….
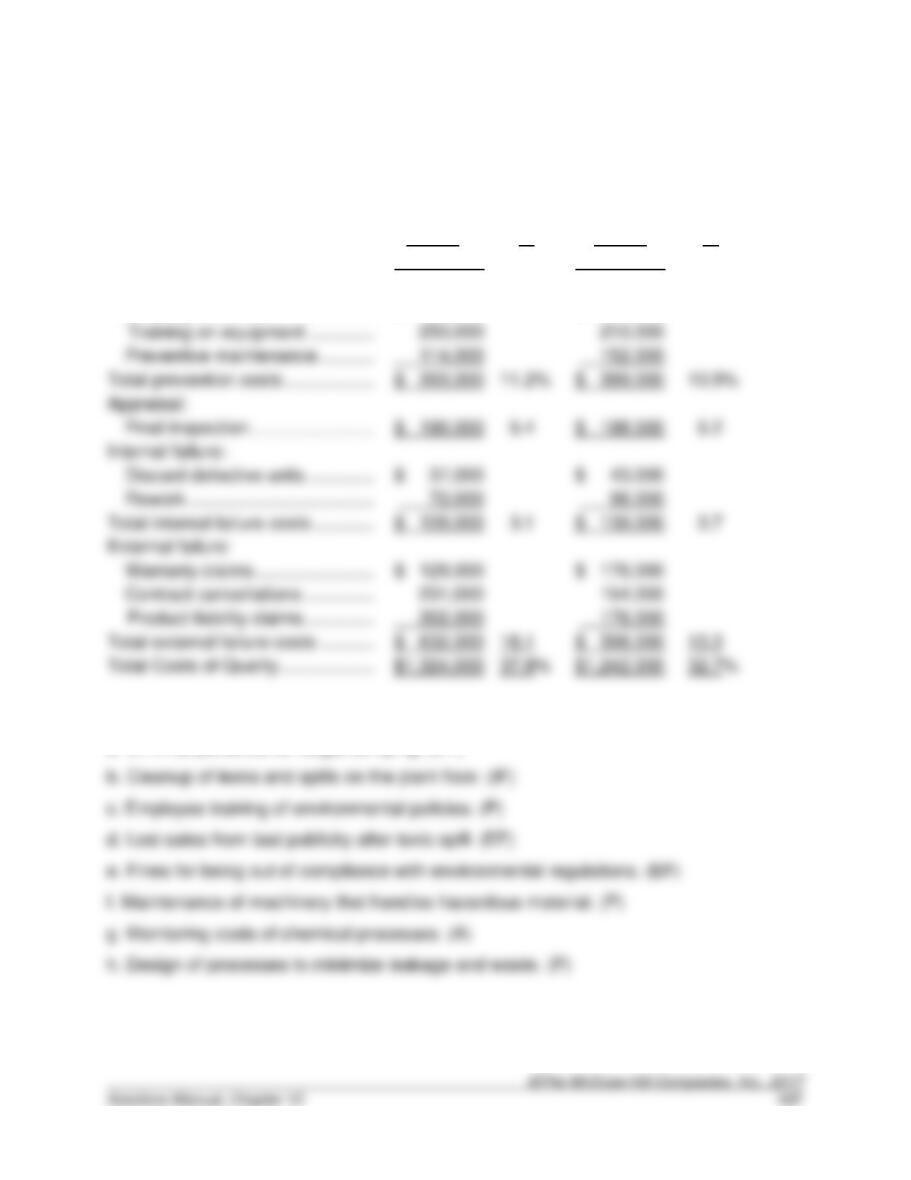
10–49. (30 min.) Trading-off Costs of Quality: Nuke-It-Now.
Nuke-It-Now Corporation
Cost of Quality Report
Year 1
%
Year 2
%
Sales revenue …………………………………………….
$3,500,000
$3,800,000
Prevention:
Redesign process …………………………………….
$ 29,000
$ 37,000
Preventive maintenance …………………………...
Total prevention costs ………………………………….
$ 393,000
11.2%
$ 399,000
Appraisal:
Final inspection ………………………………………..
$ 190,000
$ 198,000
Internal failure:
Rework …………………………………………………..
Total internal failure costs …………………………….
$ 109,000
$ 139,000
External failure:
Warranty claims …………………………..…………..
$ 129,000
$ 176,000
Contract cancellations ………………………………
Total external failure costs …………………………...
$ 632,000
18.1
$ 506,000
10–50. (15 min.) Cost of Quality—Environmental Issues.
a. Criminal penalties for illegal dumping. (EF)
10–51. (15 min.) Cost of Quality—Financial Reporting Issues.
a. Extra work done by external auditors to complete the audit because new
Solutions to Problems
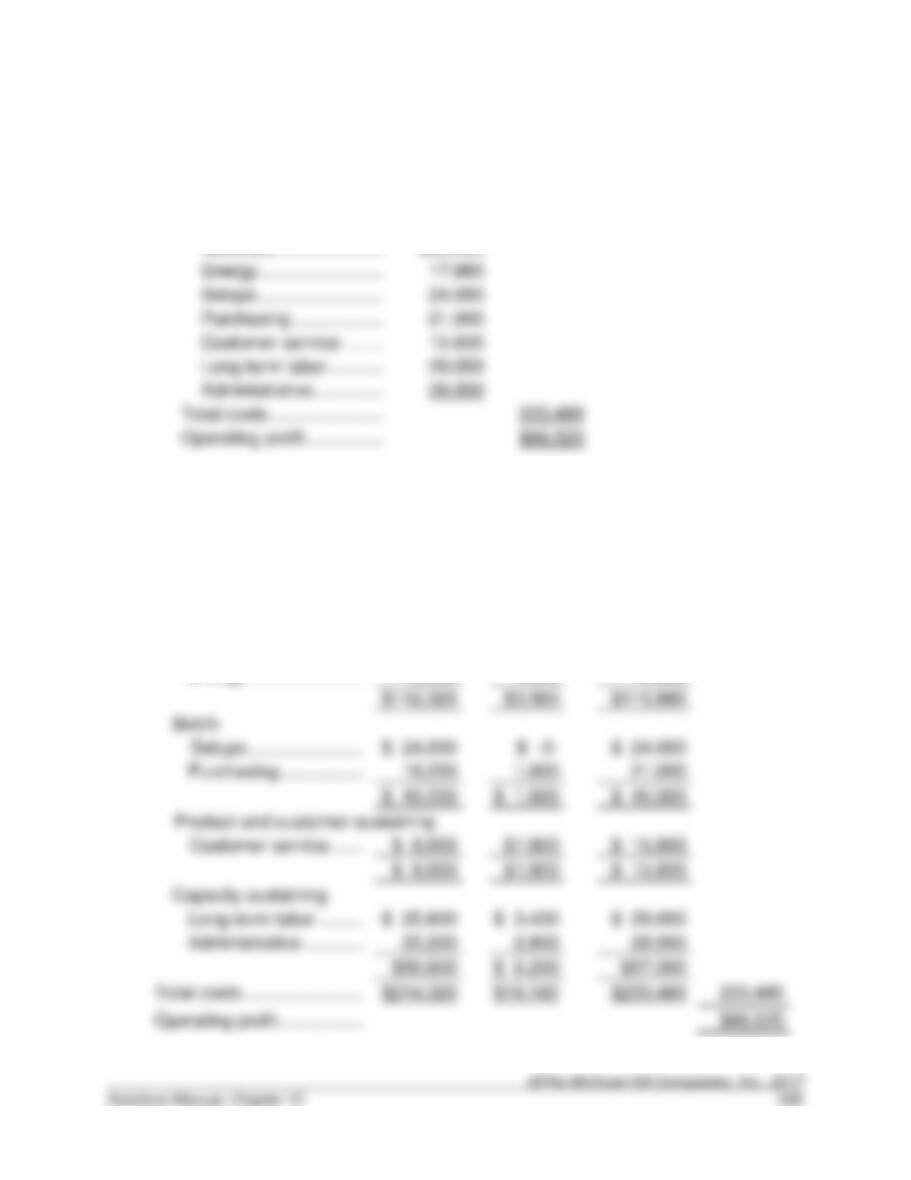
10–52. (50 min.) Activity-Based Reporting and Capacity: Carbon Company.
a.
Sales revenue ……………..
$300,000
Total costs …………………..
b.
Sales revenue
$300,000
Resources
Used
Unused
Resource
Capacity
Resources
Supplied
Costs
Unit
Materials ……………………………………………..
$96,000
$ 2,000
$98,000
Energy ………………………………………………..
16,320
1,560
17,880
$112,320
$3,560
$115,880
Batch
Setups ………………………………………………..
$ 24,000
$ 24,000
Purchasing …………………………………………..
$ 43,200
$ 45,000
Customer service ………………………………….
$ 15,600
$ 15,600
Capacity sustaining
Long-term labor ……………………………………
$ 25,600
Administrative ………………………………………
Operating profit …………………………………………..
10–52. (continued)
c. A traditional income statement shows management resources supplied, but gives
no indication of the resources used and unused resource capacity. Management
10–53. (50 min.) Activity-Based Reporting: Allcott Computer Services.
a.
Sales revenue ……………………………………
$1,350,000
Marketing ………………………………………
$120,000
Energy …………………………………………..
Administrative …………………………………
Total costs …………………………………………
Operating profit ………………………………….
b.
Sales revenue
$1,350,000
Resources
Used
Unused
Resource
Capacity
Resources
Supplied
Costs
Unit
Energy …………………………..…………………….
$80,000
$5,500
$ 85,500
Short-term labor ……………………………………
$ 395,500
$ 4,500
$ 42,000
$ 42,000
Marketing …………………………..………………..
$ 120,000
$ 17,000
$ 174,000
Capacity sustaining
Depreciation …………………………………………
$ 2,500
$ 89,500
Long-term labor …………………………………….
$ 21,500
Operating profit …………………………………………..
10–53. (continued)
c. A traditional income statement shows management resources supplied, but gives
no indication of the resources used and unused resource capacity. Management
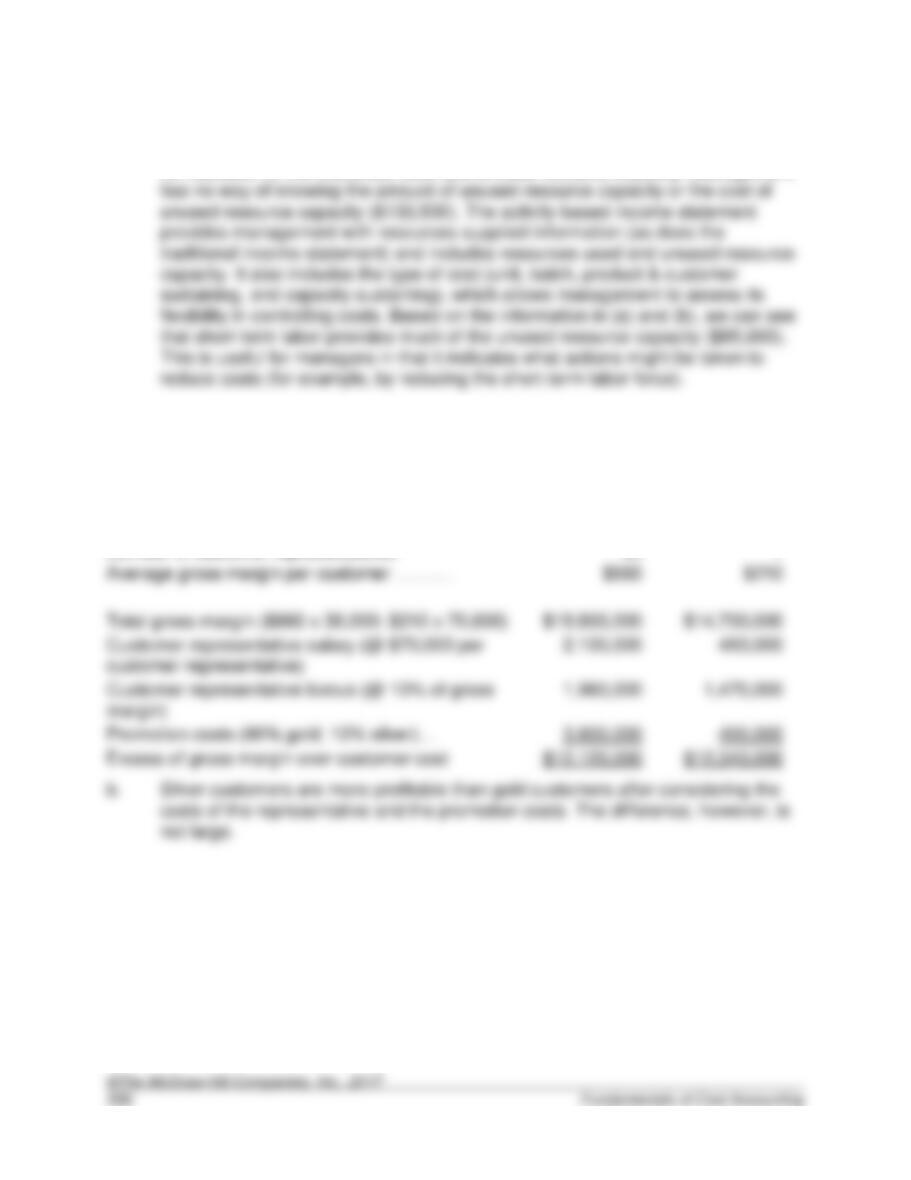
10–54. (50 min.) Customer Profitability: SkiBlu, Ltd.
a.
Customer Costs
Gold
Silver
Number of customers ………
30,000
70,000
Number of customer representatives
30
7
Total gross margin ($660 x 30,000; $210 x 70,000)
customer representative)
margin)
Excess of gross margin over customer cost
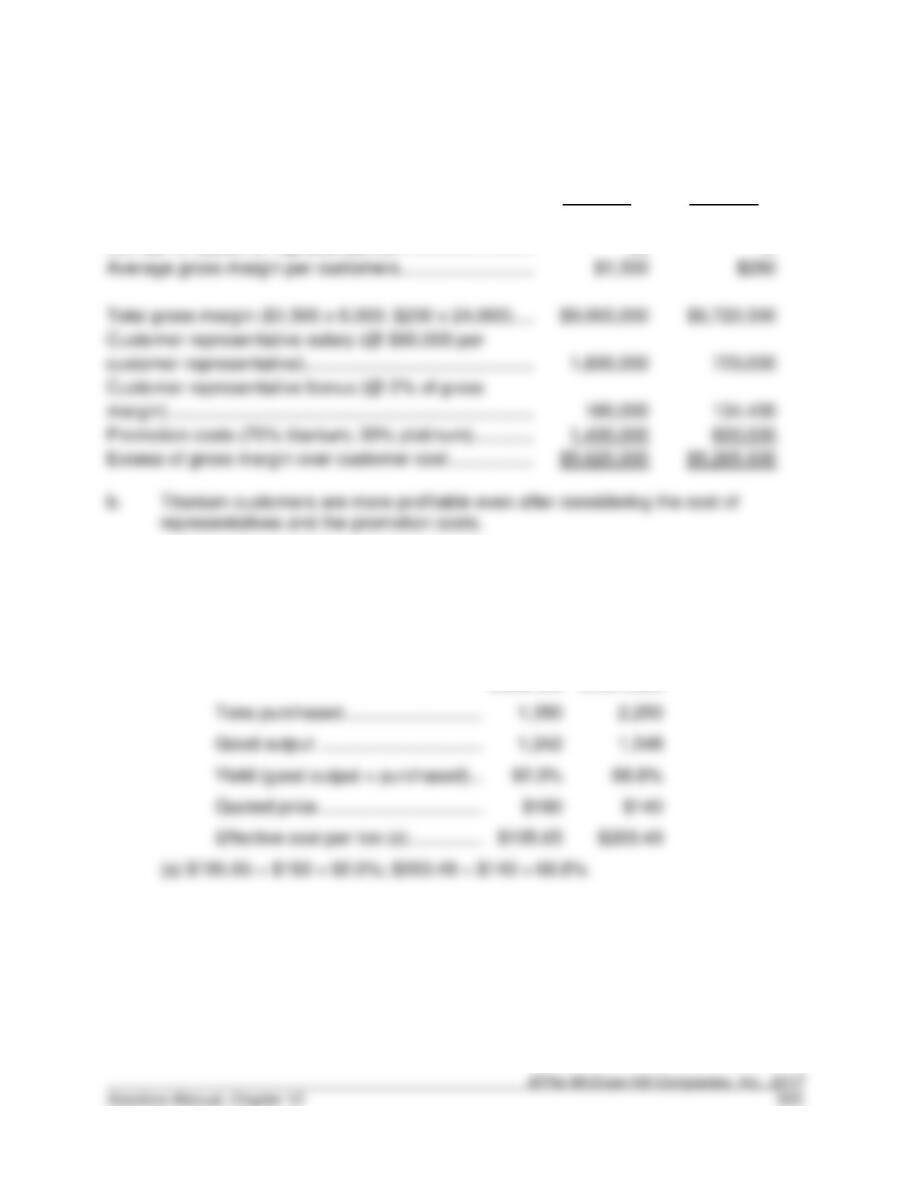
10–55. (50 min.) Customer Profitability: Carmel Company.
a.
Customer Costs
Titanium
Platinum
Number of customers ……………………………………………
6,000
24,000
Number of customer representatives ………………………
30
12
Average gross margin per customers………………………
Total gross margin ($1,500 x 6,000; $200 x 24,000) ….
customer representative) ……………………………………….
margin) ……………………………………………………………….
Promotion costs (70% titanium; 30% platinum) …………
10–56. (30 min.) Activity-Based Costing of Suppliers: JFI Foods.
The effective price is the price to buy a “good” ton of feedstock. This can be
computed as the bid price divided by the yield (the ratio of good output to total
input).
Rex
Materials
Red Oak
Chemicals
Tons purchased ………………………..
Good output …………………………….
Yield (good output ÷ purchased) ….
Quoted price …………………………….
Effective cost per ton (a) ……………. (a)
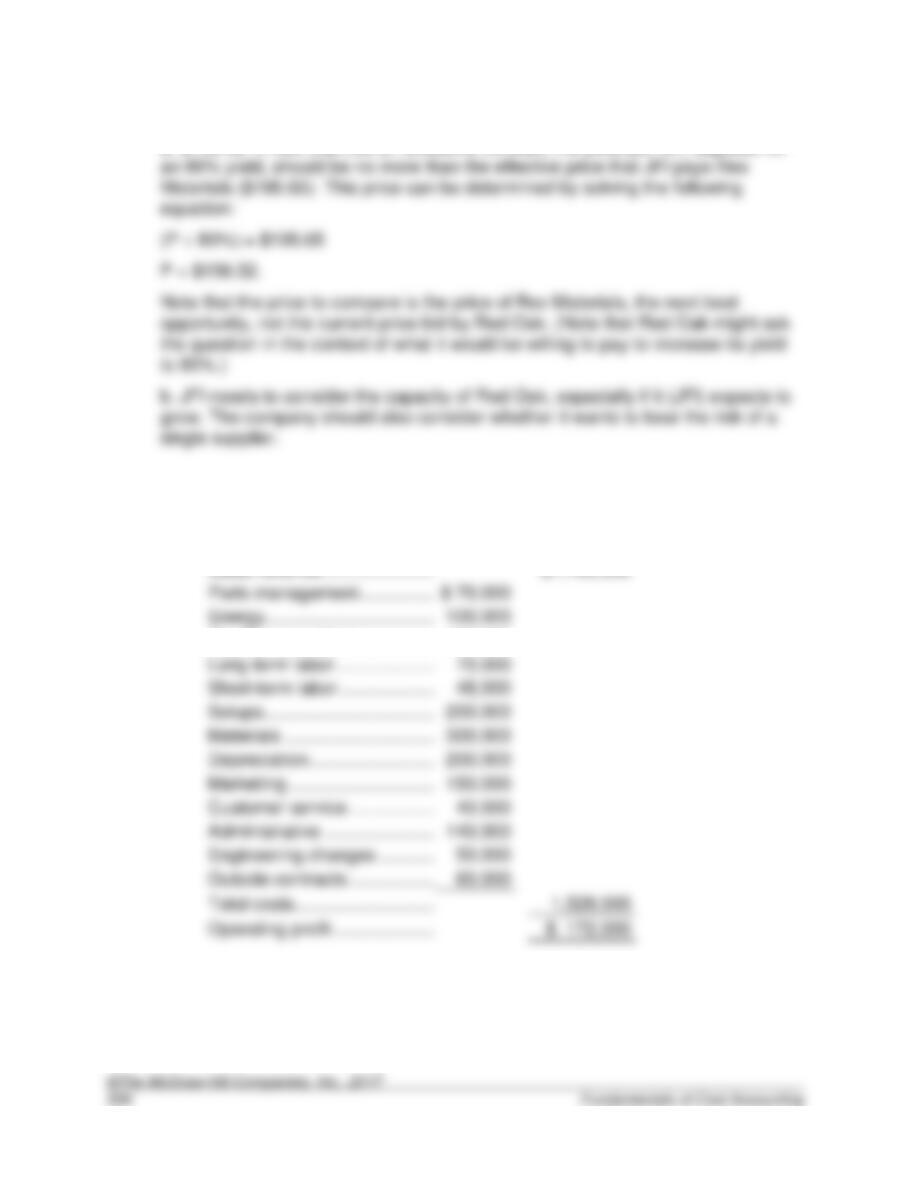
10–57. (20 min.) Activity-Based Costing of Suppliers: JFI Foods.
a. $156.52. If Red Oak has an exclusive contract, the price per ton, adjusted for
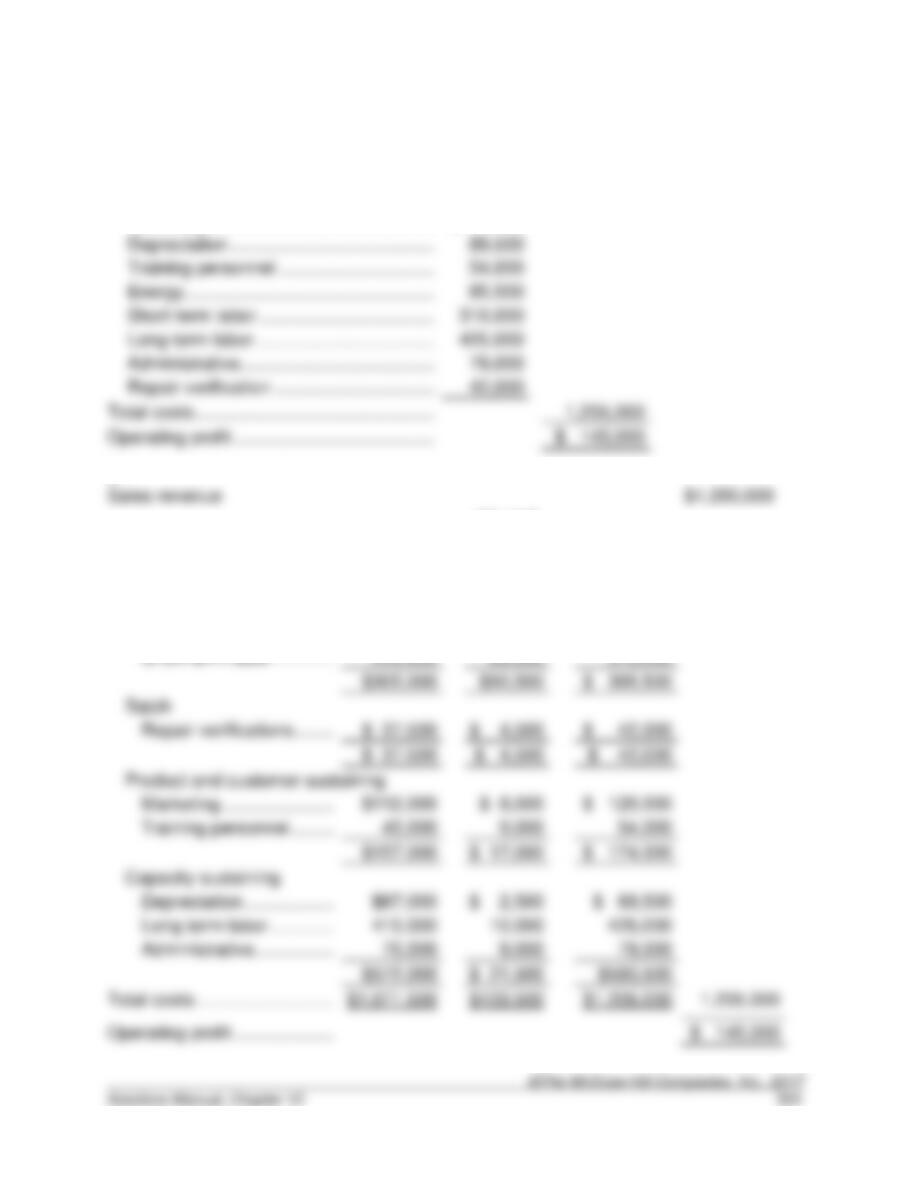
10–58. (50 min.) Activity-Based Reporting: Leidenheimer Corporation.
a.
Sales revenue …………………………………………….
$1,700,000
Quality inspections ………………………………………
100,000
Setups ……………………………………………………….
Marketing …………………………………………………..
150,000
Engineering changes …………………………………..
Total costs ………………………………………………….
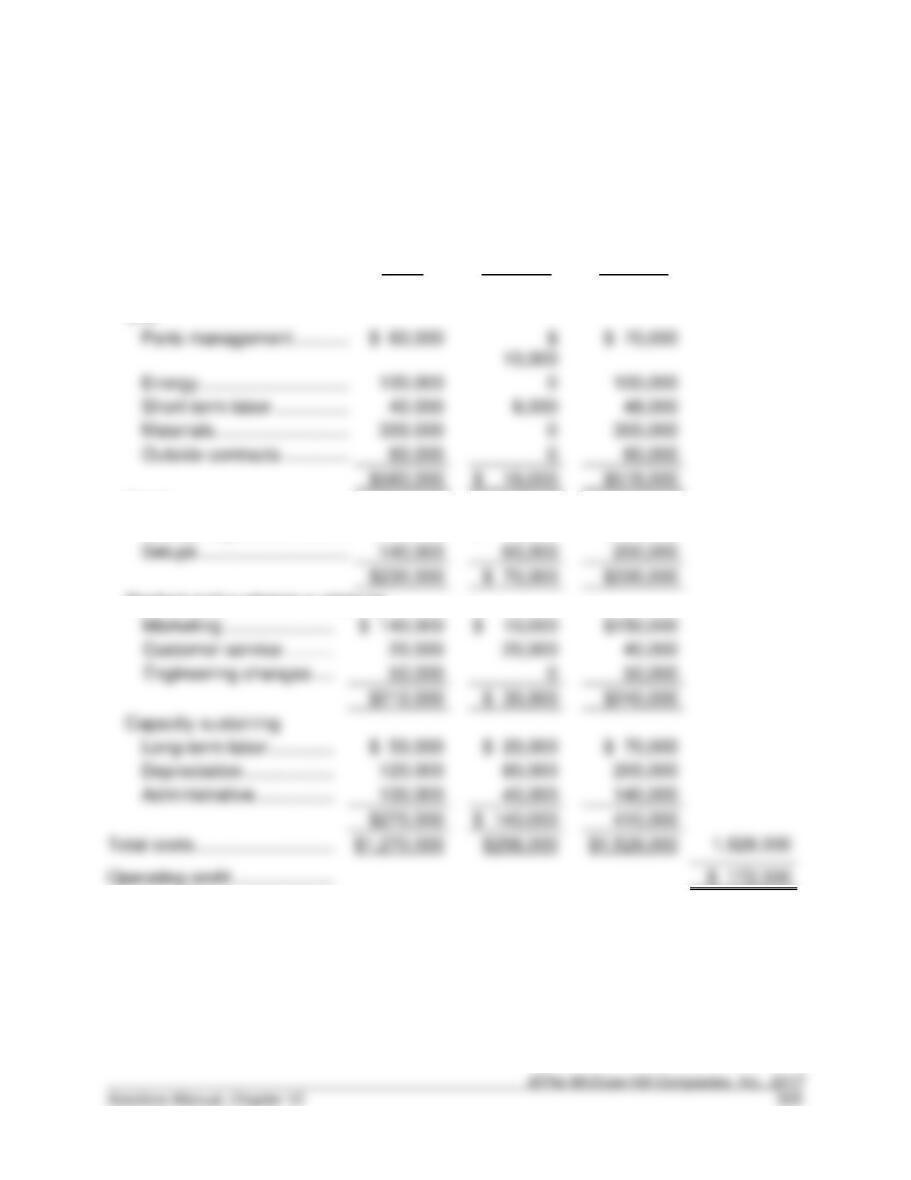
10-58. (continued)
b.
Sales revenue
$1,700,000
Resources
Used
Unused
Resource
Capacity
Resources
Supplied
Costs
Unit
40,000
Materials ………………………………………………
60,000
$ 18,000
$578,000
Batch
Quality inspections ………………………………..
$ 90,000
$ 10,000
$100,000
60,000
Product and customer sustaining
Marketing …………………………………………….
Customer service ………………………………….
Engineering changes …………………………….
$210,000
$ 30,000
Capacity sustaining
Long-term labor …………………………………….
$ 50,000
$ 20,000
$ 70,000
80,000
40,000
$270,000
$ 140,000
Operating profit …………………………………………..
10-58. (continued)
c. A traditional income statement shows management resources supplied, but gives
no indication of the resources used and unused resource capacity. Management
has no way of knowing the amount of unused resource capacity or the cost of
10–59. (30 min.) Assigning Capacity Costs: Cathy and Tom’s Specialty Ice Cream
Company.
Cathy and Tom’s Specialty Ice Cream Company illustrates in a very simple way the
issues of cost system design when costing excess capacity. Although the problem
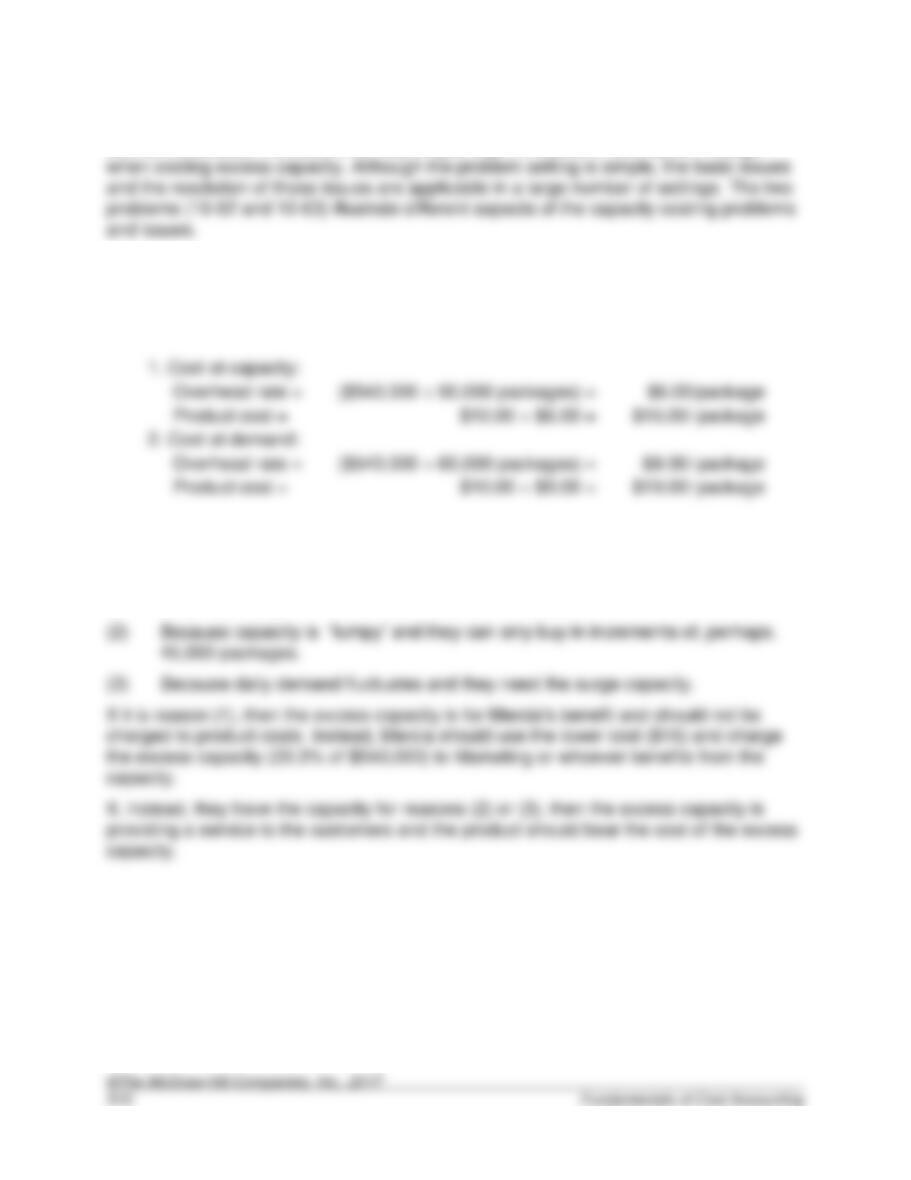
There are two possible approaches to costing the ice cream:
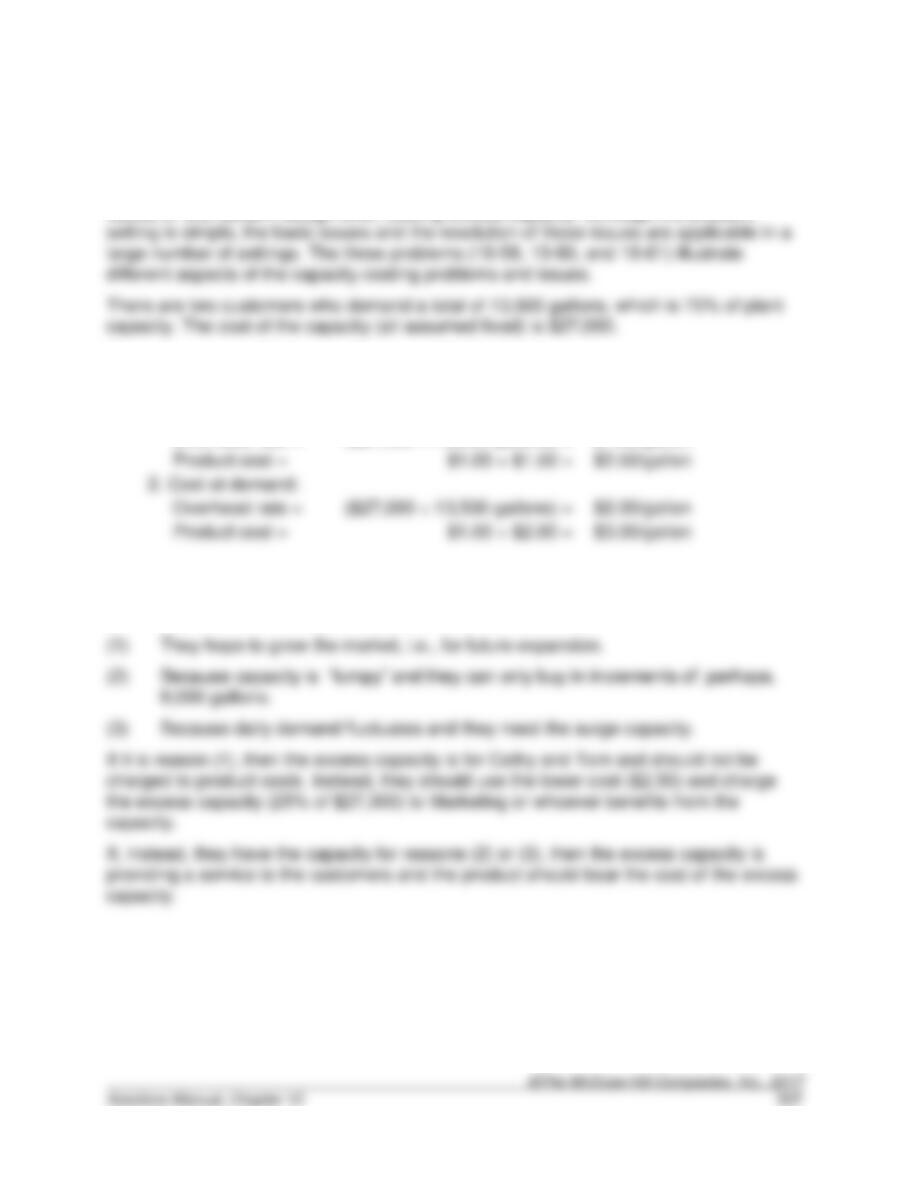
1. Cost at capacity:
Overhead rate =
($27,000 ÷ 18,000 gallons) =
$1.50/gallon
Product cost =
$2.50/gallon
2. Cost at demand:
Overhead rate =
($27,000 ÷ 13,500 gallons) =
$2.00/gallon
Product cost =
$3.00/gallon
How do you choose between the two? Why did Cathy and Tom buy a plant with a
capacity of 18,000 gallons? Possible reasons include:
$3.00/gallon
$4.00/gallon
$1.50/gallon
$2.50/gallon
10–60. (30 min.) Assigning Capacity Costs—Seasonality: Cathy and Tom’s
Specialty Ice Cream.
With seasonal demand fluctuations, the reason for the excess capacity is for the benefit
of the two customers (Cathy and Tom need all the capacity in the summer). The issue is
how to treat the excess capacity costs. The capacity costs in each season are $13,500
(= $27,000 ÷ 2 seasons). Two approaches to costing are:
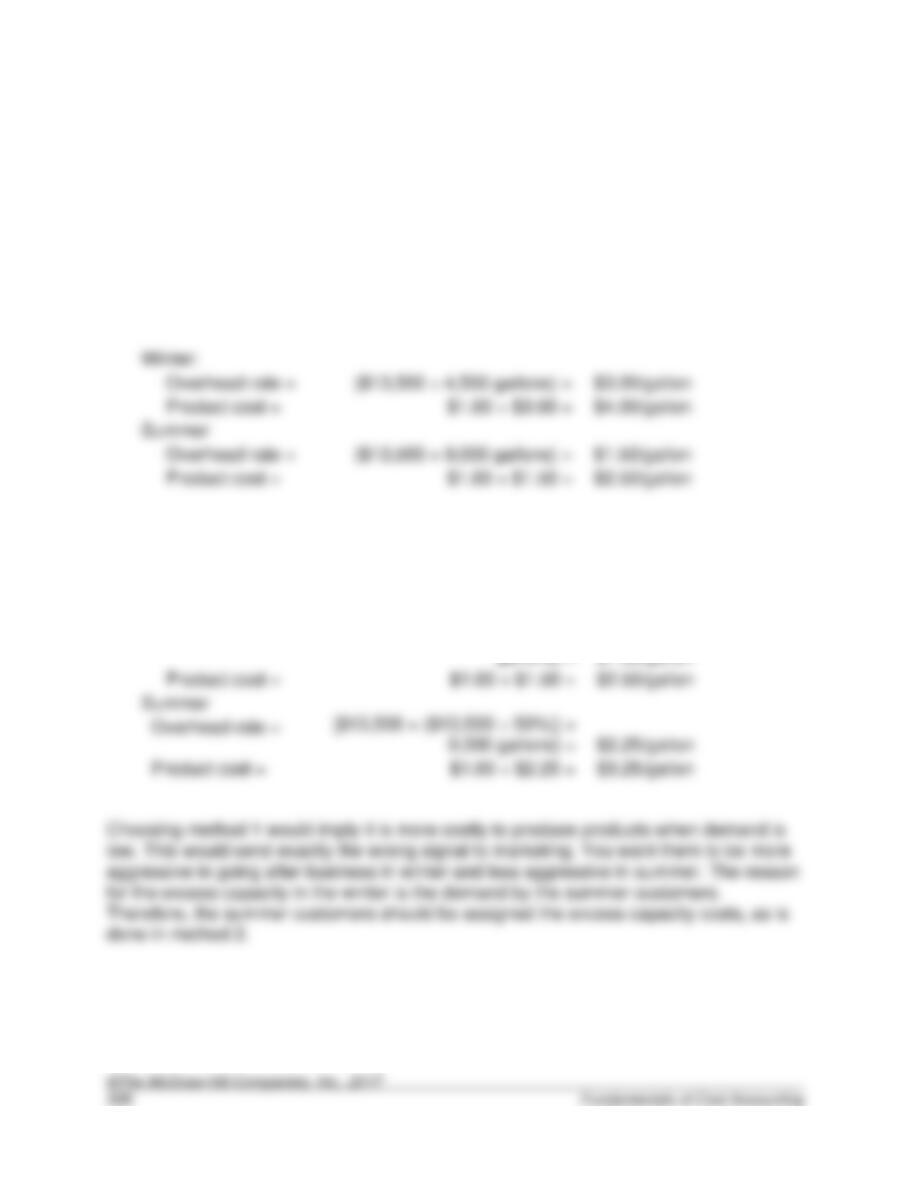
1. Excess capacity costs assigned to season in which it is incurred, then to products
in that season. Thus,
2. Excess capacity costs assigned to the season requiring it, then to products
produced in that season. Thus,
Winter:
Overhead rate =
($13,500 50%) ÷ 4,500
gallons) =
$1.50/gallon
$2.50/gallon
$2.25/gallon
$3.25/gallon
10–61. (30 min.) Assigning Capacity Costs—Seasonality: Cathy and Tom’s
Specialty Ice Cream.
With seasonal demand fluctuations, the reason for the excess capacity is for the benefit
of the two customers (Cathy and Tom need all the capacity in the summer). The issue is
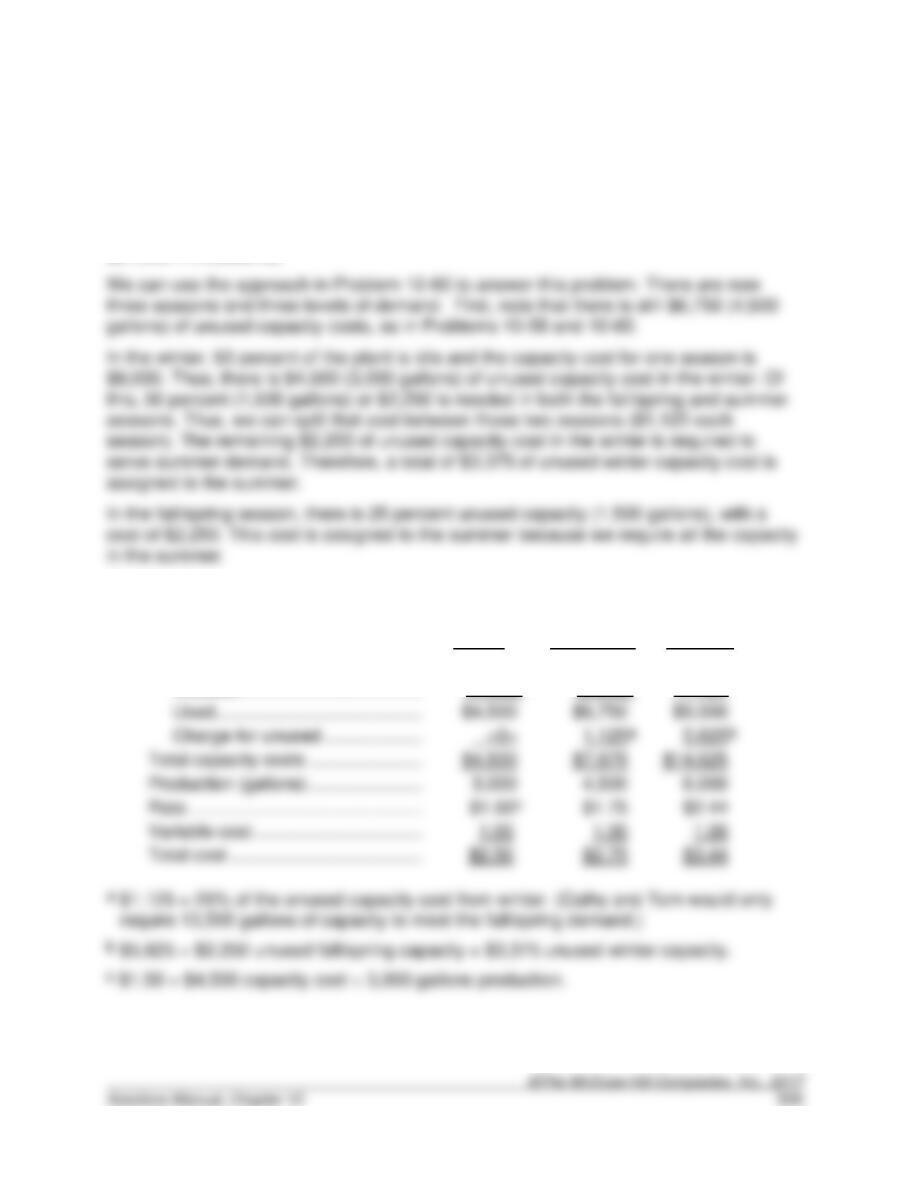
how to treat the excess capacity costs. The capacity costs in each season are $9,000 (=
$27,000 ÷ 3 seasons).
The capacity costs and capacity in each season is:
Capacity Costs
Winter
Fall/Spring
Summer
Total ………………………………………………………
$9,000
$9,000
$9,000
Unused………………………………………………….
(4,500)
(2,250)
–0–
Charge for unused ………………………………….
$4,500
$7,875
1.00
10–62. (30 min.) Assigning Capacity Costs: Mercia Chocolates.
Mercia Chocolates illustrates in a very simple way the issues of cost system design
There are two customers who demand a total of 60,000 packages, which is 80% of
plant capacity. The cost of the capacity (all assumed fixed) is $540,000.
There are two possible approaches to costing the chocolate:
How do you choose between the two? Why did Mercia buy a plant with a capacity of
90,000 packages? Possible reasons include:
(1) They hope to grow the market, i.e., for future expansion.
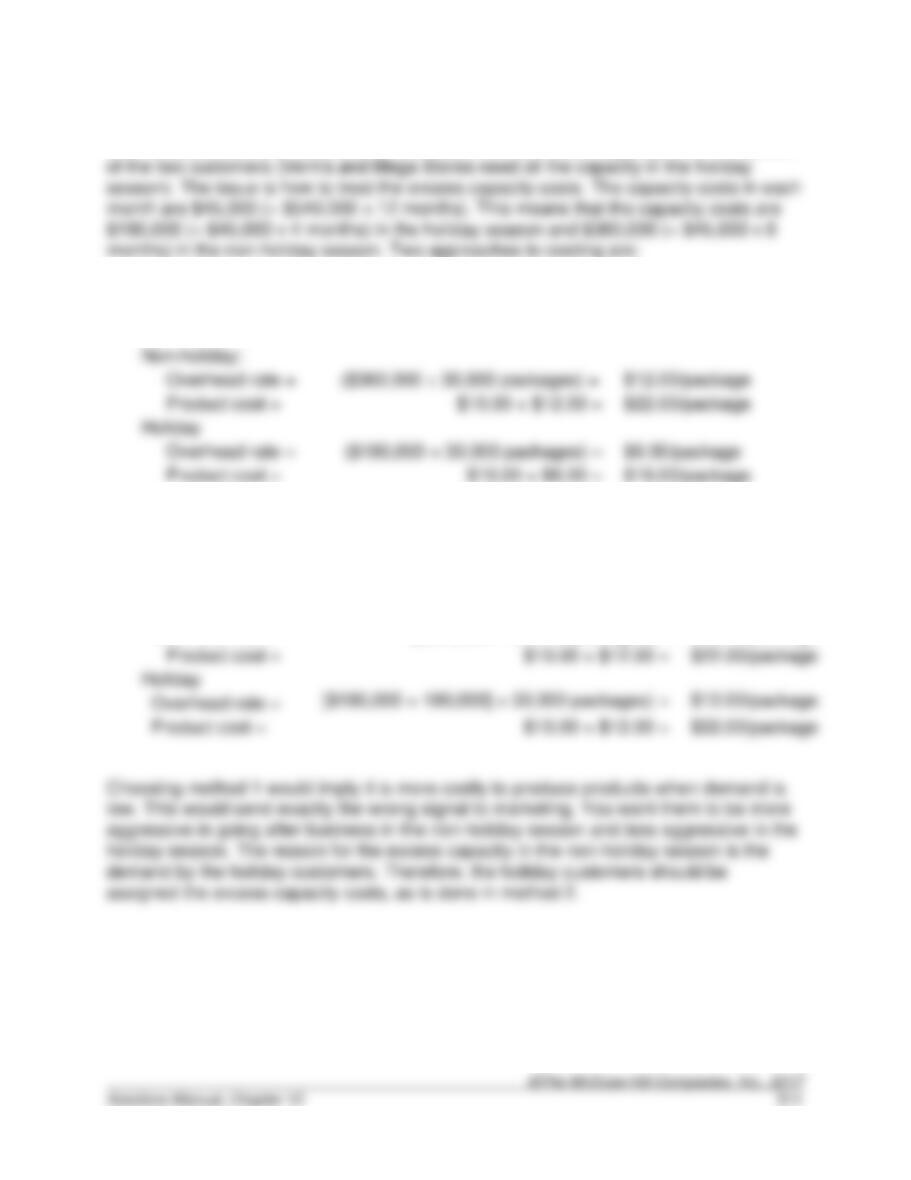
10–63. (30 min.) Assigning Capacity Costs—Seasonality: Mercia Chocolates.
With seasonal demand fluctuations, the reason for the excess capacity is for the benefit
1. Excess capacity costs assigned to season in which it is incurred, then to products
in that season. Thus,
Non-holiday:
Overhead rate =
$12.00/package
Holiday
Overhead rate =
$6.00/package
2. Excess capacity costs (= $540,000 x 33-1/3%, or $180,000) are assigned to the
season requiring it, then to products produced in that season. Thus,
Non-holiday:
Overhead rate =
($360,000 ÷ 30,000 packages) =
$12.00/package
Product cost =
$22.00/package
Holiday
Product cost =
$22.00/package
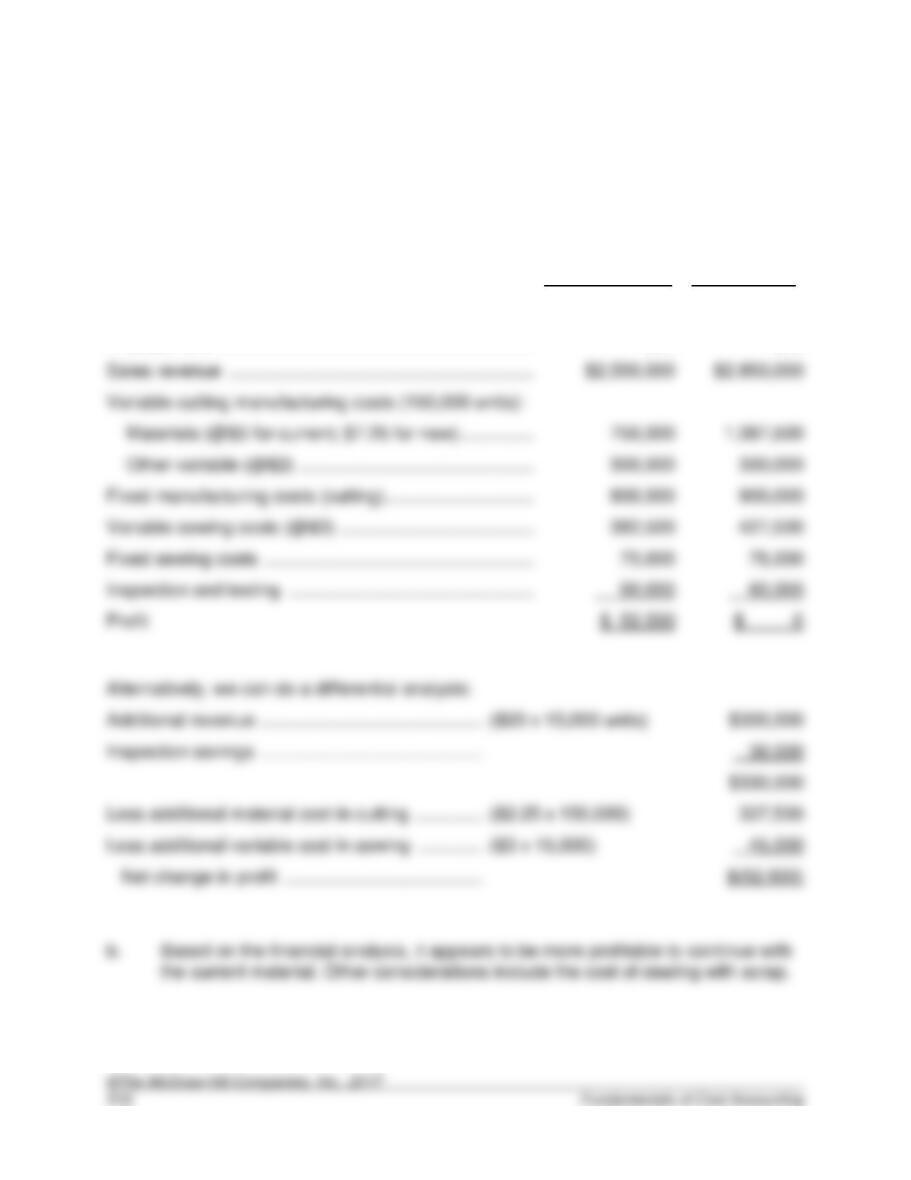
10–64. (30 min.) Quality Improvement: IPort Products.
a. There are two alternatives: continue with the current material or use the new
material. To determine the best alternative (considering only the financial
consequenses), compute profit under each alternative:
Current Material
New Material
Number of units sold ……………………………………………..
127,500
142,500
Price per unit ………………………………………………………..
$20
$20
Sales revenue ………………………………………………………
Variable cutting manufacturing costs (150,000 units):
Fixed manufacturing costs (cutting)…………………………..
Variable sewing costs (@$3) …………………………………..
382,500
427,500
Fixed sewing costs ………………………………………………..
Inspection and testing ……………………………………………
Additional revenue ……………………………………….
($20 x 15,000 units)
Inspection savings ……………………………………….
Less additional material cost in cutting ……………
($2.25 x 150,000)
Less additional variable cost in sewing …………..
($3 x 15,000)
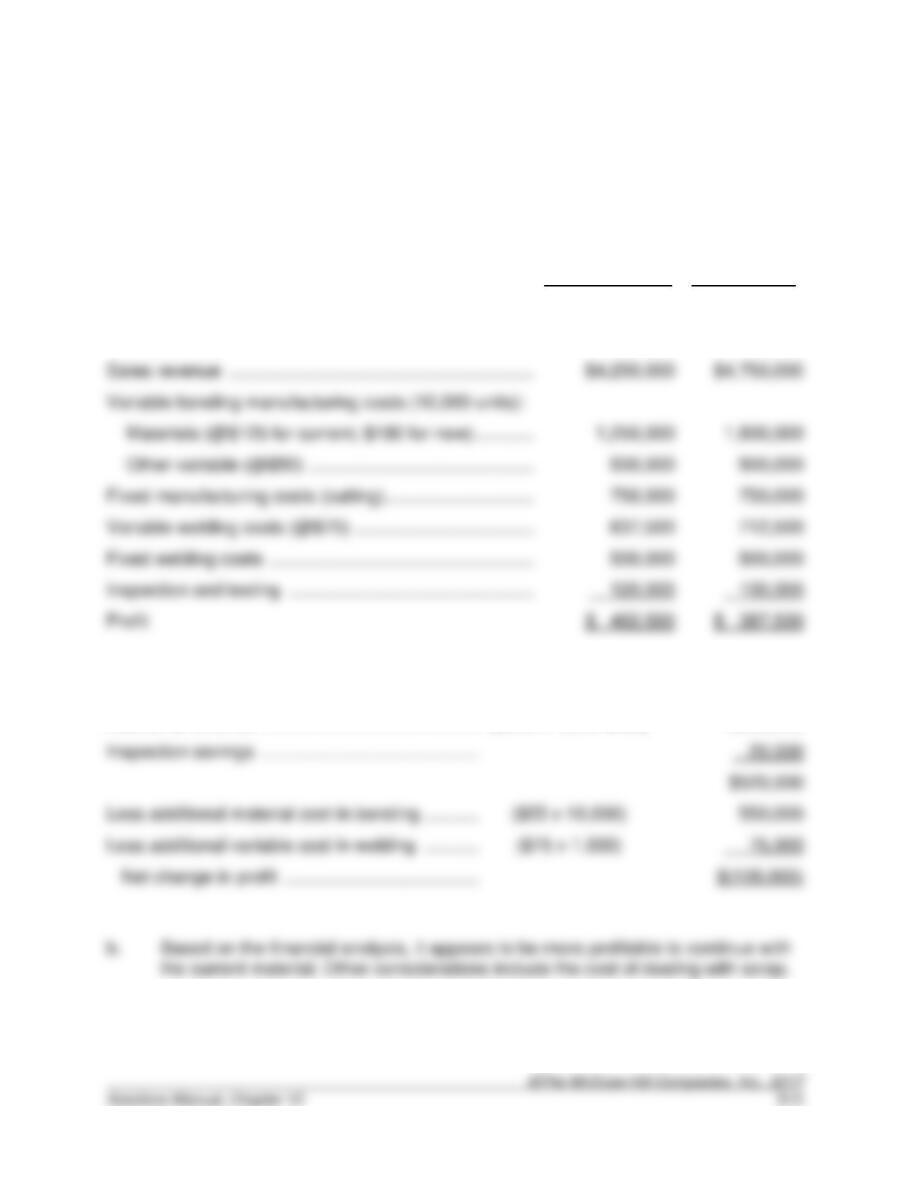
10–65. (30 min.) Quality Improvement: Metallic, Inc.
a. There are two alternatives: continue with the current material or use the new
material. To determine the best alternative (considering only the financial
consequenses), compute profit under each alternative:
Current Material
New Material
Number of units sold ……………………………………………..
8,500
9,500
Price per unit ………………………………………………………..
$500
$500
Sales revenue ………………………………………………………
Variable bending manufacturing costs (10,000 units):
Fixed manufacturing costs (cutting)…………………………..
Variable welding costs (@$75) ………………………………..
Fixed welding costs ……………………………………………….
Inspection and testing ……………………………………………
Alternatively, we can do a differential analysis:
Additional revenue ……………………………………..
($500 x 1,000 units)
$500,000
Inspection savings ……………………………………..
$520,000
Less additional material cost in bending ………..
Less additional variable cost in welding ………..
Solutions to Integrative Cases
10–66. (50 Min) Cost Hierarchies, Cost of Customers, and Pricing: WSM
Corporation.
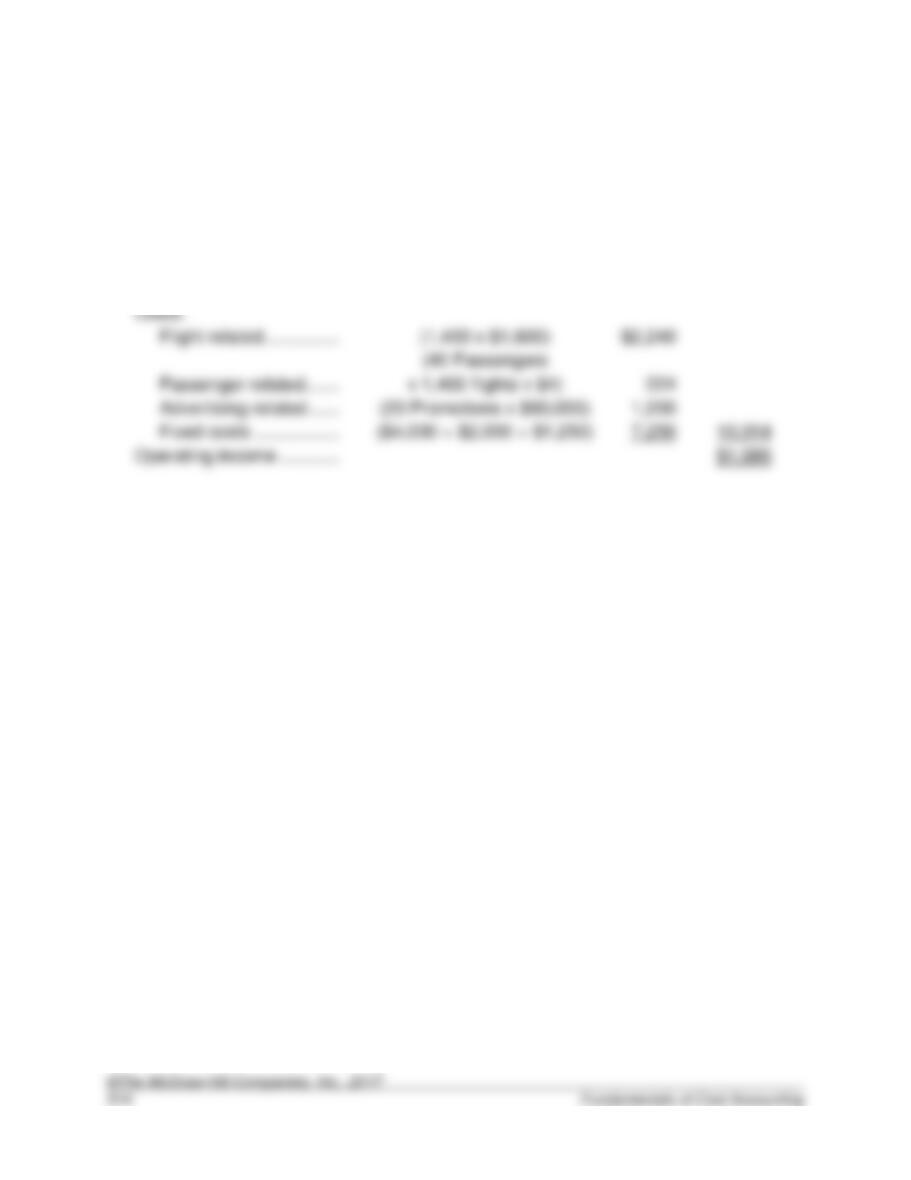
a.
($000)
Sales revenue ………………
(40 Passengers
x 1,400 flights x $225)
$12,600
Costs:
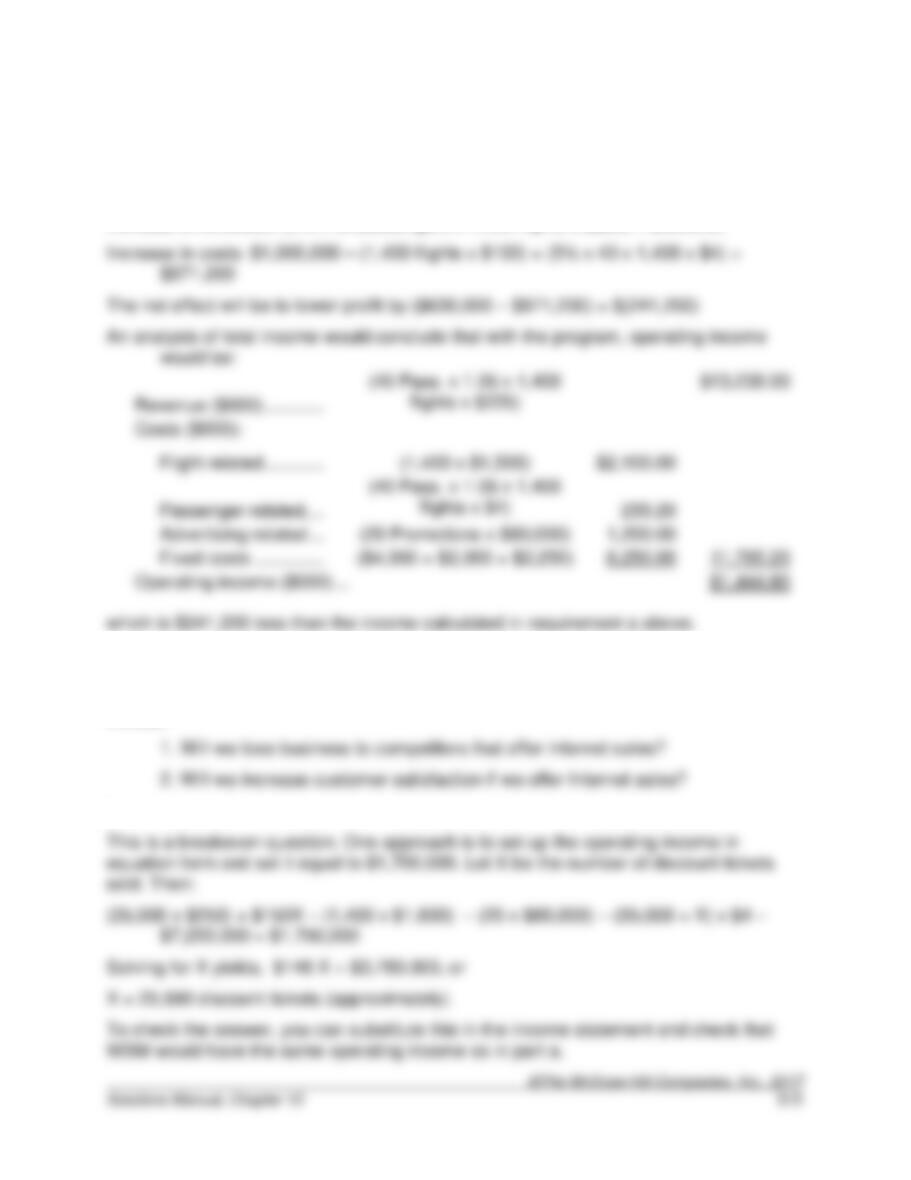
10–66. (continued)
b.
We can first consider the incremental revenues and costs that would result:
Increase in revenues: (5% x 40 passengers x 1,400 flights x $225) = $630,000
Based on a purely financial analysis, we might recommend that WSM not adopt the
Internet sales alternative. However, there are other considerations that may make this
alternative attractive. For example, some issues that would need to be considered
include:
c.
10–67. (50 Min) Unused Capacity: The Grape Cola Caper.
(Refer to the solution for 9-53.)
a. Percentage utilization of resource by activities:
Activity
Setups
Production
Runs
Products
Machine
Time
Indirect labor (including fringe benefits)
50%
40%
10%
0%
Information technology (IT)
Machinery maintenance
0
Energy
0
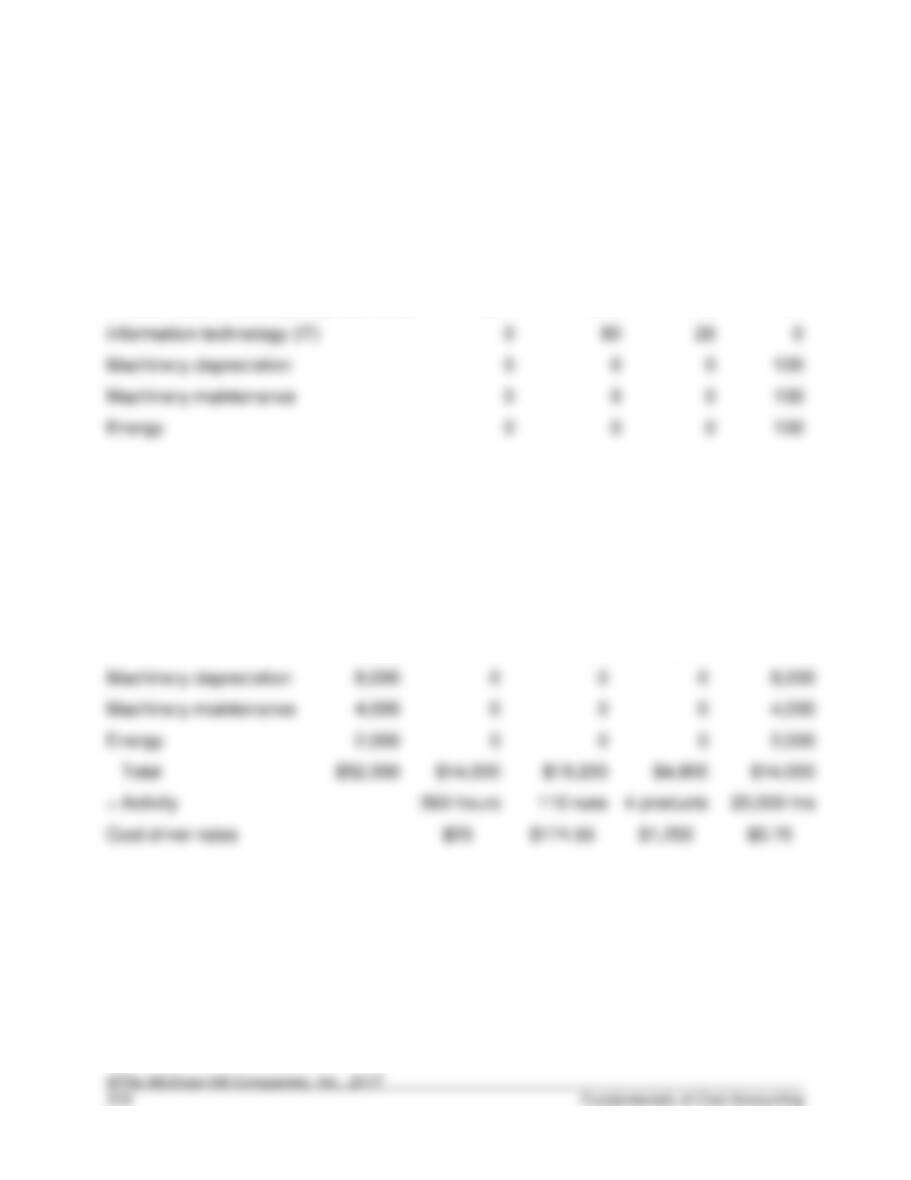
Costs assigned to activiities:
Activity
Cost
Setups
Production
Runs
Products
Machine
Time
Indirect labor
$28,000
$14,000
$11,200
$2,800
$ 0
IT
10,000
0
8,000
2,000
0
Machinery depreciation
8,000
0
0
0
8,000
Machinery maintenance
4,000
0
0
0
4,000
Energy
2,000
0
0
÷ Activity
20,000 hrs
Cost driver rates
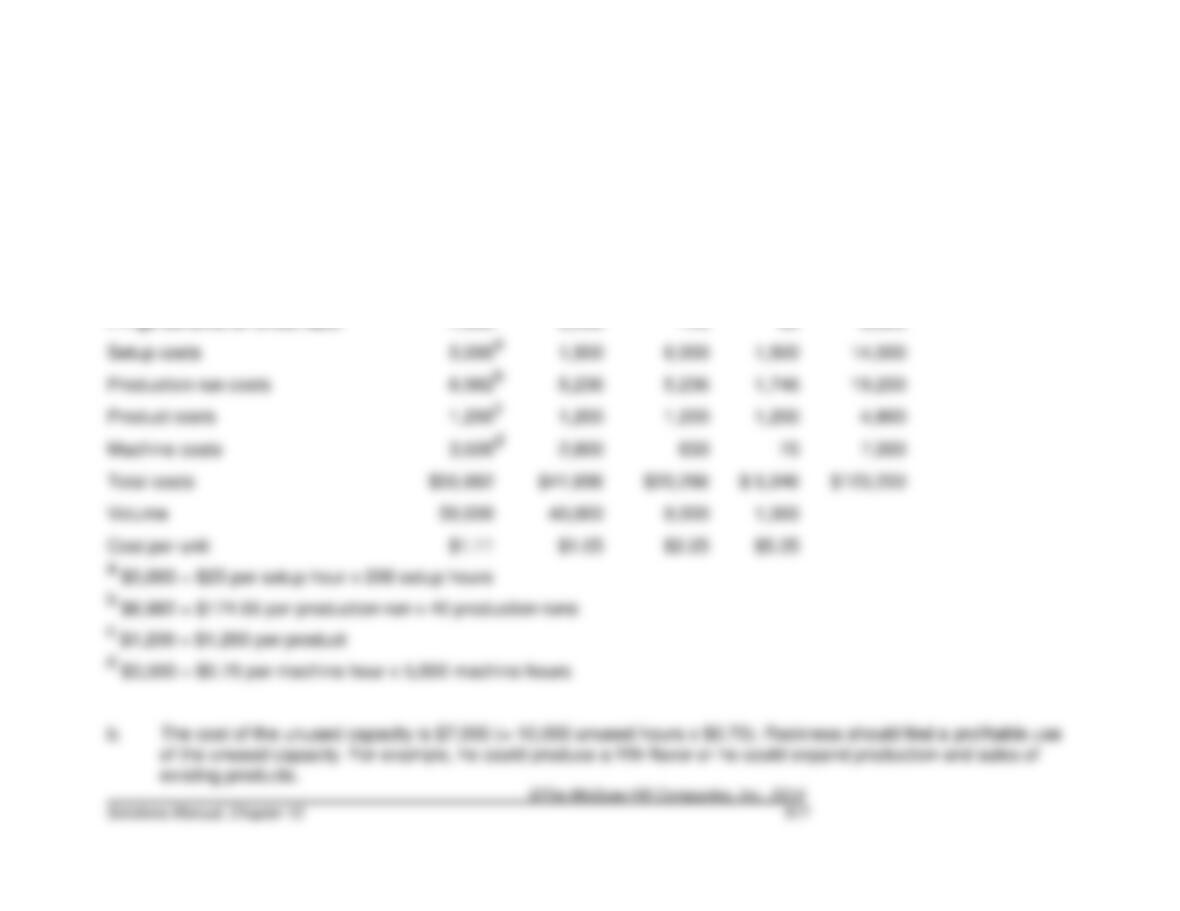
10–67. (continued)
The only change is the cost driver rate for machine time:
Unit Costs on Cola Bottling Line
Diet
Regular
Cherry
Grape
Total
Materials
$ 25,000
$ 20,000
$ 4,680
$ 550
$ 50,230
Direct labor
10,000
8,000
1,800
200
20,000
Fringe benefits on direct labor
4,000
3,200
720
80
8,000
Setup costs
Production run costs
Product costs
Machine costs
Total costs
$55,682
Volume
1,000
Cost per unit
$5.35
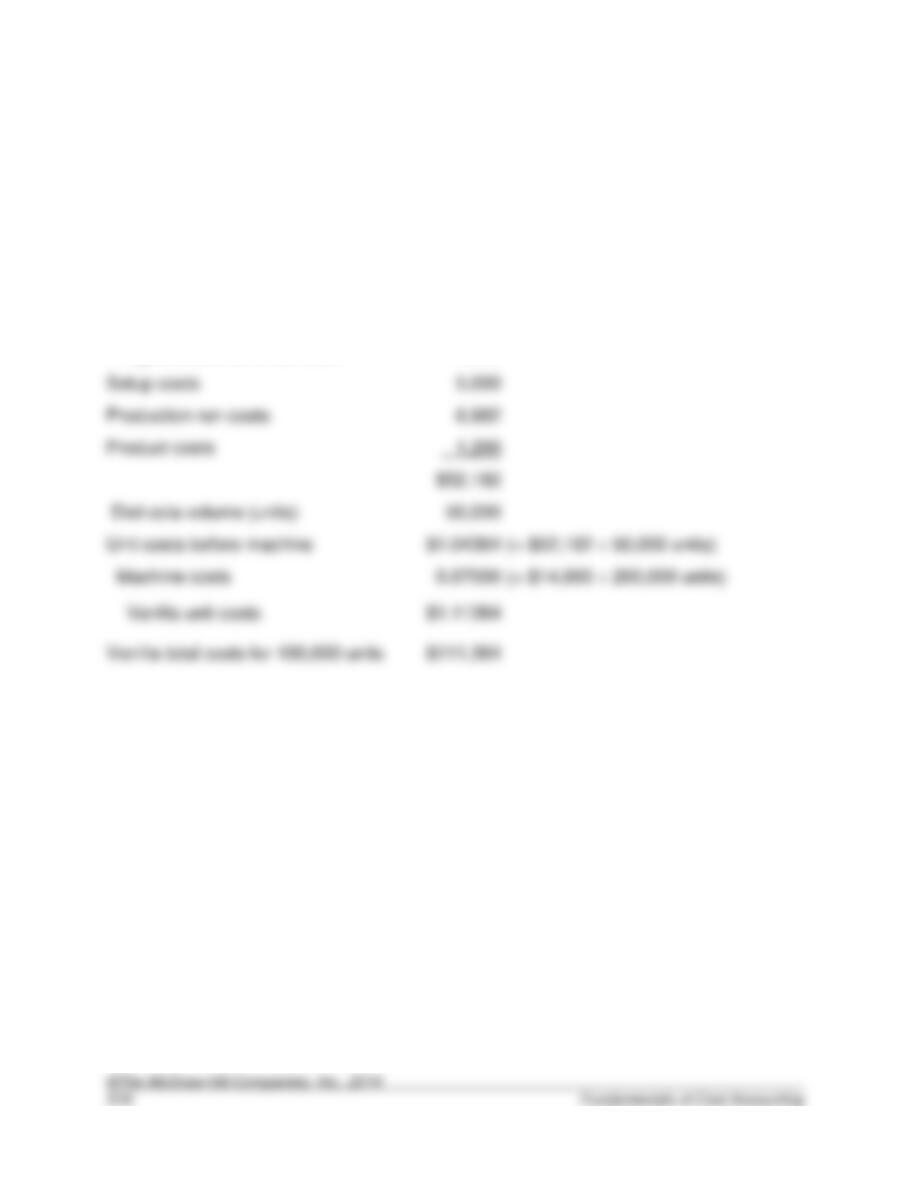
10–67. (continued)
c.
First, compute the costs per unit of Diet Cola, except for the machine costs:
Diet cola costs:
Materials
$ 25,000
Direct labor
10,000
Fringe benefits on direct labor
4,000
Setup costs
Production run costs
Product costs
Diet cola volume (units)
Unit costs before machine
$1.04364
(= $52,182 ÷ 50,000 units)
(= $14,000 ÷ 200,000 units)
Vanilla total costs for 100,000 units
$111,364