10-1
CHAPTER 10
DETERMINING HOW COSTS BEHAVE
10-1 The two assumptions are
1. Variations in the level of a single activity (the cost driver) explain the variations in the
related total costs.
10-2 Three alternative linear cost functions are
1. Variable cost function––a cost function in which total costs change in proportion to the
10-3 A linear cost function is a cost function where, within the relevant range, the graph of
total costs versus the level of a single activity related to that cost is a straight line. An example of
a linear cost function is a cost function for use of a videoconferencing line where the terms are a
10-4 No. High correlation merely indicates that the two variables move together in the data
examined. It is essential also to consider economic plausibility before making inferences about
cause and effect. Without any economic plausibility for a relationship, it is less likely that a high
level of correlation observed in one set of data will be similarly found in other sets of data.
10-5 Four approaches to estimating a cost function are
1. Industrial engineering method.
10-6 The conference method estimates cost functions on the basis of analysis and opinions
about costs and their drivers gathered from various departments of a company (purchasing,
process engineering, manufacturing, employee relations, etc.). Advantages of the conference
method include:
10-2
10-7 The account analysis method estimates cost functions by classifying cost accounts in the
subsidiary ledger as variable, fixed, or mixed with respect to the identified level of activity.
Typically, managers use qualitative, rather than quantitative, analysis when making these cost–
classification decisions.
10-8 The six steps are
1. Choose the dependent variable (the variable to be predicted, which is some type of cost).
2. Identify the independent variable or cost driver.
10-9 Causality in a cost function runs from the cost driver to the dependent variable. Thus,
choosing the highest observation and the lowest observation of the cost driver is appropriate in
the high-low method.
10-10 Three criteria important when choosing among alternative cost functions are
1. Economic plausibility.
10-11 A learning curve is a function that measures how labor-hours per unit decline as units of
production increase because workers are learning and becoming better at their jobs. Two models
10-12 Frequently encountered problems when collecting cost data on variables included in a
cost function are
1. The time period used to measure the dependent variable is not properly matched with the
time period used to measure the cost driver(s).
2. Fixed costs are allocated as if they are variable.
10-3
10-13 Four key assumptions examined in specification analysis are
1. Linearity of relationship between the dependent variable and the independent variable
10-14 No. A cost driver is any factor whose change causes a change in the total cost of a related
cost object. A cause-and-effect relationship underlies selection of a cost driver. Some users of
10-15 No. Multicollinearity exists when two or more independent variables are highly
correlated with each other.
10-16 (10 min.) Estimating a cost function.
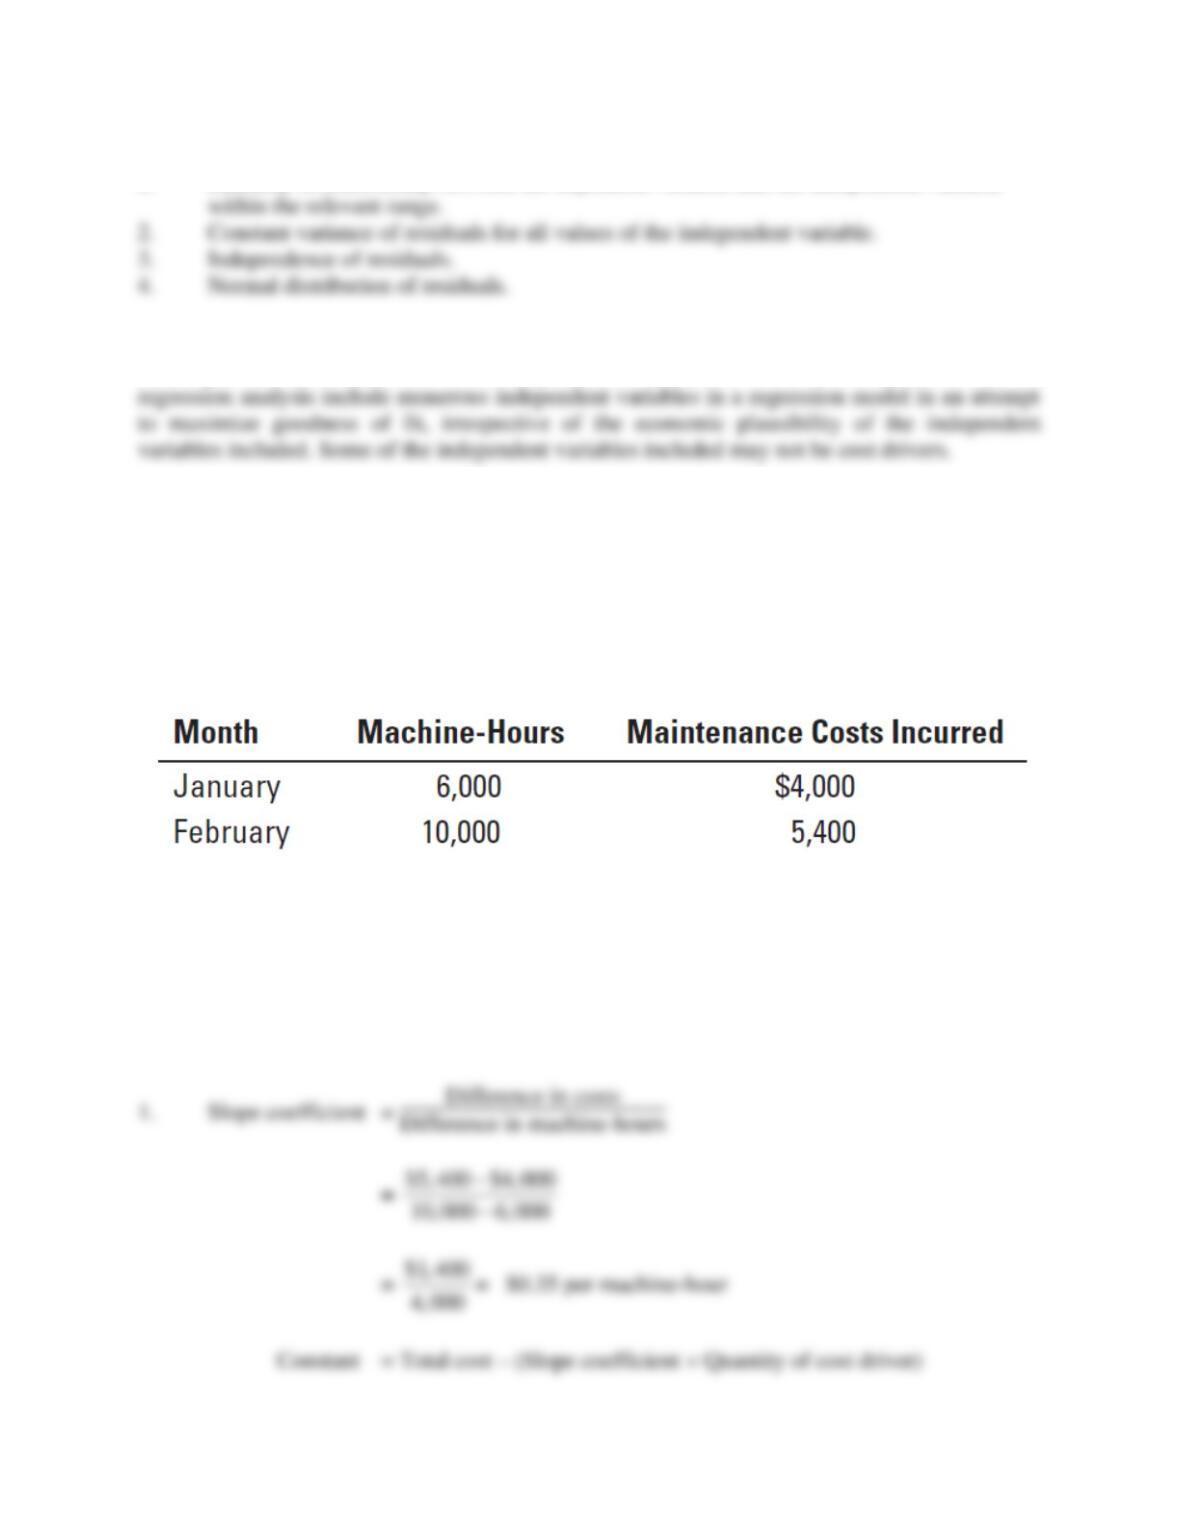
The controller of the Ijiri Company wants you to estimate a cost function from the following two
observations in a general ledger account called Maintenance:
Required:
1. Estimate the cost function for maintenance.
2. Can the constant in the cost function be used as an estimate of fixed maintenance cost per
month? Explain.
SOLUTION
10-4
10-17 (15 min.) Identifying variable-, fixed-, and mixed-cost functions.
The Pacific Corporation operates car rental agencies at more than 20 airports. Customers can
choose from one of three contracts for car rentals of one day or less:
▪ Contract 1: $50 for the day
▪ Contract 2: $30 for the day plus $0.20 per mile traveled
▪ Contract 3: $1 per mile traveled
Required:
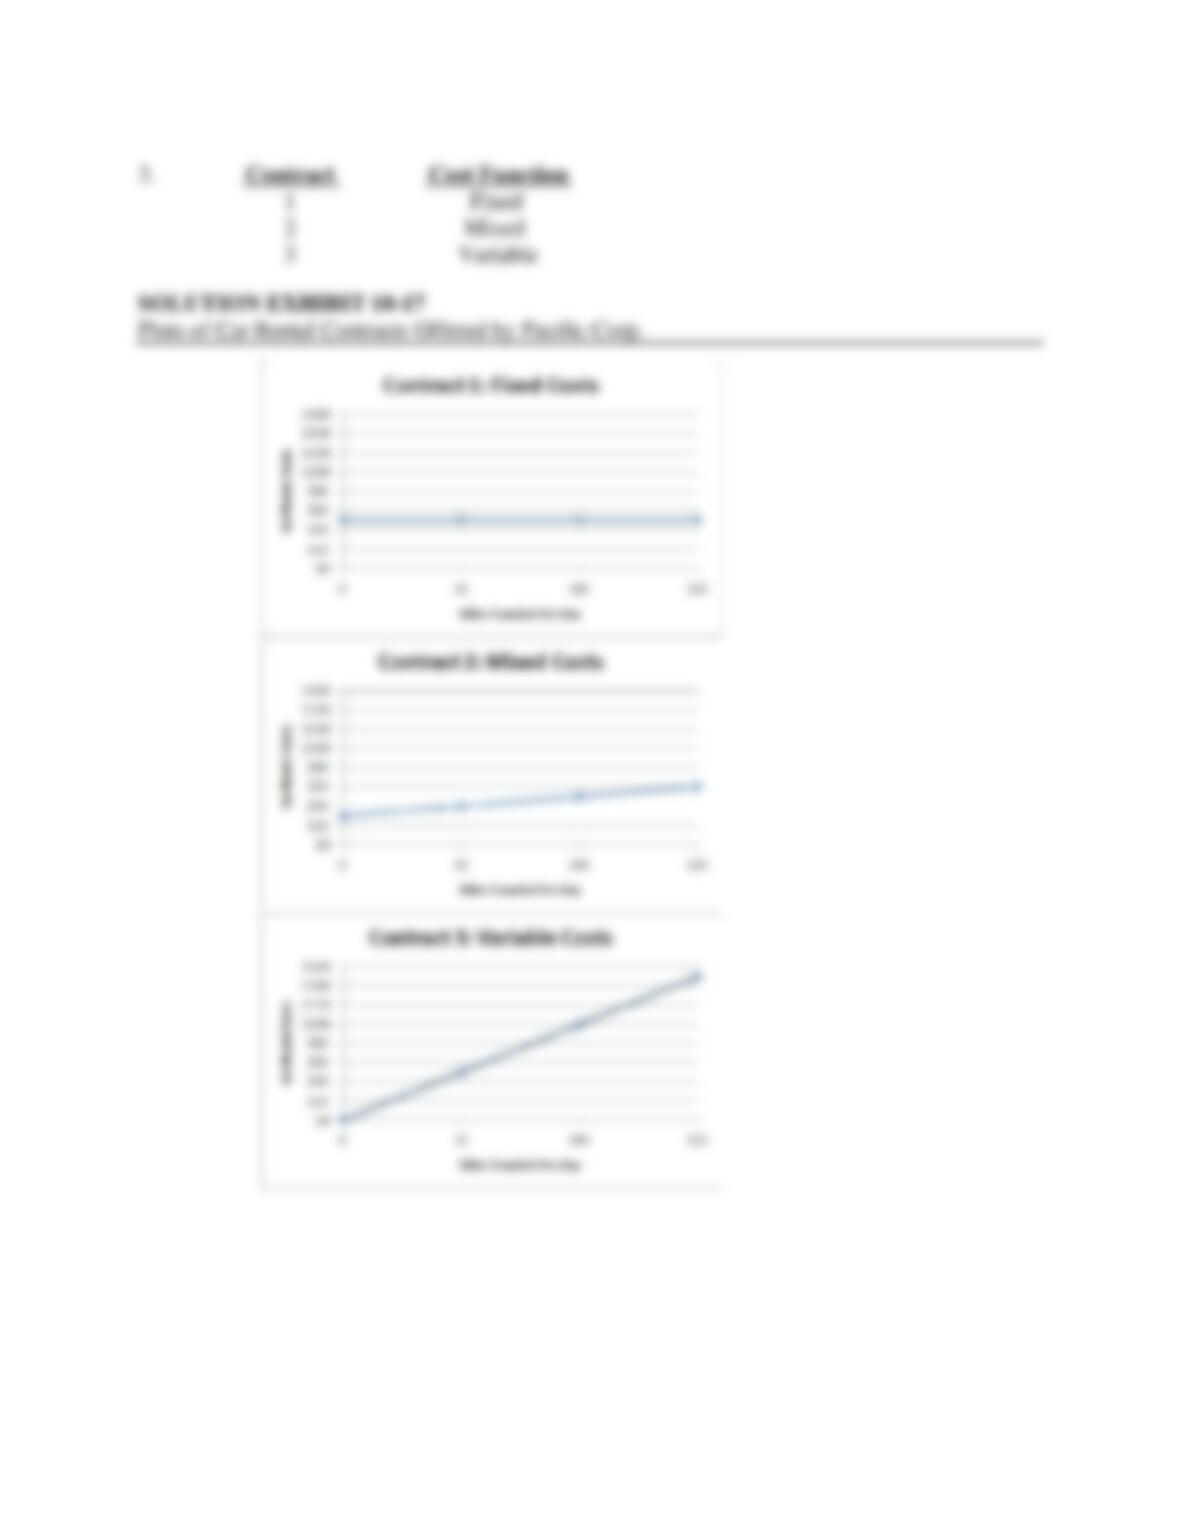
1. Plot separate graphs for each of the three contracts, with costs on the vertical axis and miles
traveled on the horizontal axis.
2. Express each contract as a linear cost function of the form y = a + bX.
3. Identify each contract as a variable-, fixed-, or mixed-cost function.
SOLUTION
10-5
10-6
10-18 (20 min.) Various cost-behavior patterns.
(CPA, adapted).
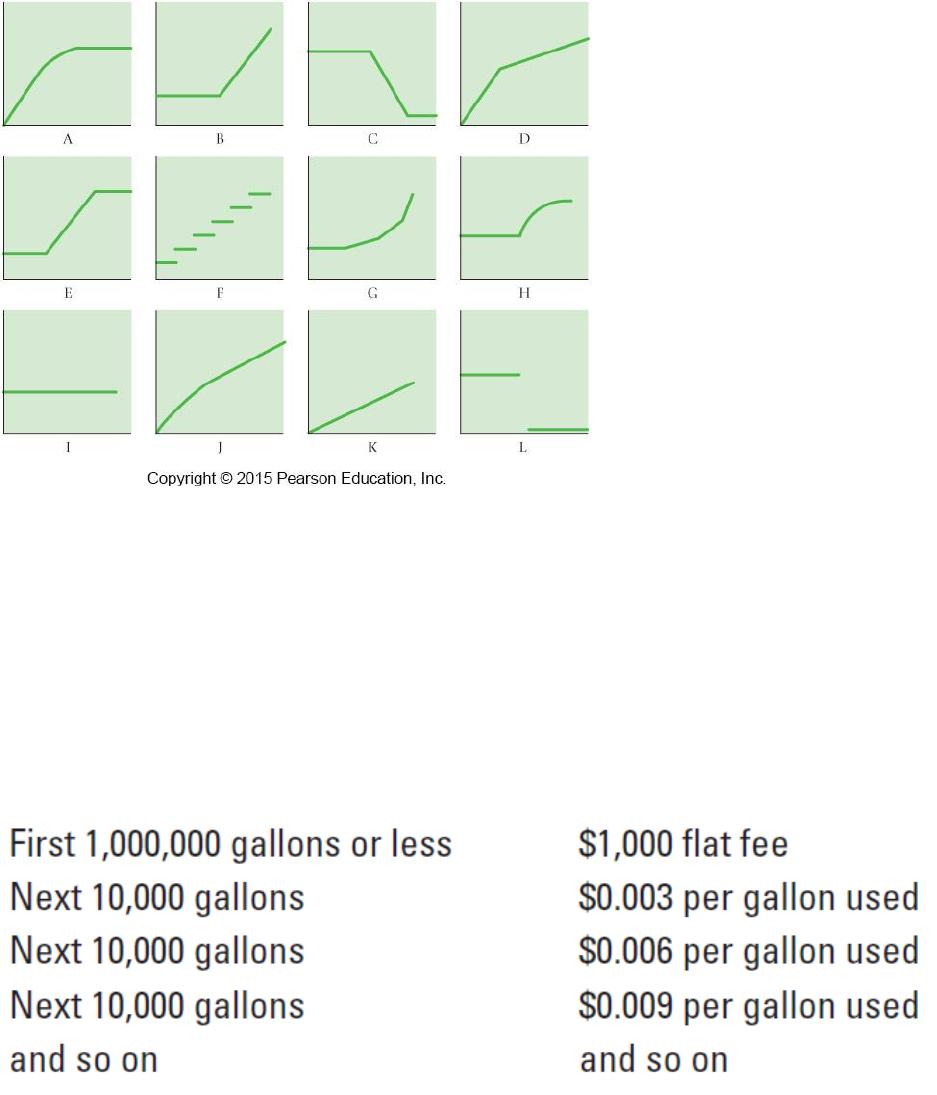
The vertical axes of the graphs below represent total cost, and the horizontal axes represent
units produced during a calendar year. In each case, the zero point of dollars and production is at
the intersection of the two axes.
Required:
Select the graph that matches the numbered manufacturing cost data (requirements 1-9). Indicate
by letter which graph best fits the situation or item described. The graphs may be used more than
once.
1. Annual depreciation of equipment, where the amount of depreciation charged is computed by
the machine-hours method.
2. Electricity bill—a flat fixed charge, plus a variable cost after a certain number of kilowatt–
hours are used, in which the quantity of kilowatt-hours used varies proportionately with
quantity of units produced.
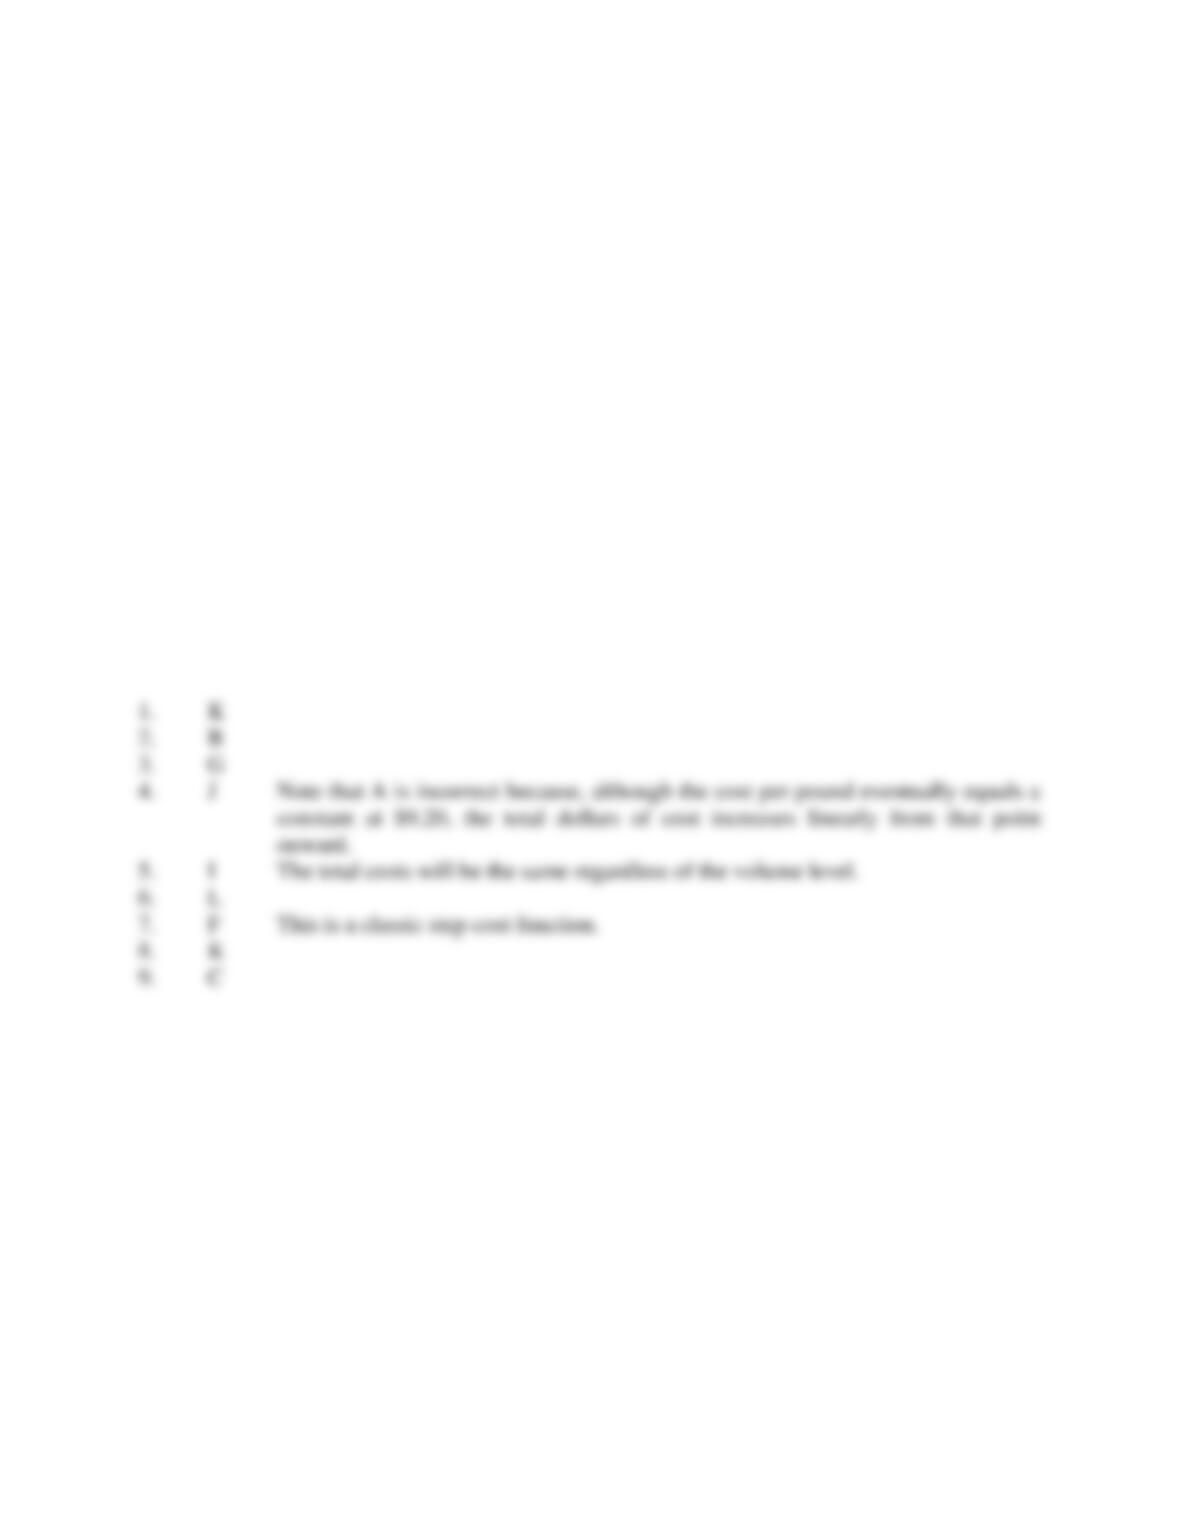
3. City water bill, which is computed as follows:
10-7
The gallons of water used vary proportionately with the quantity of production output.
4. Cost of direct materials, where direct material cost per unit produced decreases with each
pound of material used (for example, if 1 pound is used, the cost is $10; if 2 pounds are used,
the cost is $19.98; if 3 pounds are used, the cost is $29.94), with a minimum cost per unit of
$9.20.
5. Annual depreciation of equipment, where the amount is computed by the straight-line
method. When the depreciation schedule was prepared, it was anticipated that the
obsolescence factor would be greater than the wear-and-tear factor.
6. Rent on a manufacturing plant donated by the city, where the agreement calls for a fixed-fee
payment unless 200,000 labor-hours are worked, in which case no rent is paid.
7. Salaries of repair personnel, where one person is needed for every 1,000 machine-hours or
less (that is, 0 to 1,000 hours requires one person, 1,001 to 2,000 hours requires two people,
and so on).
8. Cost of direct materials used (assume no quantity discounts).
9. Rent on a manufacturing plant donated by the county, where the agreement calls for rent of
$100,000 to be reduced by $1 for each direct manufacturing labor-hour worked in excess of
200,000 hours, but a minimum rental fee of $20,000 must be paid.
SOLUTION
10-19 (30 min.) Matching graphs with descriptions of cost and revenue behavior.
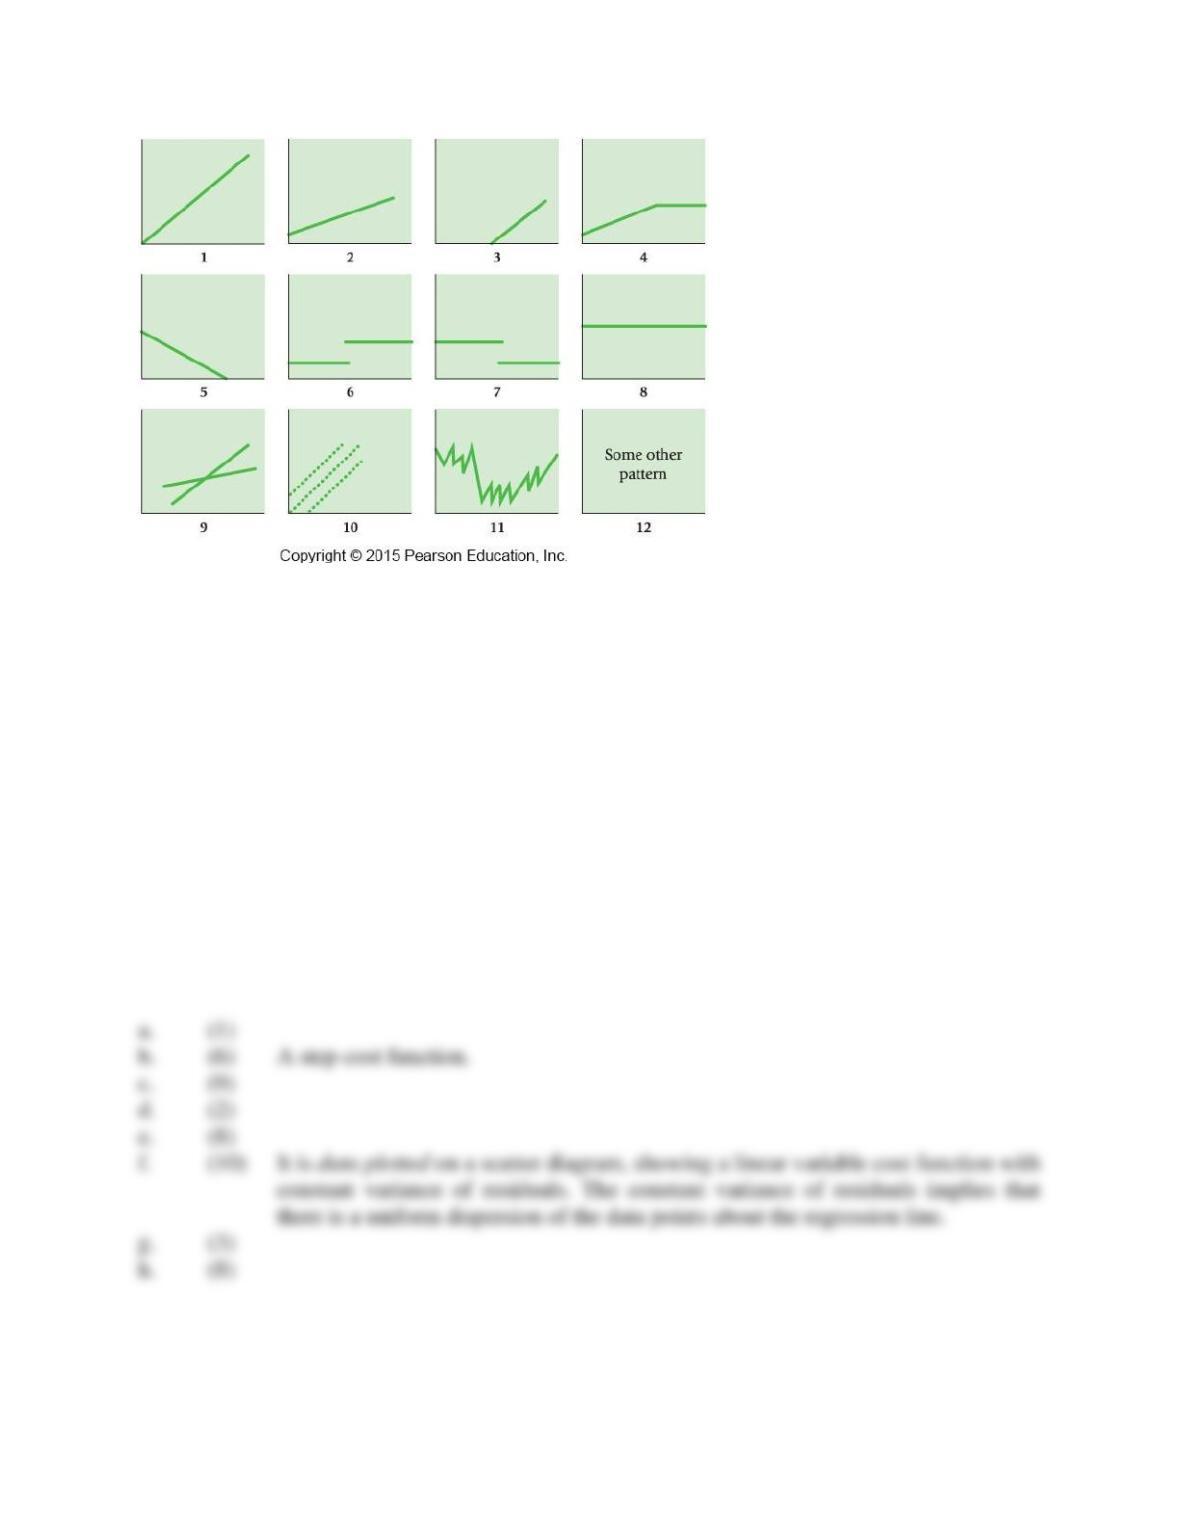
(D. Green, adapted) Given here are a number of graphs.
The horizontal axis of each graph represents the units produced over the year, and the vertical
axis represents total cost or revenues.
10-8
Required:
Indicate by number which graph best fits the situation or item described (a–h). Some graphs may
be used more than once; some may not apply to any of the situations.
a. Direct material costs
b. Supervisors’ salaries for one shift and two shifts
c. A cost-volume-profit graph
d. Mixed costs—for example, car rental fixed charge plus a rate per mile driven
e. Depreciation of plant, computed on a straight-line basis
f. Data supporting the use of a variable-cost rate, such as manufacturing labor cost of $14 per
unit produced
g. Incentive bonus plan that pays managers $0.10 for every unit produced above some level of
production
h. Interest expense on $2 million borrowed at a fixed rate of interest
SOLUTION
10-9
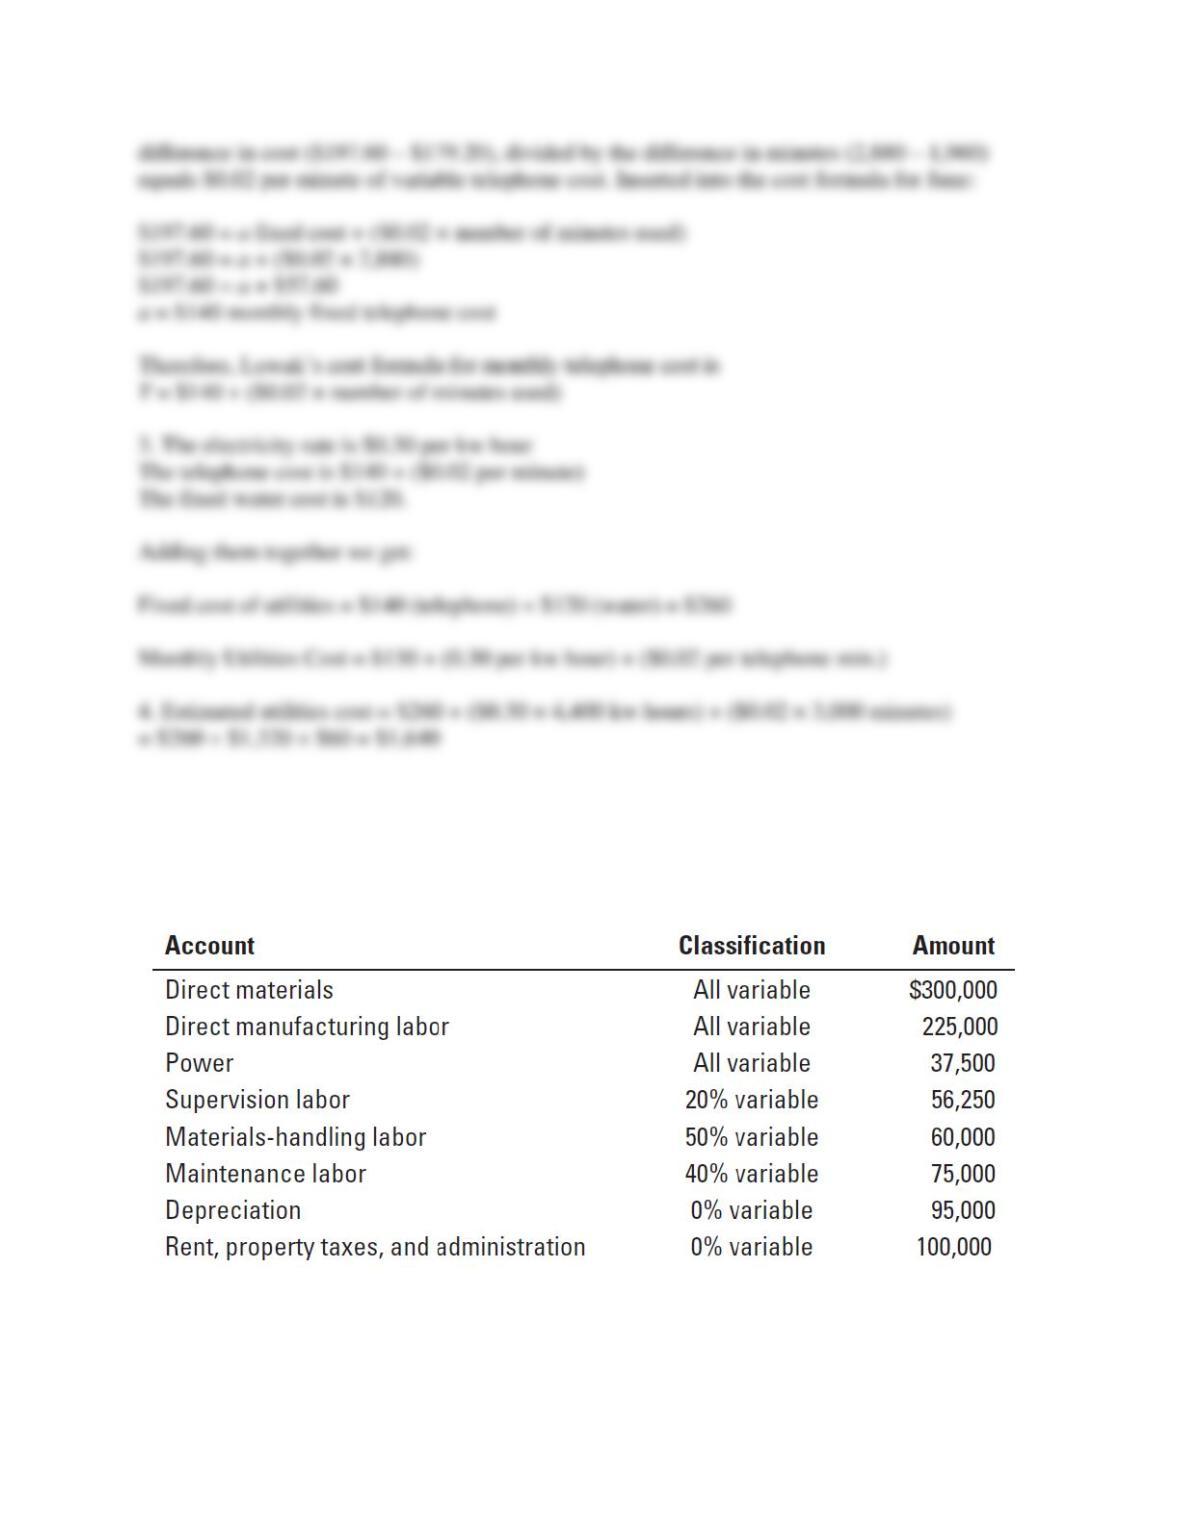
10-20 (20 min.) Account analysis, high-low
Luwak Coffees wants to find an equation to estimate monthly utility costs. Luwak has been in
business for one year and has collected the following cost data for utilities:
Required:
1. Which of the preceding costs is variable? Fixed? Mixed? Explain.
2. Using the high-low method, determine the cost function for each cost.
3. Combine the preceding information to get a monthly utility cost function for Java Joe’s.
4. Next month, Luwak expects to use 4,400 kilowatt hours of electricity, make 3,000 minutes of
telephone calls, and use 64,000 gallons of water. Estimate total cost of utilities for the month.
SOLUTION
10-10
10-21 (30 min.) Account analysis method.
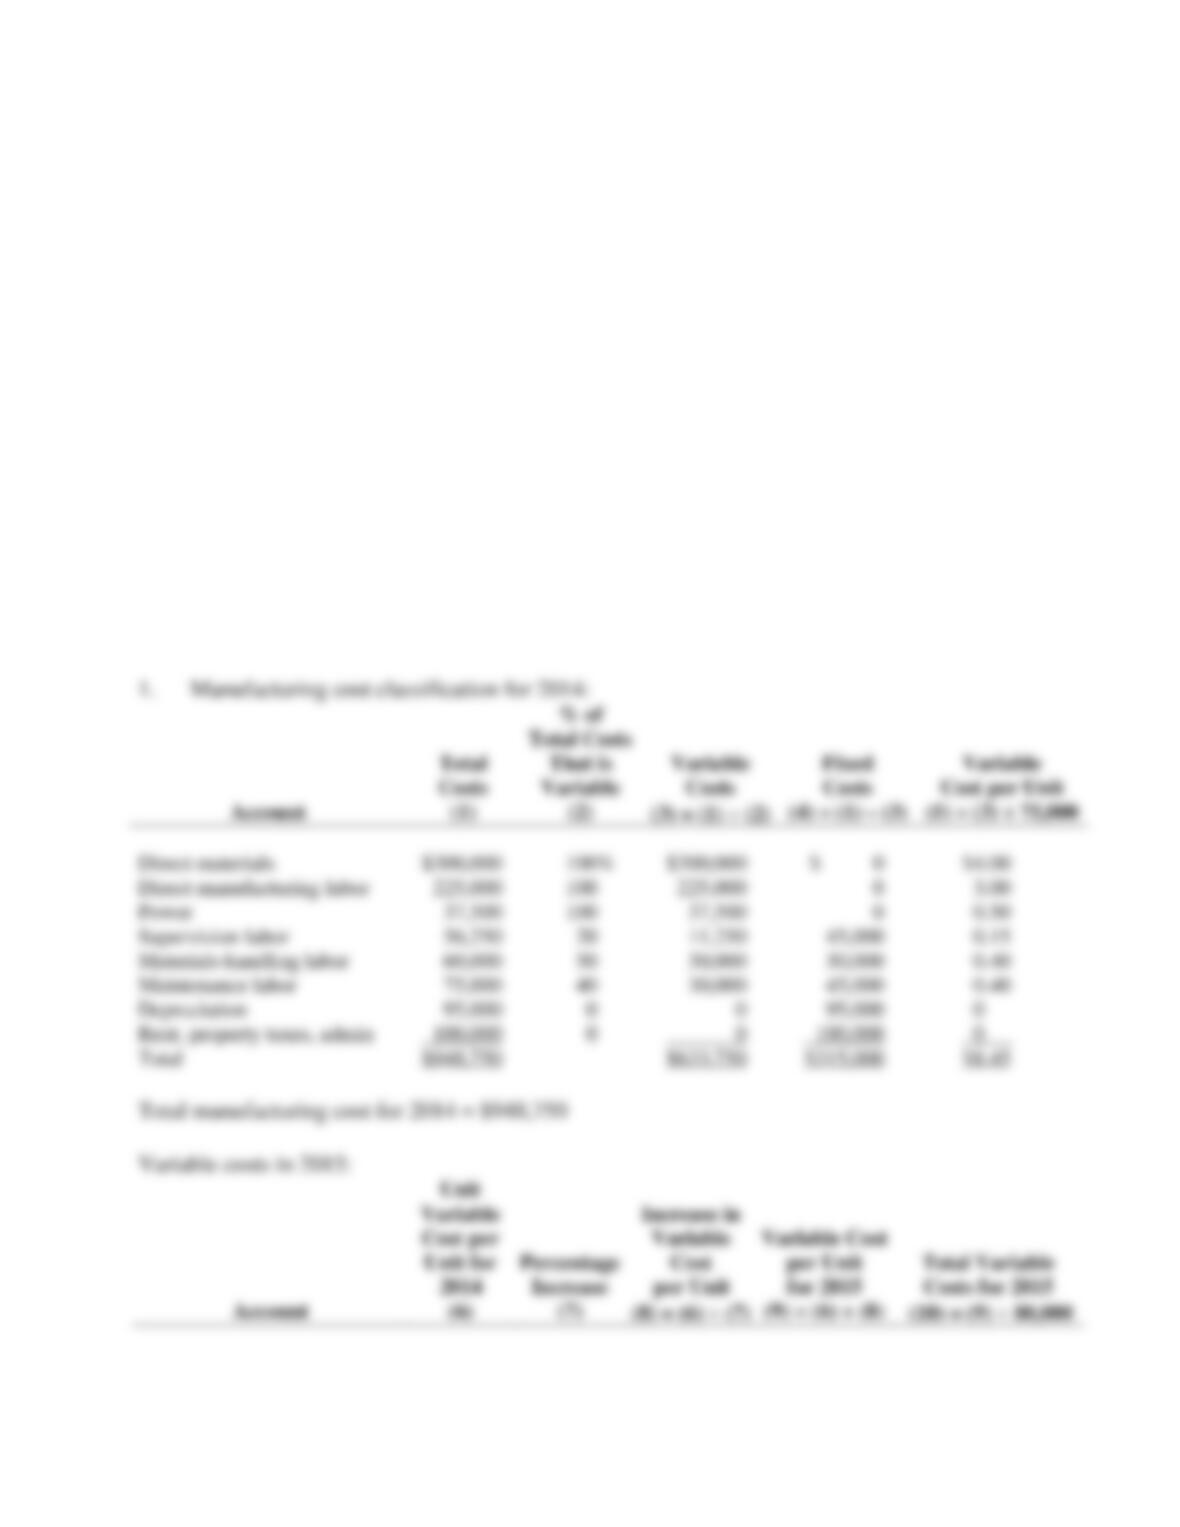
Gower, Inc., a manufacturer of plastic products, reports the following manufacturing costs and
account analysis classification for the year ended December 31, 2014.
Gower, Inc., produced 75,000 units of product in 2014. Gower’s management is estimating costs
for 2015 on the basis of 2014 numbers. The following additional information is available for
2015.
10-11
a. Direct materials prices in 2015 are expected to increase by 5% compared with 2014.
b. Under the terms of the labor contract, direct manufacturing labor wage rates are expected to
increase by 10% in 2015 compared with 2014.
c. Power rates and wage rates for supervision, materials handling, and maintenance are not
expected to change from 2014 to 2015.
d. Depreciation costs are expected to increase by 5%, and rent, property taxes, and
administration costs are expected to increase by 7%.
e. Gower expects to manufacture and sell 80,000 units in 2015.
Required:
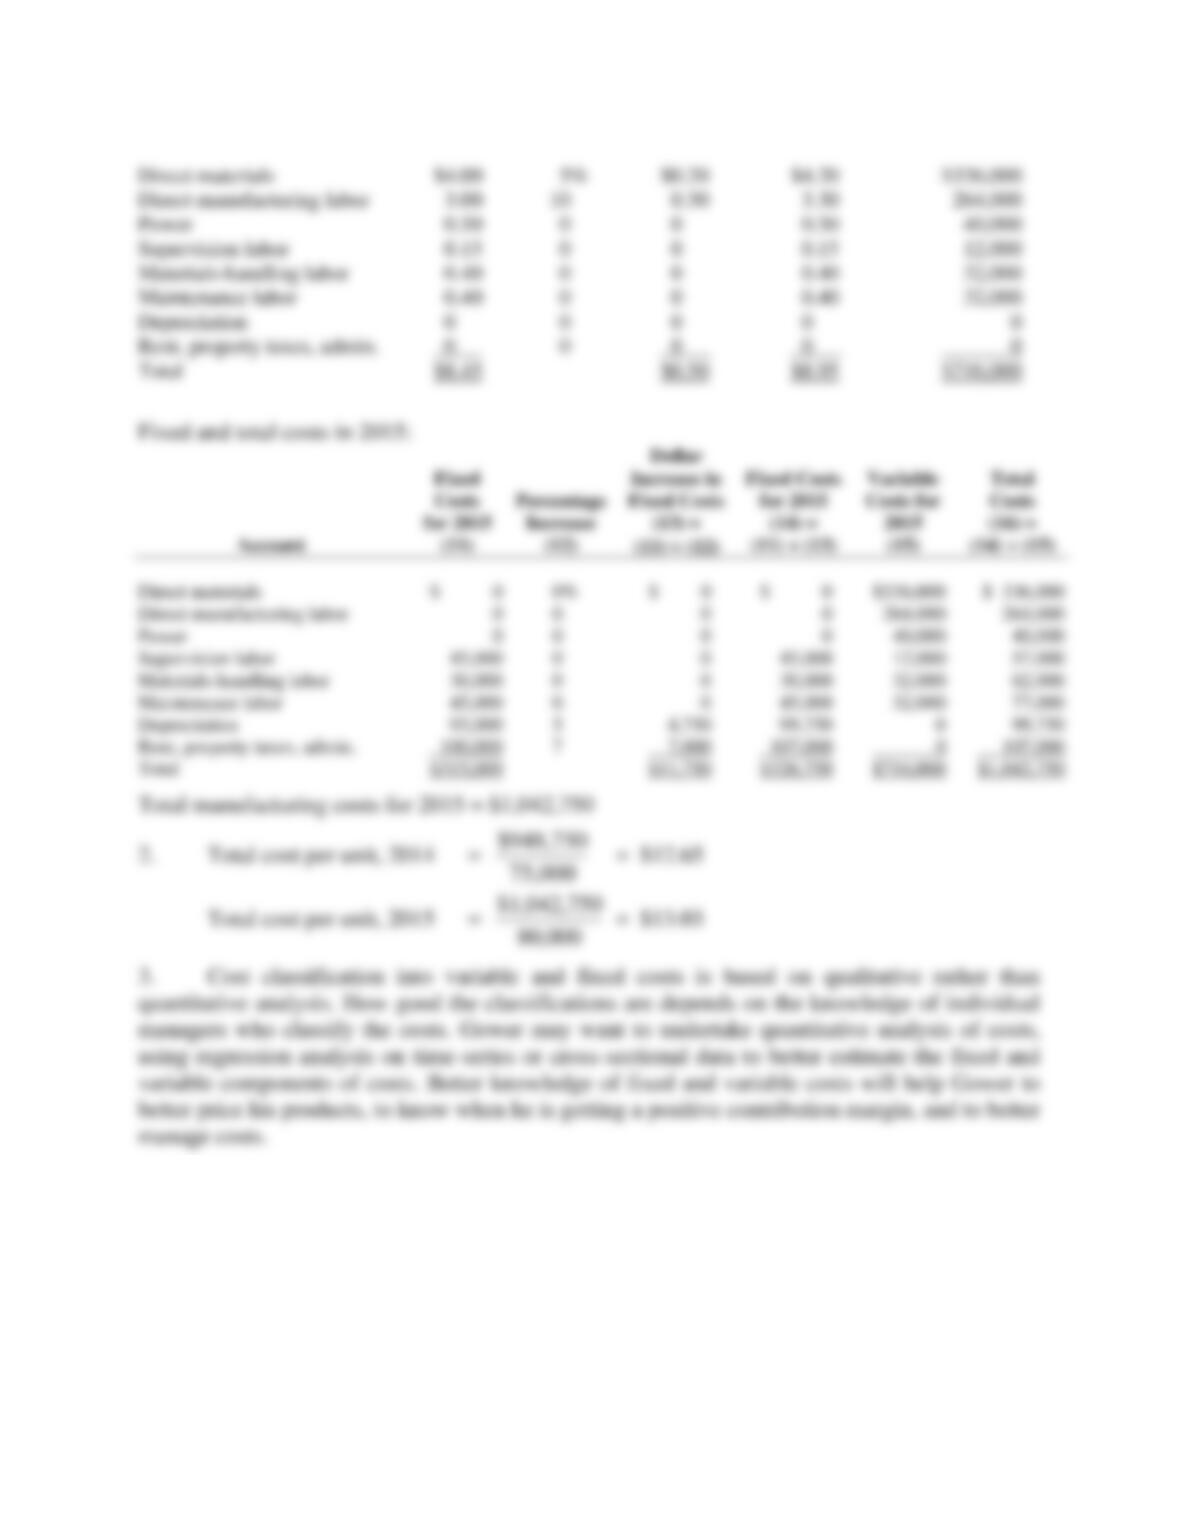
1. Prepare a schedule of variable, fixed, and total manufacturing costs for each account category
in 2015. Estimate total manufacturing costs for 2015.
2. Calculate Gower’s total manufacturing cost per unit in 2014, and estimate total
manufacturing cost per unit in 2015.
3. How can you obtain better estimates of fixed and variable costs? Why would these better
estimates be useful to Gower?
SOLUTION
10-12
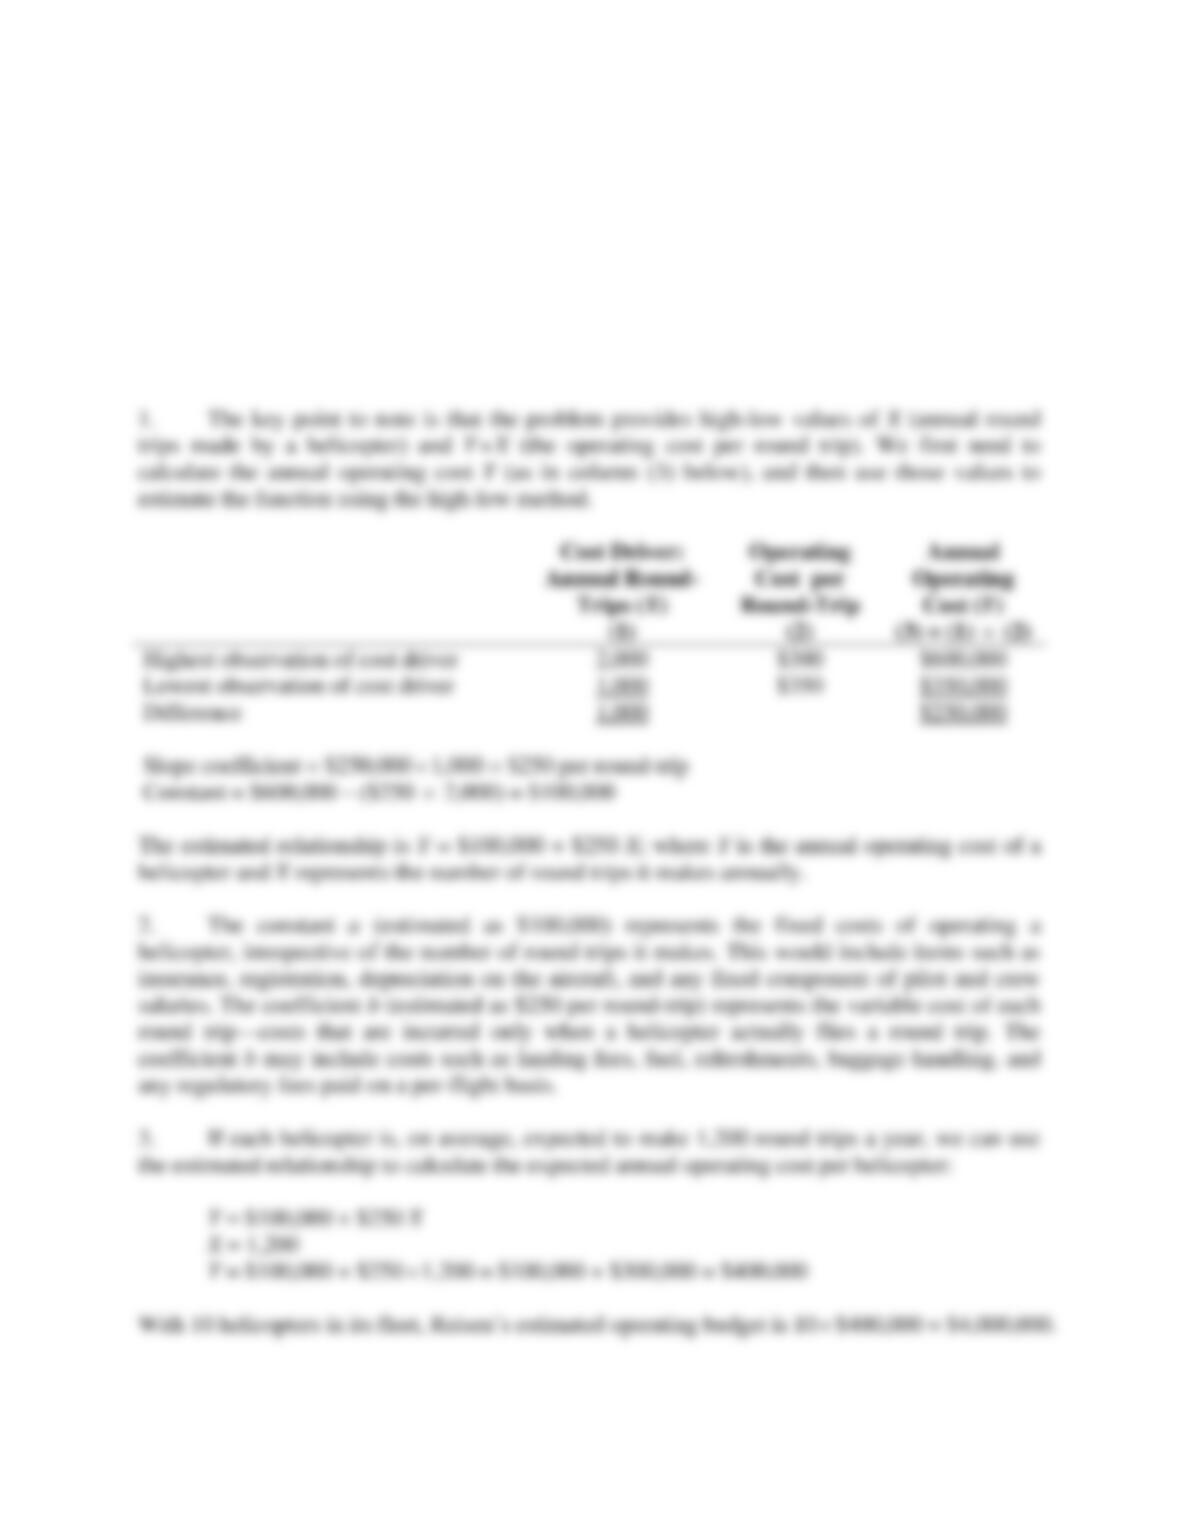
10-22 (15–20 min.) Estimating a cost function, high-low method.
Reisen Travel offers helicopter service from suburban towns to John F. Kennedy International
Airport in New York City. Each of its 10 helicopters makes between 1,000 and 2,000 round-trips
per year. The records indicate that a helicopter that has made 1,000 round-trips in the year incurs
an average operating cost of $350 per round-trip, and one that has made 2,000 round-trips in the
year incurs an average operating cost of $300 per round-trip.
10-13
Required:
1. Using the high-low method, estimate the linear relationship y = a + bX, where y is the
total annual operating cost of a helicopter and X is the number of round-trips it makes to JFK
airport during the year.
2. Give examples of costs that would be included in a and in b.
3. If Reisen Travel expects each helicopter to make, on average, 1,200 round-trips in the
coming year, what should its estimated operating budget for the helicopter fleet be?
SOLUTION
10-14
10-23 (20 min.) Estimating a cost function, high-low method.
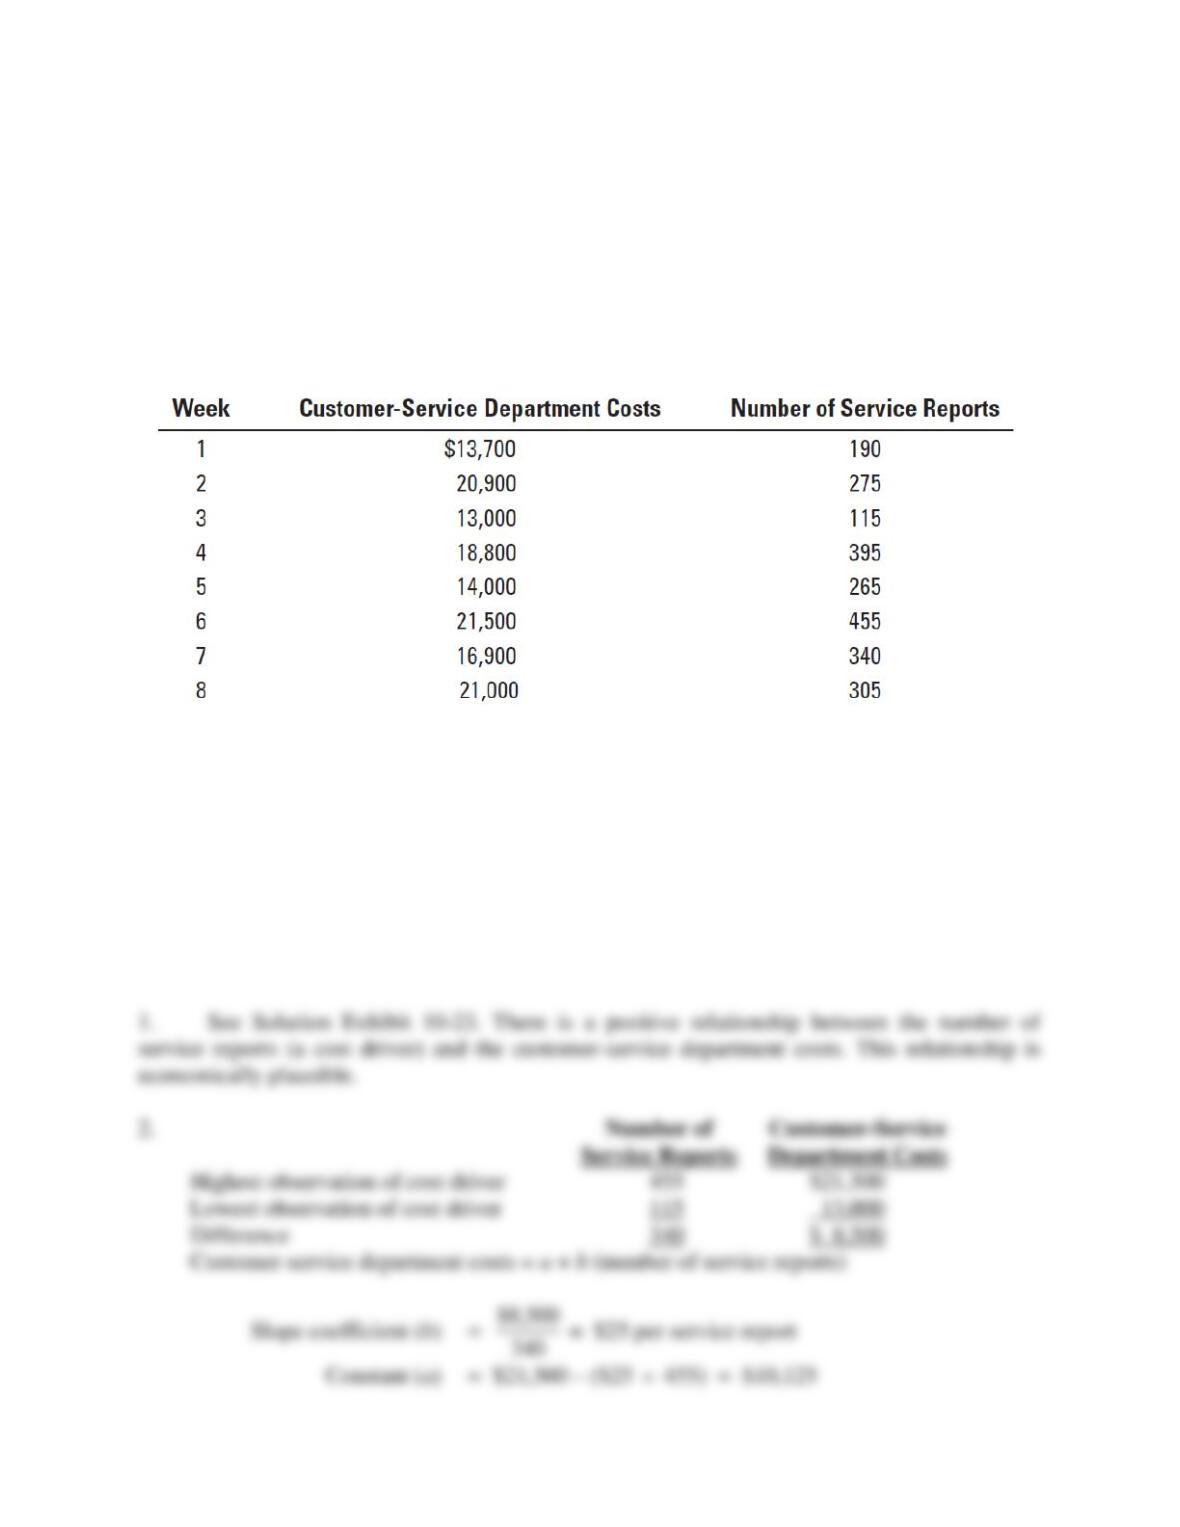
Laurie Daley is examining customer-service costs in the southern region of Capitol Products.
Capitol Products has more than 200 separate electrical products that are sold with a 6-month
guarantee of full repair or replacement with a new product. When a product is returned by a
customer, a service report is prepared. This service report includes details of the problem and the
time and cost of resolving the problem. Weekly data for the most recent 8-week period are as
follows:
Required:
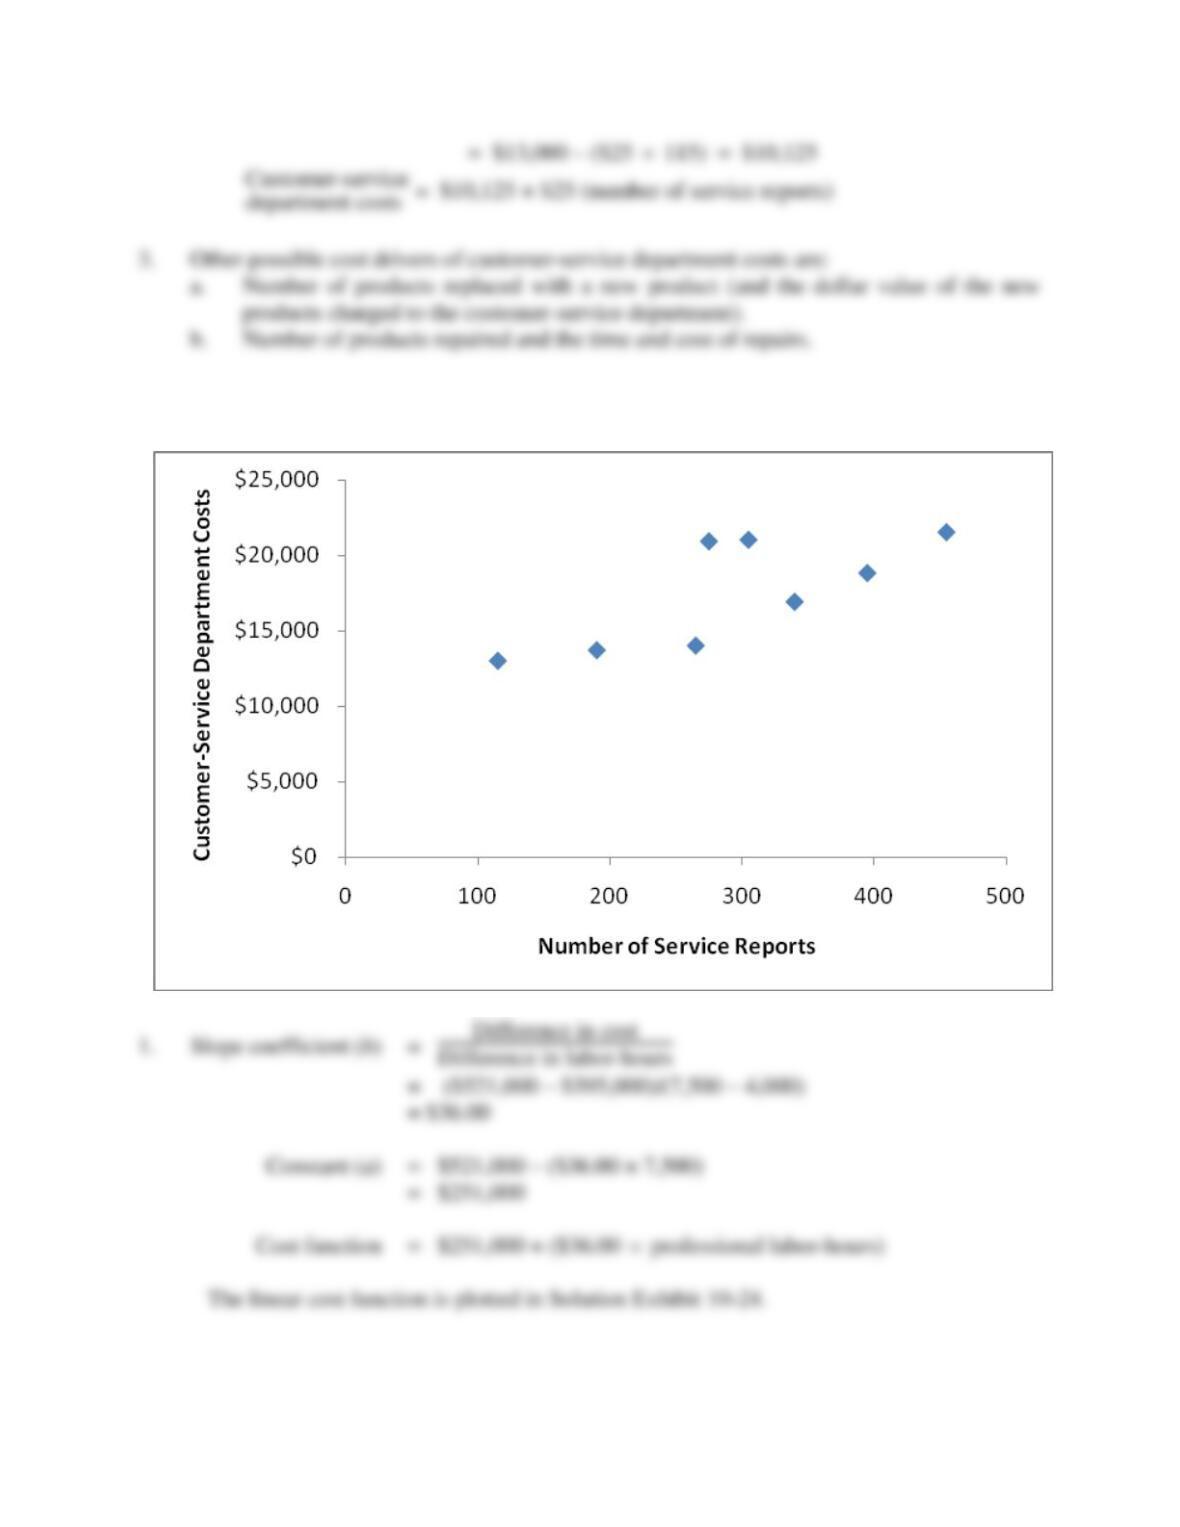
1. Plot the relationship between customer-service costs and number of service reports. Is the
relationship economically plausible?
2. Use the high-low method to compute the cost function, relating customer-service costs to the
number of service reports.
3. What variables, in addition to number of service reports, might be cost drivers of weekly
customer-service costs of Capitol Products?
SOLUTION
10-15
SOLUTION EXHIBIT 10-23
Plot of Number of Service Reports versus Customer-Service Dept. Costs for Capitol Products
10-24 (30–40 min.) Linear cost approximation.
10-16
10-17
10-24 (20 min.) Linear cost approximation.
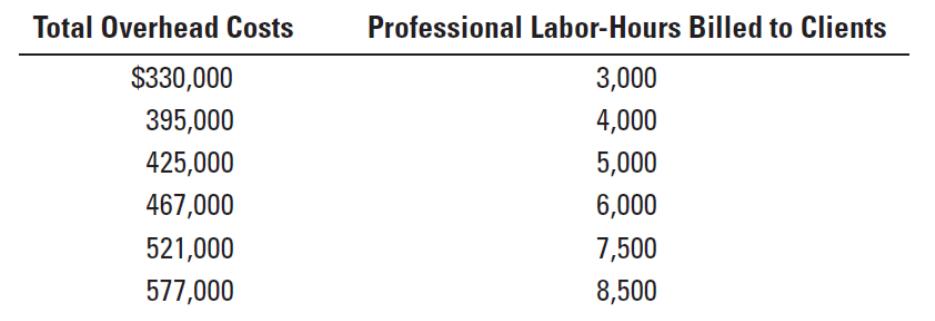
Terry Lawler, managing director of the Little Rock Reviewers Company, is examining how
overhead costs behave with changes in monthly professional labor-hours billed to clients.
Assume the following historical data:
Required:
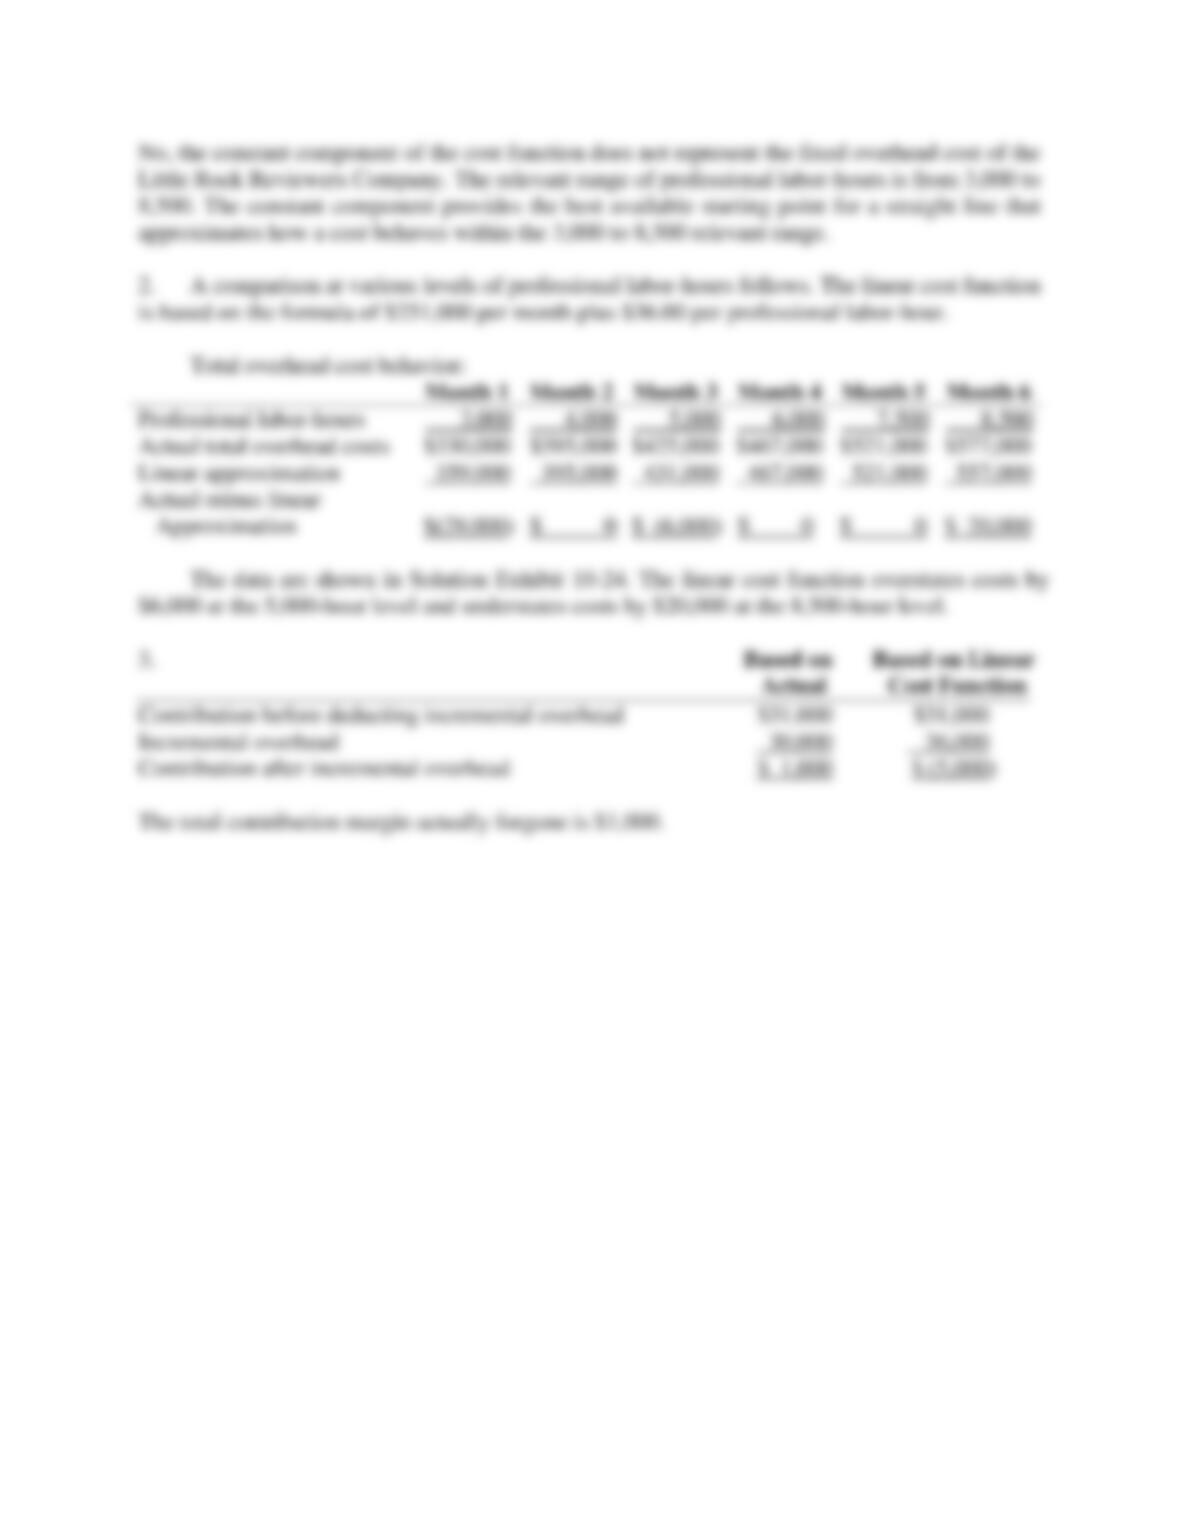
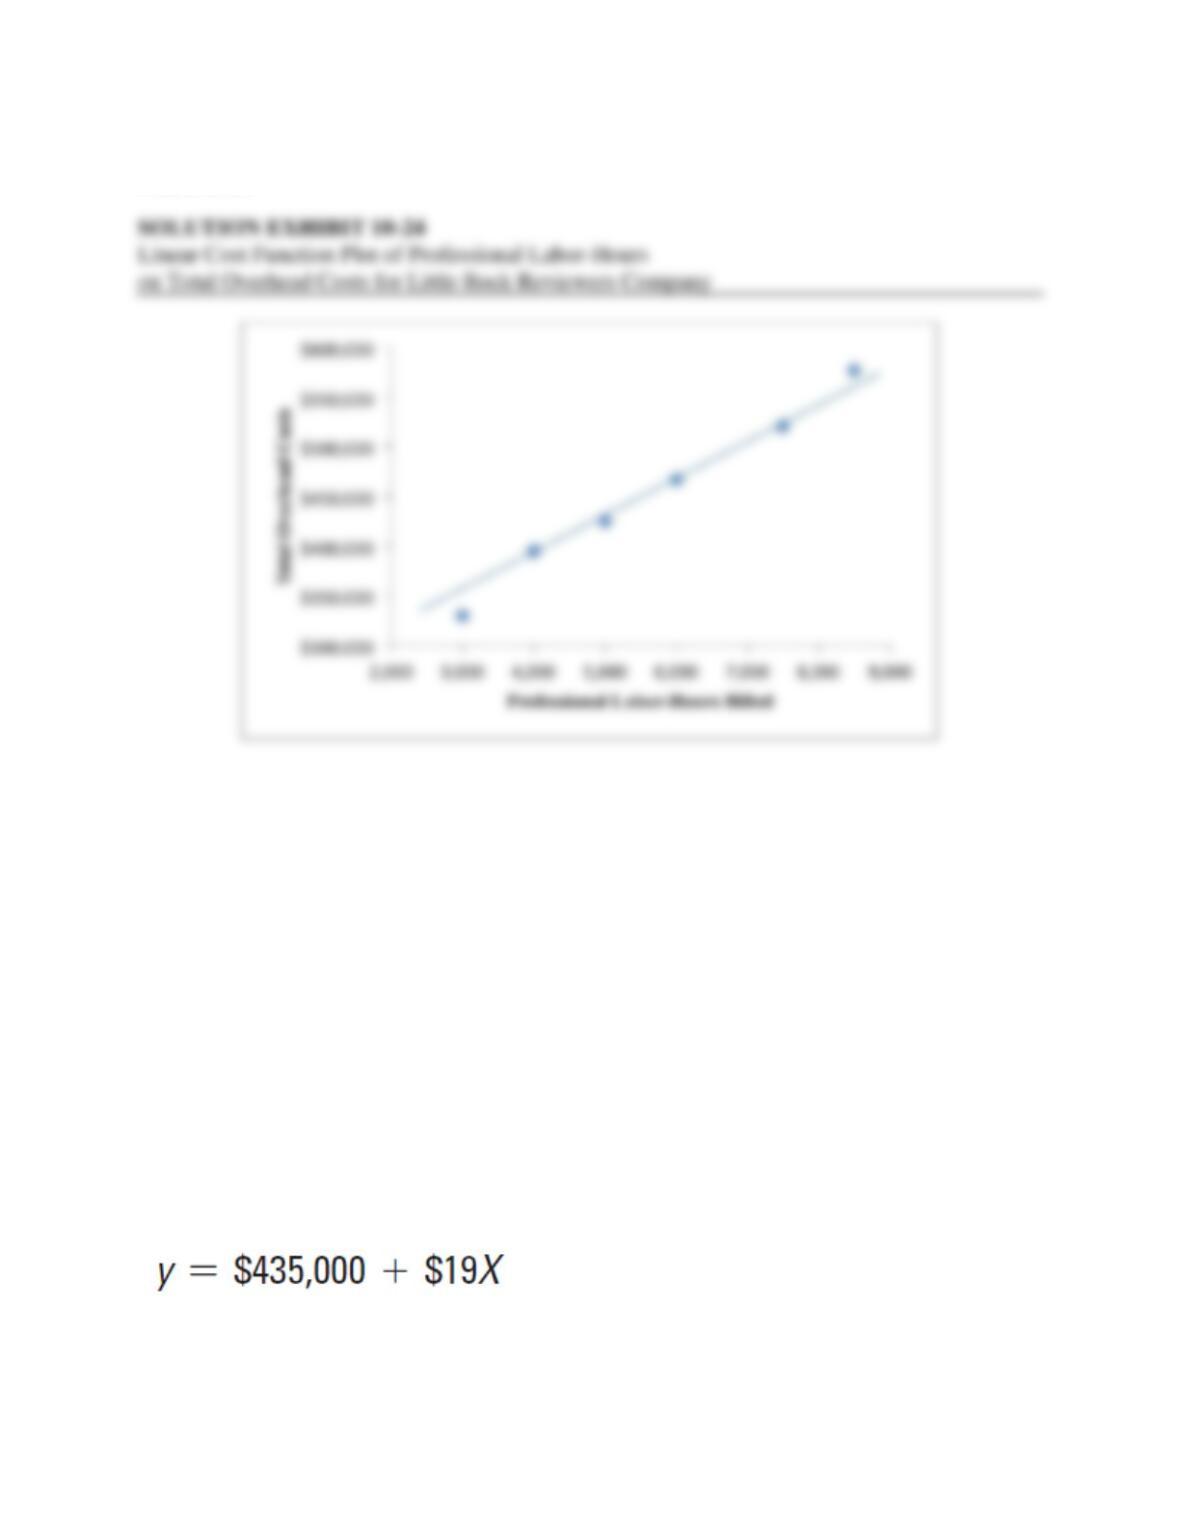
1. Compute the linear cost function, relating total overhead costs to professional labor-hours,
using the representative observations of 4,000 and 7,500 hours. Plot the linear cost function.
Does the constant component of the cost function represent the fixed overhead costs of the
Little Rock Reviewers Company? Why?
2. What would be the predicted total overhead costs for (a) 5,000 hours and (b) 8,500 hours
using the cost function estimated in requirement 1? Plot the predicted costs and actual costs
for 5,000 and 8,500 hours.
3. Lawler had a chance to accept a special job that would have boosted professional labor-hours
from 4,000 to 5,000 hours. Suppose Lawler, guided by the linear cost function, rejected this
job because it would have brought a total increase in contribution margin of $31,000, before
deducting the predicted increase in total overhead cost, $36,000. What is the total
contribution margin actually forgone?
10-18
SOLUTION
10-25 (20 min.) Cost-volume-profit and regression analysis.
Goldstein Corporation manufactures a children’s bicycle, model CT8. Goldstein currently
manufactures the bicycle frame. During 2014, Goldstein made 32,000 frames at a total cost of
$1,056,000. Ryan Corporation has offered to supply as many frames as Goldstein wants at a cost
of $32.50 per frame. Goldstein anticipates needing 35,000 frames each year for the next few
years.
Required:
1. a. What is the average cost of manufacturing a bicycle frame in 2014? How does it compare
to Ryan’s offer?
b. Can Goldstein use the answer in requirement 1a to determine the cost of manufacturing
35,000 bicycle frames? Explain.
2. Goldstein’s cost analyst uses annual data from past years to estimate the following regression
equation with total manufacturing costs of the bicycle frame as the dependent variable and
bicycle frames produced as the independent variable:
During the years used to estimate the regression equation, the production of bicycle frames
varied from 31,000 to 35,000. Using this equation, estimate how much it would cost
10-19
Goldstein to manufacture 35,000 bicycle frames. How much more or less costly is it to
manufacture the frames rather than to acquire them from Ryan?
3. What other information would you need to be confident that the equation in requirement 2
accurately predicts the cost of manufacturing bicycle frames?
SOLUTION
10-20
10-26 (25 min.) Regression analysis, service company.
(CMA, adapted) Stan Baiman owns a catering company that prepares food and beverages for
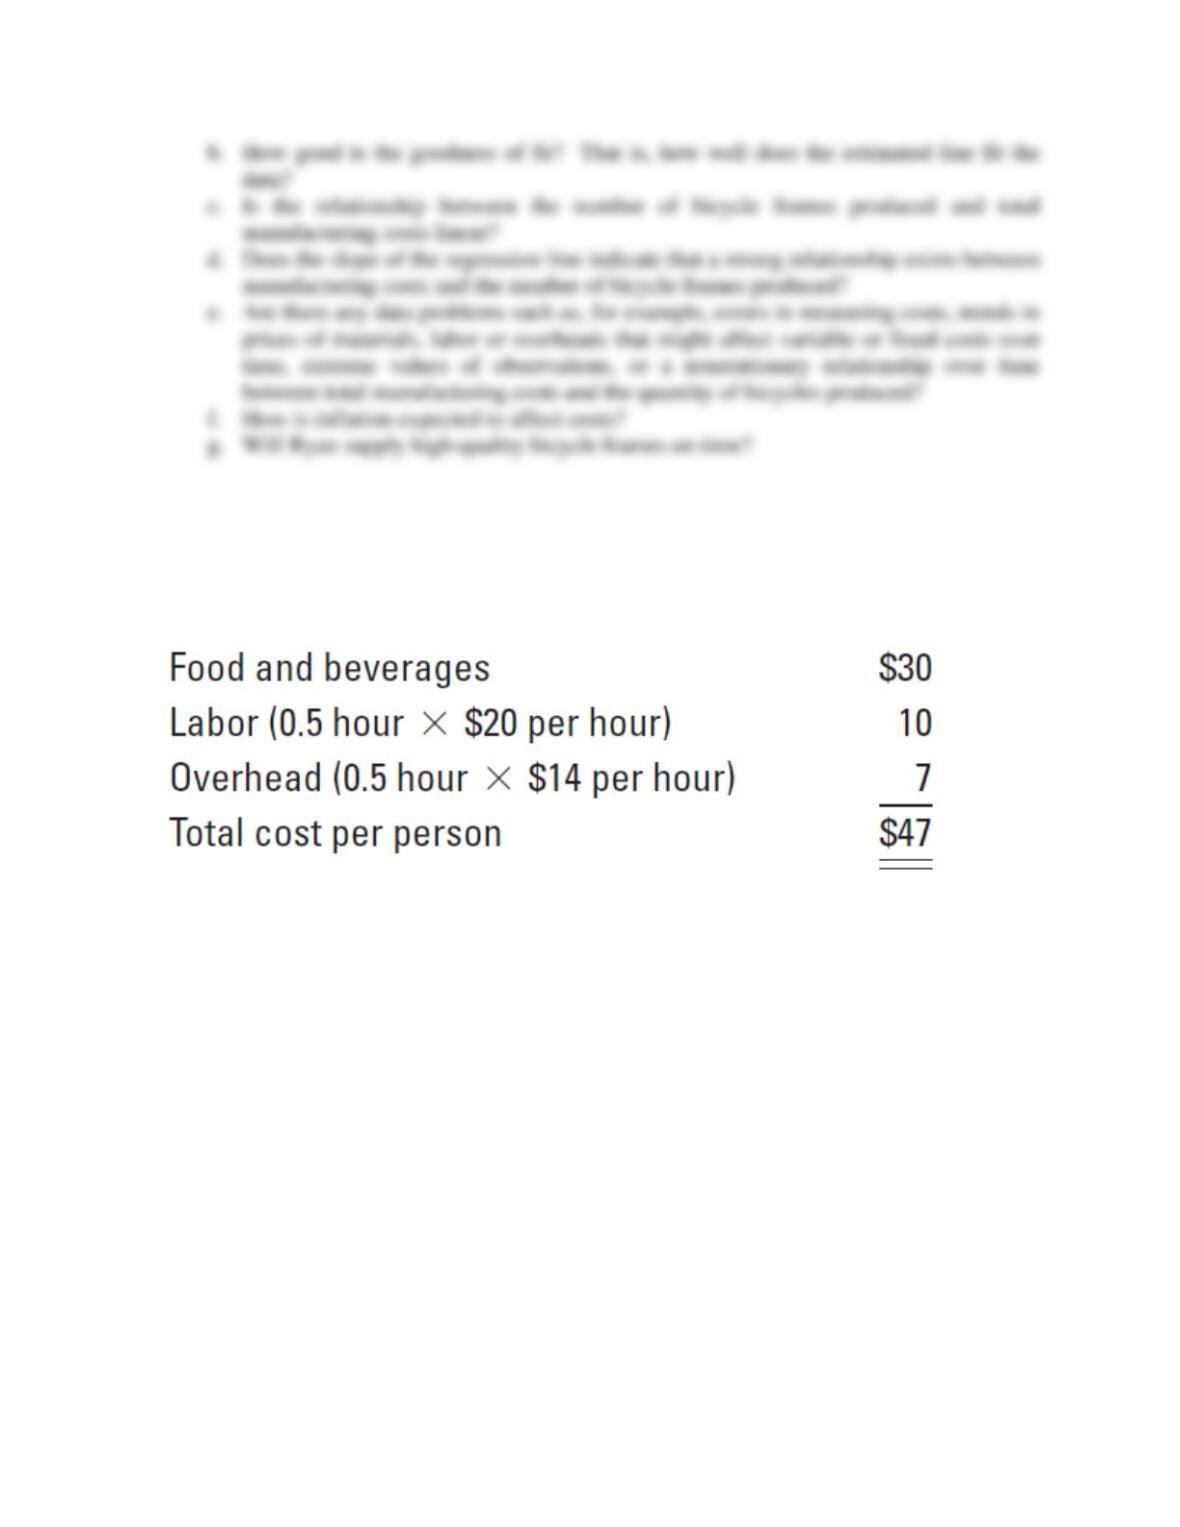
banquets and parties. For a standard party the cost on a per-person basis is as follows:
Baiman is quite certain about his estimates of the food, beverages, and labor costs but is not as
comfortable with the overhead estimate. The overhead estimate was based on the actual data for
the past 12 months, which are presented here. These data indicate that overhead costs vary with
the direct labor-hours used. The $14 estimate was determined by dividing total overhead costs
for the 12 months by total labor-hours.