10-41
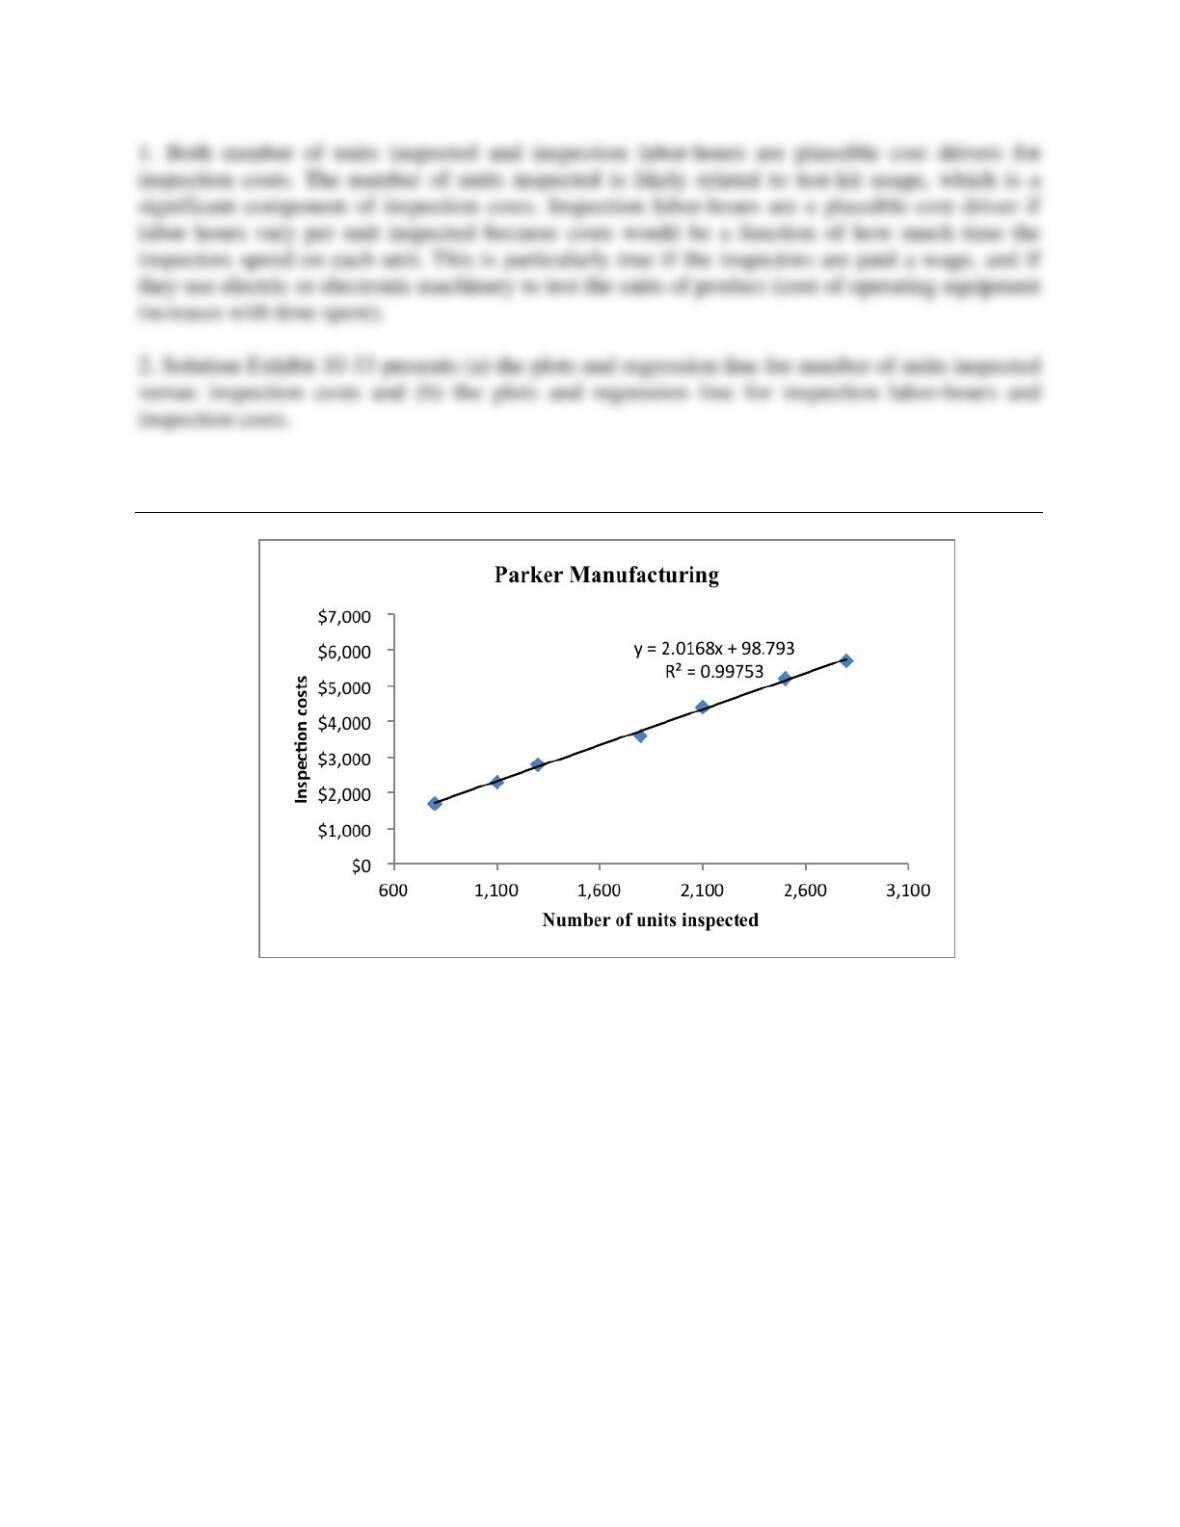
SOLUTION EXHIBIT 10-33A
Plot and Regression Line for Units Inspected versus Inspection Costs for Parker Manufacturing
10-42
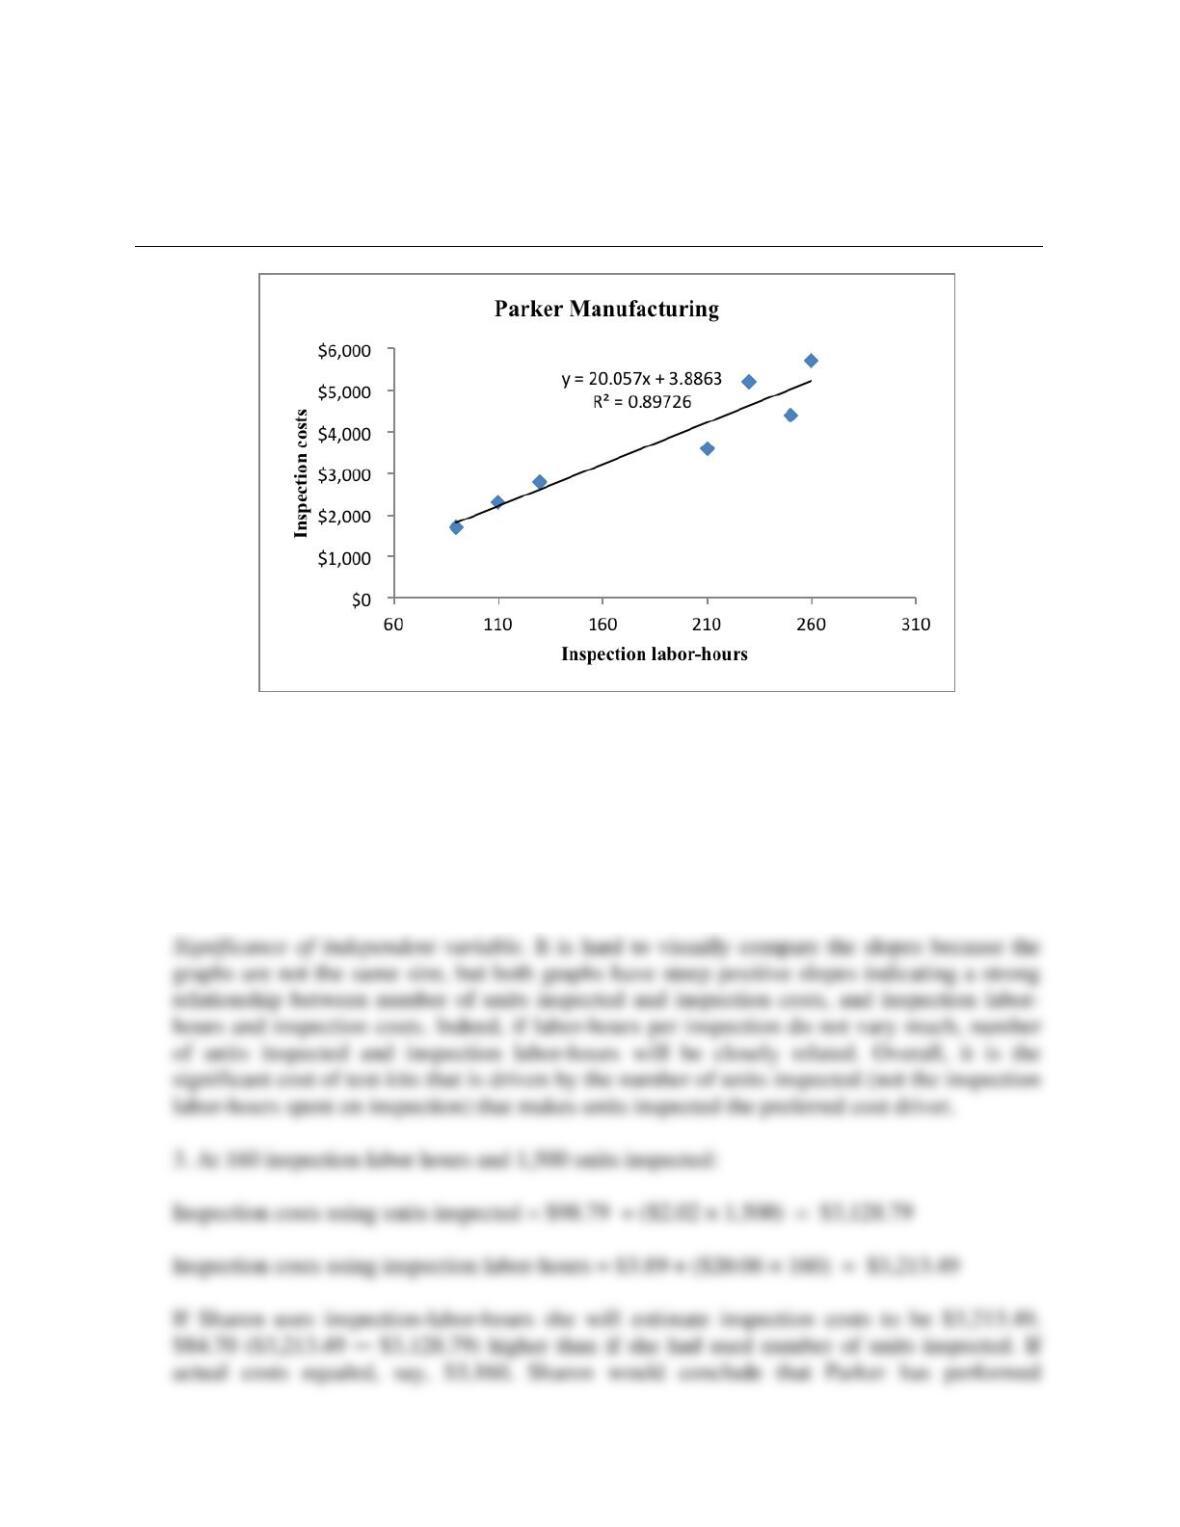
SOLUTION EXHIBIT 10-33B
Plot and Regression Line for Inspection Labor-Hours and Inspection Costs for Parker
Manufacturing
Goodness of fit. As you can see from the two graphs, the regression line based on number of
units inspected better fits the data (has smaller vertical distances from the points to the line)
than the regression line based on inspection labor-hours. The activity of inspection appears to
be more closely linearly related to the number of units inspected than inspection labor-hours.
Hence number of units inspected is a better cost driver. This is probably because the number
of units inspected is closely related to test-kit usage, which is a significant component of
inspection costs.
10-43
efficiently in its inspection activity because actual inspection costs would be lower than
budgeted amounts. In fact, based on the more accurate cost function, actual costs of $3,160
exceeded the budgeted amount of $3,128.79. Sharon should find ways to improve inspection
efficiency rather than mistakenly conclude that the inspection activity has been performing
well.
10-34 (15-20 min.) Interpreting regression results, matching time periods.
Spirit Freightways is a leader in transporting agricultural products in the western provinces of
Canada. Reese Brown, a financial analyst at Spirit Freightways, is studying the behavior of
transportation costs for budgeting purposes. Transportation costs at Spirit are of two types: (a)
operating costs (such as labor and fuel) and (b) maintenance costs (primarily overhaul of
vehicles).
Brown gathers monthly data on each type of cost, as well as the total freight miles traveled by
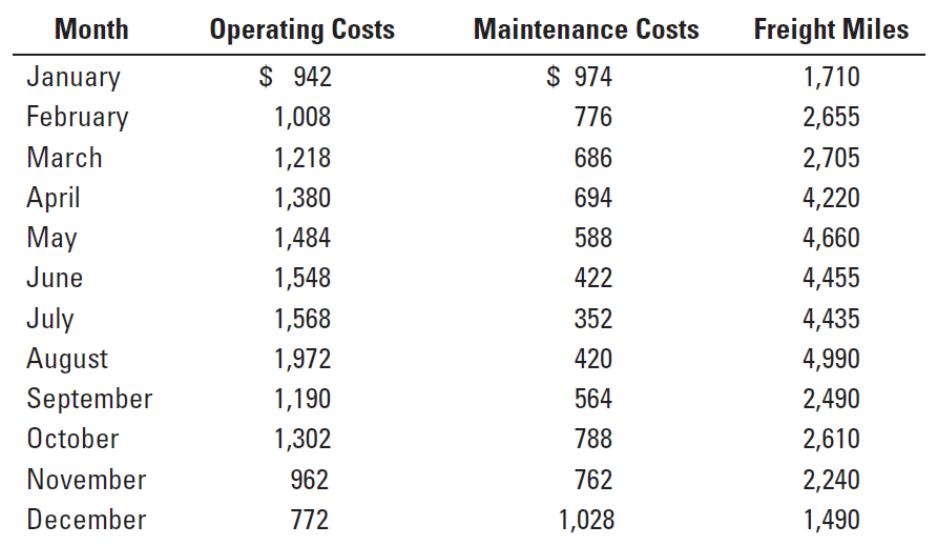
Spirit vehicles in each month. The data collected are shown below (all in thousands):
Required:
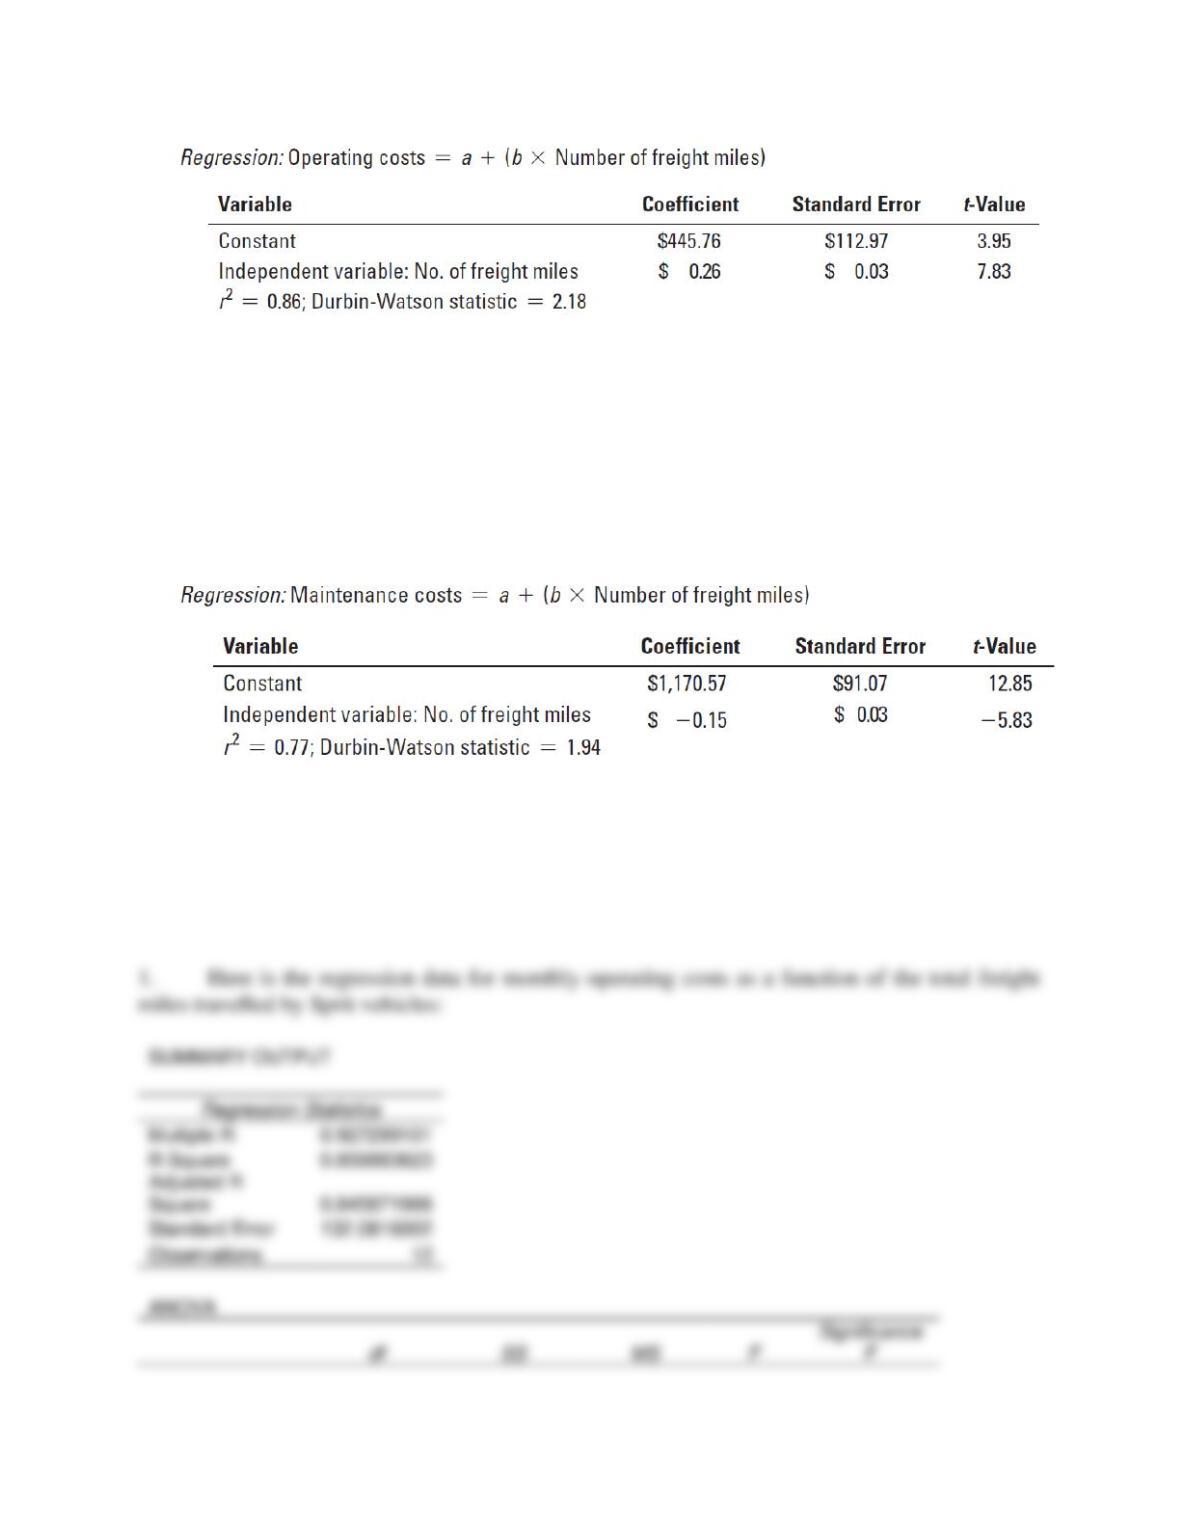
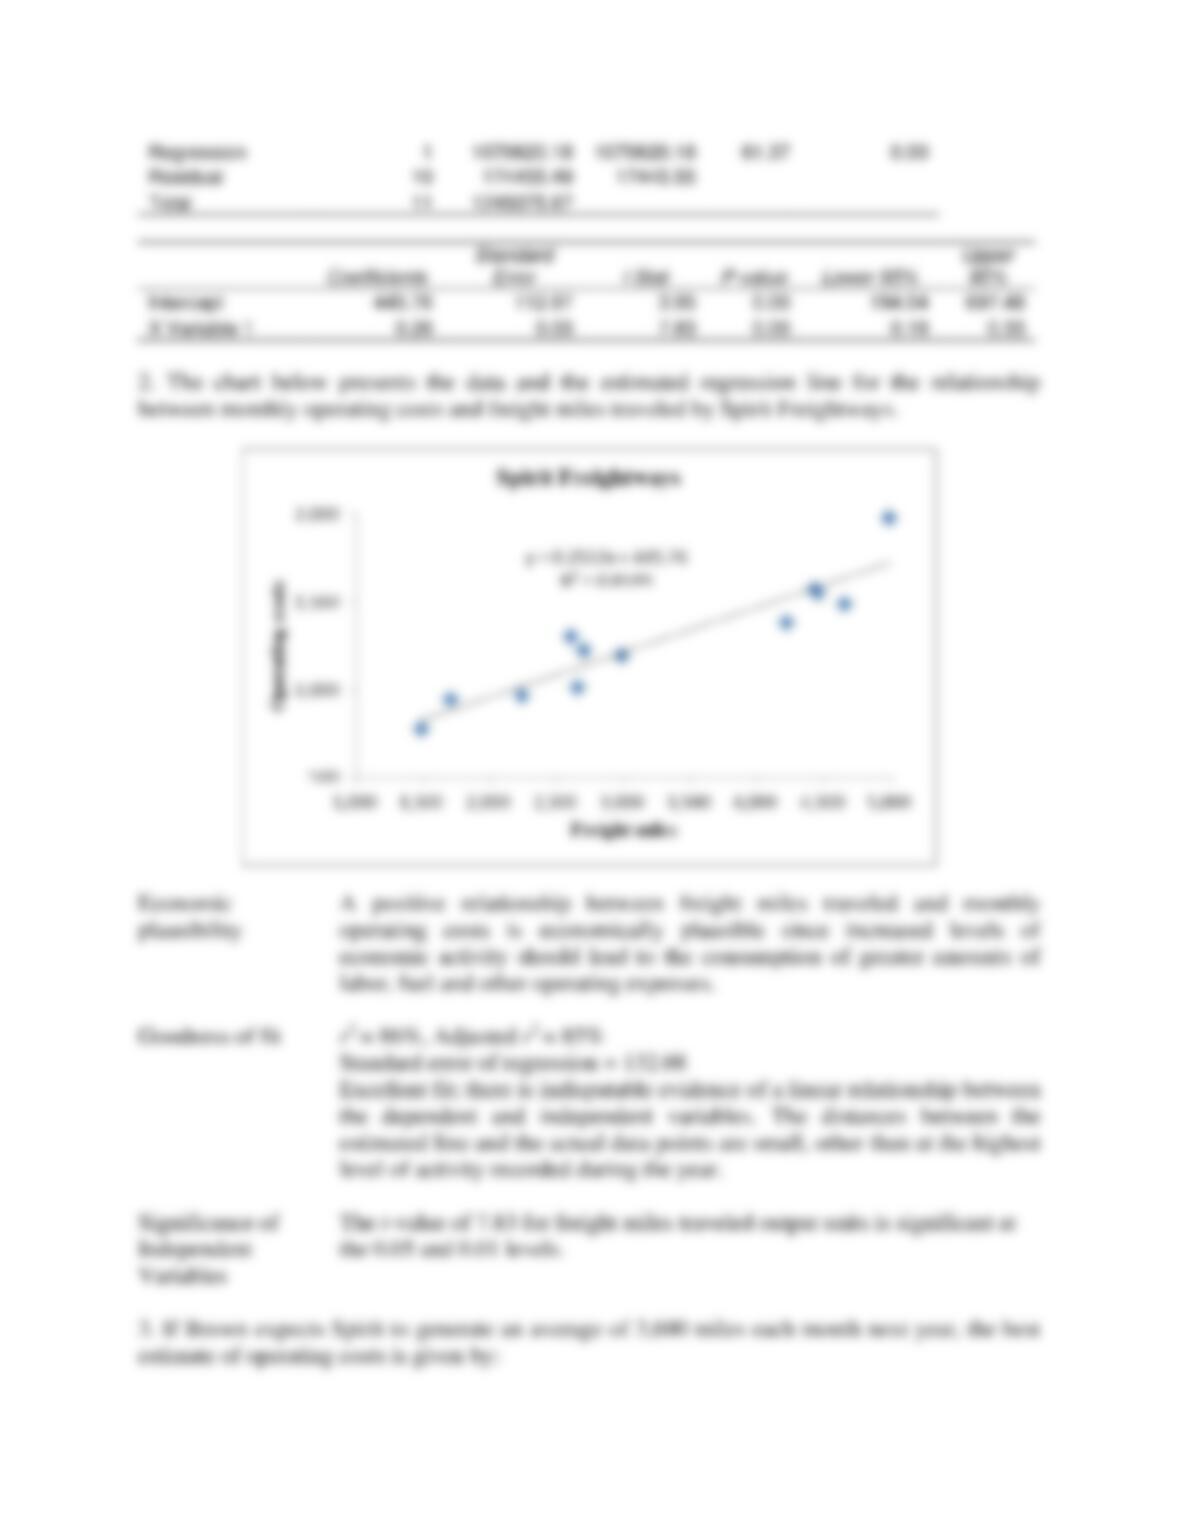
1. Conduct a regression using the monthly data of operating costs on freight miles. You should
obtain the following result:
10-44
2. Plot the data and regression line for the above estimation. Evaluate the regression using the
criteria of economic plausibility, goodness of fit, and slope of the regression line.
3. Brown expects Spirit to generate, on average, 3,600 freight miles each month next year. How
much in operating costs should Brown budget for next year?
4. Name three variables, other than freight miles, that Brown might expect to be important cost
drivers for Spirit’s operating costs.
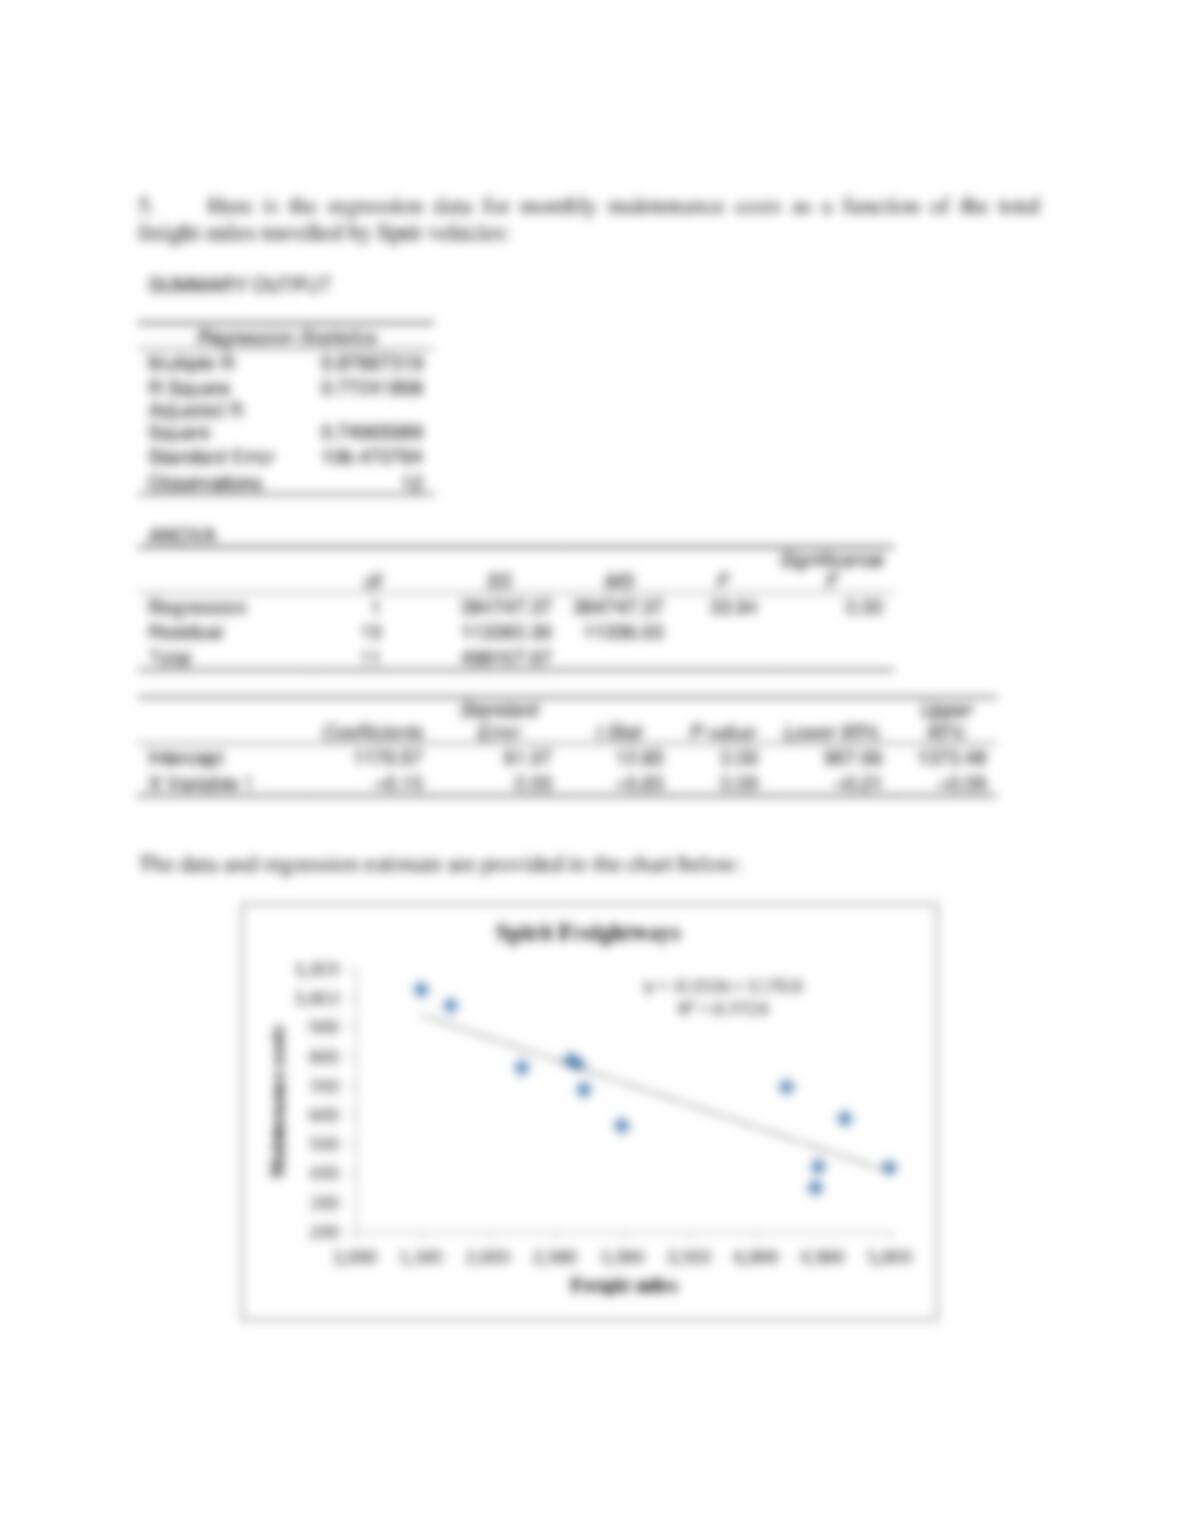
5. Brown next conducts a regression using the monthly data of maintenance costs on freight
miles. Verify that she obtained the following result:
6. Provide a reasoned explanation for the observed sign on the cost driver variable in the
maintenance cost regression. What alternative data or alternative regression specifications
would you like to use to better capture the above relationship?
SOLUTION
10-45
10-46
10-47
10-48
10-35 (30–40 min.) Cost estimation, cumulative average-time learning curve.
The Blue Seas Company, which is under contract to the U.S. Navy, assembles troop deployment
boats. As part of its research program, it completes the assembly of the first of a new model
(PT109) of deployment boats. The Navy is impressed with the PT109. It requests that Blue Seas
submit a proposal on the cost of producing another six PT109s.
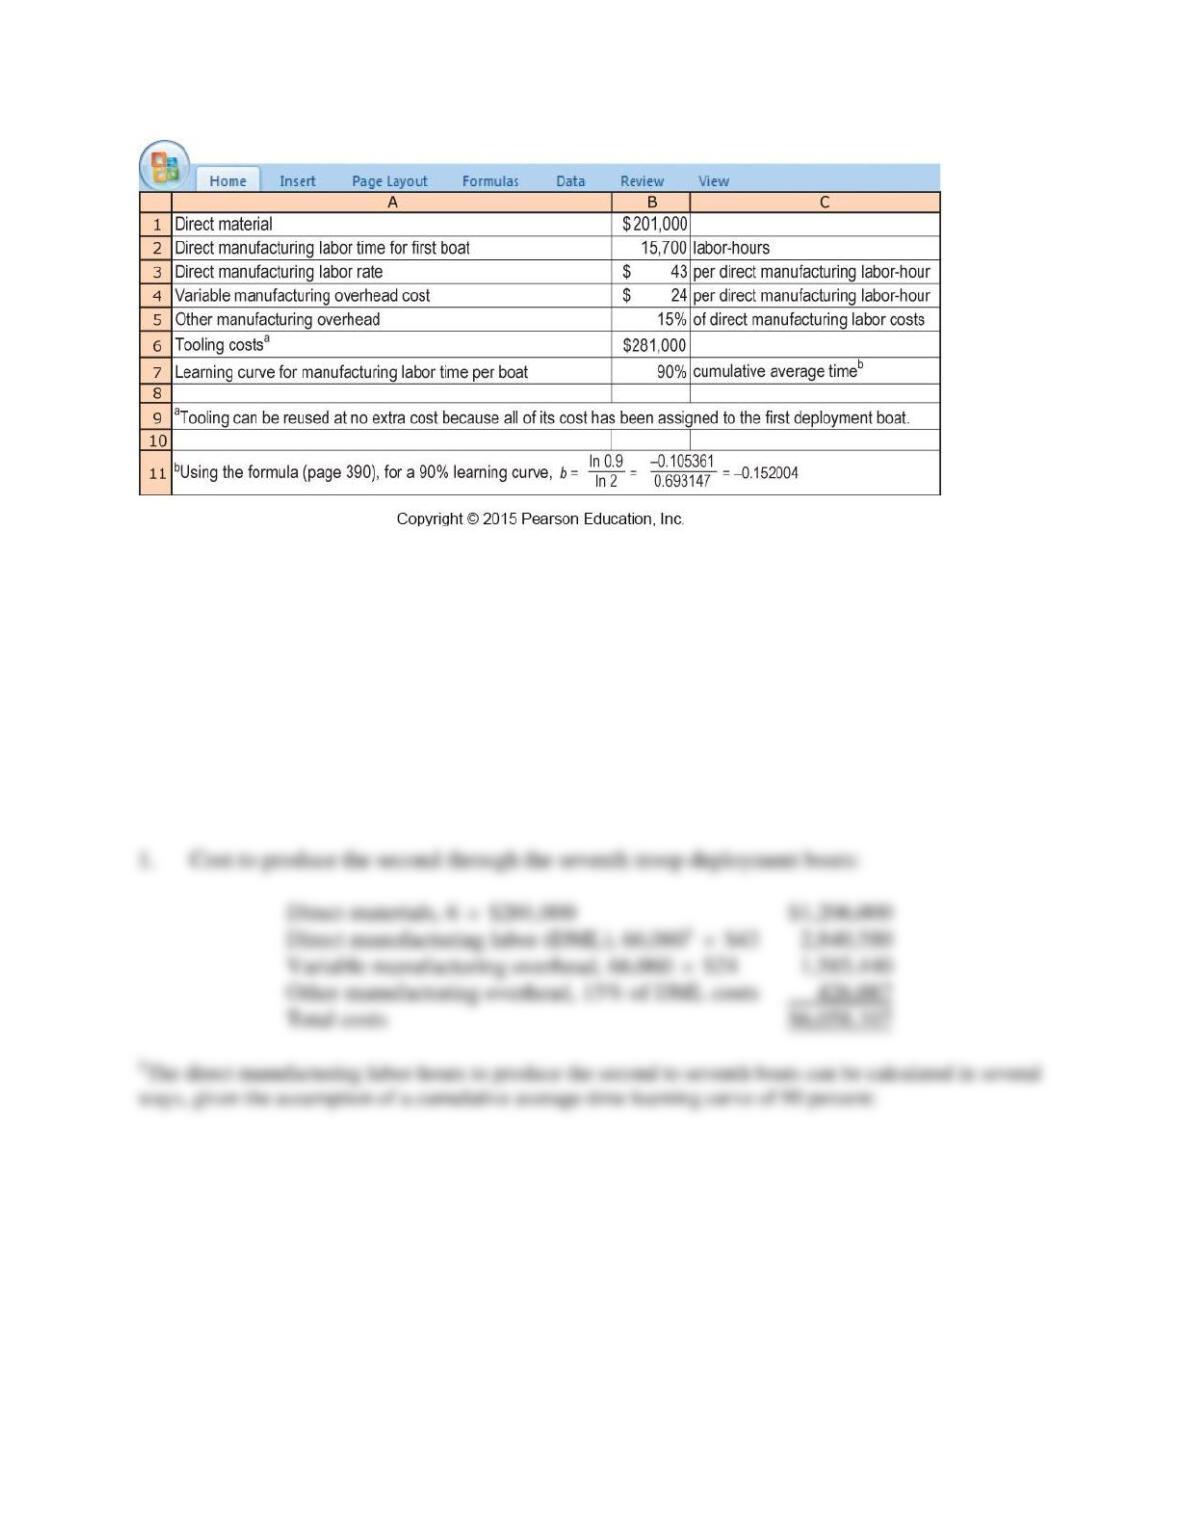
Blue Seas reports the following cost information for the first PT109 assembled and uses a
90% cumulative average-time learning model as a basis for forecasting direct manufacturing
labor-hours for the next six PT109s. (A 90% learning curve means b = -0.152004.)
10-49
Required:
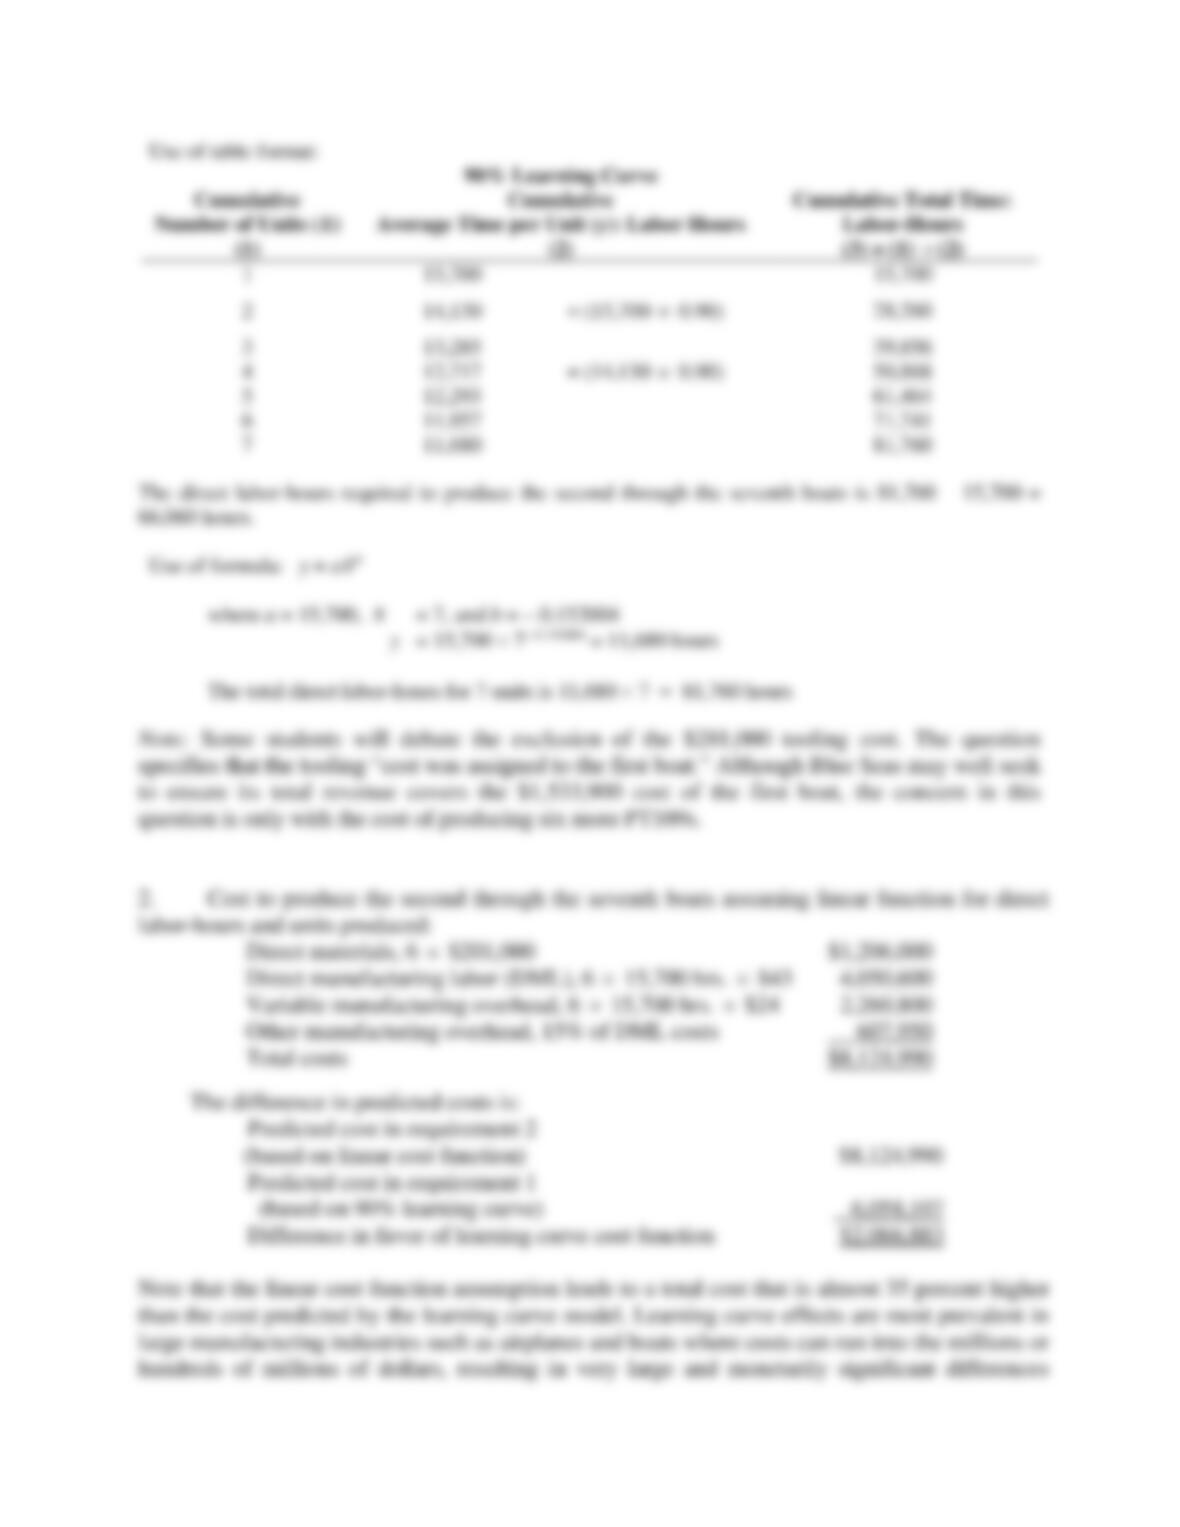
1. Calculate predicted total costs of producing the six PT109s for the Navy. (Blue Seas will
keep the first deployment boat assembled, costed at $1,533,900, as a demonstration model
for potential customers.)
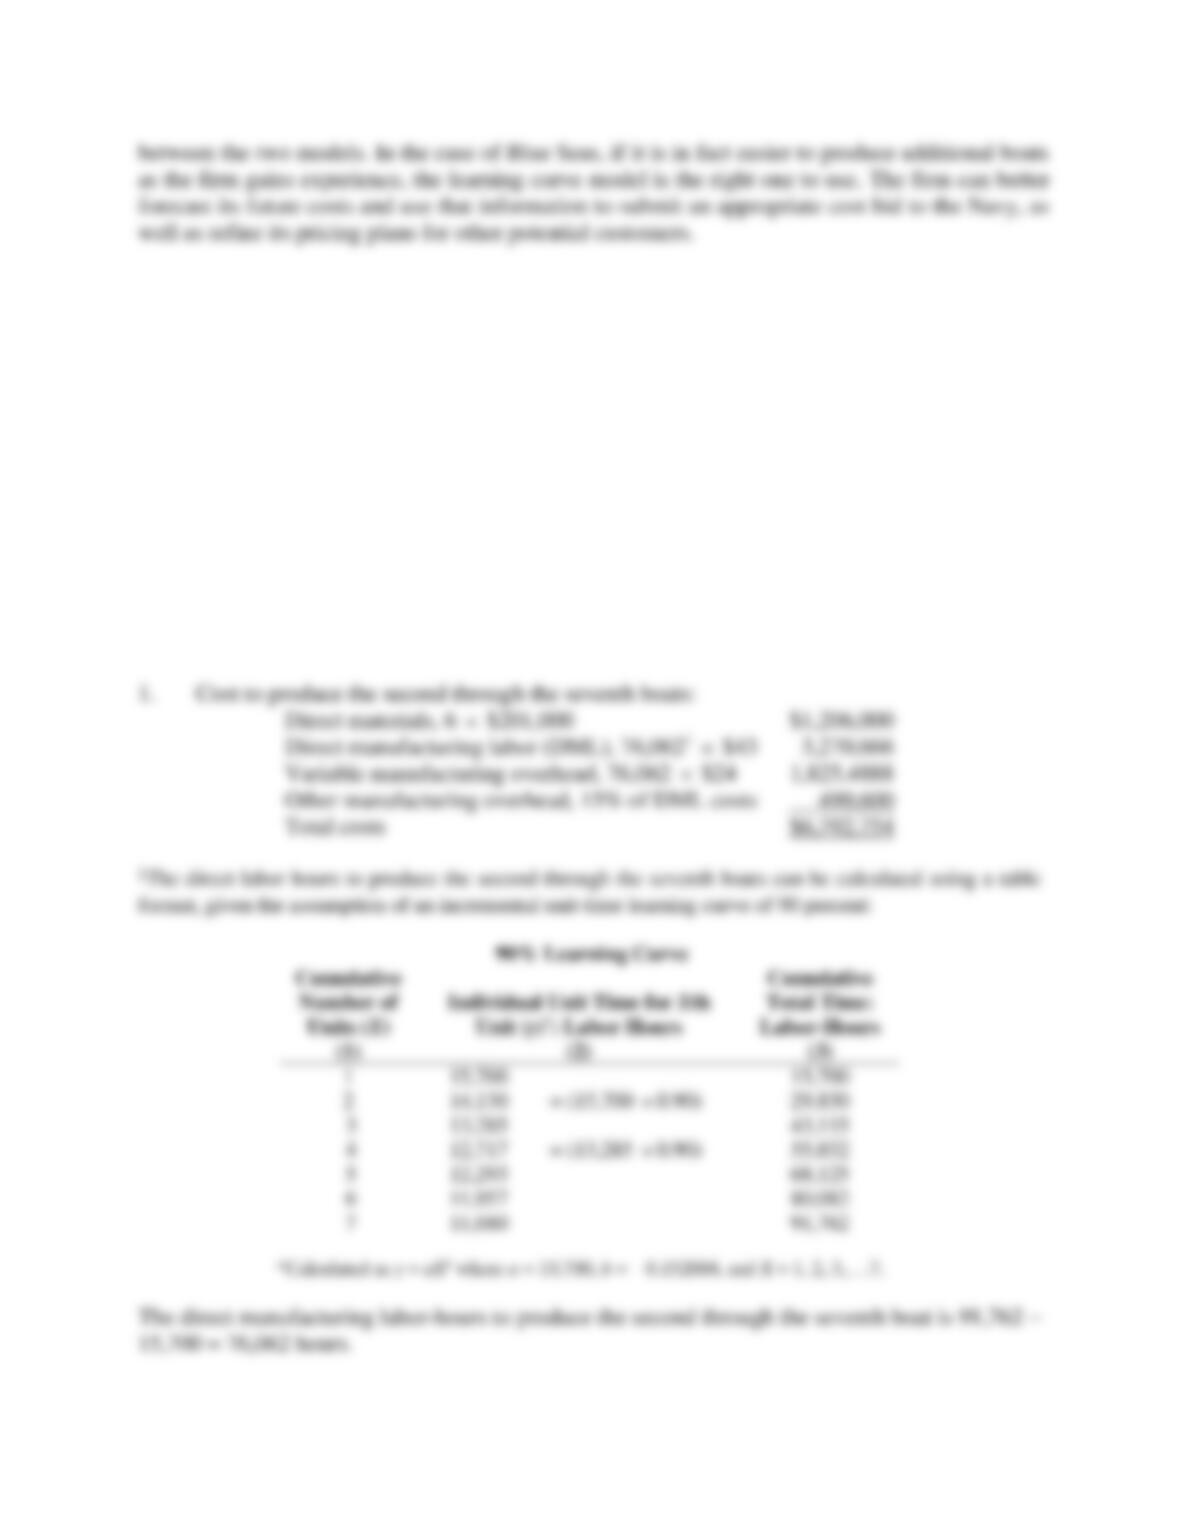
2. What is the dollar amount of the difference between (a) the predicted total costs for
producing the six PT109s in requirement 1 and (b) the predicted total costs for producing the
six PT109s, assuming that there is no learning curve for direct manufacturing labor? That is,
for (b) assume a linear function for units produced and direct manufacturing labor-hours.
SOLUTION
10-50
10-51
10-36 (20–30 min.) Cost estimation, incremental unit-time learning model.
Assume the same information for the Blue Seas Company as in Problem 10-35 with one
exception. This exception is that Blue Seas uses a 90% incremental unit-time learning model as a
basis for predicting direct manufacturing labor-hours in its assembling operations. (A 90%
learning curve means b = -0.152004.)
Required:
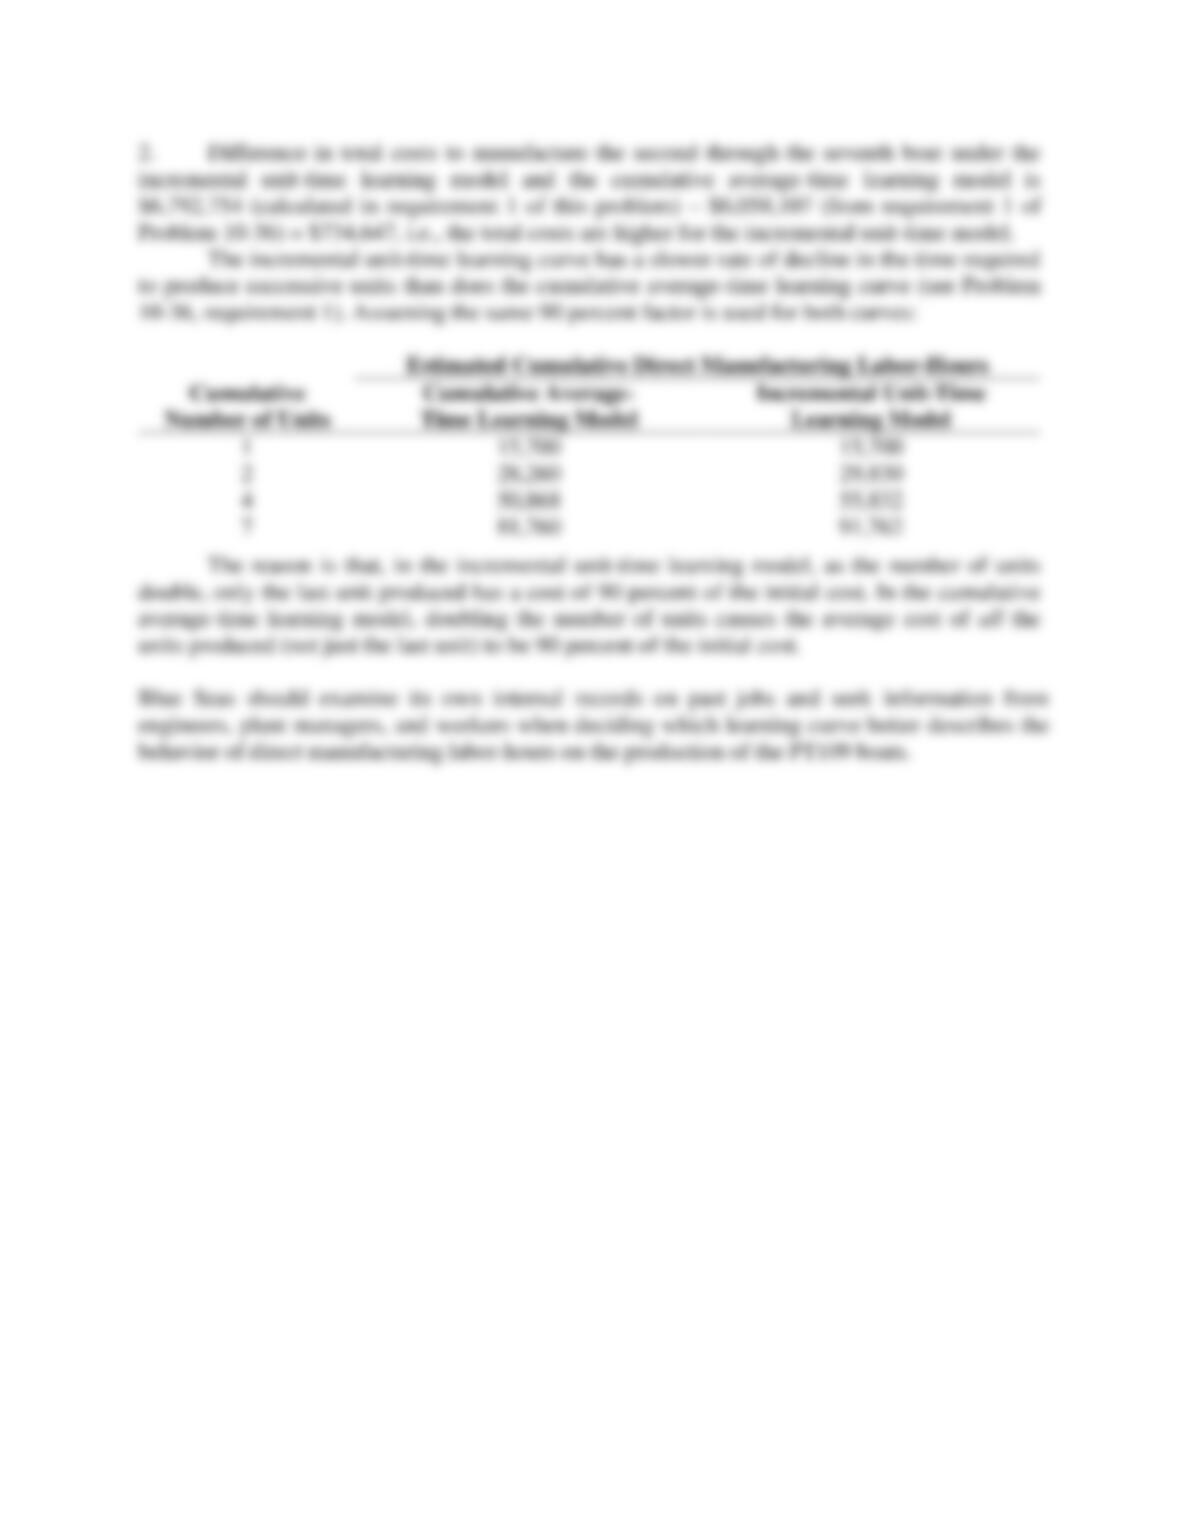
1. Prepare a prediction of the total costs for producing the six PT109s for the Navy.
2. If you solved requirement 1 of Problem 10-35, compare your cost prediction there with the
one you made here. Why are the predictions different? How should Blue Seas decide which
model it should use?
SOLUTION
10-52
10-37 (30 min.) Regression; choosing among models.
Apollo Hospital specializes in outpatient surgeries for relatively minor procedures. Apollo is a
nonprofit institution and places great emphasis on controlling costs in order to provide services
to the community in an efficient manner.
Apollo’s CFO, Julie Chen, has been concerned of late about the hospital’s consumption of
medical supplies. To better understand the behavior of this cost, Julie consults with Rhett Bratt,
the person responsible for Apollo’s cost system. After some discussion, Julie and Rhett conclude
that there are two potential cost drivers for the hospital’s medical supplies costs. The first driver
is the total number of procedures performed. The second is the number of patient-hours
generated by Apollo. Julie and Rhett view the latter as a potentially better cost driver because the
hospital does perform a variety of procedures, some more complex than others.
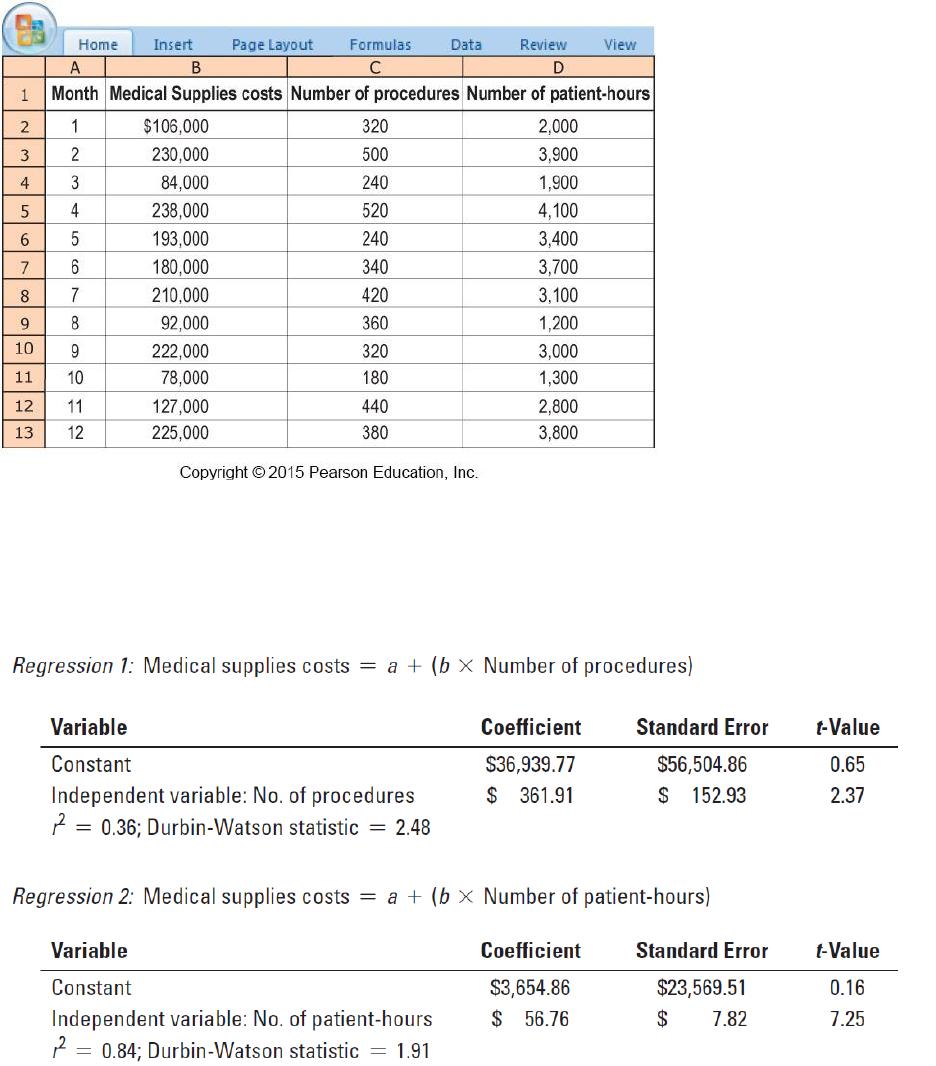
Rhett provides the following data relating to the past year to Julie.
10-53
Required:
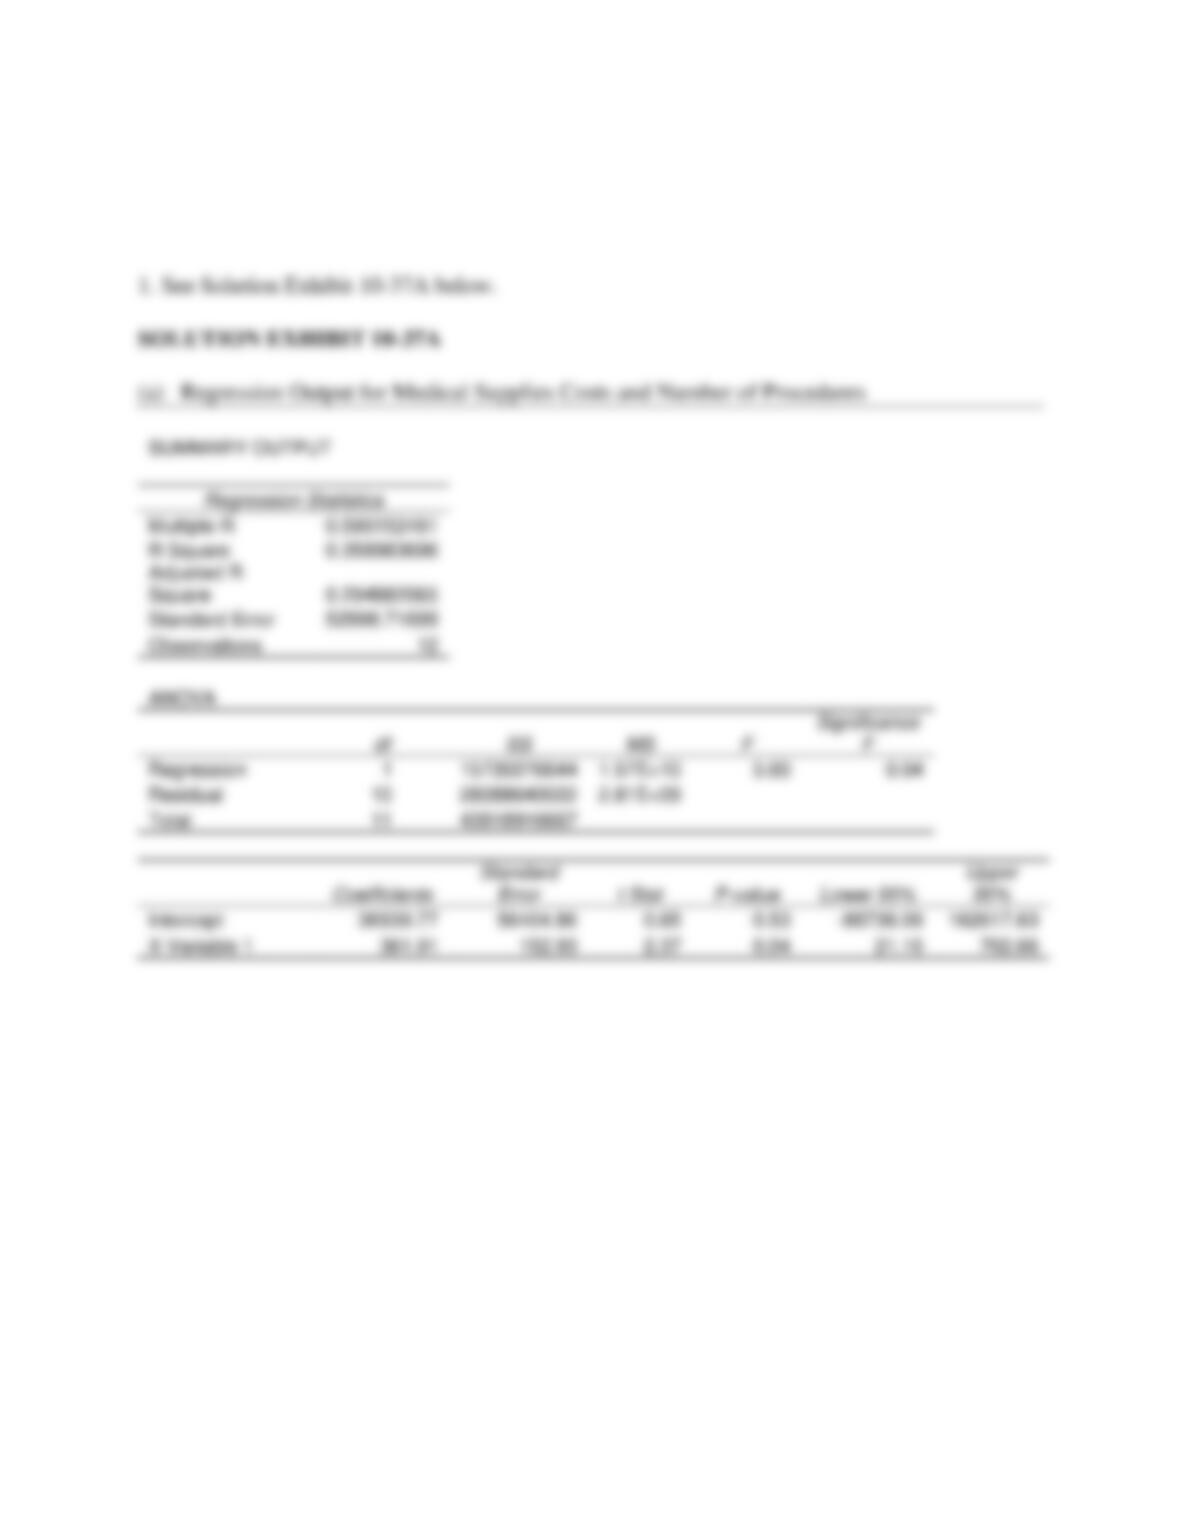
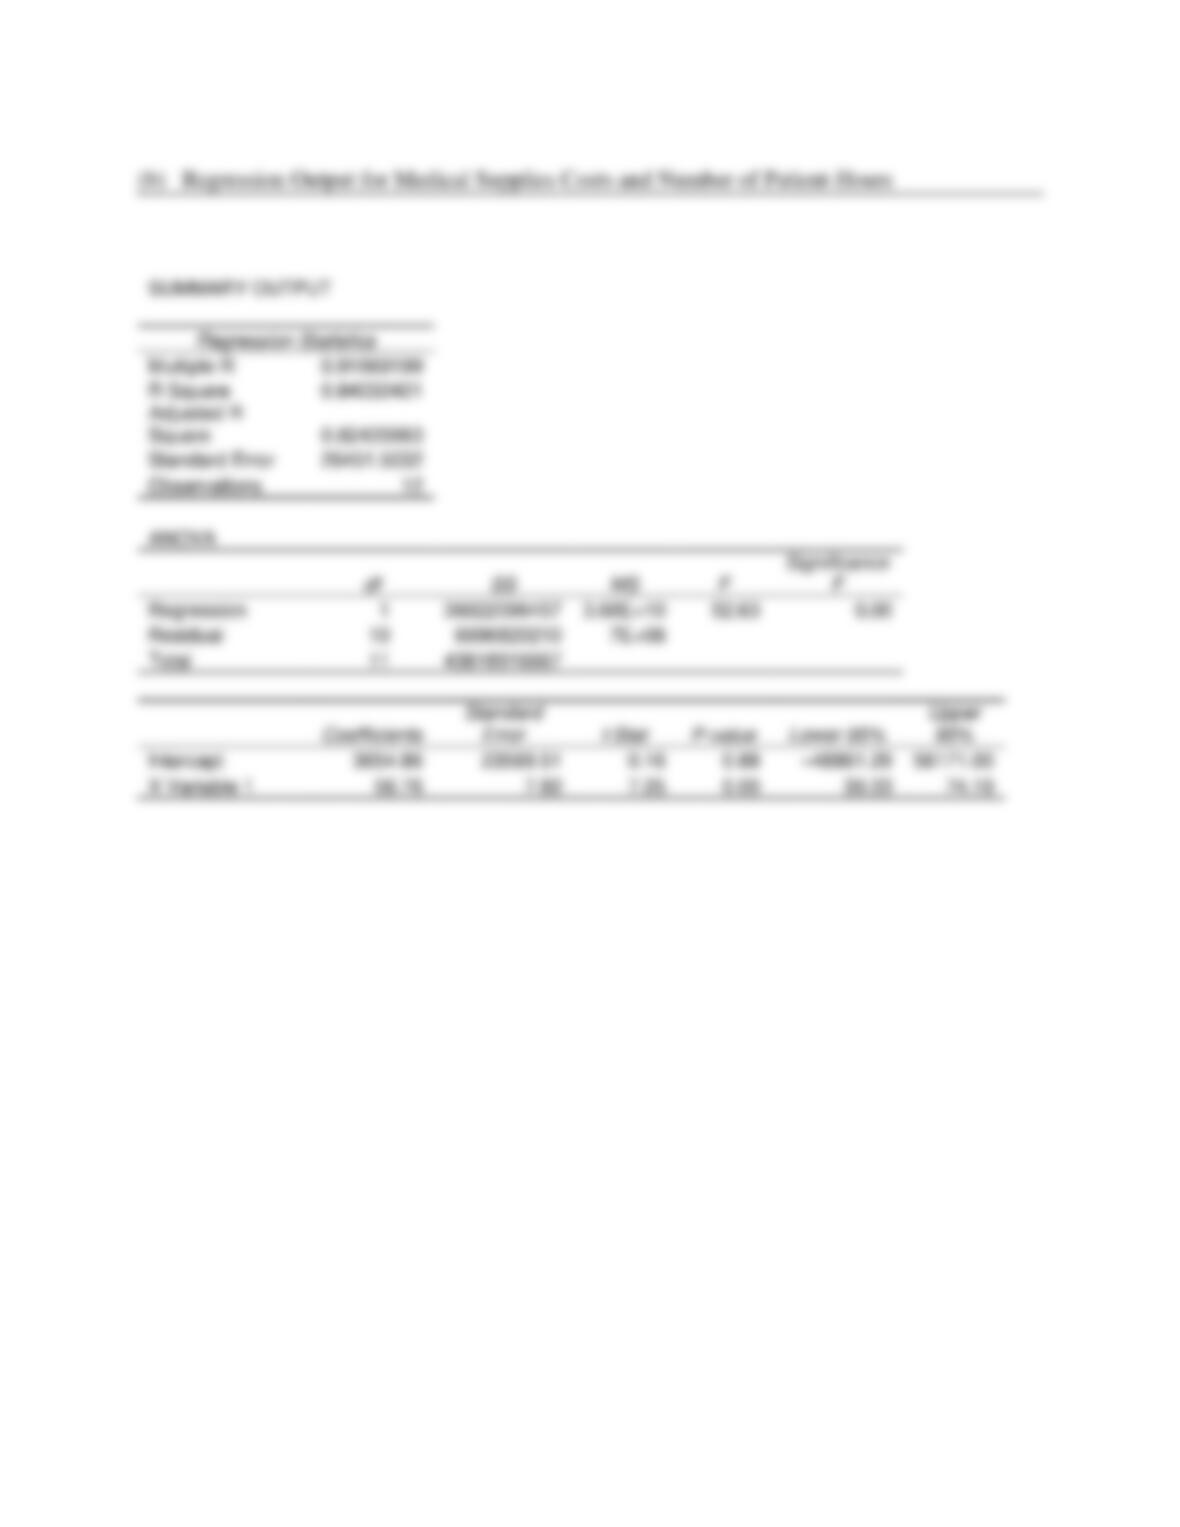
1. Estimate the regression equation for (a) medical supplies costs and number of procedures and
(b) medical supplies costs and number of patient-hours. You should obtain the following
results:
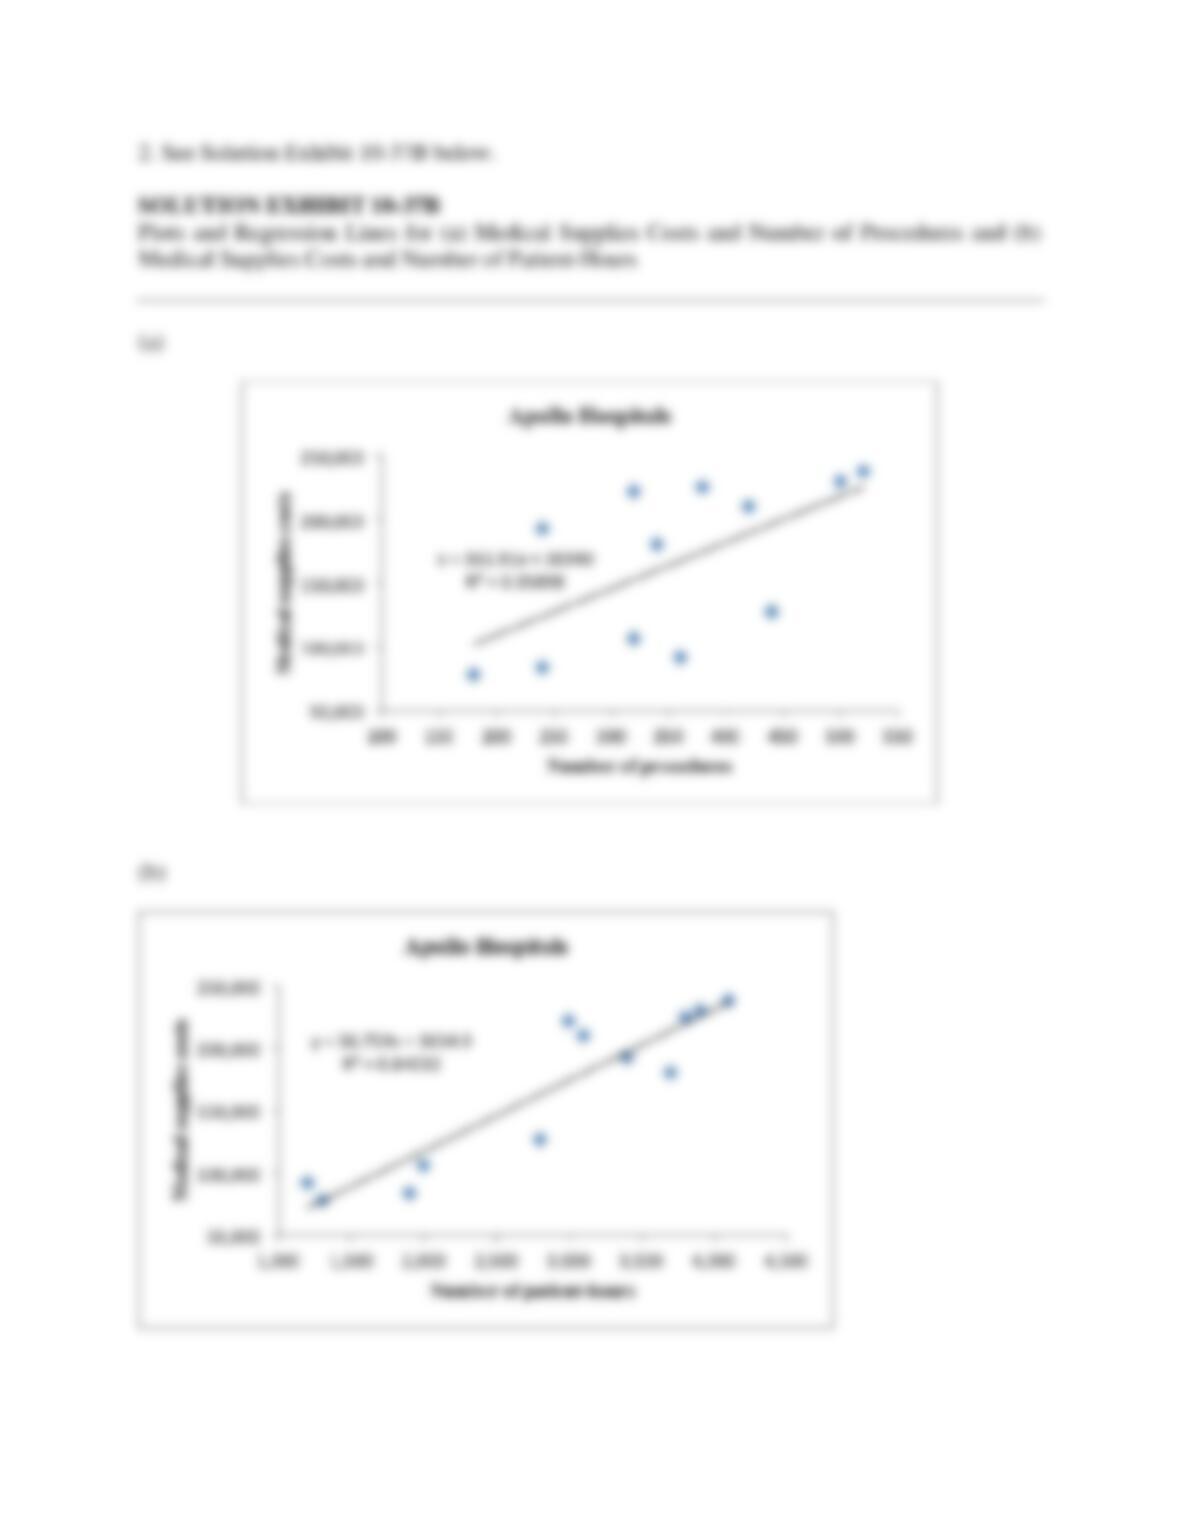
2. On different graphs plot the data and the regression lines for each of the following cost
functions:
a. Medical supplies costs = a + (b × Number of procedures)
b. Medical supplies costs = a + (b × Number of patient-hours)
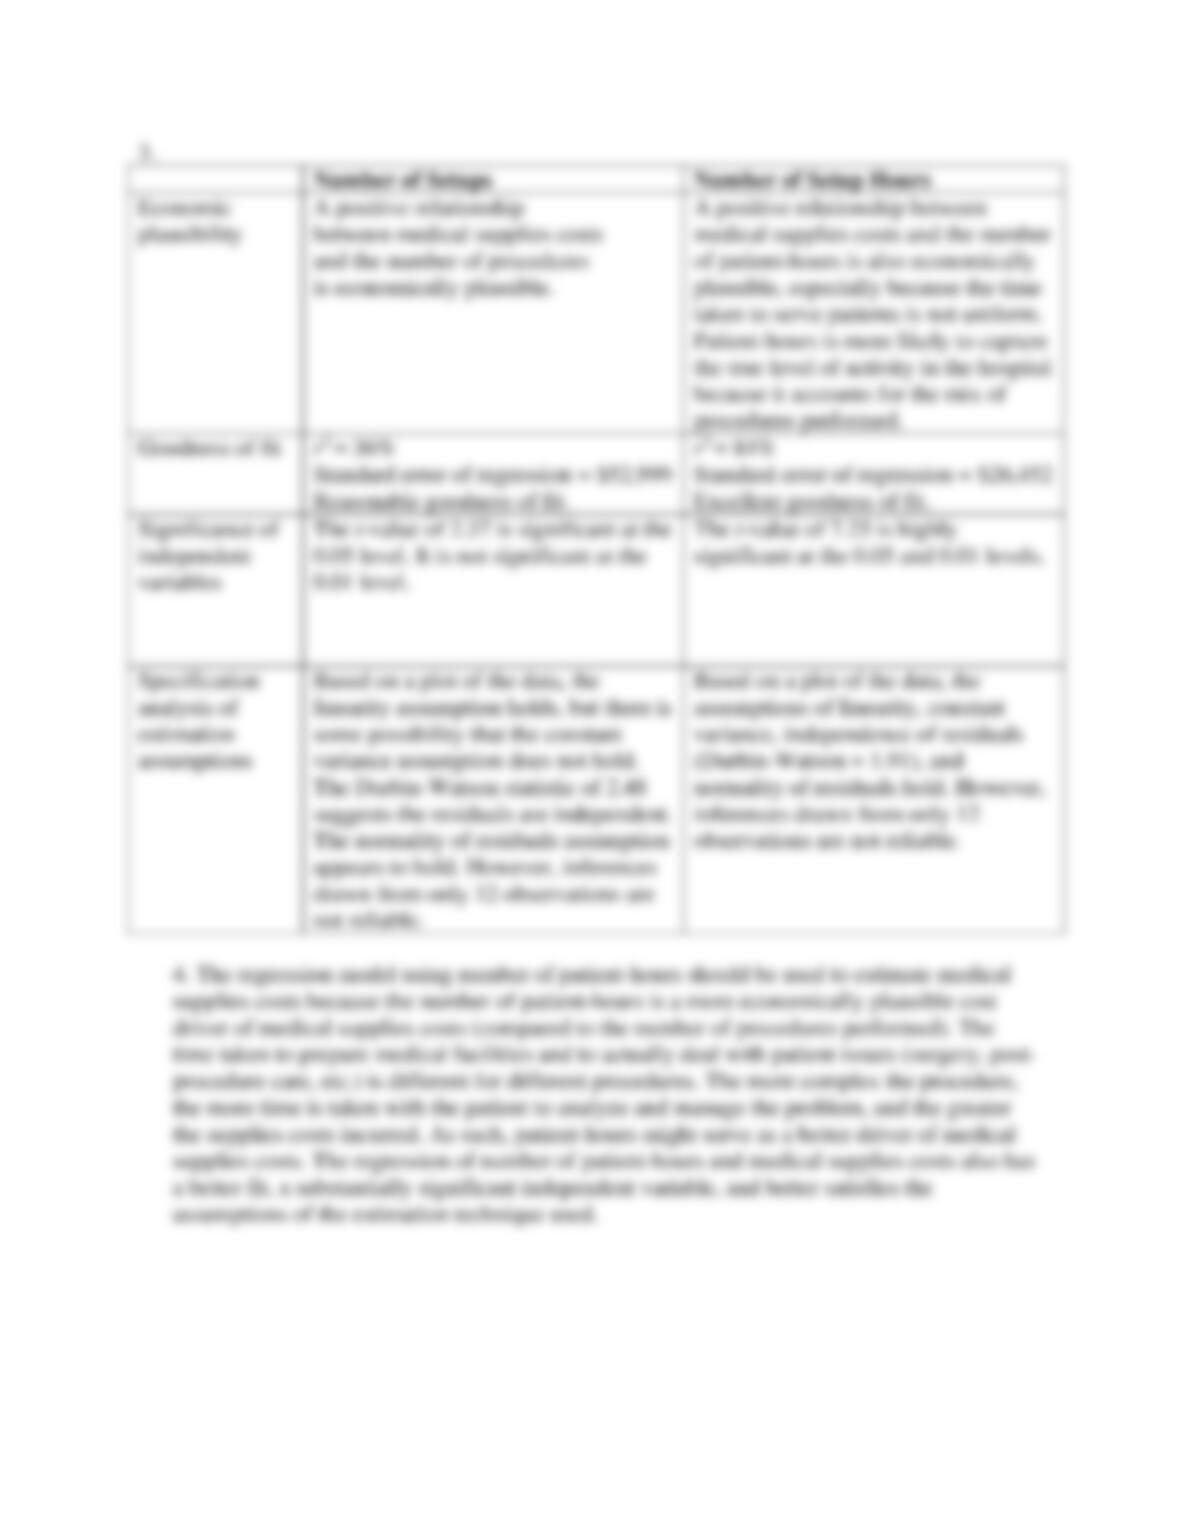
3. Evaluate the regression models for “Number of procedures” and “Number of patient–hours”
as the cost driver according to the format of Exhibit 10-18 (page 404).
10-54
4. Based on your analysis, which cost driver should Julie Chen adopt for Apollo Hospital?
Explain your answer.
SOLUTION
10-55
10-56
10-57
10-58
10-38 (30 min.) Multiple regression (continuation of 10-37).
After further discussion, Julie and Rhett wonder if they should view both the number of
procedures and number of patient-hours as cost drivers in a multiple regression estimation in
order to best understand Apollo’s medical supplies costs.
Required:
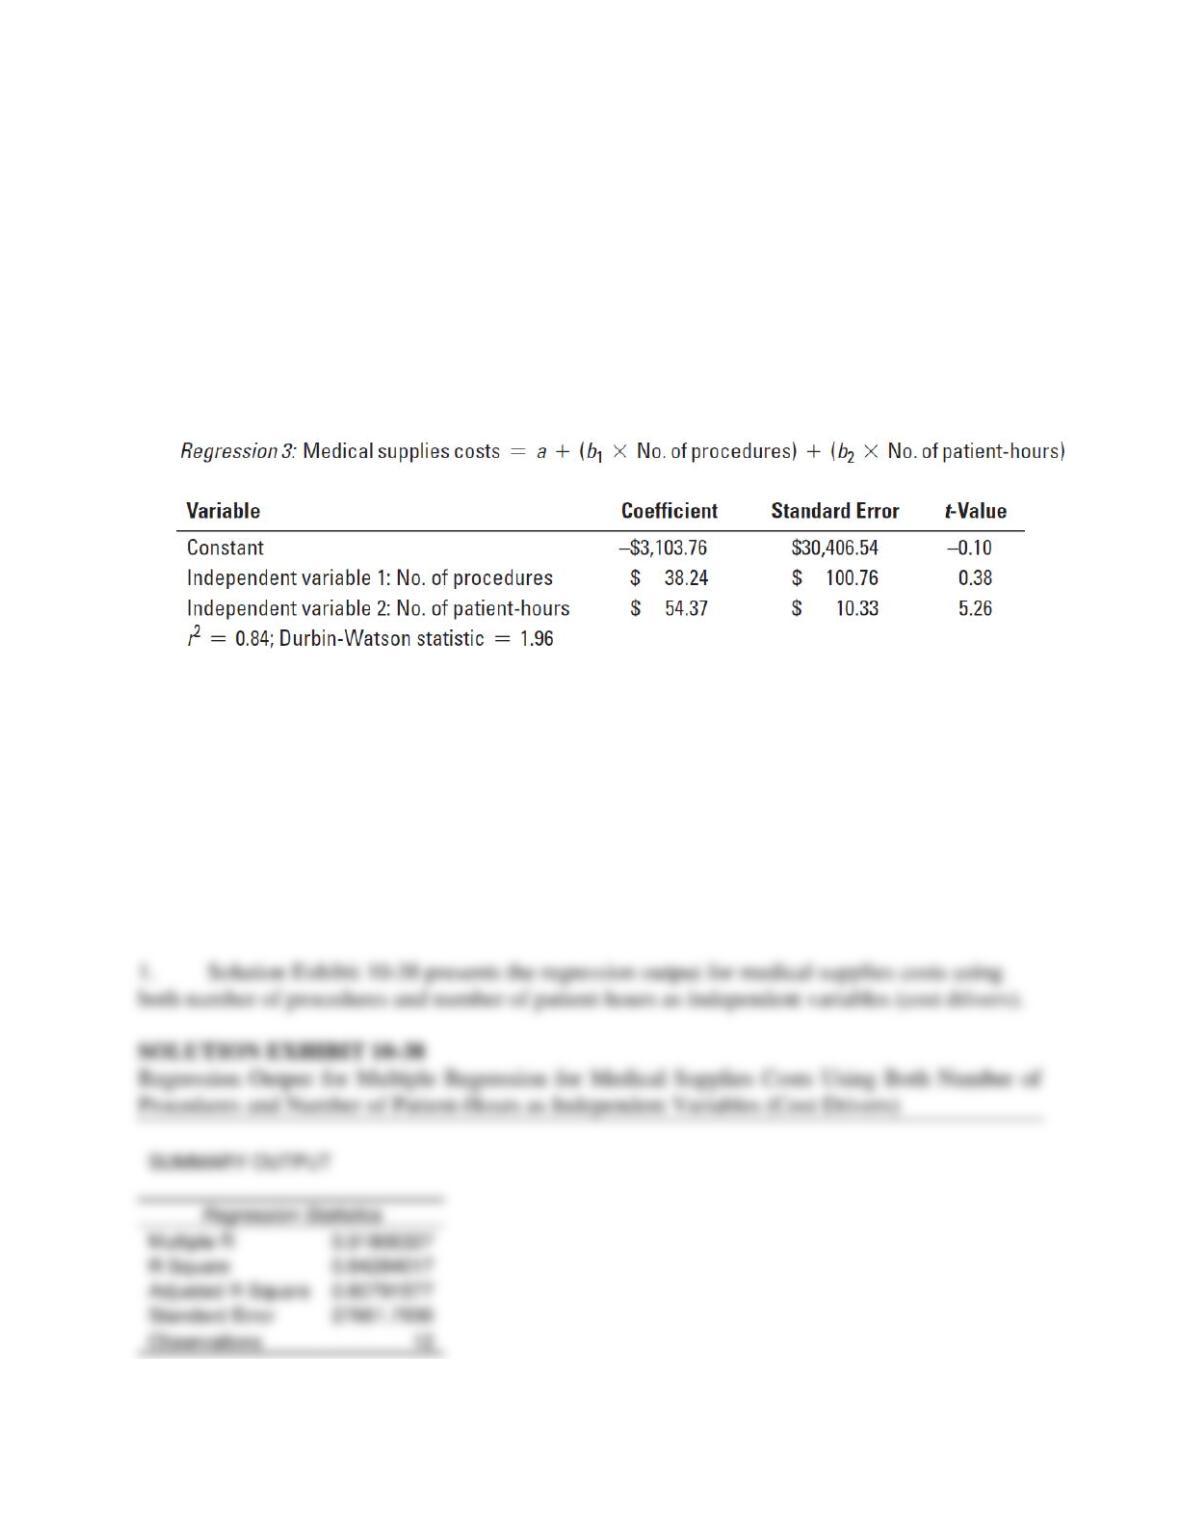
1. Conduct a multiple regression to estimate the regression equation for medical supplies costs
using both number of procedures and number of patient-hours as independent variables. You
should obtain the following result:
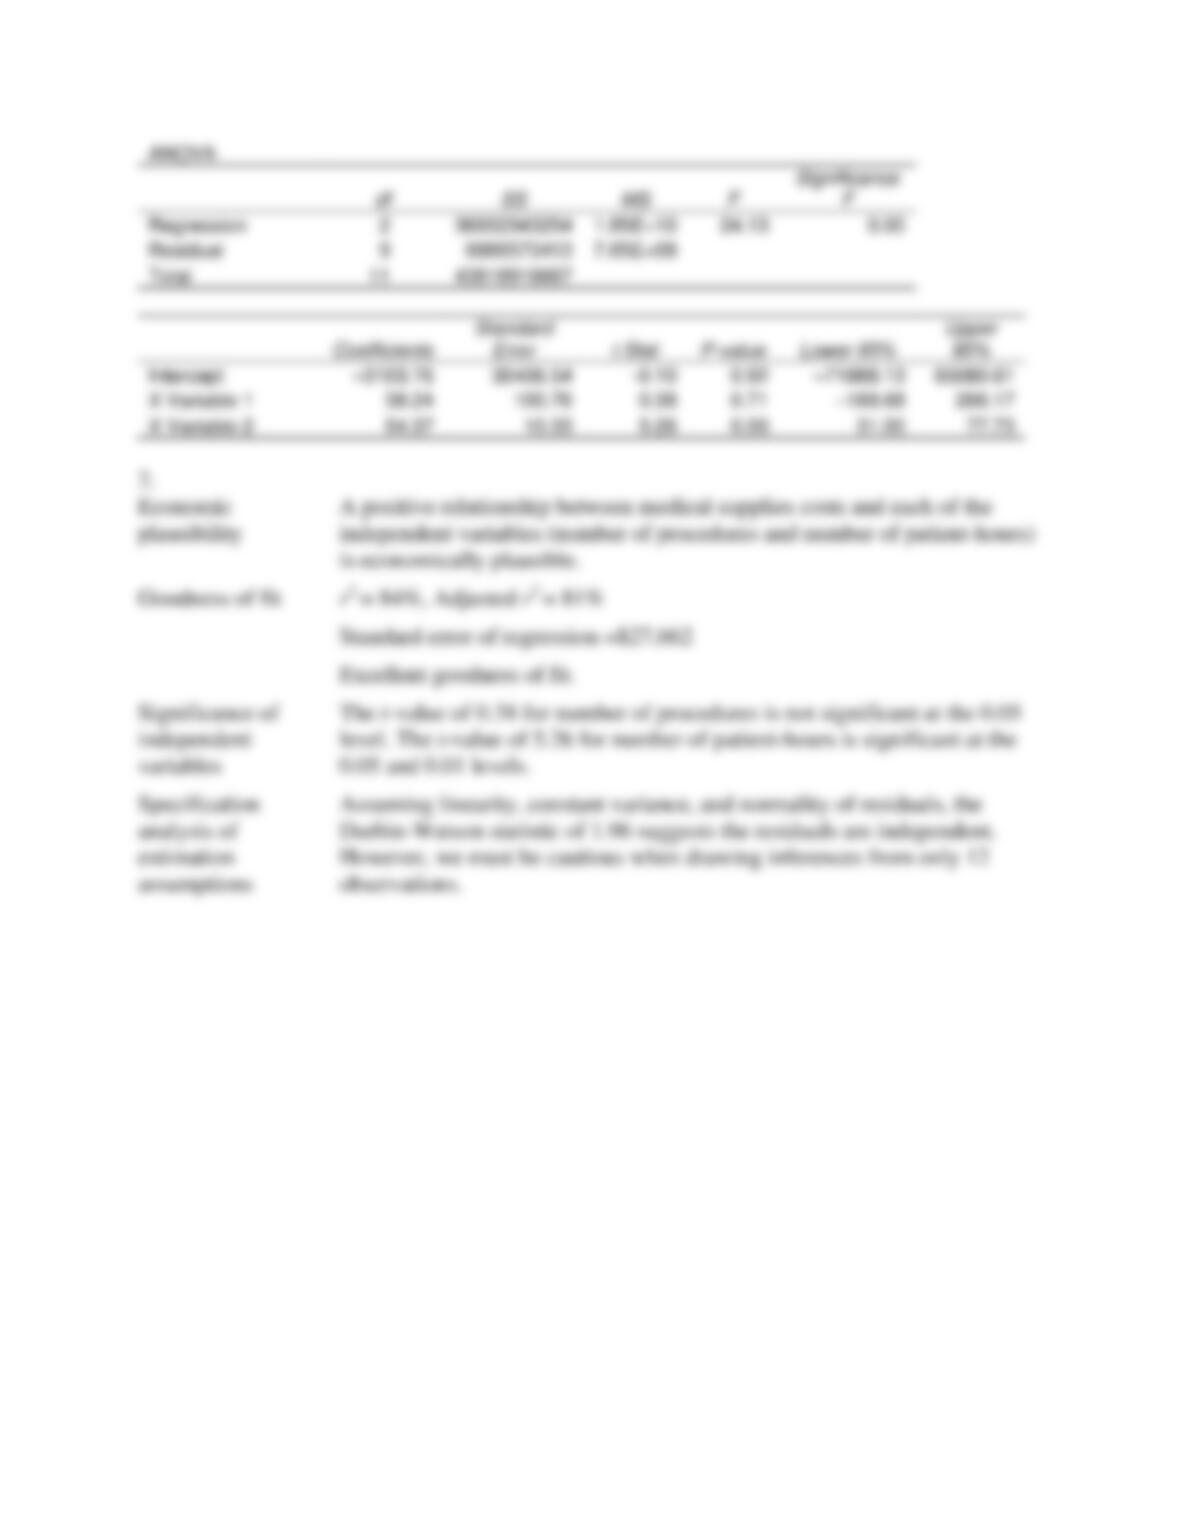
2. Evaluate the multiple regression output using the criteria of economic plausibility goodness
of fit, significance of independent variables, and specification of estimation assumptions.
3. What potential issues could arise in multiple regression analysis that are not present in simple
regression models? Is there evidence of such difficulties in the multiple regression presented
in this problem? Explain.
4. Which of the regression models from Problems 10-37 and 10-38 would you recommend Julie
Chen use? Explain.
SOLUTION
10-59
10-60
10-39 (30 min.) Cost estimation.
Hankuk Electronics started production on a sophisticated new smartphone running the Android
operating system in January 2013. Given the razor-thin margins in the consumer electronics
industry, Hankuk’s success depends heavily on being able to produce the phone as economically
as possible.
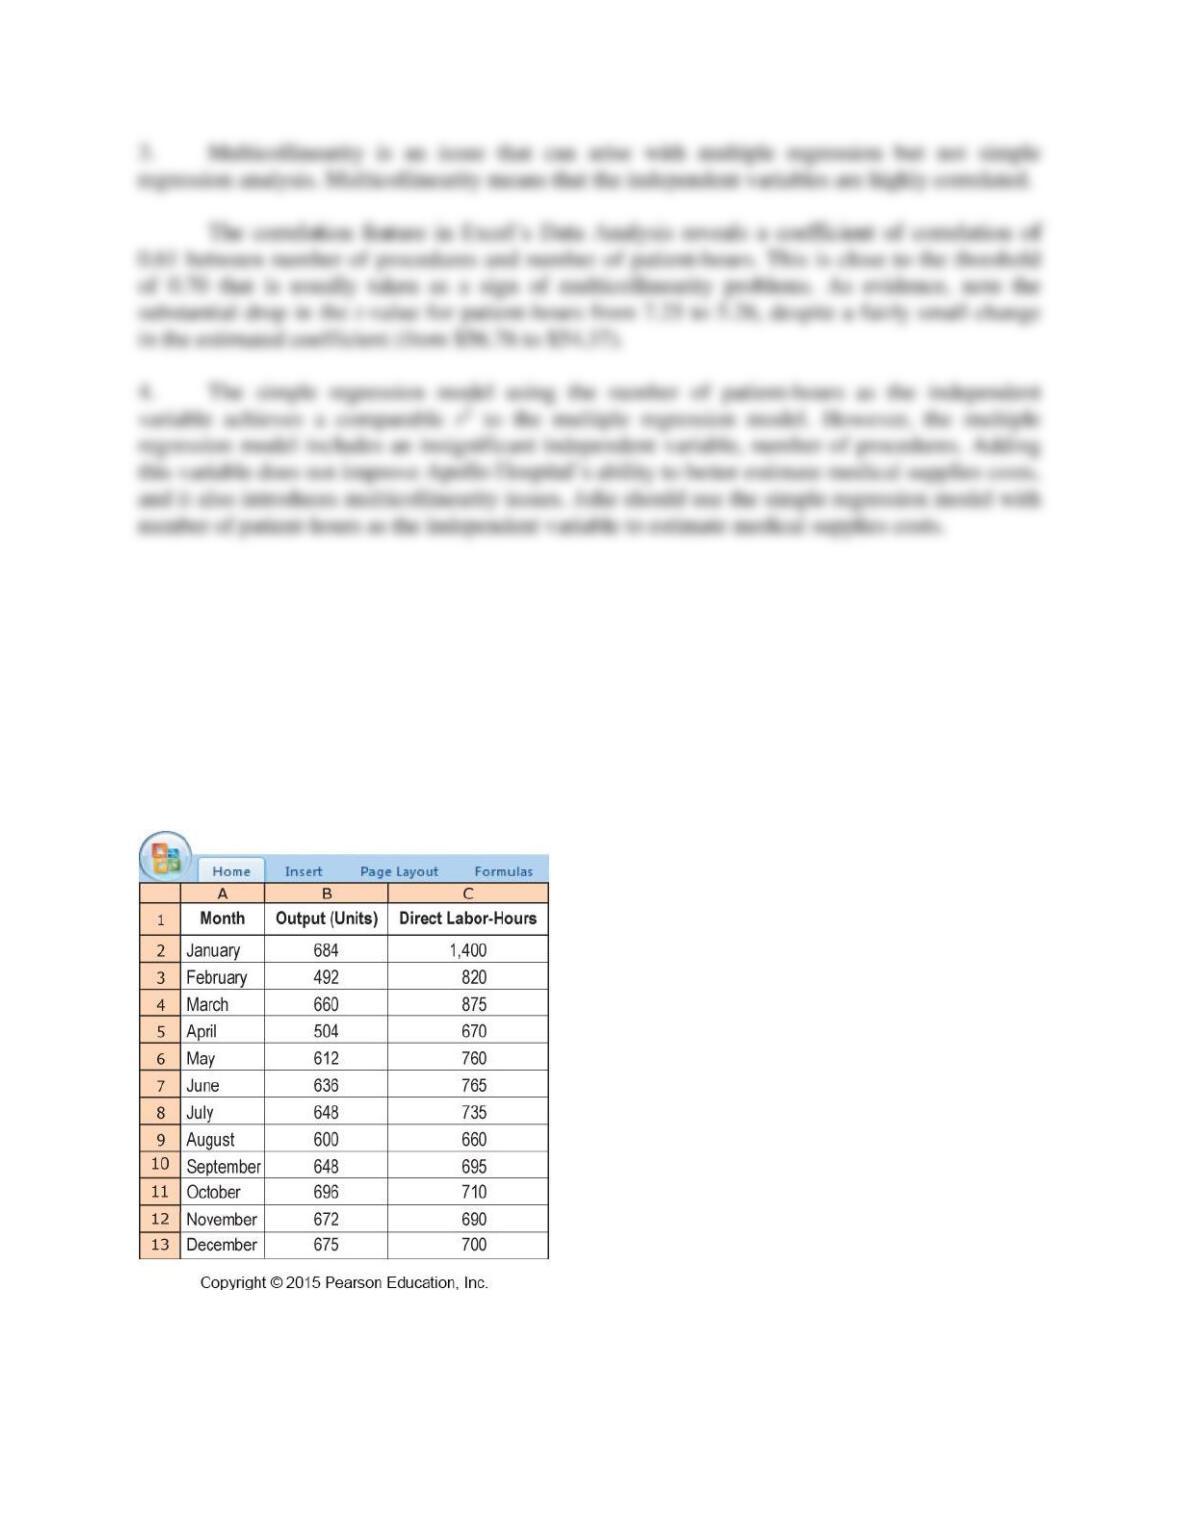
At the end of the first year of production, Hankuk’s controller, Inbee Kim, gathered data on
its monthly levels of output, as well as monthly consumption of direct labor-hours (DLH). Inbee
views labor-hours as the key driver of Hankuk’s direct and overhead costs. The information
collected by Inbee is provided below:
Required: