Name:
Section:
Score:
Key Code:
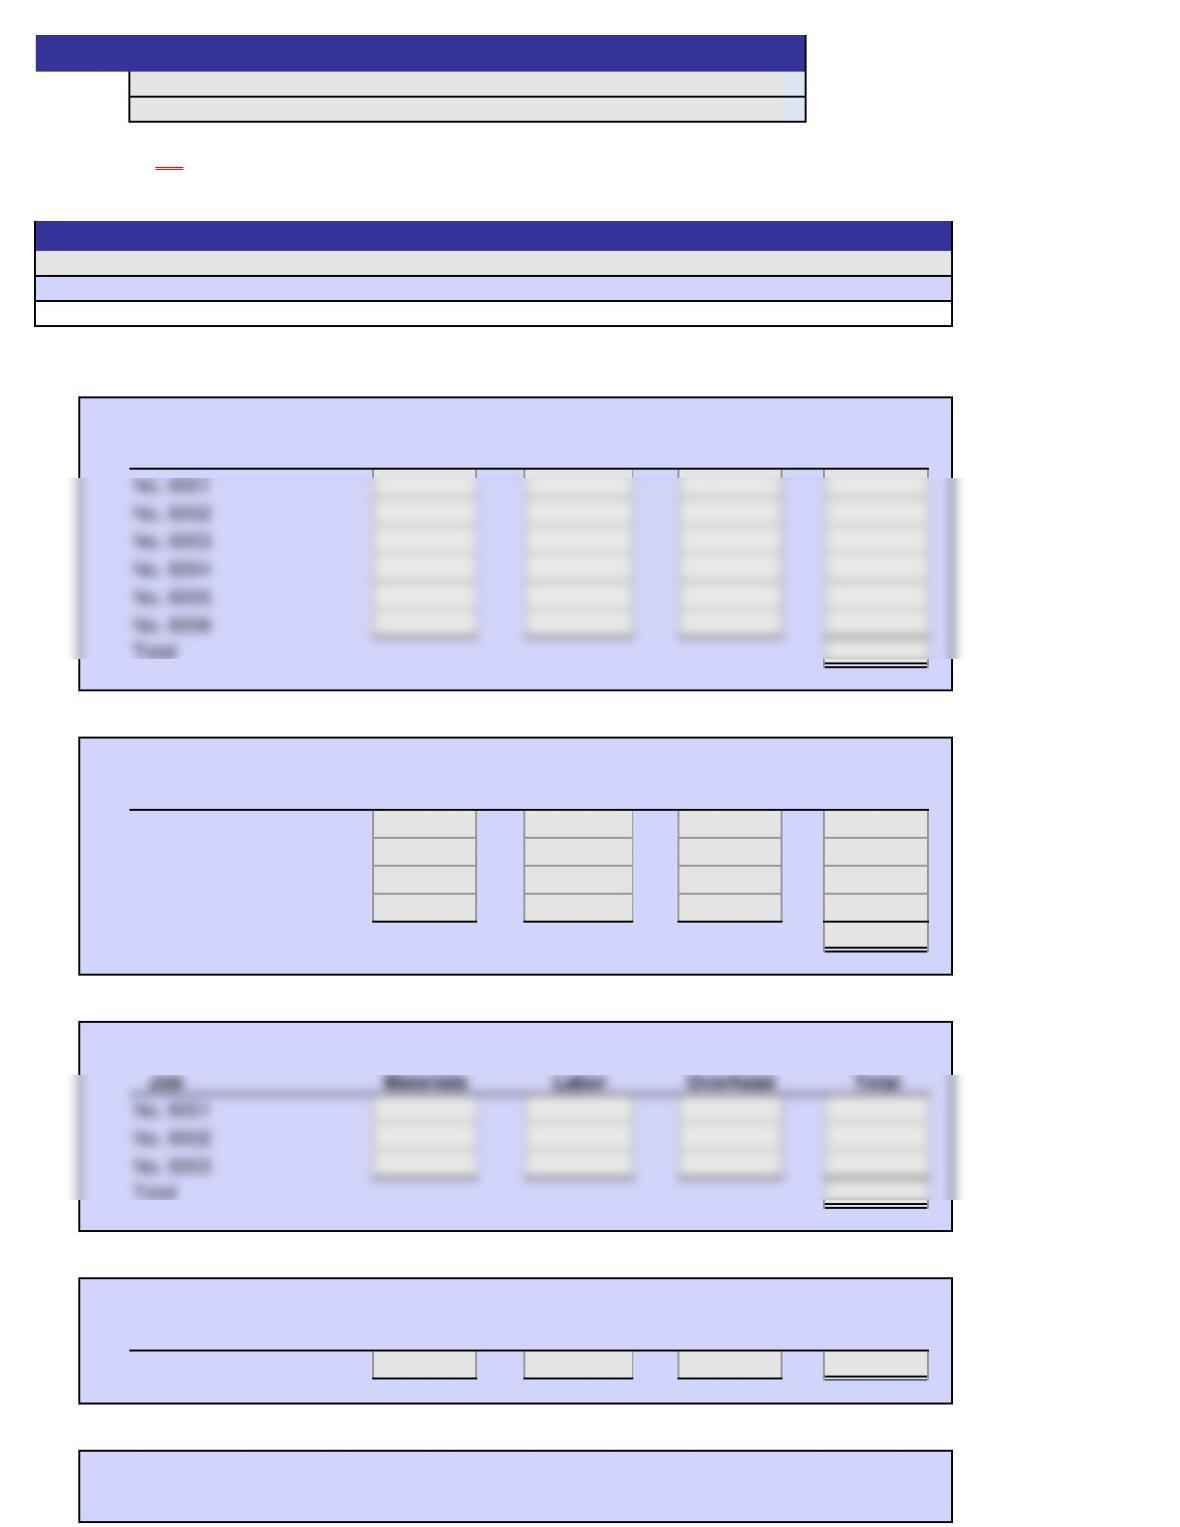
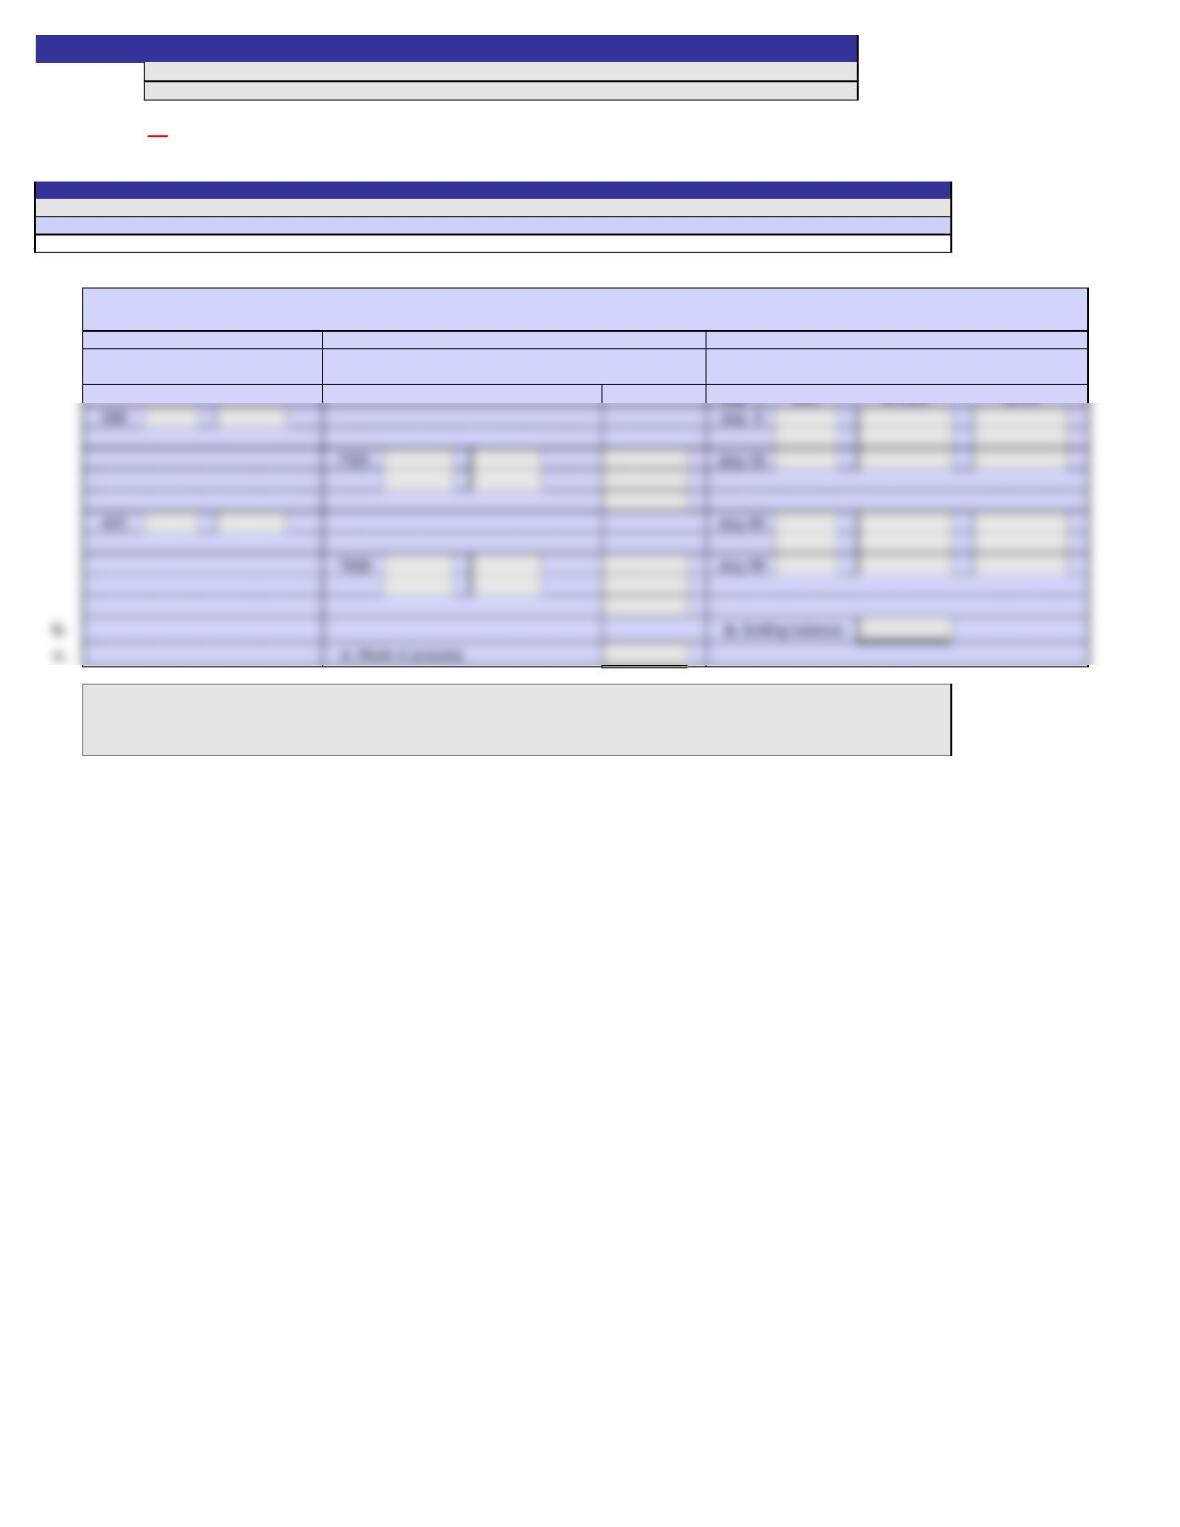
1. Schedule of manufacturing costs incurred during June:
Direct Direct Factory
Materials Labor Overhead Total
2. Schedule of cost of jobs finished during June:
Direct Direct Factory
Materials Labor Overhead Total
No. 6001
No. 6002
No. 6003
No. 6005
Total
3. Schedule of cost of goods sold during June:
Direct Direct Factory
Materials Labor Overhead Total
Job
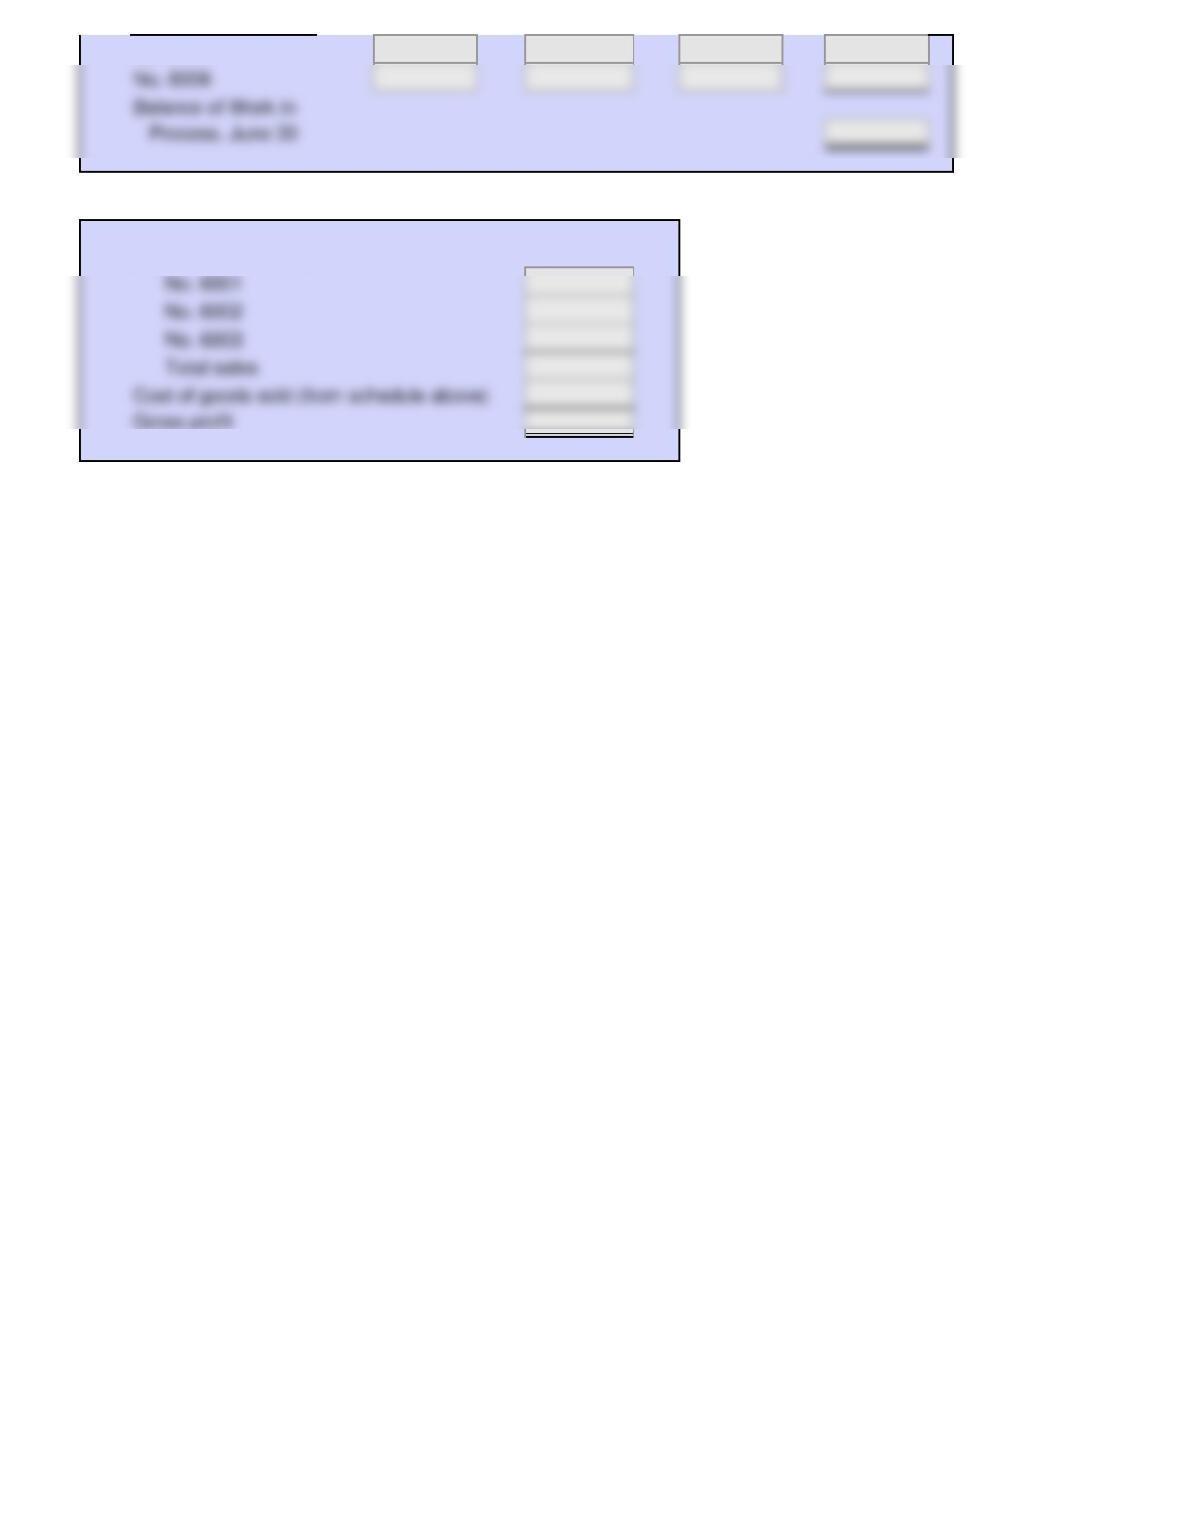
4. Schedule of completed jobs on hand, June 30, 2012:
Direct Direct Factory
Materials Labor Overhead Total
No. 6005
5. Schedule of unfinished jobs:
Direct Direct Factory
Materials Labor Overhead Total
Job
0%
Job
Job
Job
A red asterisk (*) will appear in the row immediately to the right of an incorrect answer.
Answers are entered in the cells with gray backgrounds.
Problem 10-2
Instructions
2
Cells with non-gray backgrounds are protected and cannot be edited.
No. 6004
6. Gross profit for June based upon the jobs sold:
Jobs shipped and billed:
Name:
Section:
Score: See student sheet for student’s score
Scoring:
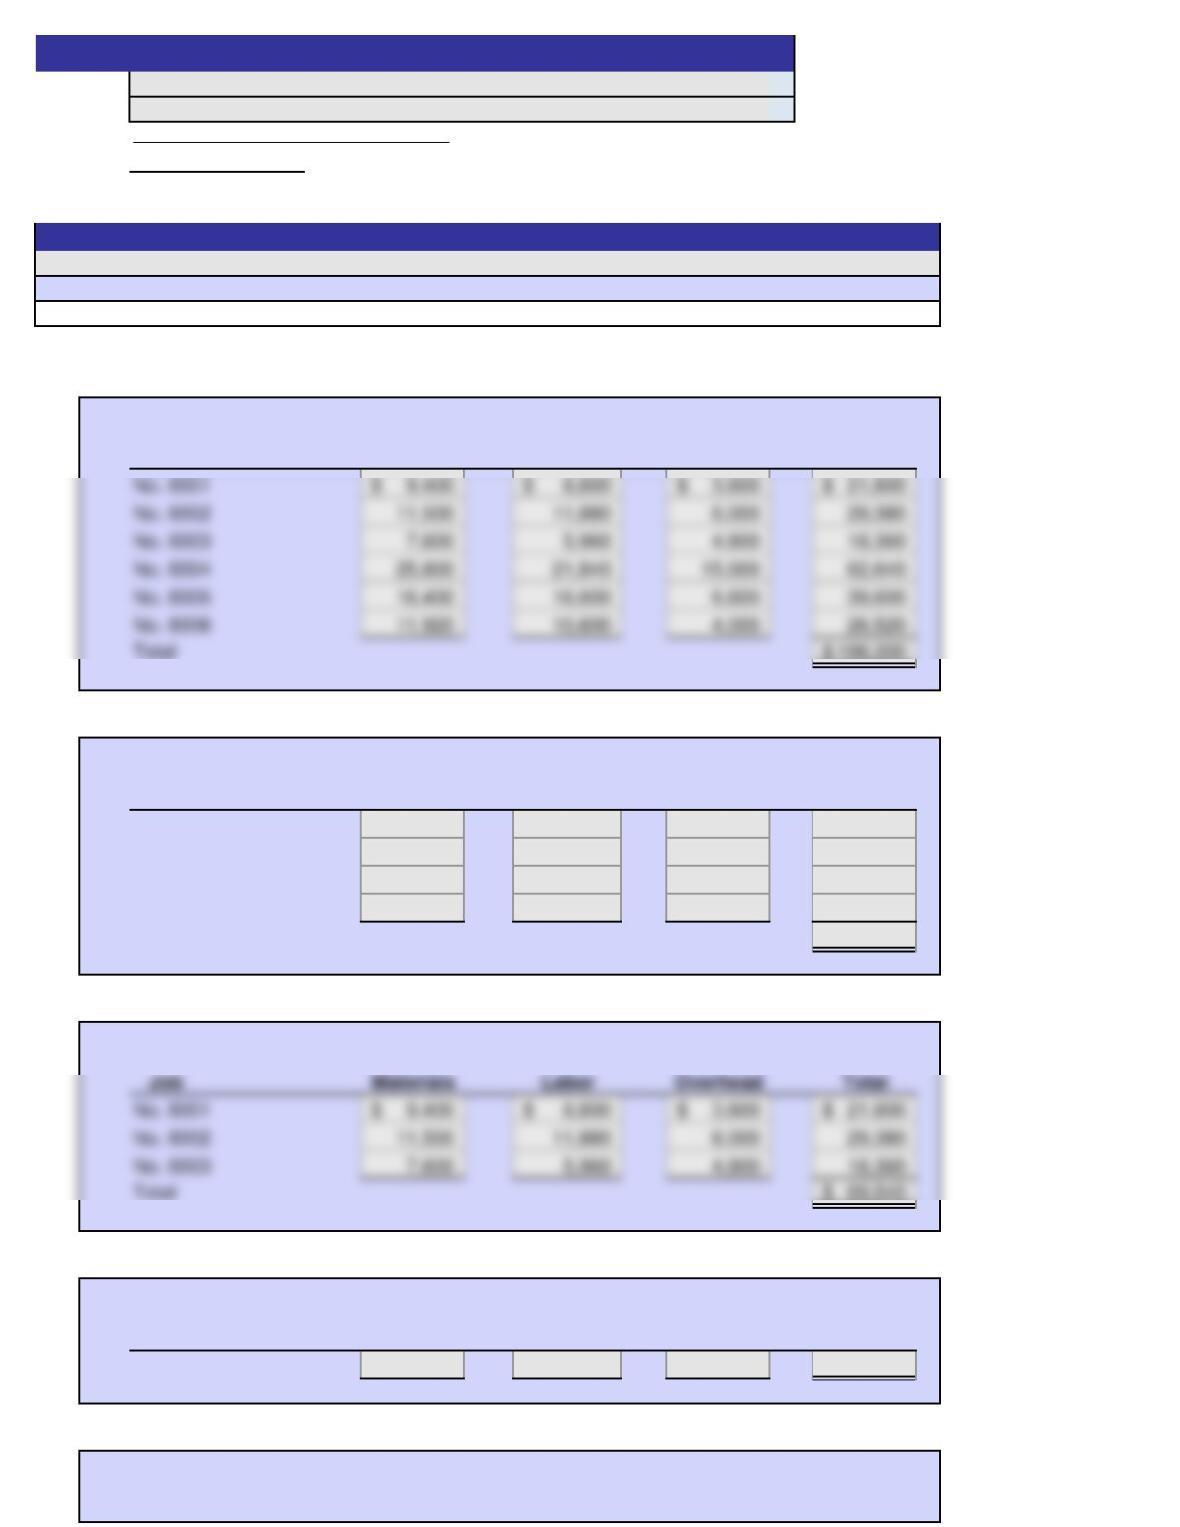
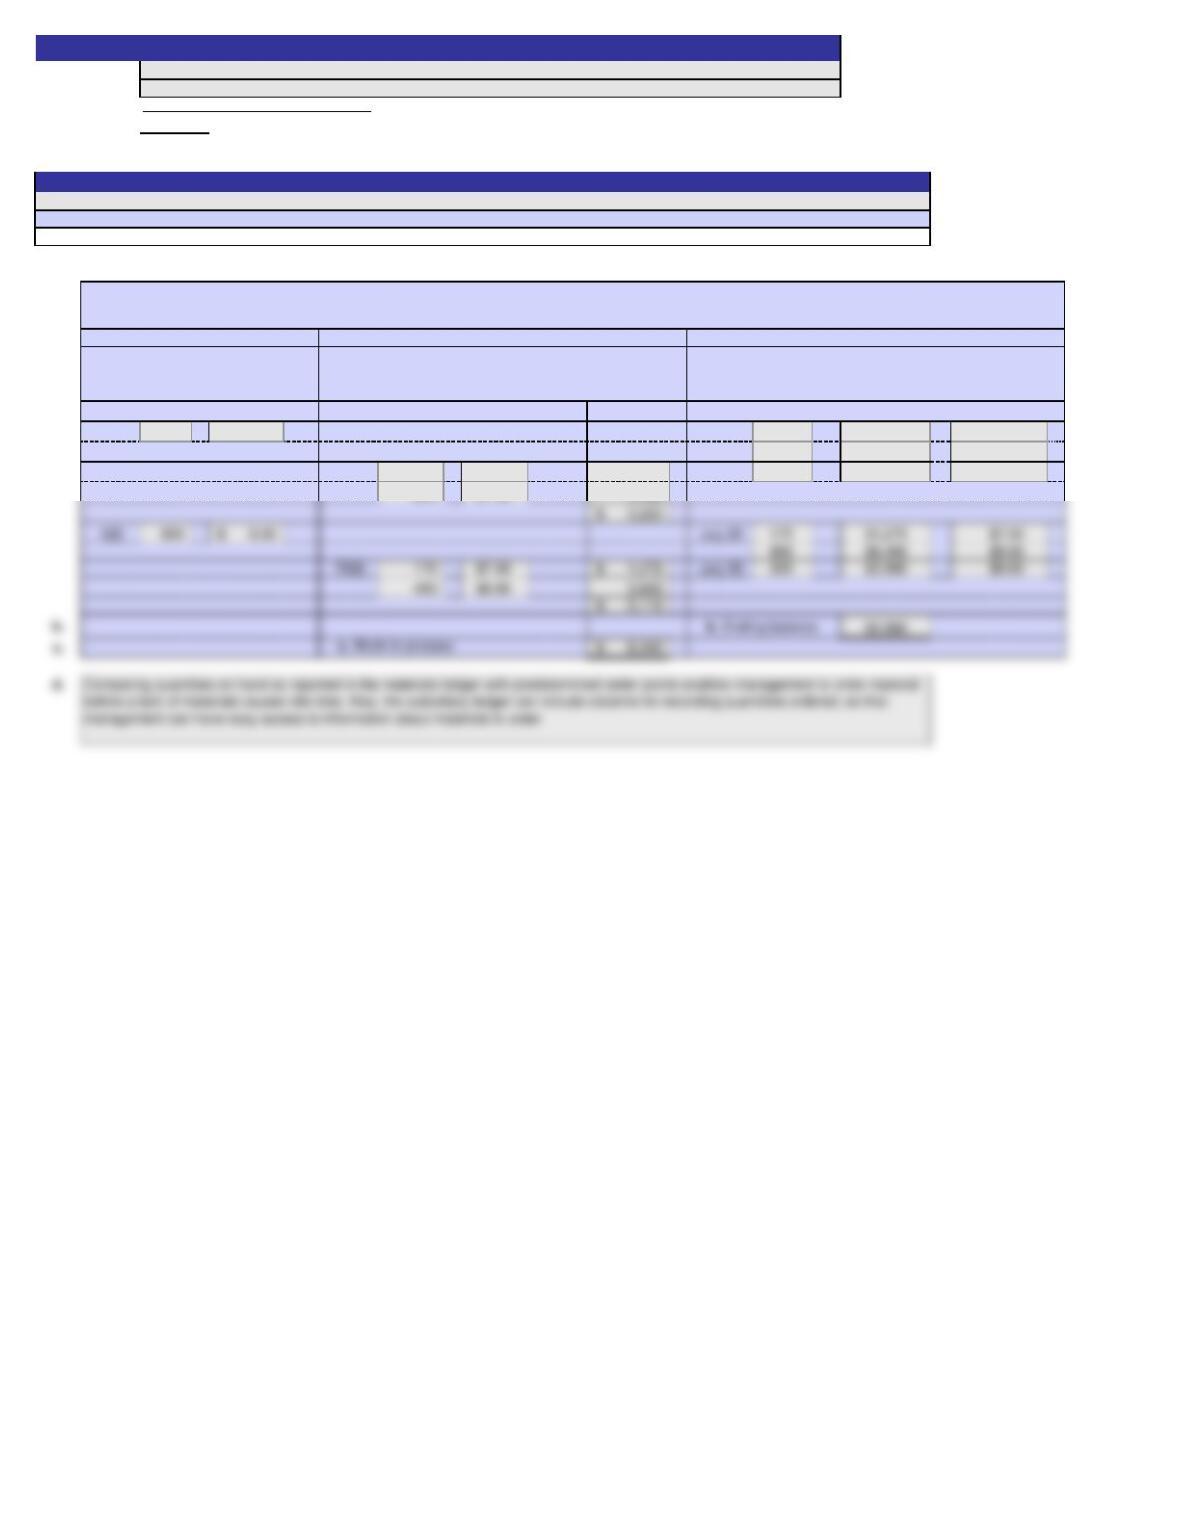
1. Schedule of manufacturing costs incurred during June:
Direct Direct Factory
Materials Labor Overhead Total
2. Schedule of cost of jobs finished during June:
Direct Direct Factory
Materials Labor Overhead Total
No. 6001 9,400$ 8,800$ 3,600$ 21,800$
No. 6002 11,500 11,880 6,000 29,380
No. 6003 7,600 5,960 4,800 18,360
No. 6005 16,400 16,600 6,600 39,600
Total 109,140$
3. Schedule of cost of goods sold during June:
Direct Direct Factory
Materials Labor Overhead Total
Job
4. Schedule of completed jobs on hand, June 30, 2012:
Direct Direct Factory
Materials Labor Overhead Total
No. 6005 16,400$ 16,600$ 6,600$ 39,600$
5. Schedule of unfinished jobs:
Direct Direct Factory
Materials Labor Overhead Total
Job
Job
Job
Job
Instructions
Problem 10-2
SOLUTION
ON
Answers are entered in the cells with gray backgrounds.
Cells with non-gray backgrounds are protected and cannot be edited.
A red asterisk (*) will appear in the row immediately to the right of an incorrect answer.
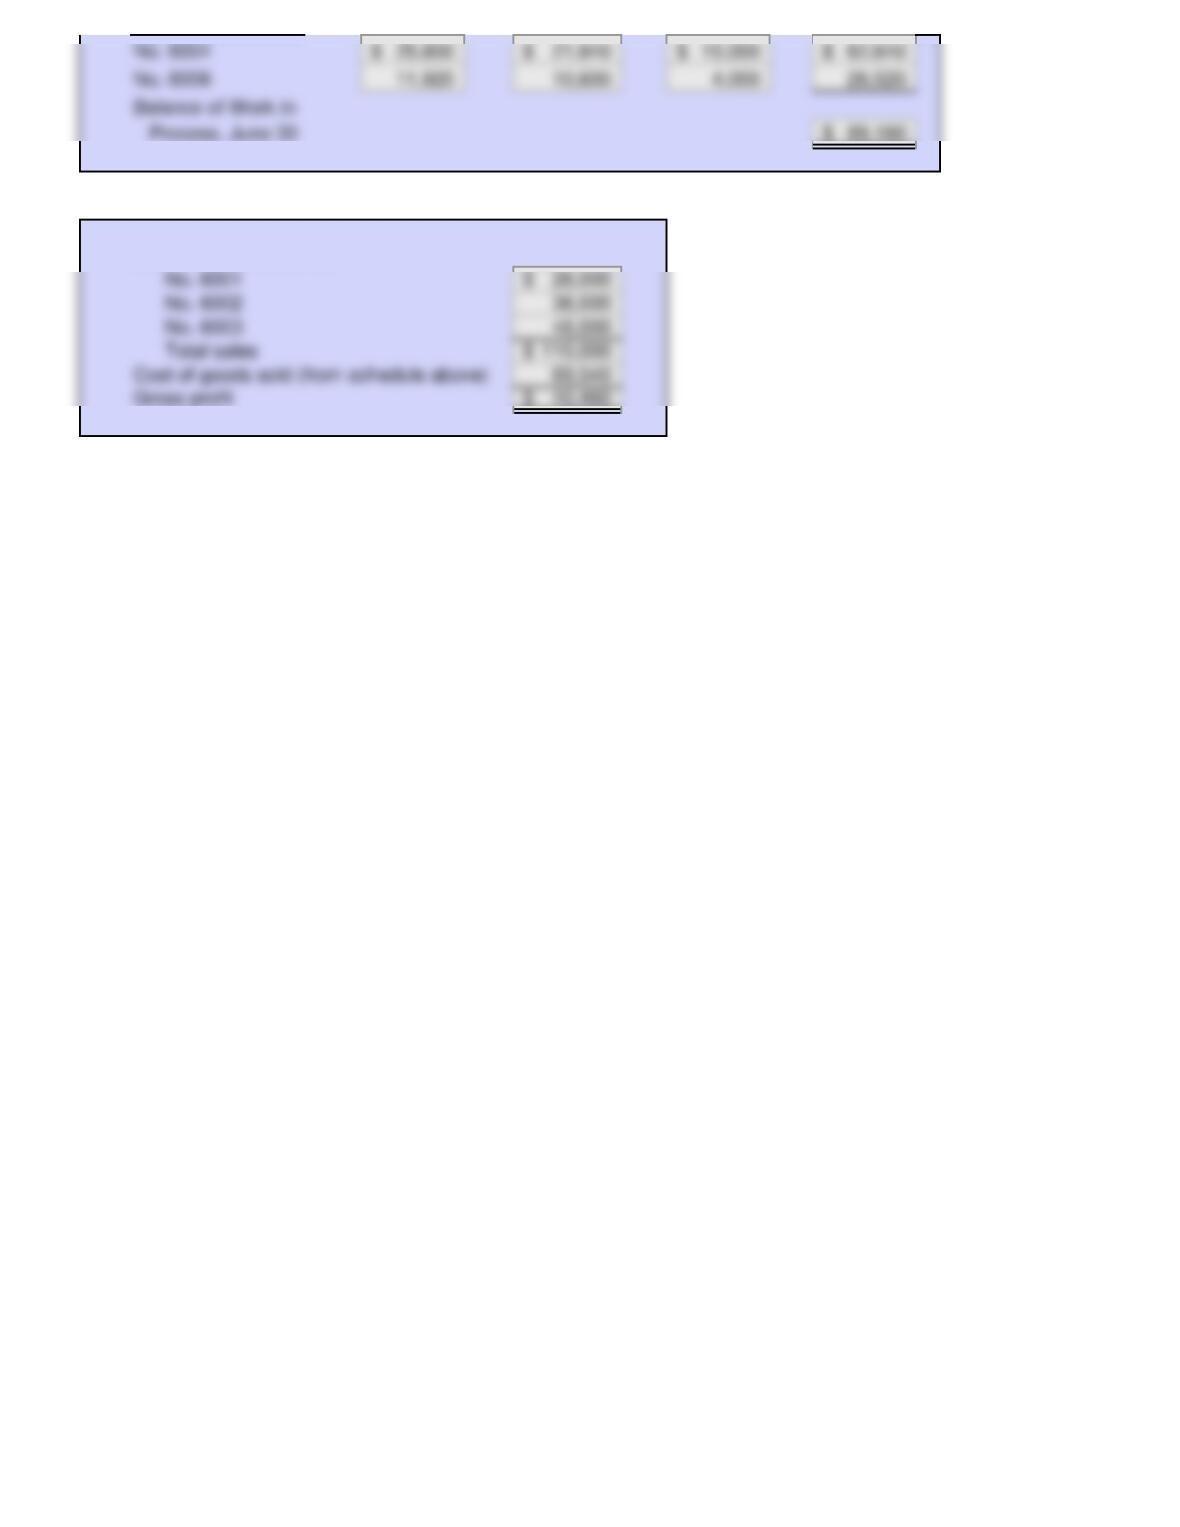
6. Gross profit for June based upon the jobs sold:
Jobs shipped and billed:
Name:
Section:
Score: 0%
Key Code:
1. and 2.
Date
Date wanted
Date completed
Job. No.
Amount Amount Amount
Comments:
2
Item
Reupholster couch and chair
02-019
Customer
Millard Schmidt
March 14, 20Y1
Problem 10-3
Instructions
Answers are entered in the cells with gray backgrounds.
Cells with non-gray backgrounds are protected and cannot be edited.
February 14, 20Y1
A red asterisk (*) will appear in the row immediately to the right of an incorrect answer.
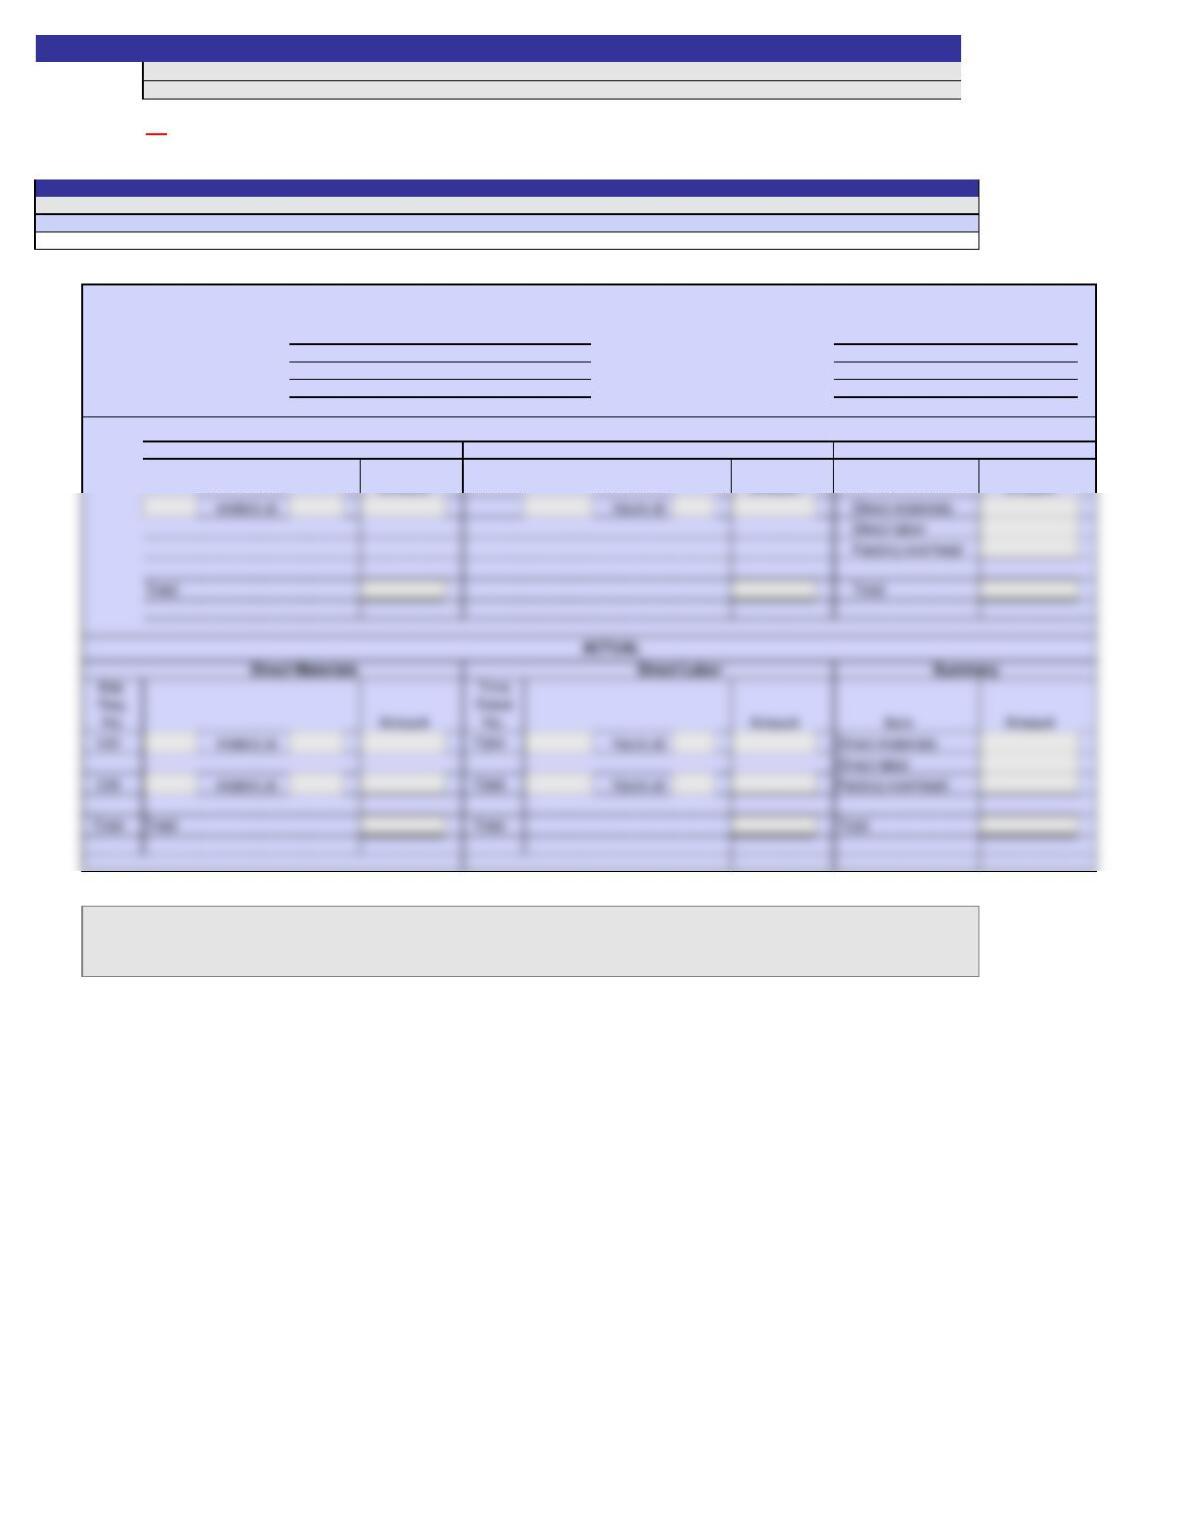
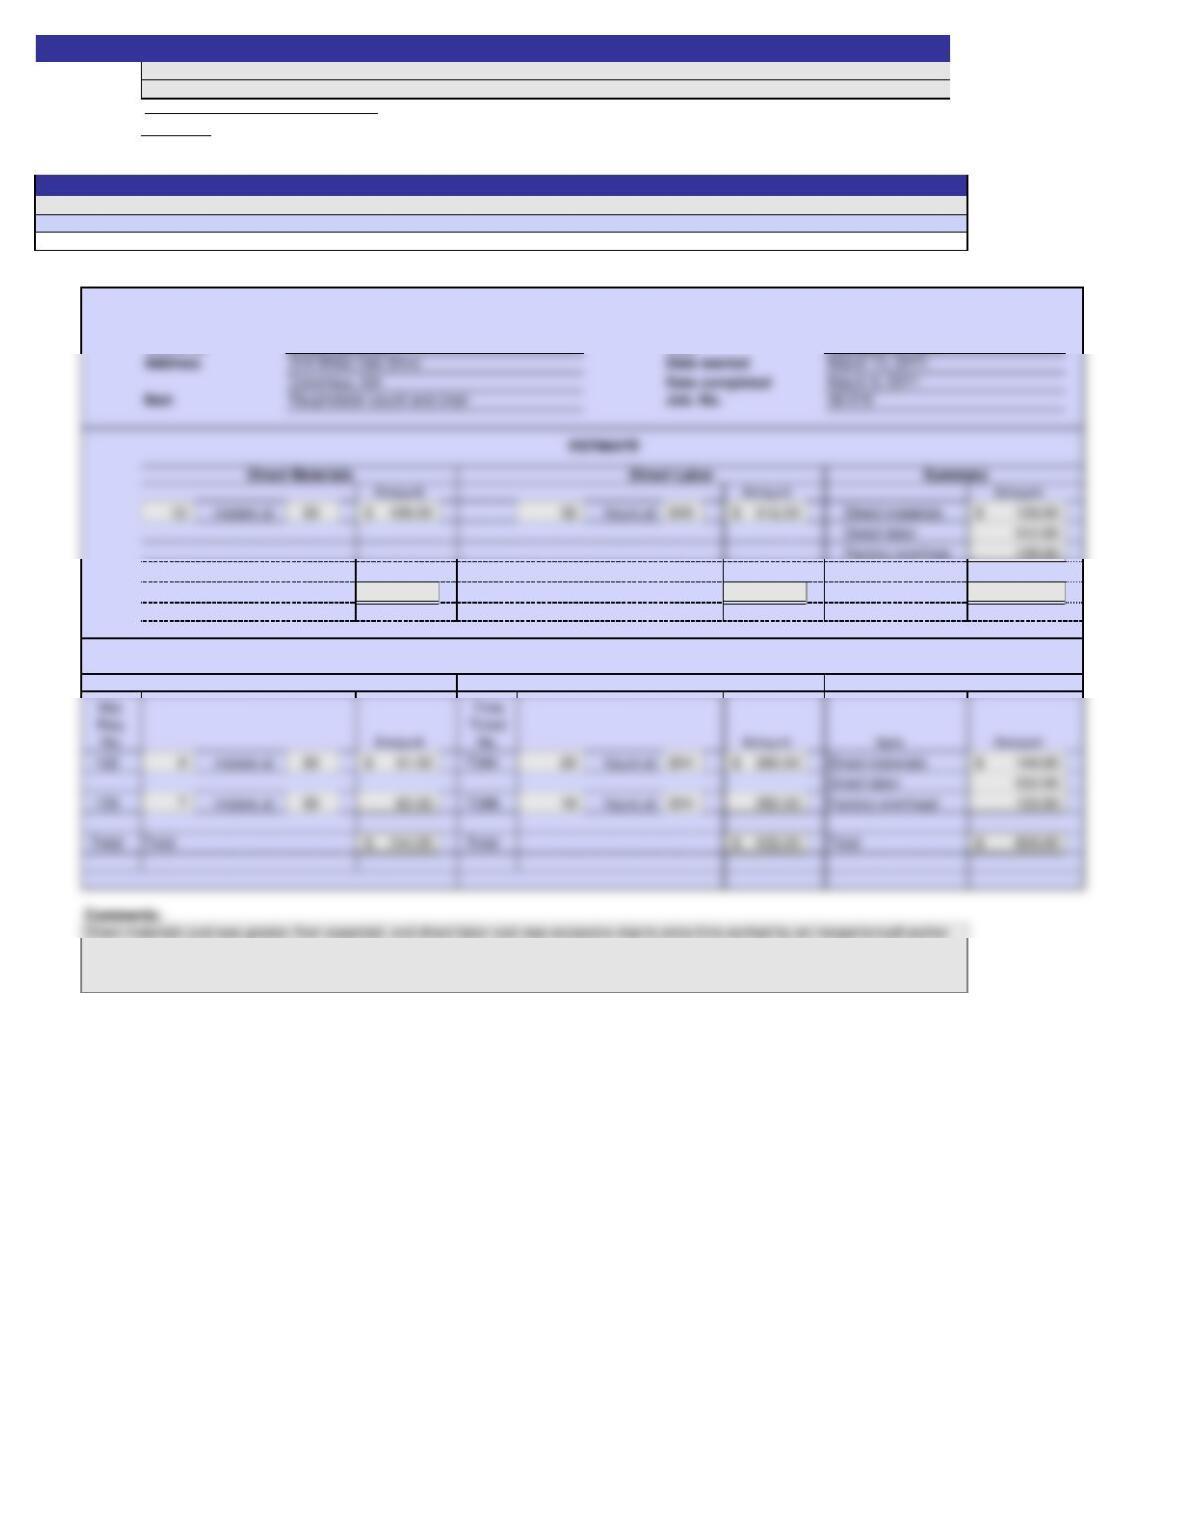
JOB ORDER COST SHEET
Address
314 White Oak Drive
Columbus, GA
March 9, 20Y1
Direct Materials
ESTIMATE
Summary
Direct Labor
Direct labor
Factory overhead
Summary
Direct materials
Direct Materials
Direct Labor
Name:
Section:
Score: See student sheet for student’s score
Scoring:
1. and 2.
Date
Total 108.00$ 512.00$ 748.00$
Direct materials
Factory overhead
Total
Direct labor
SOLUTION
Instructions
Problem 10-3
Answers are entered in the cells with gray backgrounds.
Cells with non-gray backgrounds are protected and cannot be edited.
ON
A red asterisk (*) will appear in the row immediately to the right of an incorrect answer.
JOB ORDER COST SHEET
Direct Materials
February 14, 20Y1
Millard Schmidt
Summary
ACTUAL
Direct Labor
Customer
Total
Columbus, GA
Direct Labor
Direct Materials
Summary
02-019
March 9, 20Y1
Name:
Section:
Score: 20%
*Since some answer boxes are correct when left blank, the beginning score is greater than 0%.
Key Code:
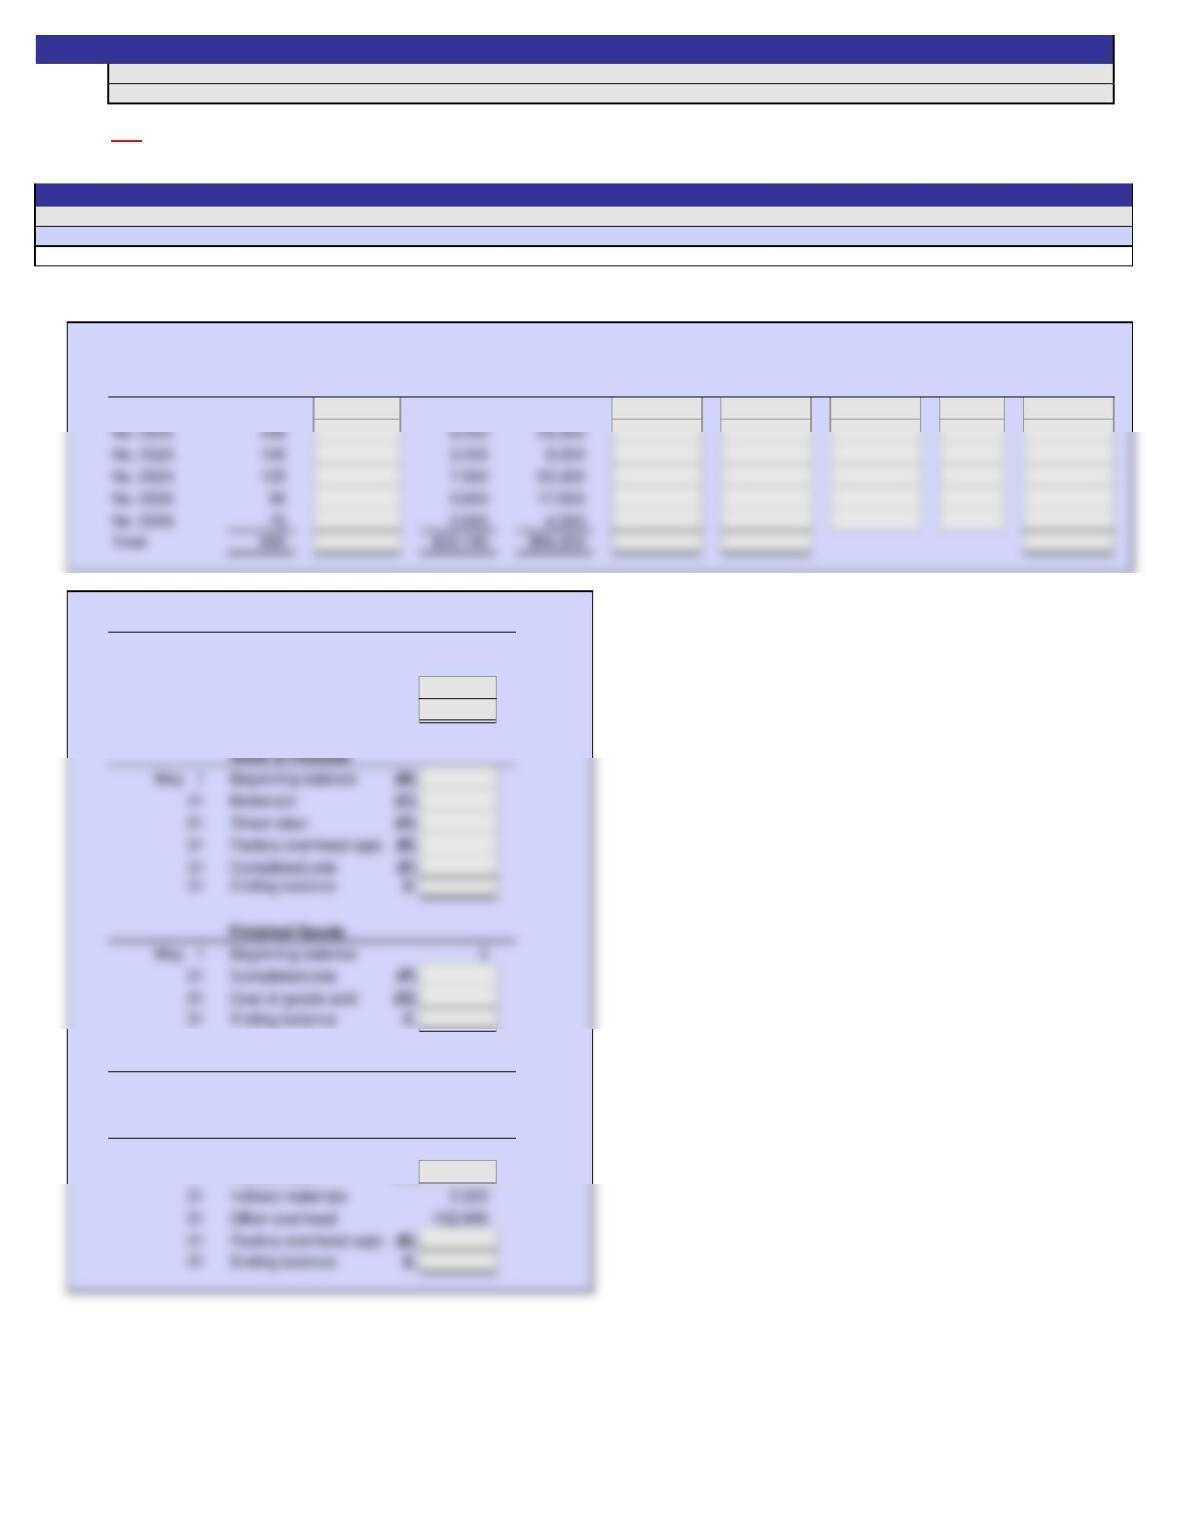
Supporting calculations:
May 1 Cost of
Work in Direct Direct Factory Total Unit Units Goods
Job. No. Quantity Process Materials Labor Overhead Cost Cost Sold Sold
No. 0521 100 $5,000 $15,000
Materials
May 1 Beginning balance 9,000
31 Purchases 40,000
31 Requisitions (A)
31 Ending balance 2.
Wages Payable
May 31 Wages incurred 110,000
Factory Overhead
May 1 Beginning balance (3,000)
31 Indirect labor (H)
Problem 10-4
A red asterisk (*) will appear in the row immediately to the right of an incorrect answer.
Instructions
Answers are entered in the cells with gray backgrounds.
Cells with non-gray backgrounds are protected and cannot be edited.
2
Name:
Section:
Score: See student sheet for student’s score
Scoring:
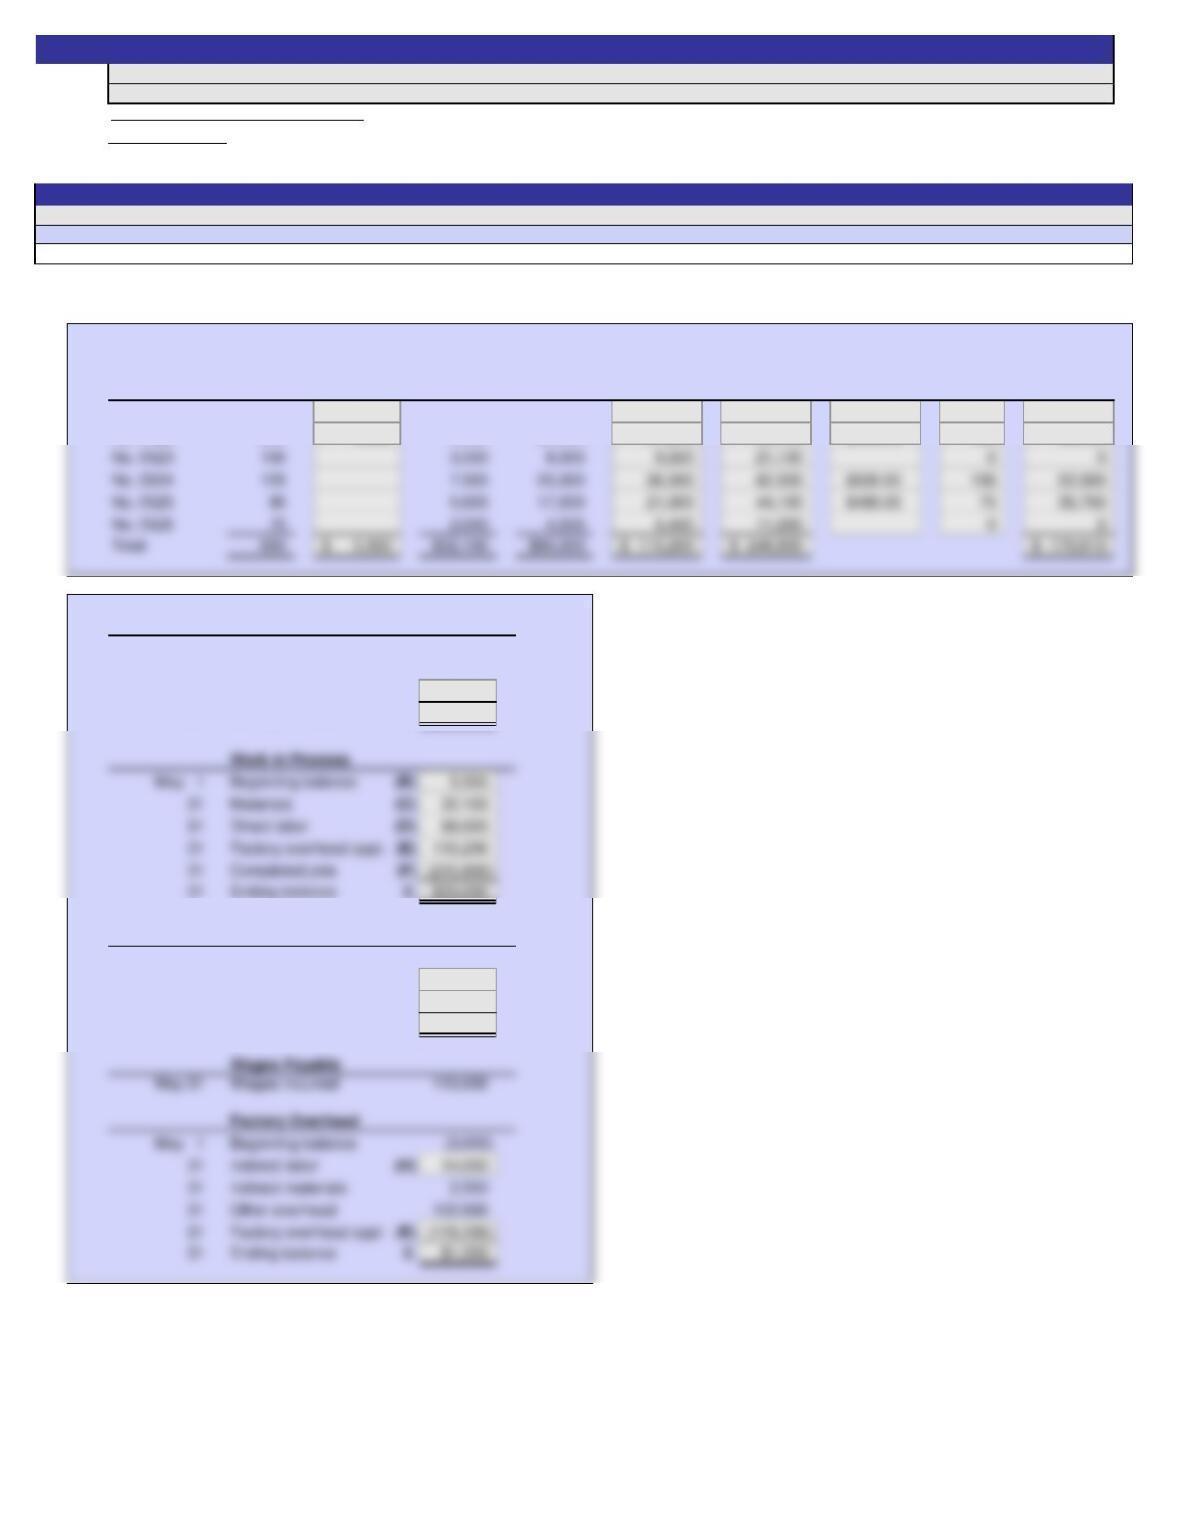
1. Supporting calculations:
May 1 Cost of
Work in Direct Direct Factory Total Unit Units Goods
Job. No. Quantity Process Materials Labor Overhead Cost Cost Sold Sold
No. 0521 100 1,500$ $5,000 $15,000 18,000$ 39,500$ $395.00 80 31,600$
No. 0522 200 4,000 8,500 26,000 31,200 69,700 $348.50 160 55,760
Materials
May 1 Beginning balance 9,000
31 Purchases 40,000
31 Requisitions (A) (34,600)
31 Ending balance 2. 14,400
Finished Goods
May 1 Beginning balance 0
31 Completed jobs (F) 215,800
31 Cost of goods sold (G) (176,610)
31 Ending balance 2. 39,190
A red asterisk (*) will appear in the row immediately to the right of an incorrect answer.
Cells with non-gray backgrounds are protected and cannot be edited.
Problem 10-4
SOLUTION
Instructions
Answers are entered in the cells with gray backgrounds.
ON
Name:
Section:
Score: 0%
Key Code:
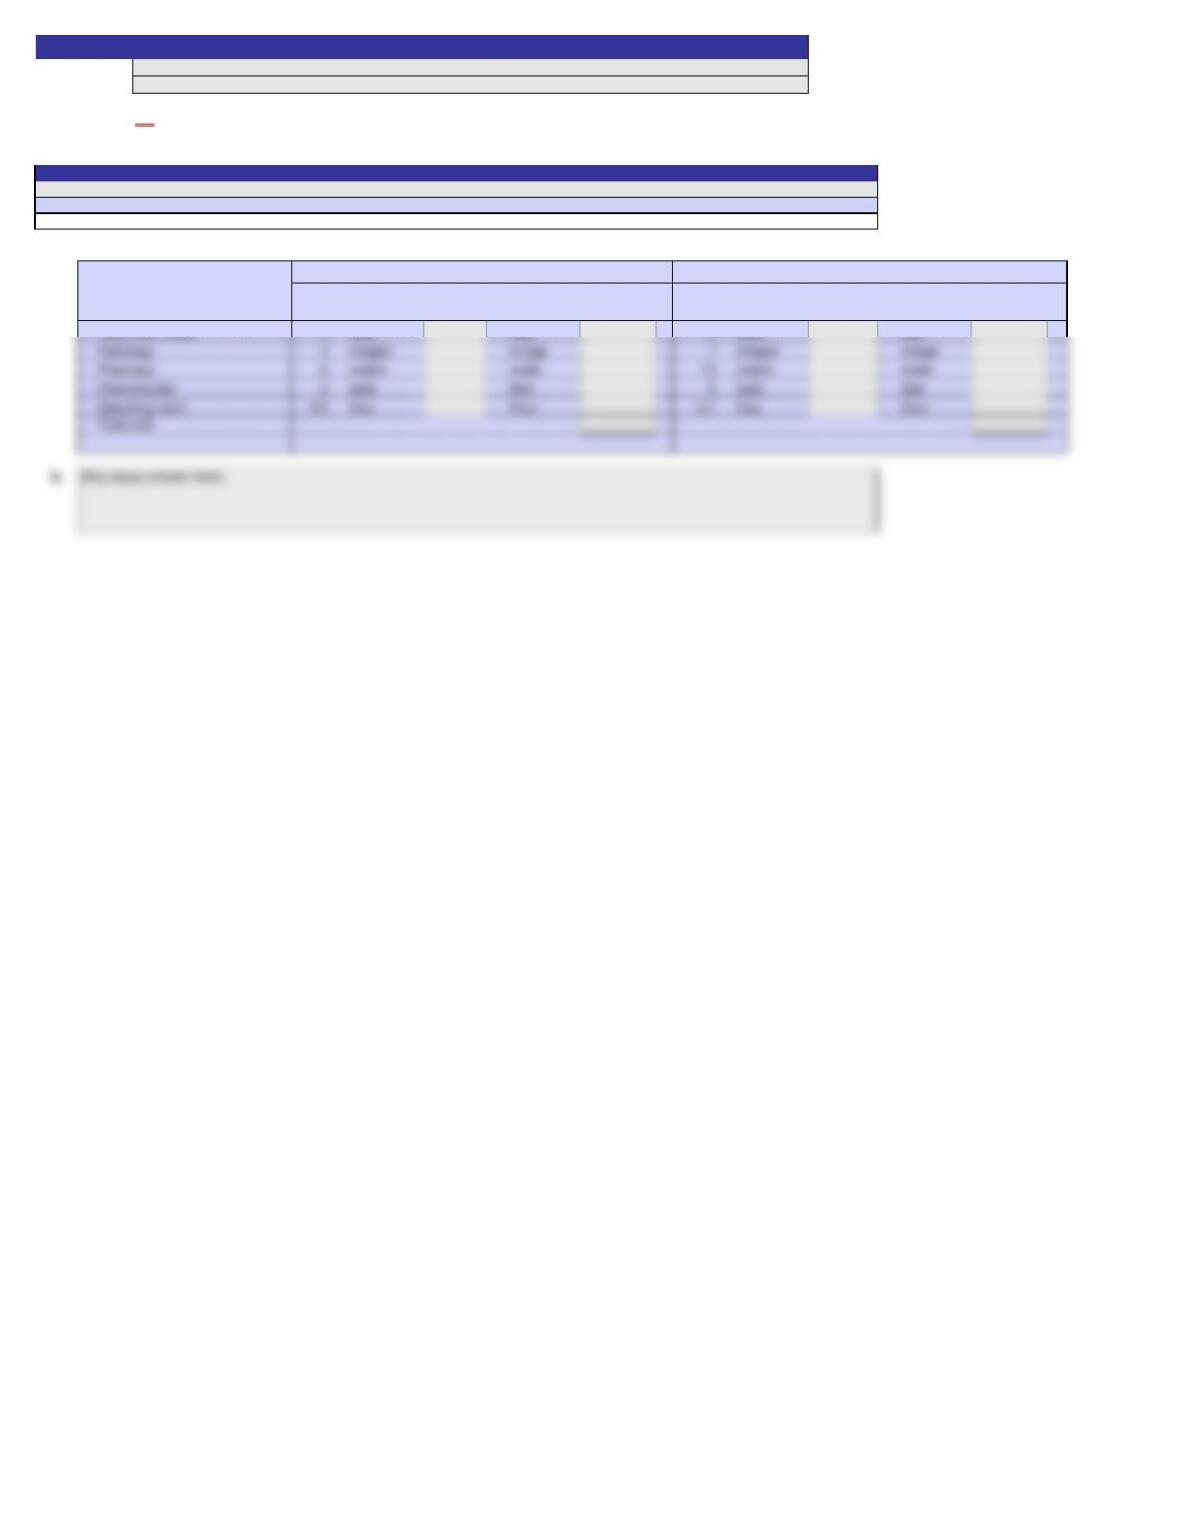
1.
Sales
Gross profit
Supporting calculations:
Manufacturing cost per unit (CD):
Direct materials
2.
Finished Goods balance, December 31, 20Y8:
For the Year Ended December 31, 20Y8
Answers are entered in the cells with gray backgrounds.
Cells with non-gray backgrounds are protected and cannot be edited.
A red asterisk (*) will appear in the row immediately to the right of an incorrect answer.
R-TUNES INC.
Income Statement
2
Problem 10-5
Instructions
Name:
Section:
Score: See student sheet for student’s score
Scoring:
1.
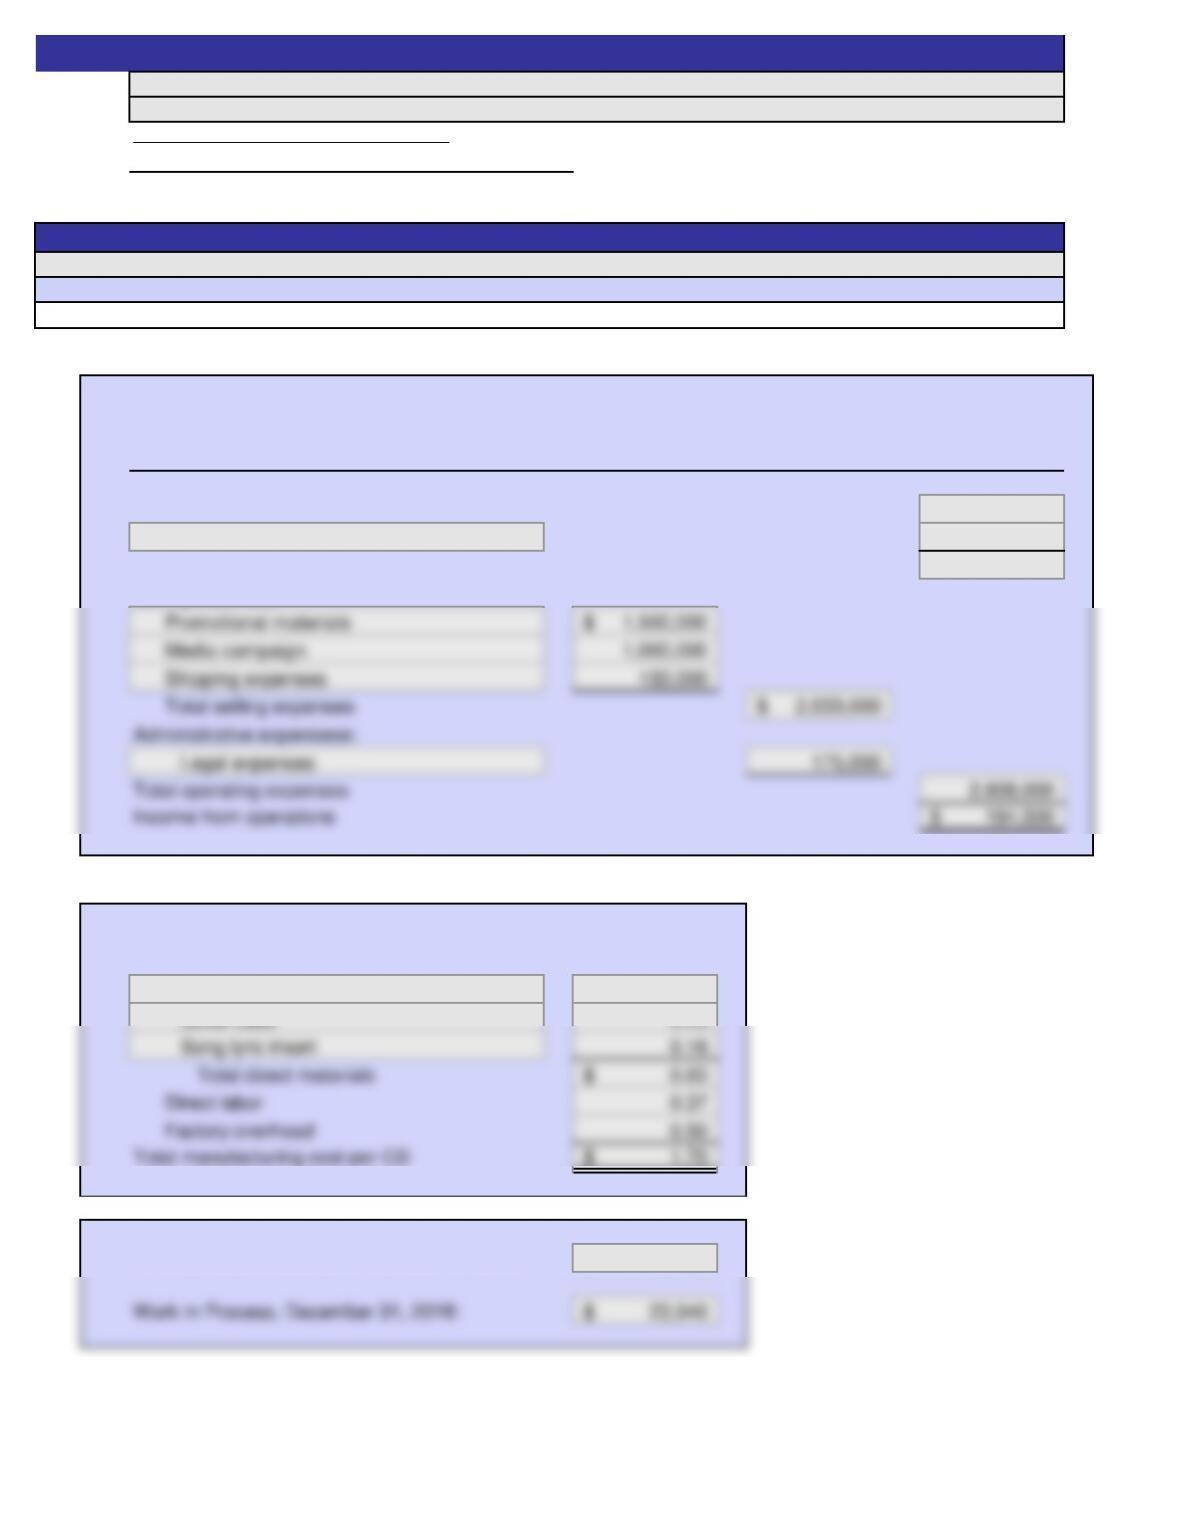
Sales 3,800,000$
Cost of goods sold 807,500
Gross profit 2,992,500$
Selling expenses:
Supporting calculations:
Manufacturing cost per unit (CD):
Direct materials
Blank CD 0.40$
2.
Finished Goods balance, December 31, 20Y8: 42,500$
For the Year Ended December 31, 20Y8
R-TUNES INC.
Answers are entered in the cells with gray backgrounds.
Cells with non-gray backgrounds are protected and cannot be edited.
A red asterisk (*) will appear in the row immediately to the right of an incorrect answer.
Income Statement
Problem 10-5
SOLUTION
Instructions
ON
Name:
Section:
Score: 0%
Key Code:
a.
Revenues
b.
Materials inventory:
Materials inventory, July 31
Work in process inventory:
Exercise 10-19
Instructions
2
BRIDGER BIKES INC
Income Statement
For the Month Ended July 31, 20Y6
Answers are entered in the cells with gray backgrounds.
Cells with non-gray backgrounds are protected and cannot be edited.
A red asterisk (*) will appear in the row immediately beneath an incorrect answer.
Name:
Section:
Score: See student sheet for student’s score
Scoring:
a.
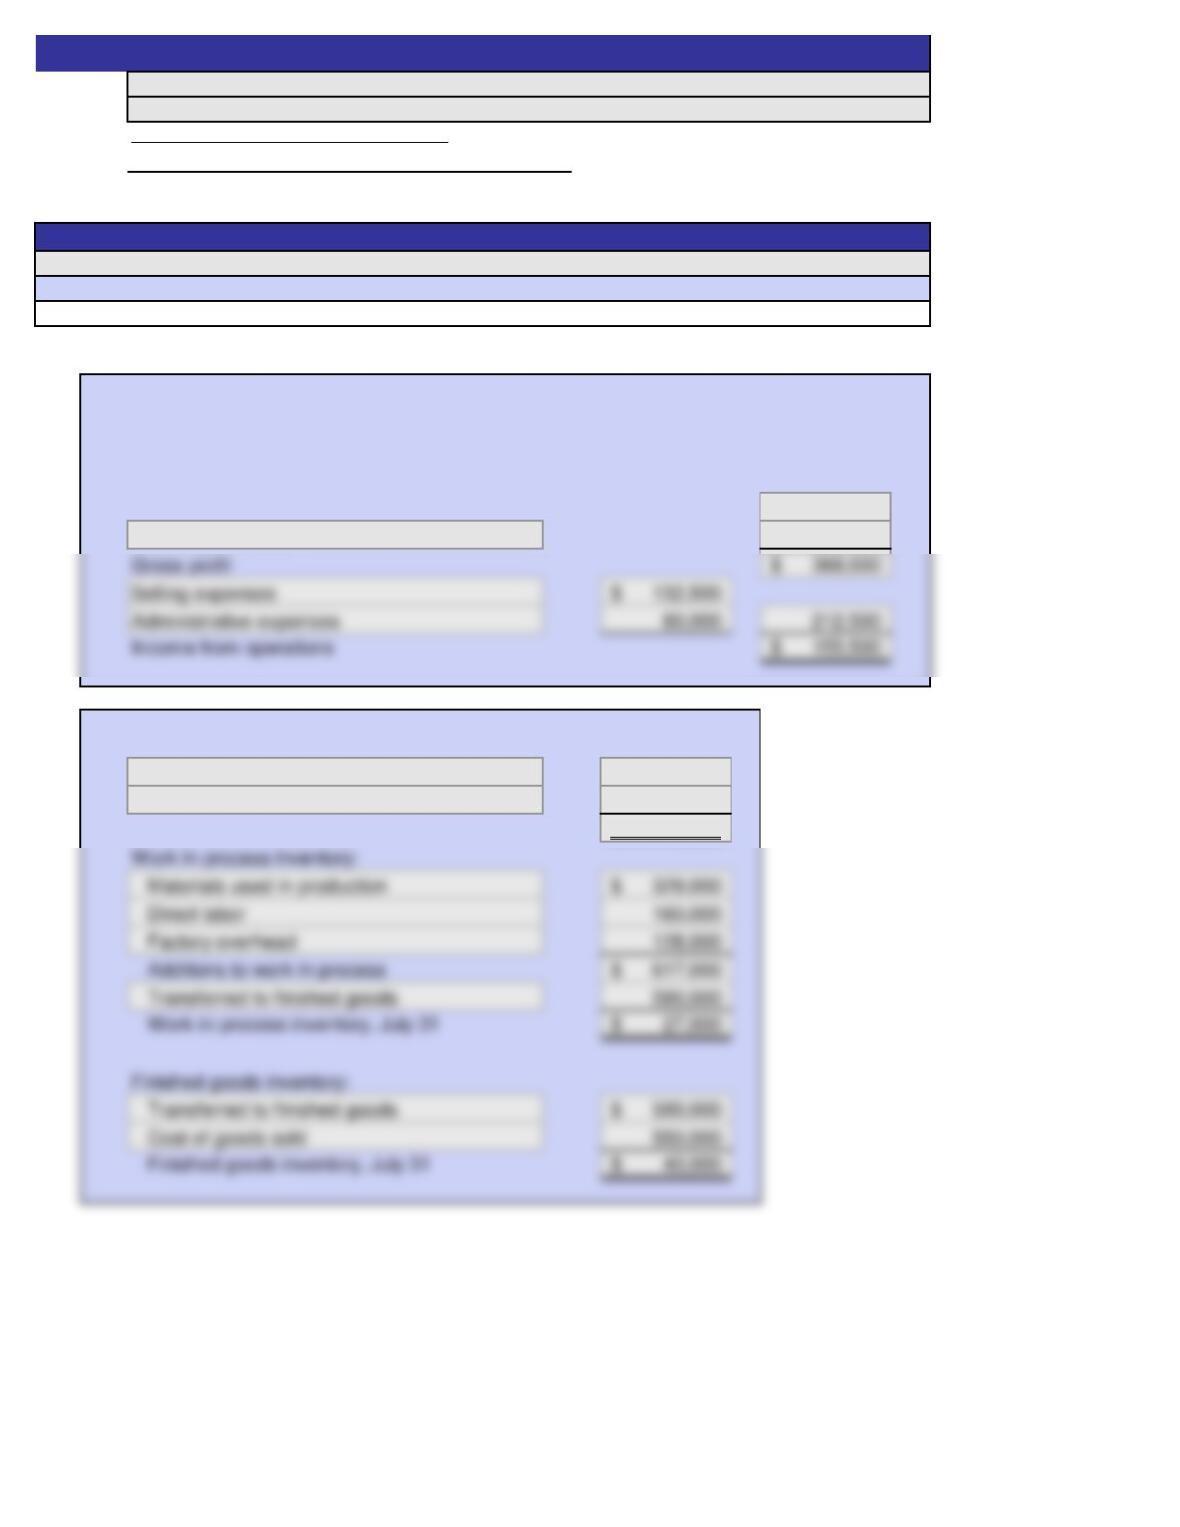
Revenues 918,000$
Cost of goods sold 550,000
b.
Materials inventory:
Purchased materials 340,000$
Materials used in production 329,000
Materials inventory, July 31 11,000$
Cells with non-gray backgrounds are protected and cannot be edited.
A red asterisk (*) will appear in the row immediately to the right of an incorrect answer.
Income Statement
For the Month Ended July 31, 20Y6
BRIDGER BIKES INC
Exercise 10-19
SOLUTION
Instructions
ON
Answers are entered in the cells with gray backgrounds.
Name:
Section:
Score: 0%
Key Code:
a.
Amount Amount
July 1 250 $1,500 $6.00
d.
Cells with non-gray backgrounds are protected and cannot be edited.
A red asterisk (*) will appear in the row immediately to the right of an incorrect answer. Essay answers will not be graded.
WIRE CABLE
Exercise 10-8
Instructions
2
Answers are entered in the cells with gray backgrounds.
Mat.
Req.
Qty.
Unit
Price
RECEIVED
ISSUED
BALANCE
Rec.
Report
Qty.
Unit
Price
Date
Qty.
(Key essay answer here)
Unit
Price
Name:
Section:
Score: See student sheet for student’s score
Scoring:
a.
Amount Amount
July 1 250 $1,500 $6.00
309 400 7.50$ July 5 250 $1,500 $6.00
400 $3,000 $7.50
7401 250 $6.00 1,500$ July 10 170 $1,275 $7.50
230 $7.50 1,725
Unit
Price
A red asterisk (*) will appear in the row immediately to the right of an incorrect answer. Essay answers will not be graded.
WIRE CABLE
Qty.
Rec.
Report
No.
BALANCE
Date
Exercise 10-8
Answers are entered in the cells with gray backgrounds.
Cells with non-gray backgrounds are protected and cannot be edited.
ON
Unit
Price
Unit
Price
RECEIVED
Mat.
Req.
No.
Qty.
ISSUED
SOLUTION
Instructions
Qty.
Name:
Section:
Score: 0%
Key Code:
a.
= =
Activity
Rate
Answers are entered in the cells with gray backgrounds.
Cells with non-gray backgrounds are protected and cannot be edited.
A red asterisk (*) will appear in the row immediately to the right of an incorrect answer. Essay answers will not be graded.
Activity Usage
Exercise 10-29
Instructions
2
Activity
Rate
Patient Mims
Activity
Cost
Patient Slater
Activity Usage
Activity
Cost
Activity
Radiology
Pharmacy
Chemistry lab
Room and meals
Operating room
Name:
Section:
Score: See student sheet for student’s score
Scoring:
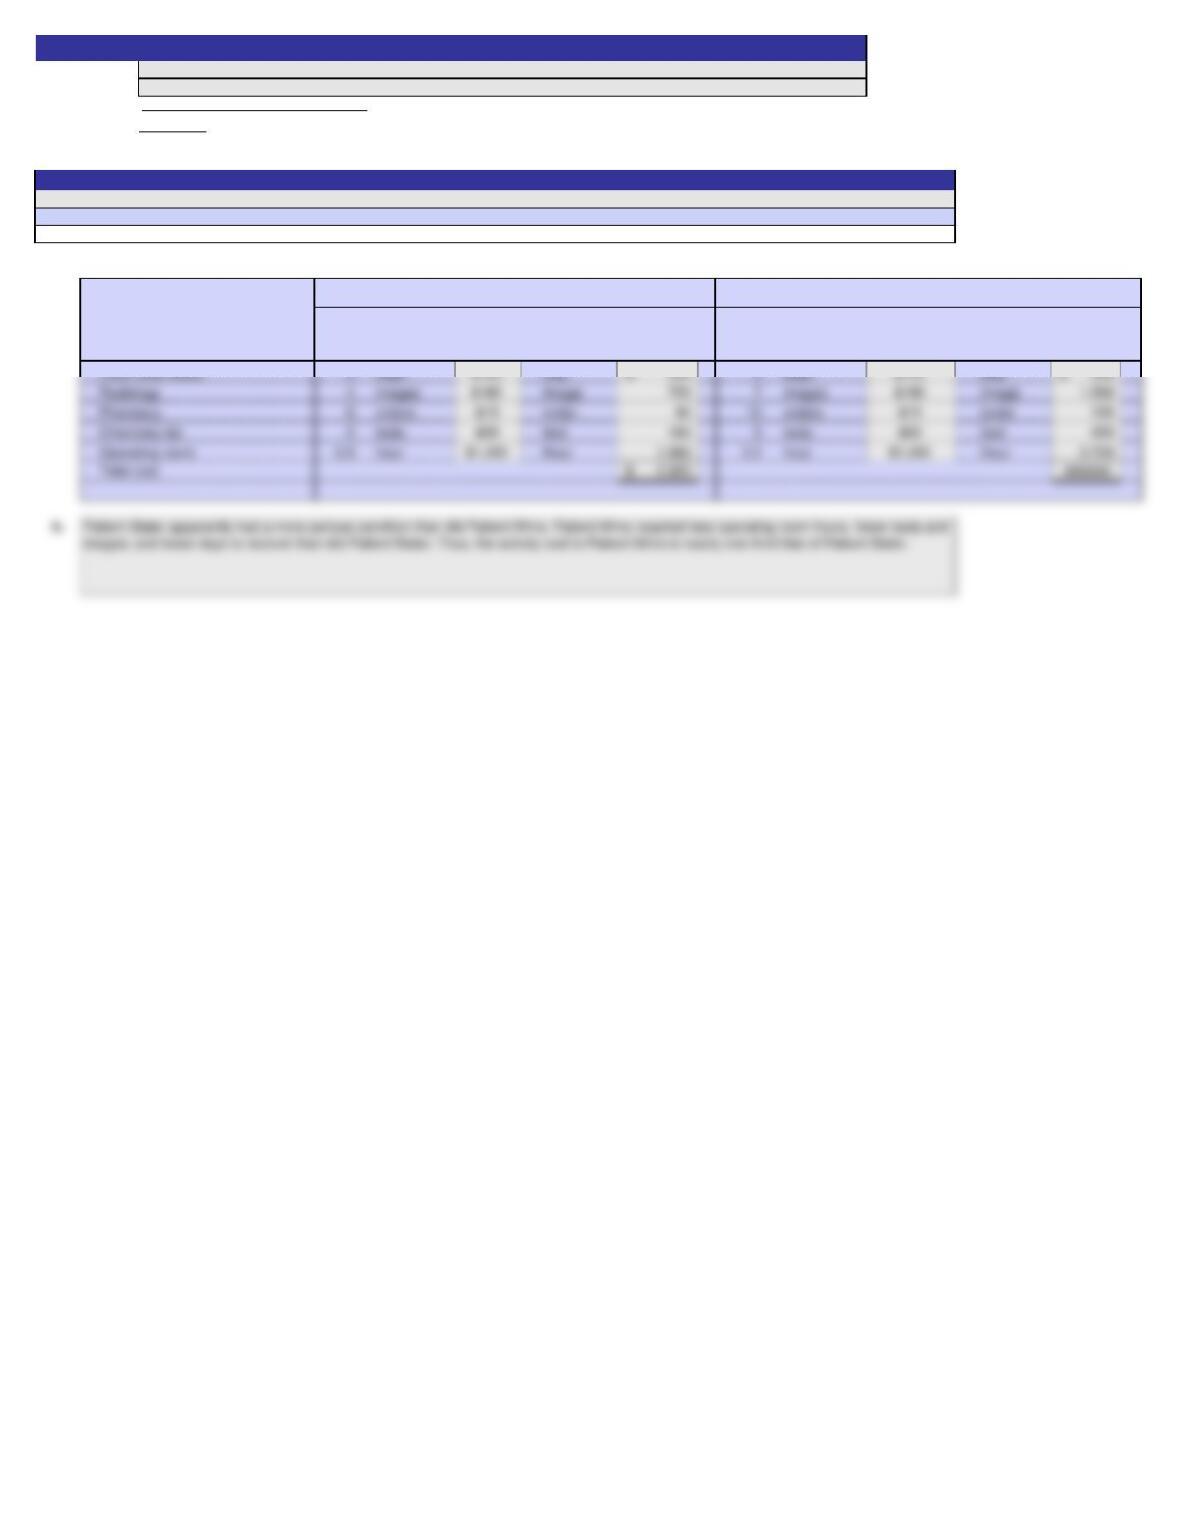
a.
= =
SOLUTION
Instructions
A red asterisk (*) will appear in the row immediately to the right of an incorrect answer. Essay answers will not be graded.
Patient Mims
Activity
Rate
Exercise 10-29
Answers are entered in the cells with gray backgrounds.
Cells with non-gray backgrounds are protected and cannot be edited.
ON
Patient Slater
Activity
Activity Usage
Activity Cost
Activity Usage
Activity Rate
Activity
Cost
Room and meals
Radiology
Chemistry lab
Operating room
Pharmacy
Name:
Section:
Score: 0%
Key Code:
a.
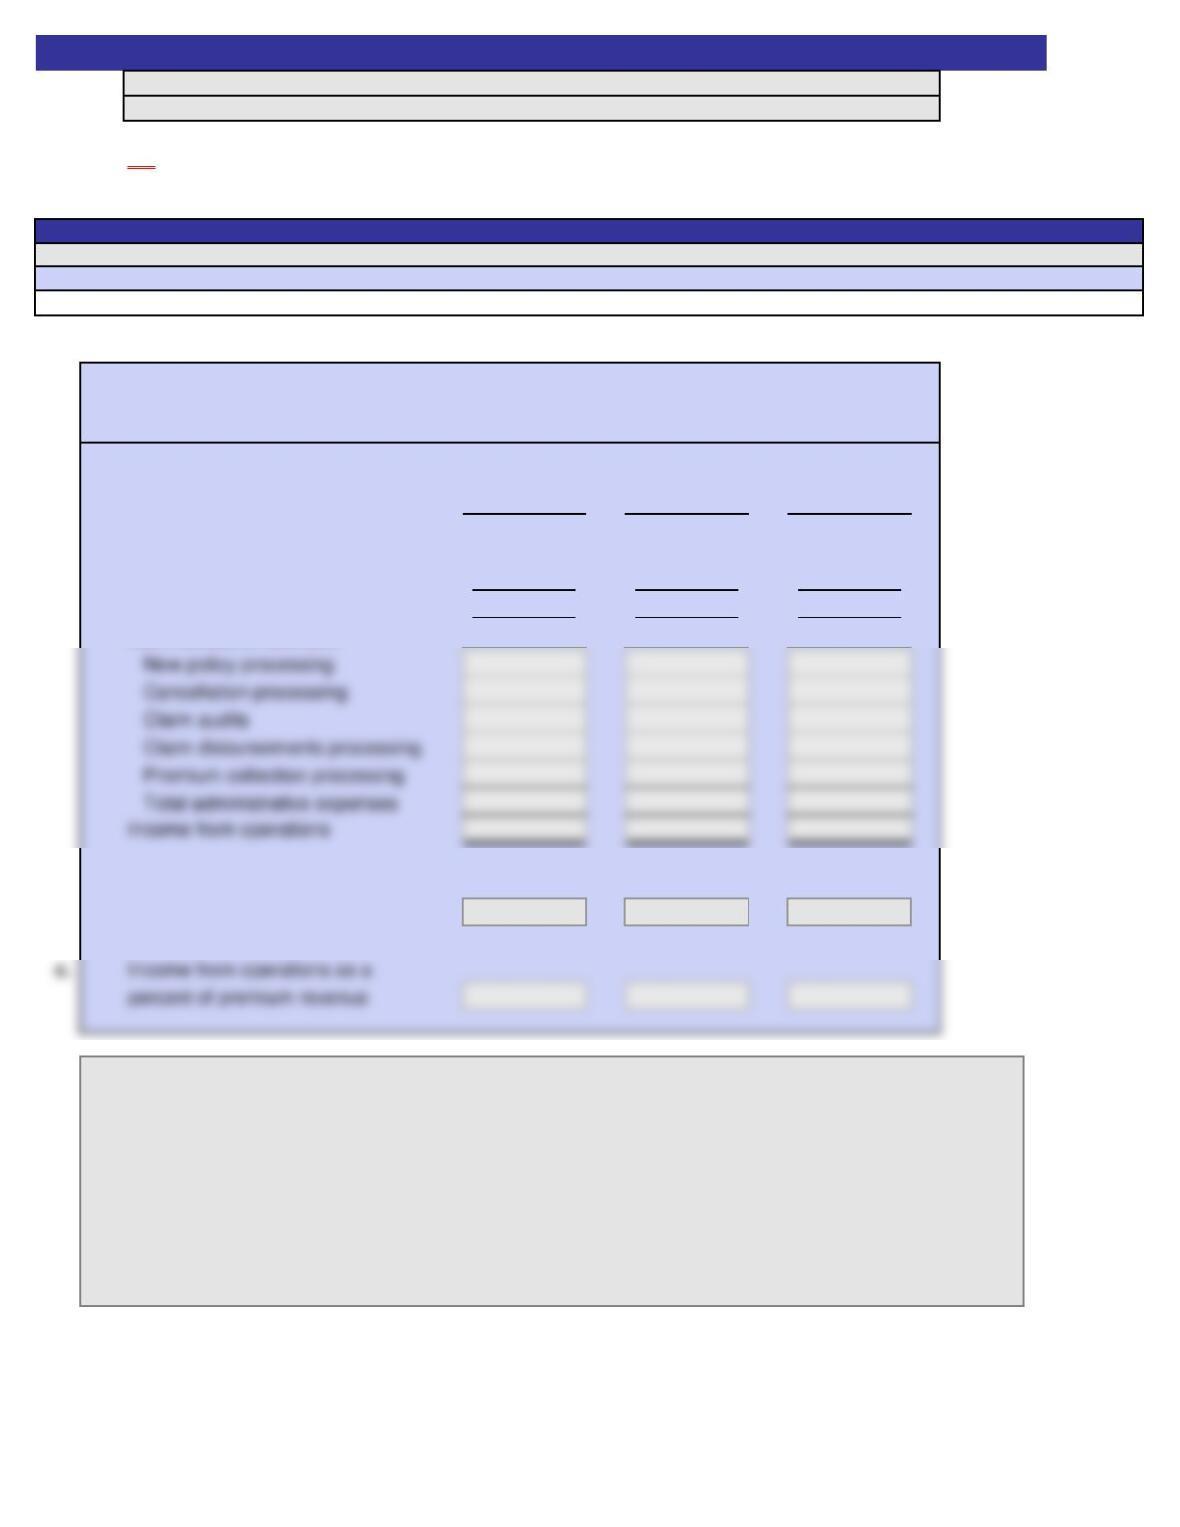
Workers’ Home-
Auto Comp. Owners
Premium revenue 7,200,000$ 6,500,000$ 9,200,000$
Less estimated claims 5,040,000 4,550,000 6,440,000
Underwriting income 2,160,000$ 1,950,000$ 2,760,000$
Administrataive activities:
b. Underwriting income as a percent
of premium revenue
d.
(Key essay answer here)
A red asterisk (*) will appear in the column to the right of an incorrect answer. The essay answer will not be graded.
UNBRELLA INSURANCE COMPANY
Product Profitability Report
For the Year Ended December 31, 20Y2
Instructions
Answers are entered in the cells with gray backgrounds.
Cells with non-gray backgrounds are protected and cannot be edited.
Exercise 10-30
2
Name:
Section:
Score:
Scoring:
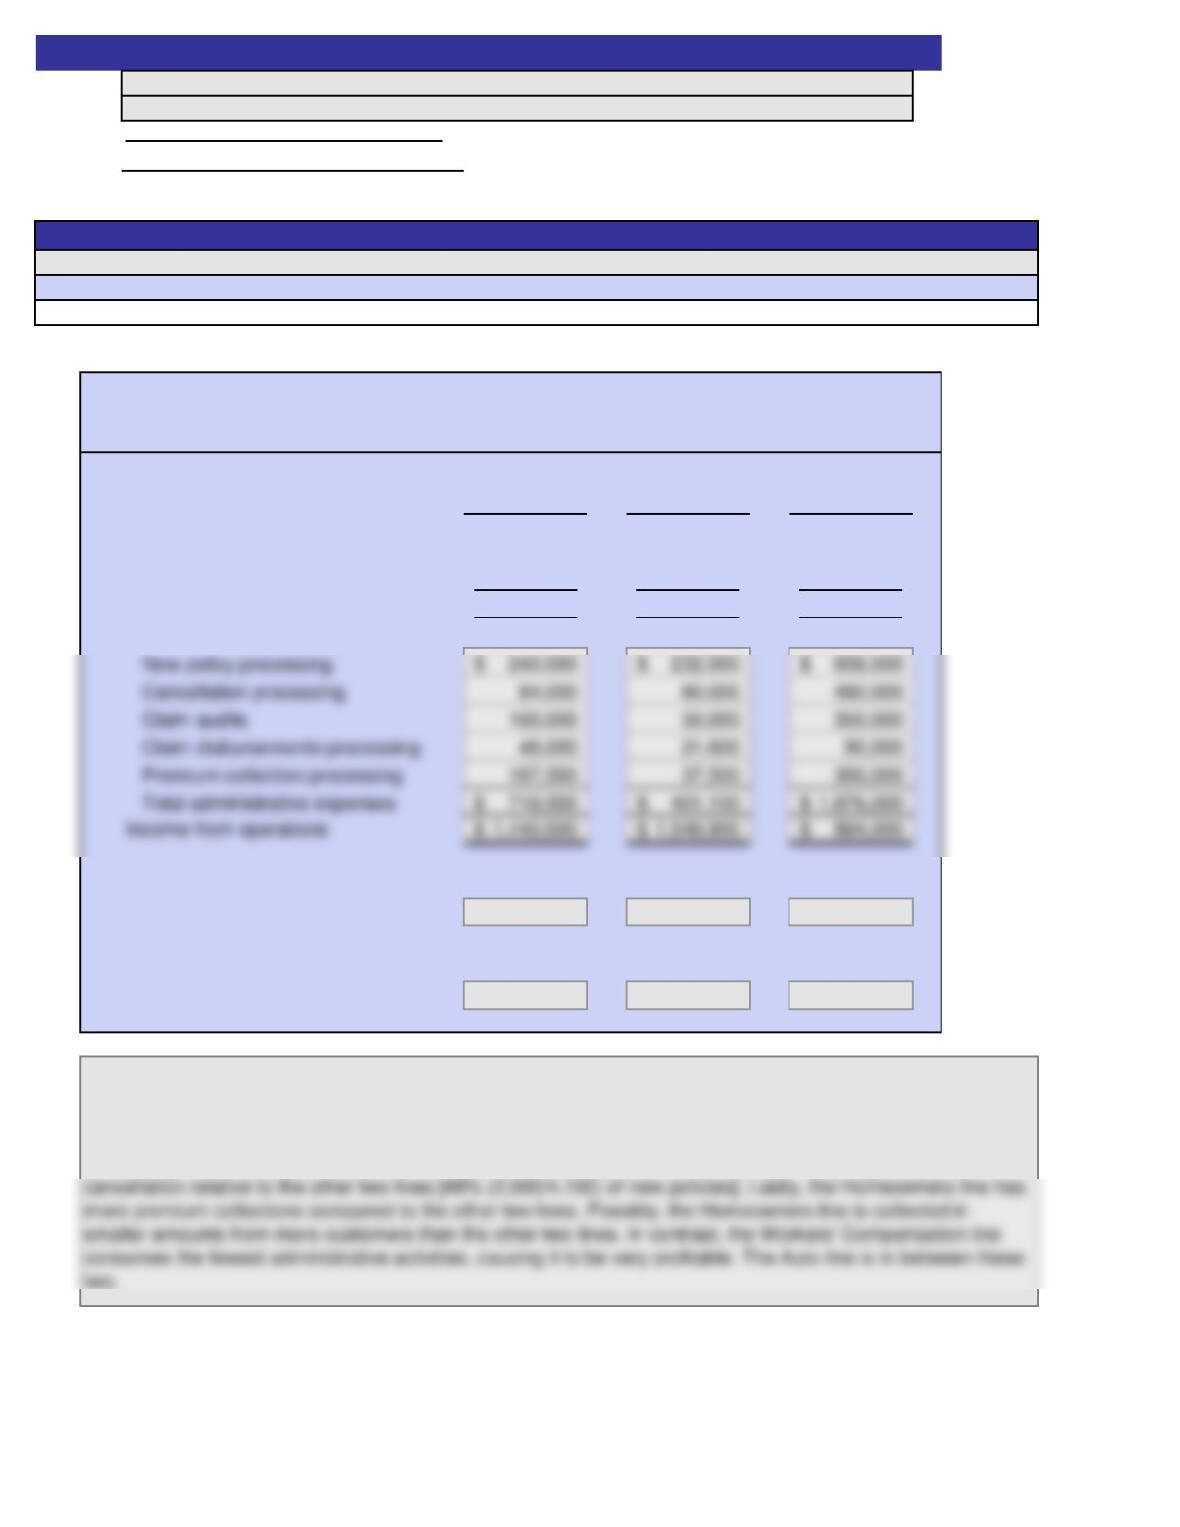
a.
Workers’ Home-
Auto Comp. Owners
Premium revenue 7,200,000$ 6,500,000$ 9,200,000$
Less estimated claims 5,040,000 4,550,000 6,440,000
Underwriting income 2,160,000$ 1,950,000$ 2,760,000$
Administrataive activities:
b. Underwriting income as a percent
of premium revenue 30% 30% 30%
c. Income from operations as a
percent of premium revenue 20% 24% 10%
d.
All three insurance lines have the same percentage of underwriting income to premium revenue (30%). The
differences among the insurance lines are in the way they consume administrative activities. For example, the
Homeowners insurance line has the least profitability due to its high use of administrative activities. Specifically,
the Homeowners line has smaller and more frequent claims that arequire more auditing and disbursement
processing than do the other two lines. In addition, the Homeowners line is having a much higher rate of
For the Year Ended December 31, 20Y2
UNBRELLA INSURANCE COMPANY
Product Profitability Report
Answers are entered in the cells with gray backgrounds.
Cells with non-gray backgrounds are protected and cannot be edited.
A red asterisk (*) will appear in the column to the right of an incorrect answer.
ON
Instructions
Exercise 10-30
SOLUTION
See student sheet for student’s score