CHAPTER 6 Inventories
Prob. 6–4B
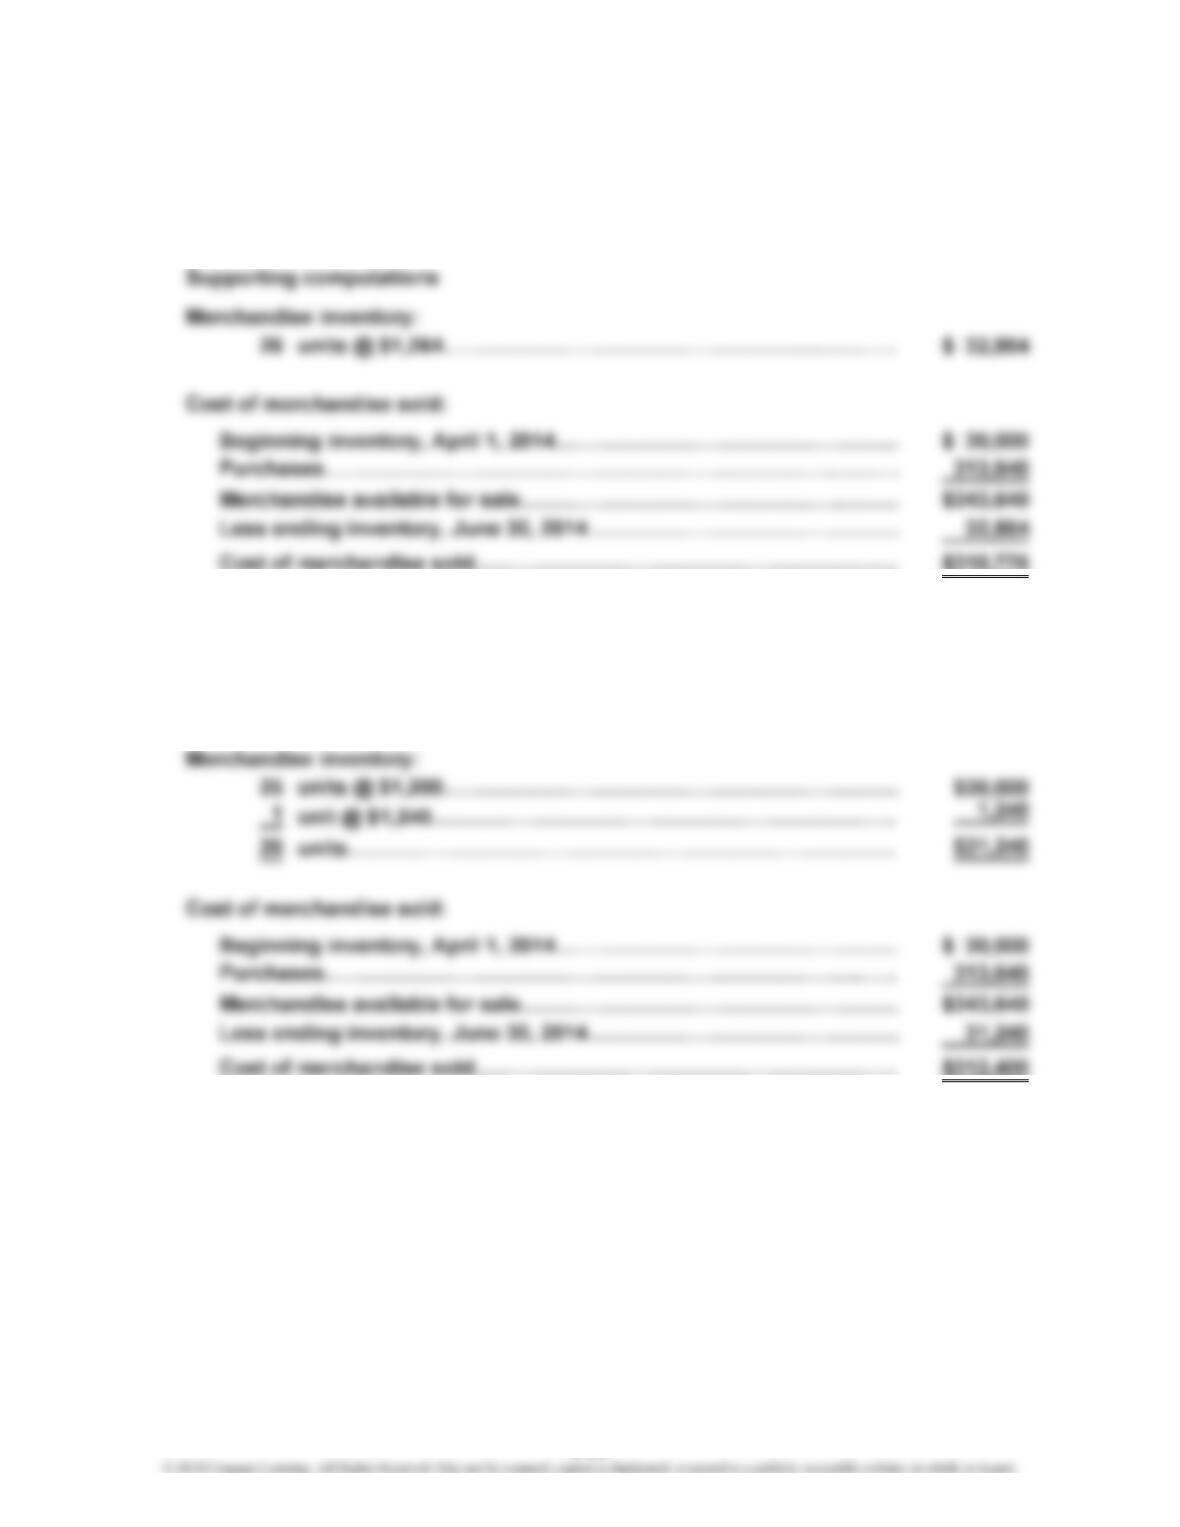
1. First-In, First-Out Method
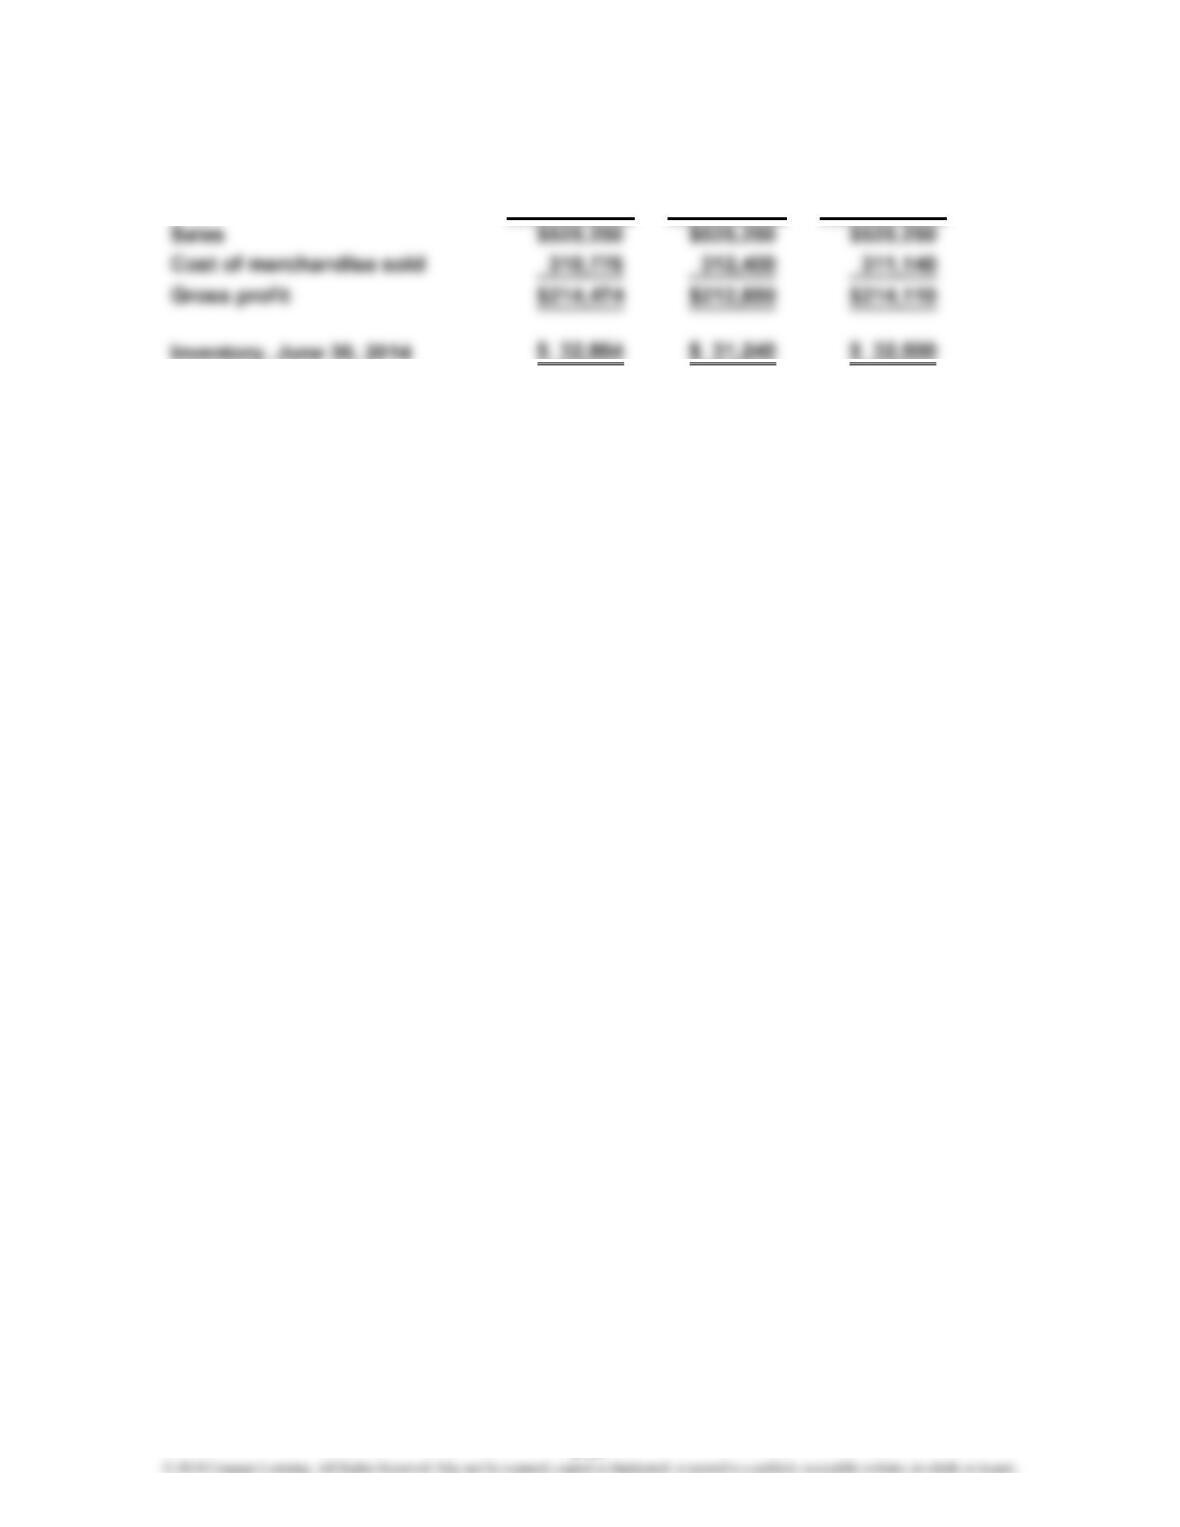
Merchandise inventory, June 30, 2014……………………………………
…
$ 32,864
Cost of merchandise sold………………………………………..…………
…
310,776
2. Last-In, First-Out Method
Merchandise inventory, June 30, 2014……………………………………
…
$ 31,240
Cost of merchandise sold…………………………………….……………… 312,400
Supporting computations
6-35
…
CHAPTER 6 Inventories
Prob. 6–4B (Continued)
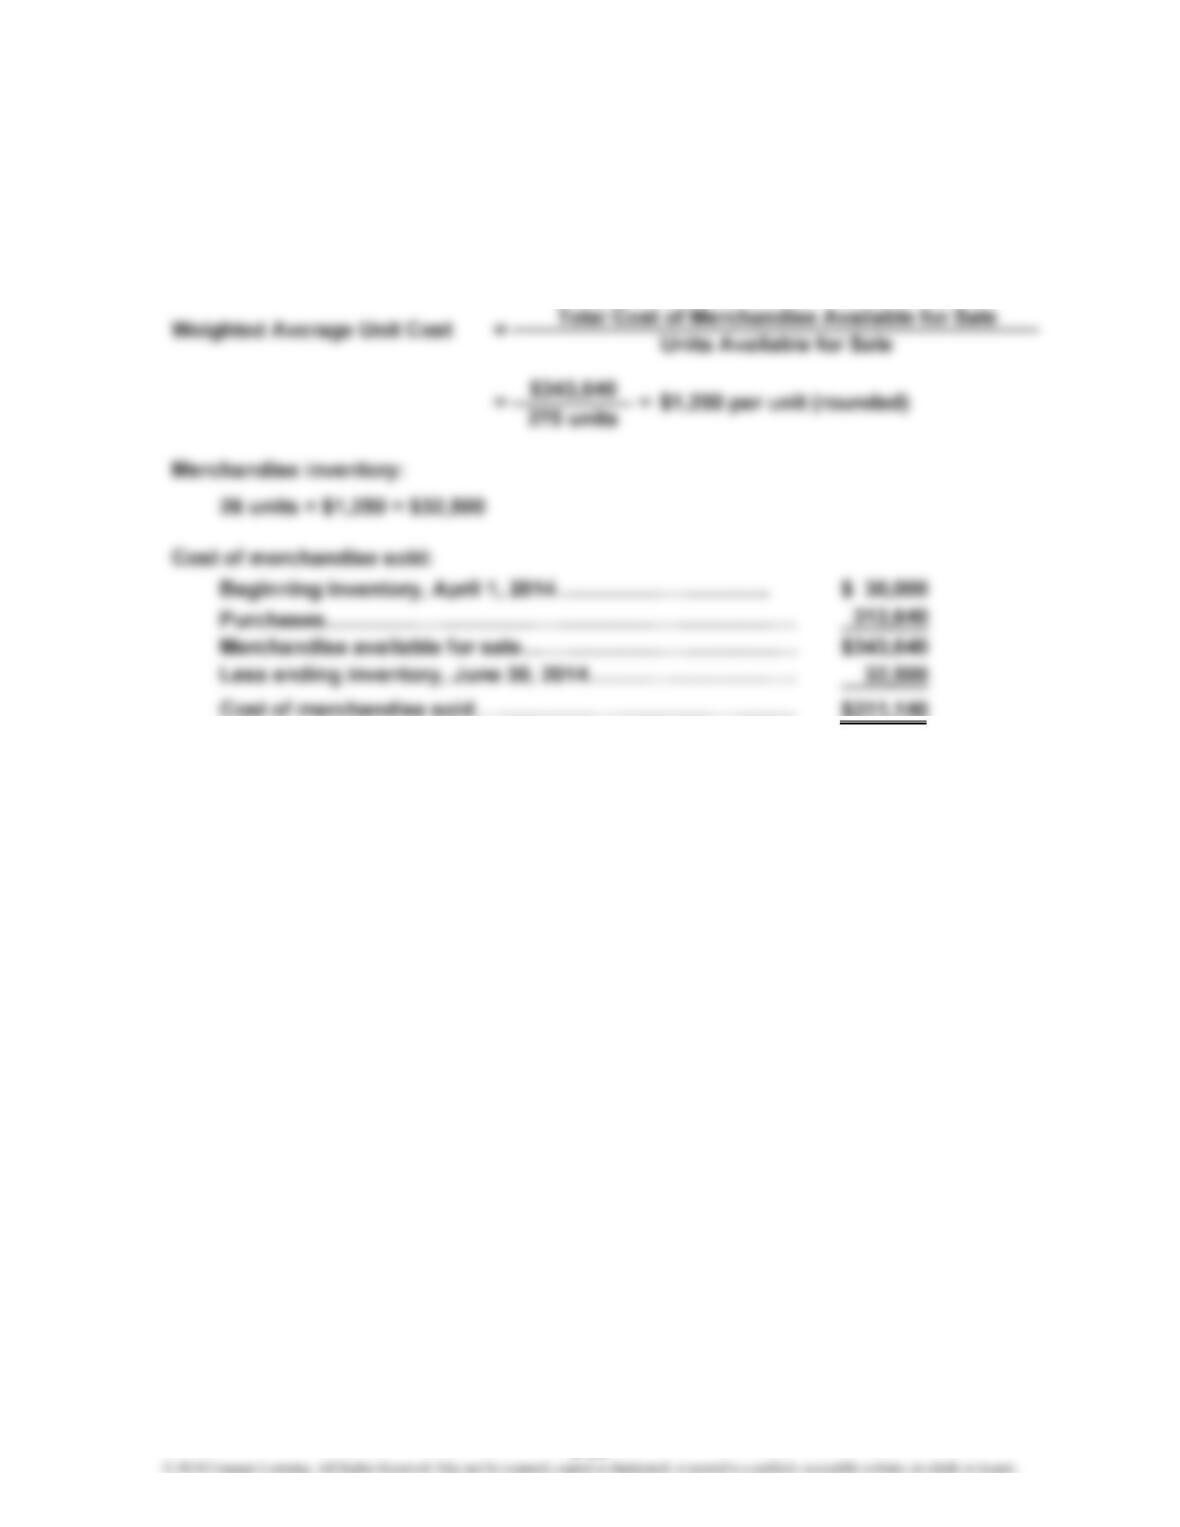
3. Weighted Average Cost Method
Merchandise inventory, June 30, 2014………………………
…
$ 32,500
Cost of merchandise sold………………………………………
…
311,140
Supporting computations
6-36
…
CHAPTER 6 Inventories
Prob. 6–4B (Concluded)
4. Weighted
FIFO LIFO Average
6-37
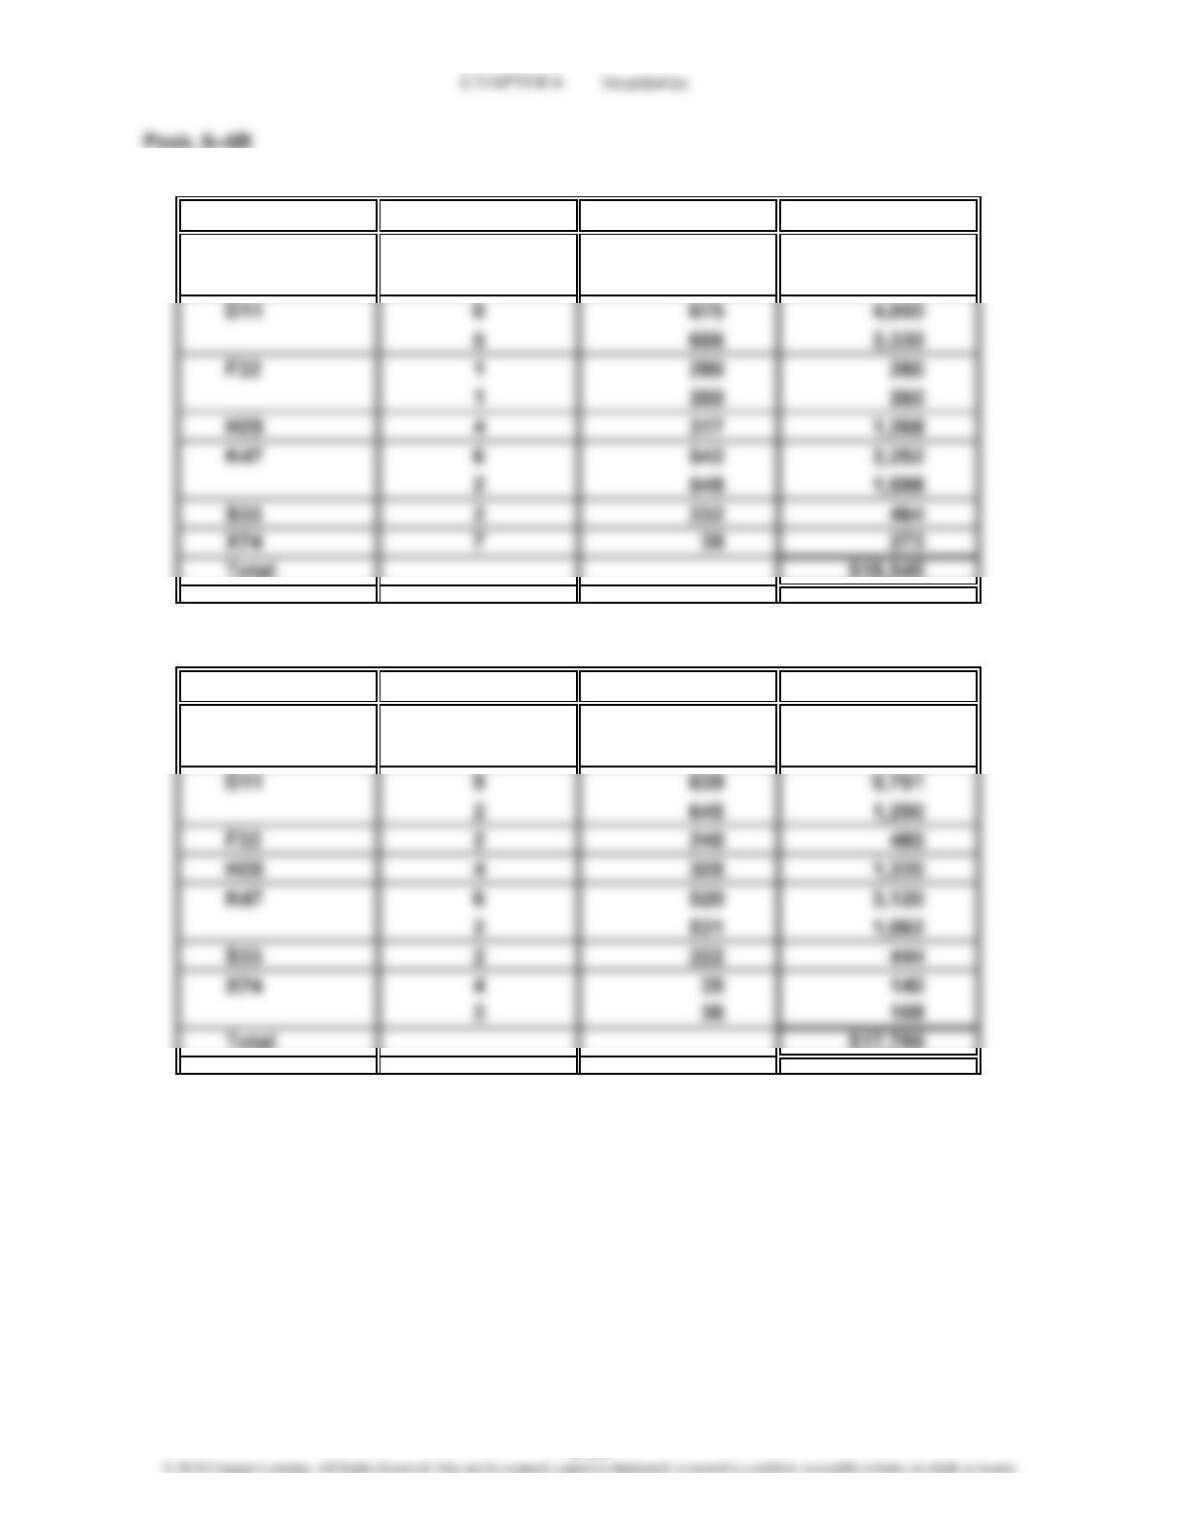
1. First-In, First-Out Method
Model Quantity Unit Cost Total Cost
C55 3 $1,070 $ 3,210
1 1,060 1,060
2. Last-In, First-Out Method
Model Quantity Unit Cost Total Cost
C55 3 $1,040 $ 3,120
1 1,054 1,054
6-38
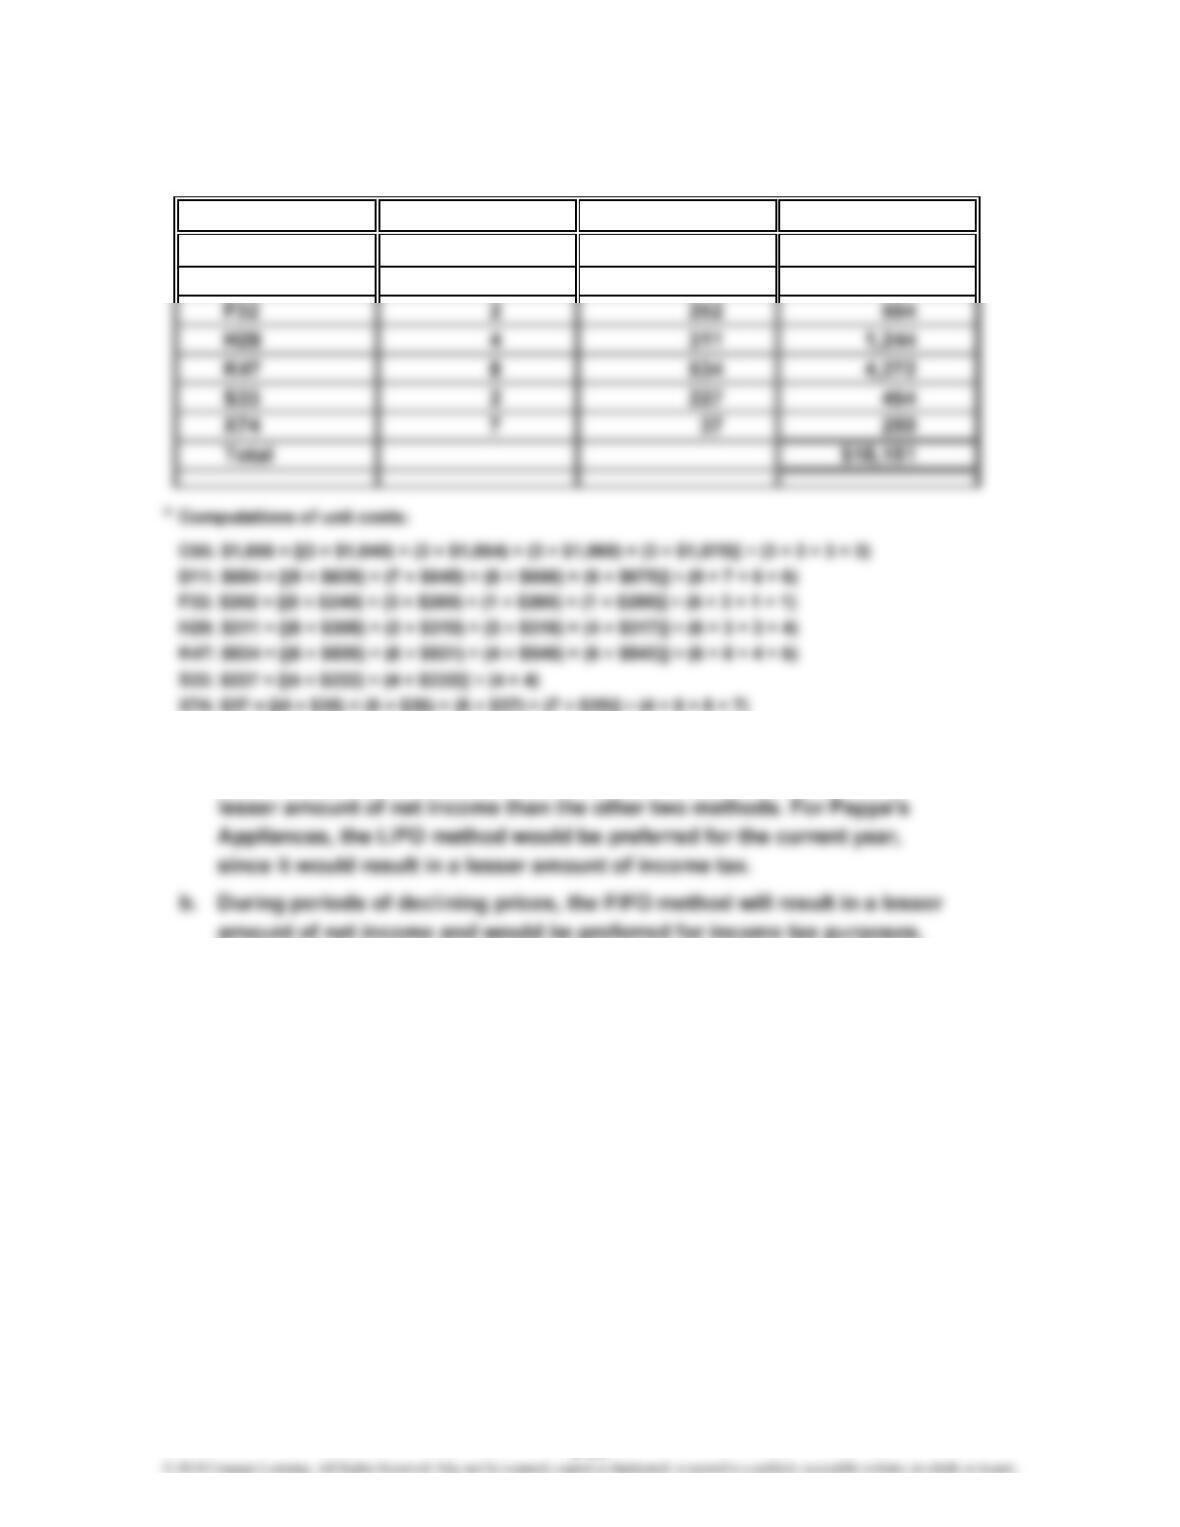
CHAPTER 6 Inventories
Prob. 6–5B (Concluded)
3. Weighted Average Cost Method
Quantity Unit Cost*Total Cost
4 $1,056 $ 4,224
11 654 7,194
4. a. During periods of rising prices, the LIFO method will result in a lower cost
of inventory, a greater amount of cost of merchandise sold, and a
Model
C55
D11
6-39
CHAPTER 6 Inventories
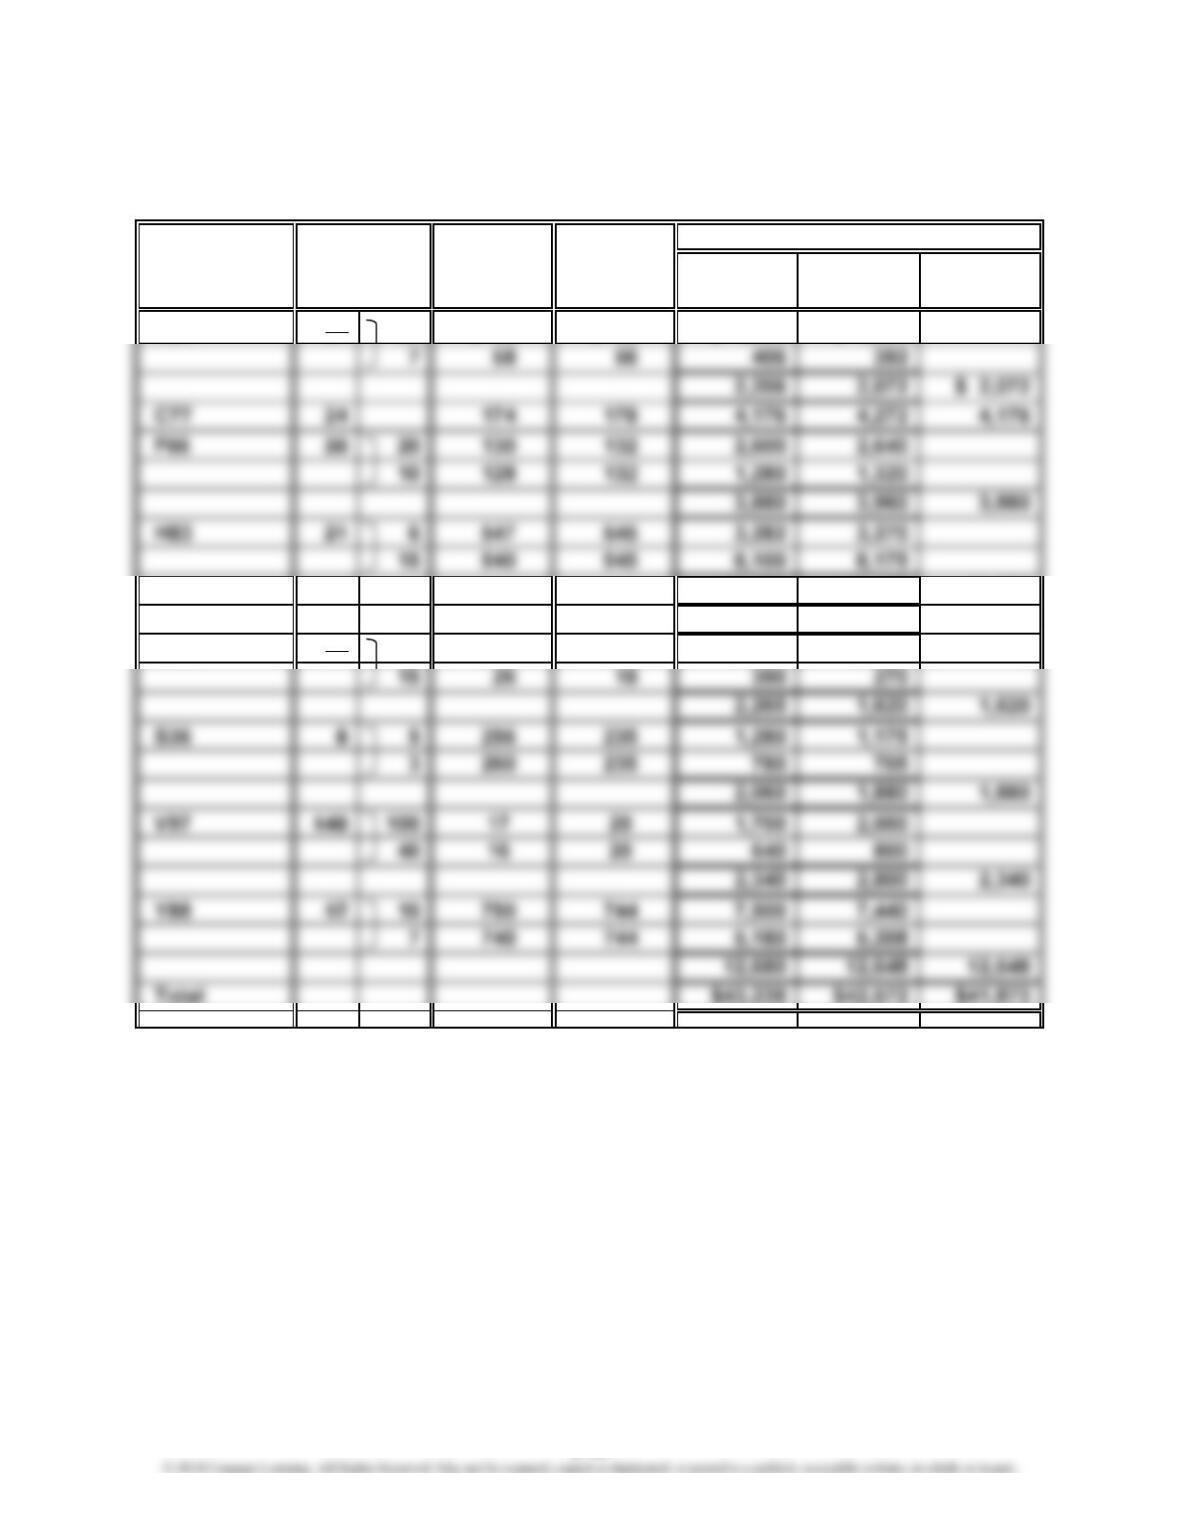
Prob. 6–6B
Unit Unit
Cost Market Lower of
Commodity Price Price Cost Market C or M
A54 37 30 $ 60 $ 56 $ 1,800 $ 1,680
11,382 11,445 11,382
K12 375 6 5 2,250 1,875 1,875
Q58 90 75 25 18 1,875 1,350
Quantity
Inventory Sheet
December 31, 2014
Inventory
Total
6-40
CHAPTER 6 Inventories
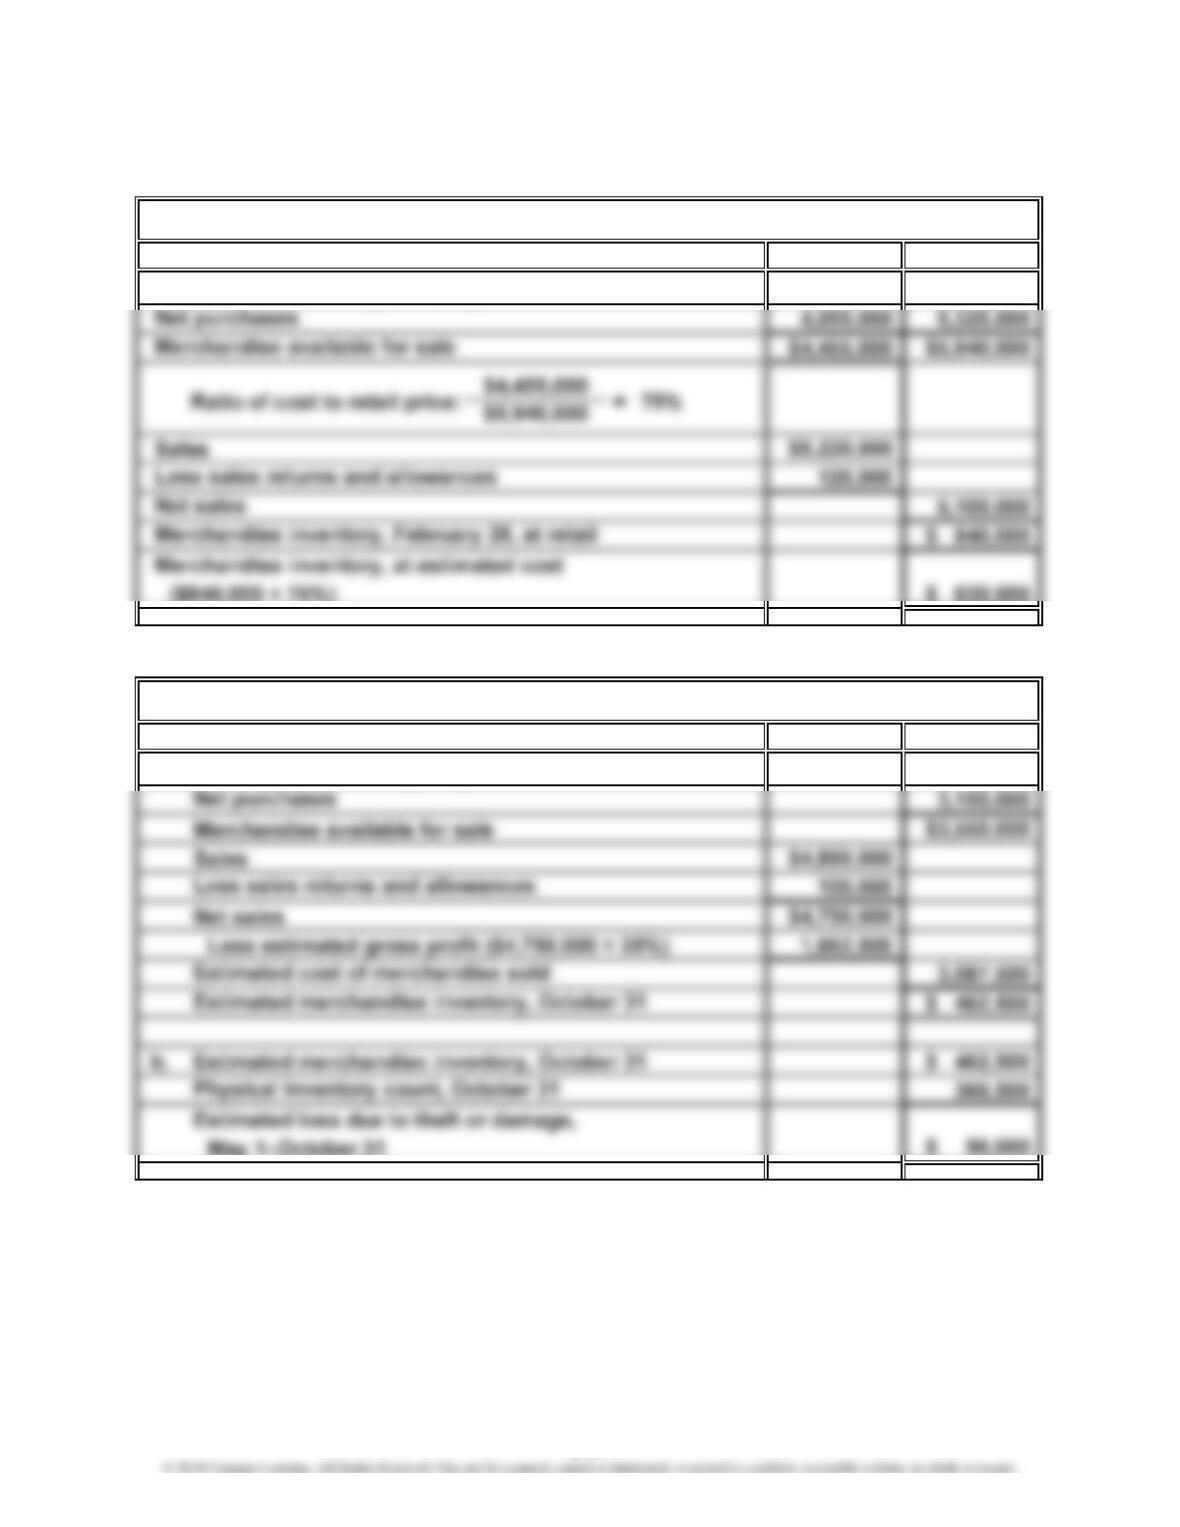
Appendix Prob. 6–7B
1.
Cost Retail
Merchandise inventory, February 1 $ 400,000 $ 615,000
2.
Cost
a. Merchandise inventory, May 1 $ 400,000
JAFFE CO.
CORONADO CO.
6-41
CHAPTER 6 Inventories
CP 6–1
Since the title to merchandise shipped FOB shipping point passes to the buyer when
CP 6–2
In developing a response to Paula’s concerns, you should probably first emphasize
the practical need for an assumption concerning the flow of cost of goods purchased
and sold. That is, when identical goods are frequently purchased, it may not be
practical to specifically identify each item of inventory. If all the identical goods were
CASES & PROJECTS
6-42
CHAPTER 6 Inventories
CP 6–3
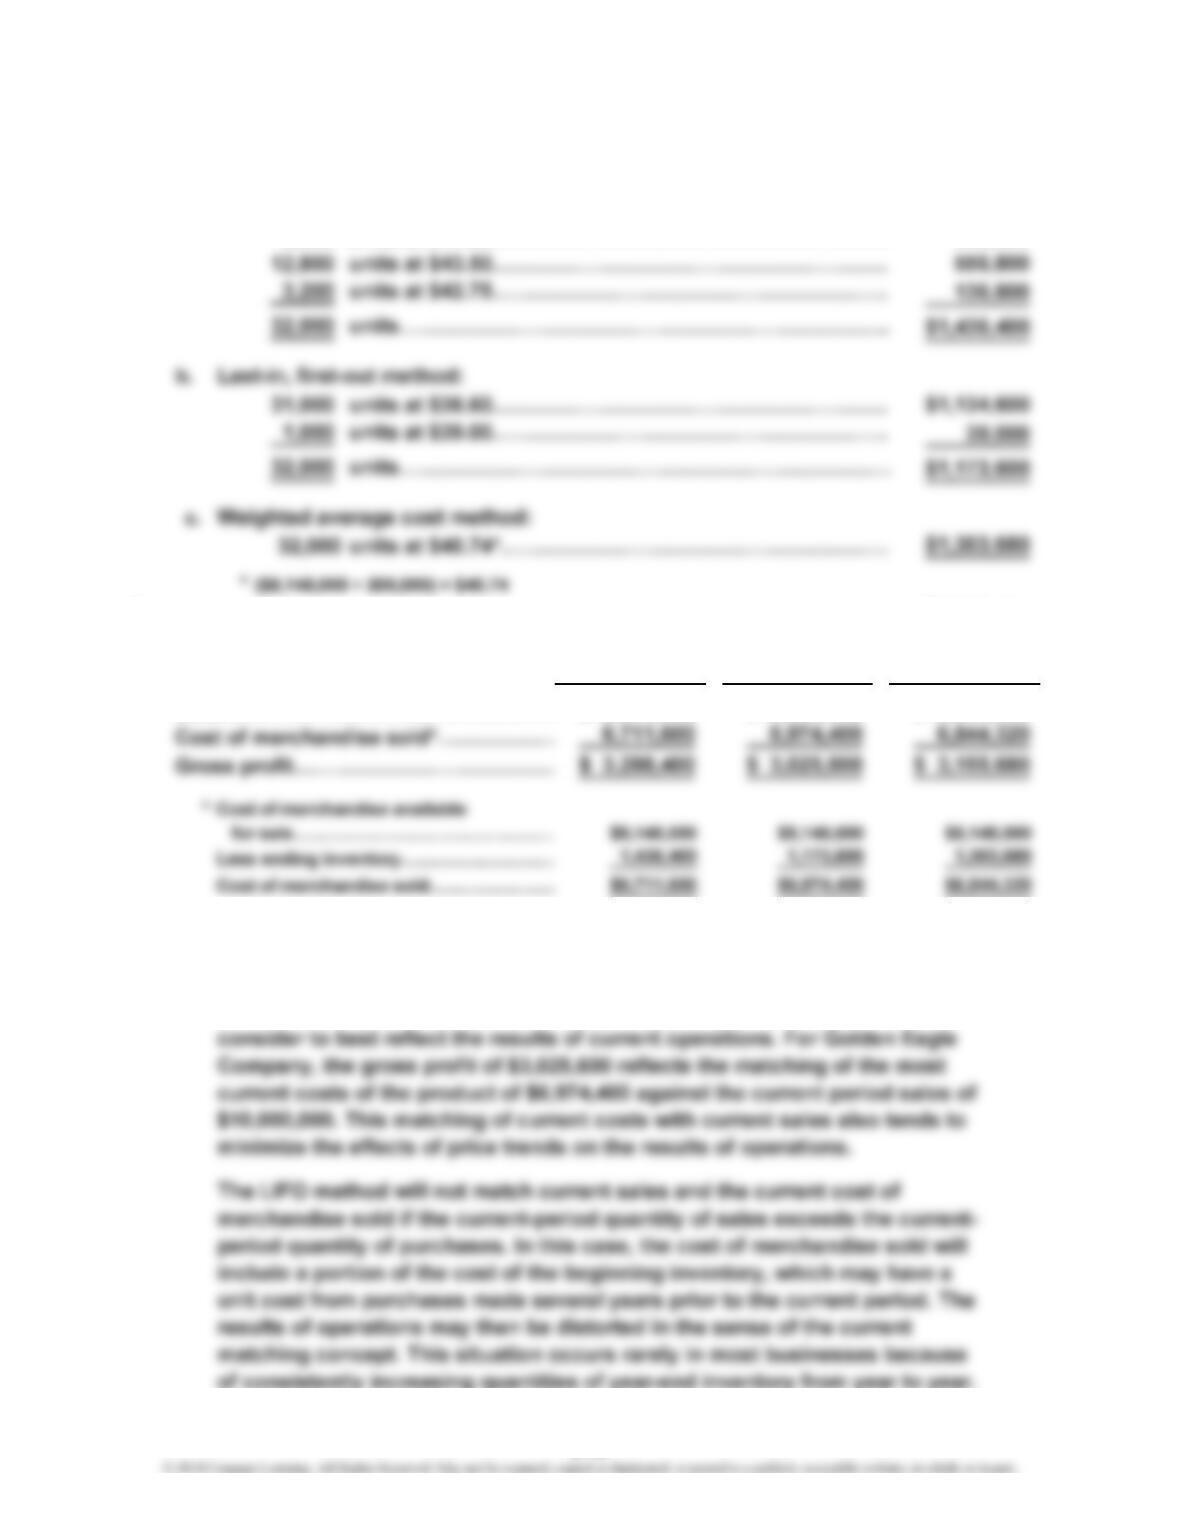
1. a. First-in, first-out method:
8,000 units at $48.00………………………………………………… $ 384,000
8,000 units at $44.85………………………………………………… 358,800
2. Weighted
Average
FIFO LIFO Cost
Sales………………………………………
…
$10,000,000 $10,000,000 $10,000,000
…
3. a. The LIFO method is often viewed as the best basis for reflecting income
from operations. This is because the LIFO method matches the most current
cost of merchandise purchases against current sales. The matching of
current costs with current sales results in a gross profit amount that many
6-43
CHAPTER 6 Inventories
CP 6–3 (Continued)
While the LIFO method is often viewed as the best method for matching
revenues and expenses, the FIFO method is often consistent with the
physical movement of merchandise in a business, since most businesses
tend to dispose of commodities in the order of their acquisition. To the extent
physical flow of goods concepts equally.
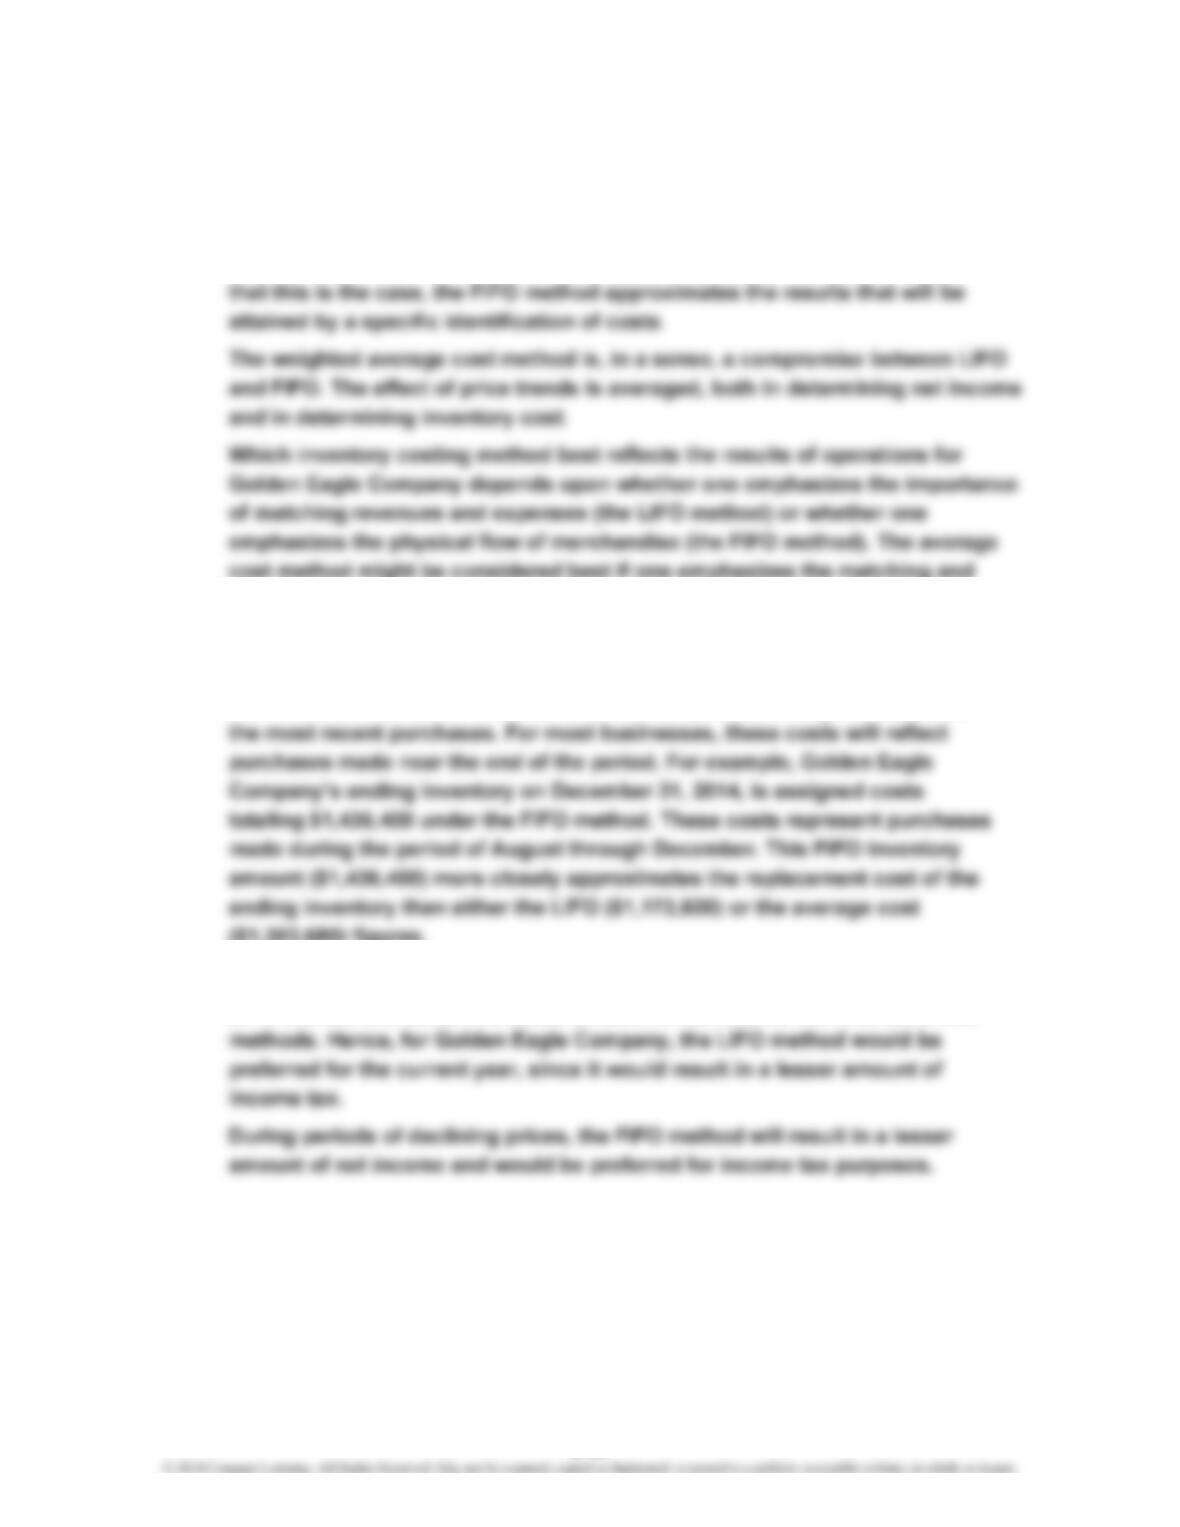
b. The FIFO method provides the best reflection of the replacement cost of the
ending inventory for the balance sheet. This is because the amount reported
on the balance sheet for merchandise inventory will be assigned costs from
($1,303,680) figures.
c. During periods of rising prices, such as shown for Golden Eagle Company, the
LIFO method will result in a lesser amount of net income than the other two
6-44
CP 6–3 (Concluded)
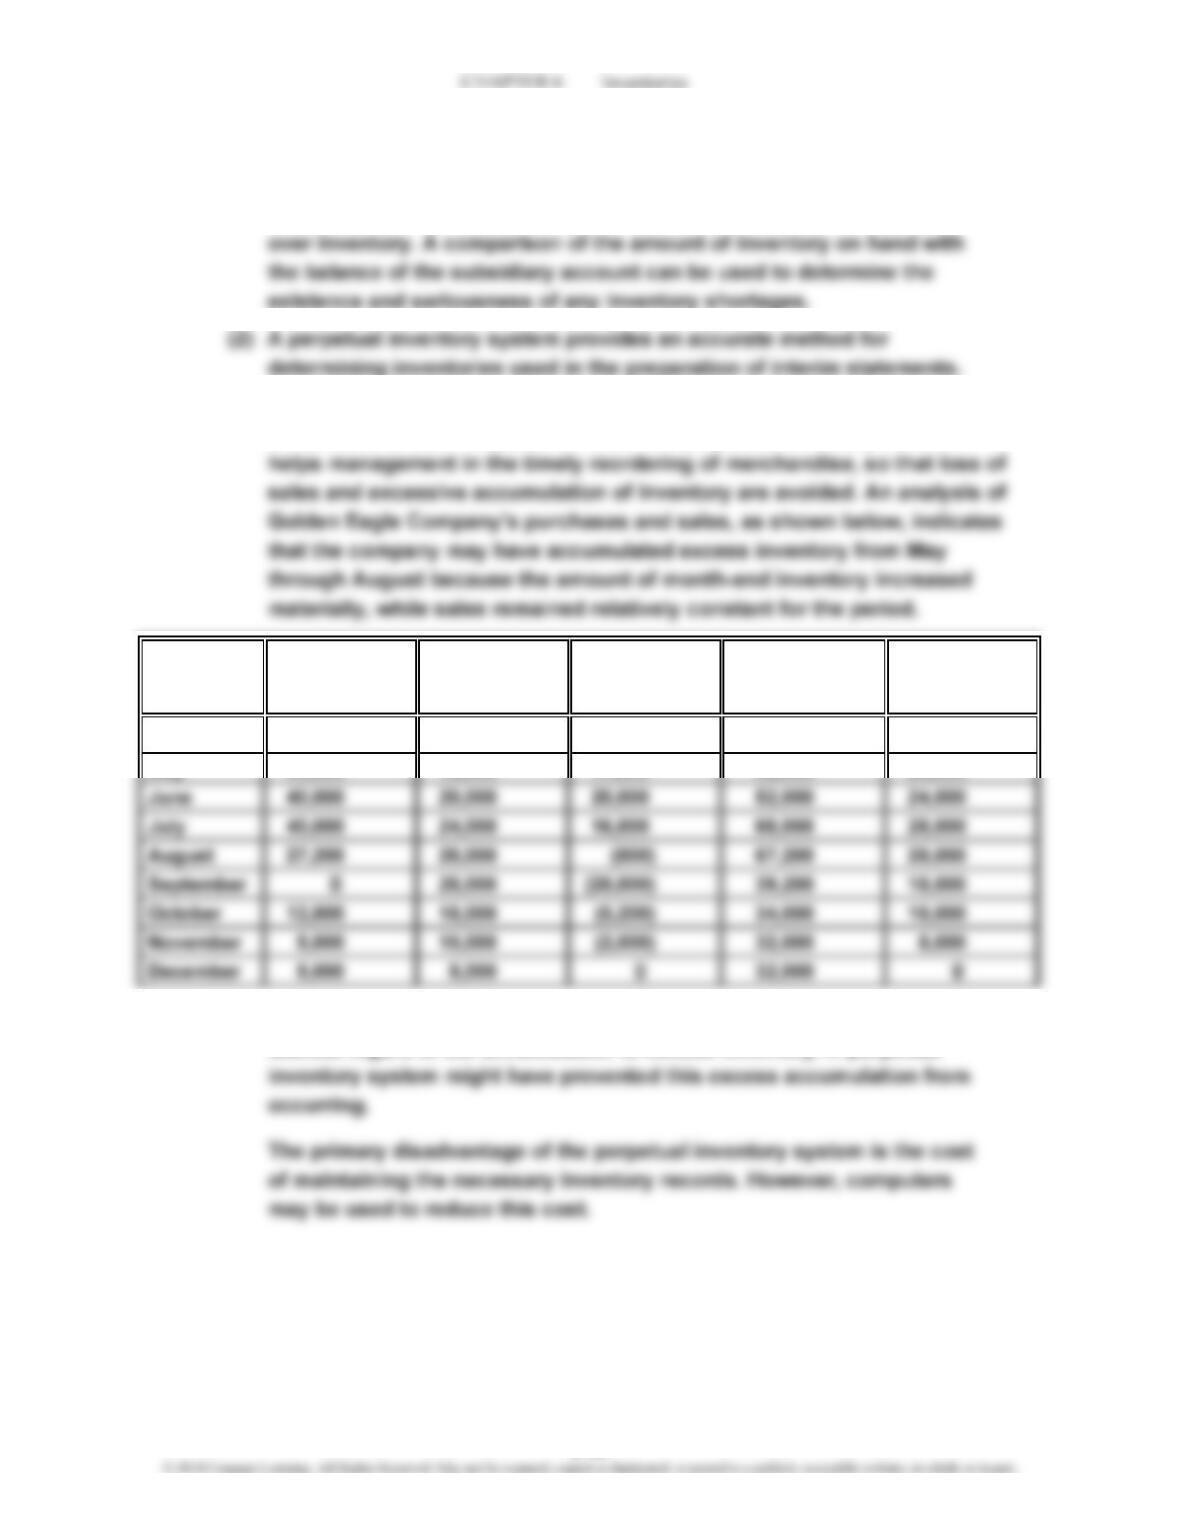
d. The advantages of the perpetual inventory system include the following:
(1) A perpetual inventory system provides an effective means of control
(3) A perpetual inventory system provides an aid for maintaining inventories
at optimum levels. Frequent review of the perpetual inventory records
April 31,000 units 16,000 units 15,000 units 15,000 units 16,000 units
May 33,000 16,000 17,000 32,000 20,000
It appears that during April through July, the company ordered inventory
without regard to the accumulation of excess inventory. A perpetual
(Decrease) in
Sales Inventor
y
Month Purchases
Increase
End of Month Sales
Inventory at Next Month’s
6-45
CHAPTER 6 Inventories
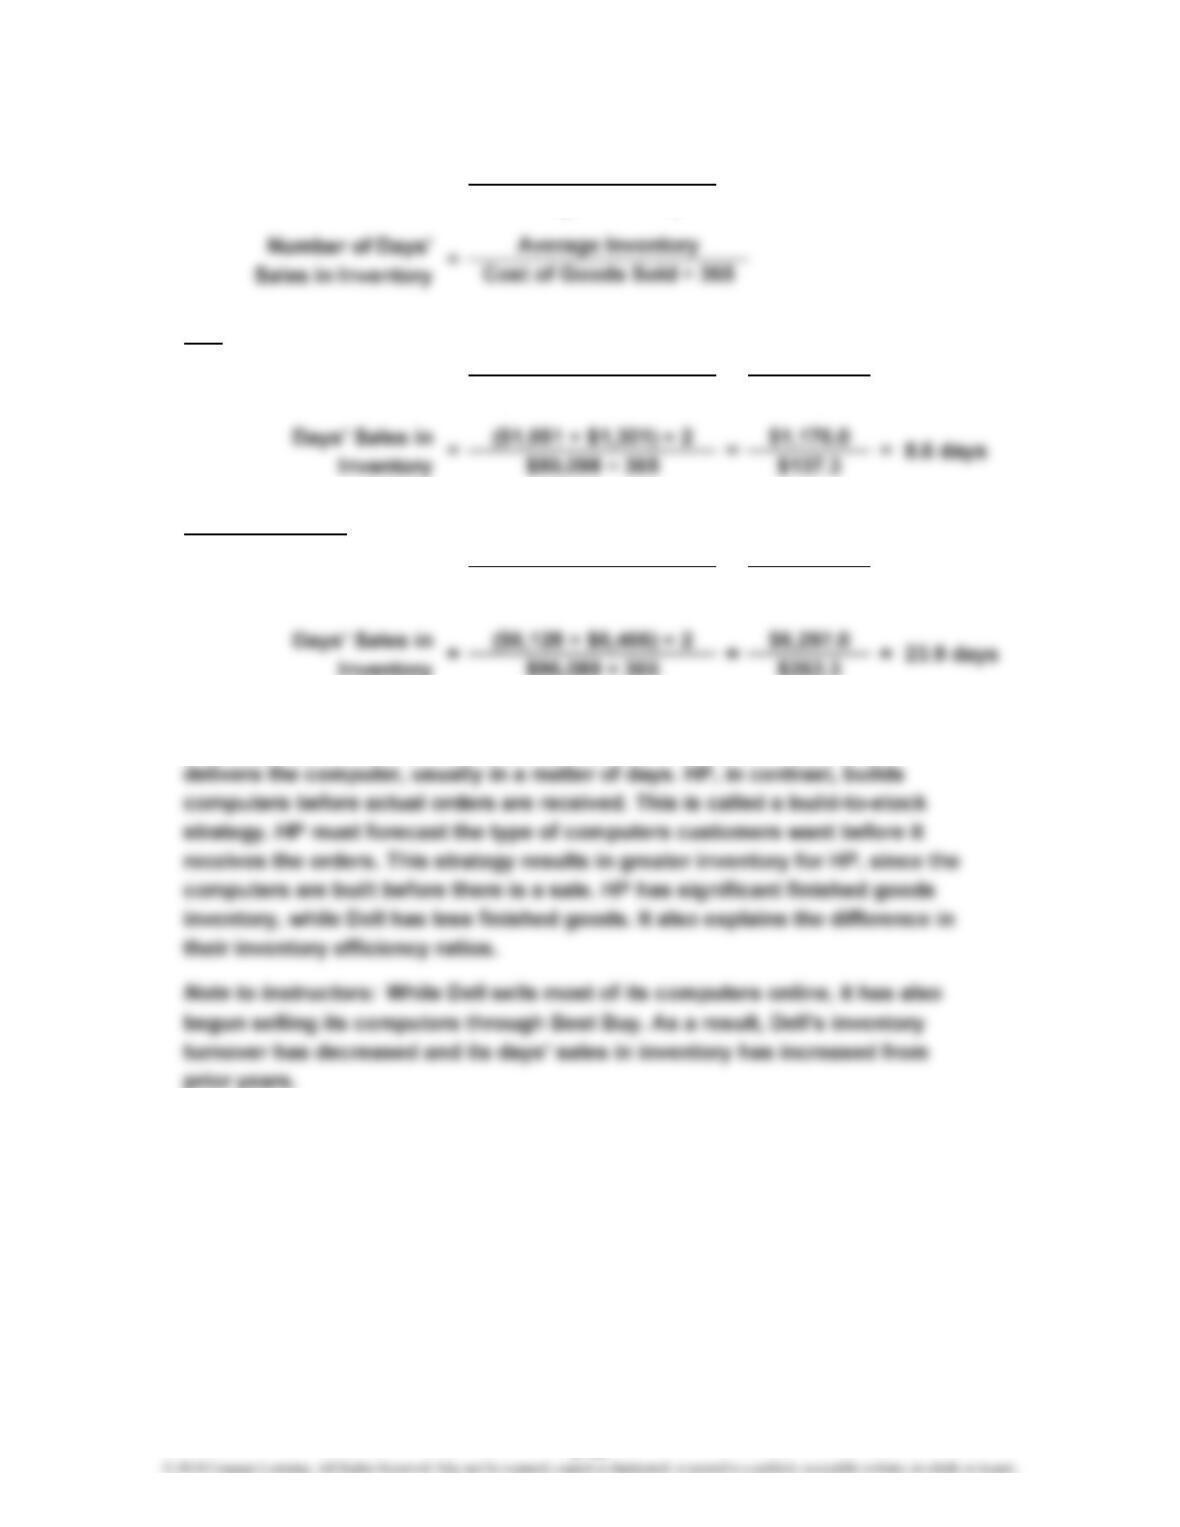
CP 6–4
Cost of Goods Sold
Average Inventory
Dell
$50,098 $50,098
($1,051 + $1,301) ÷ 2 $1,176.0
Hewlett-Packard
$96,089 $96,089
($6,128 + $6,466) ÷ 2 $6,297.0
Inventory $96,089 ÷ 365 $263.3
b. Dell builds its computers primarily to a customer order, called a build-to-order
strategy. Customers place their orders on the Internet. Dell then builds and
Inventory Turnovera.
42.6Inventory Turnover = = =
=
15.3
Inventory Turnover = = =
6-46
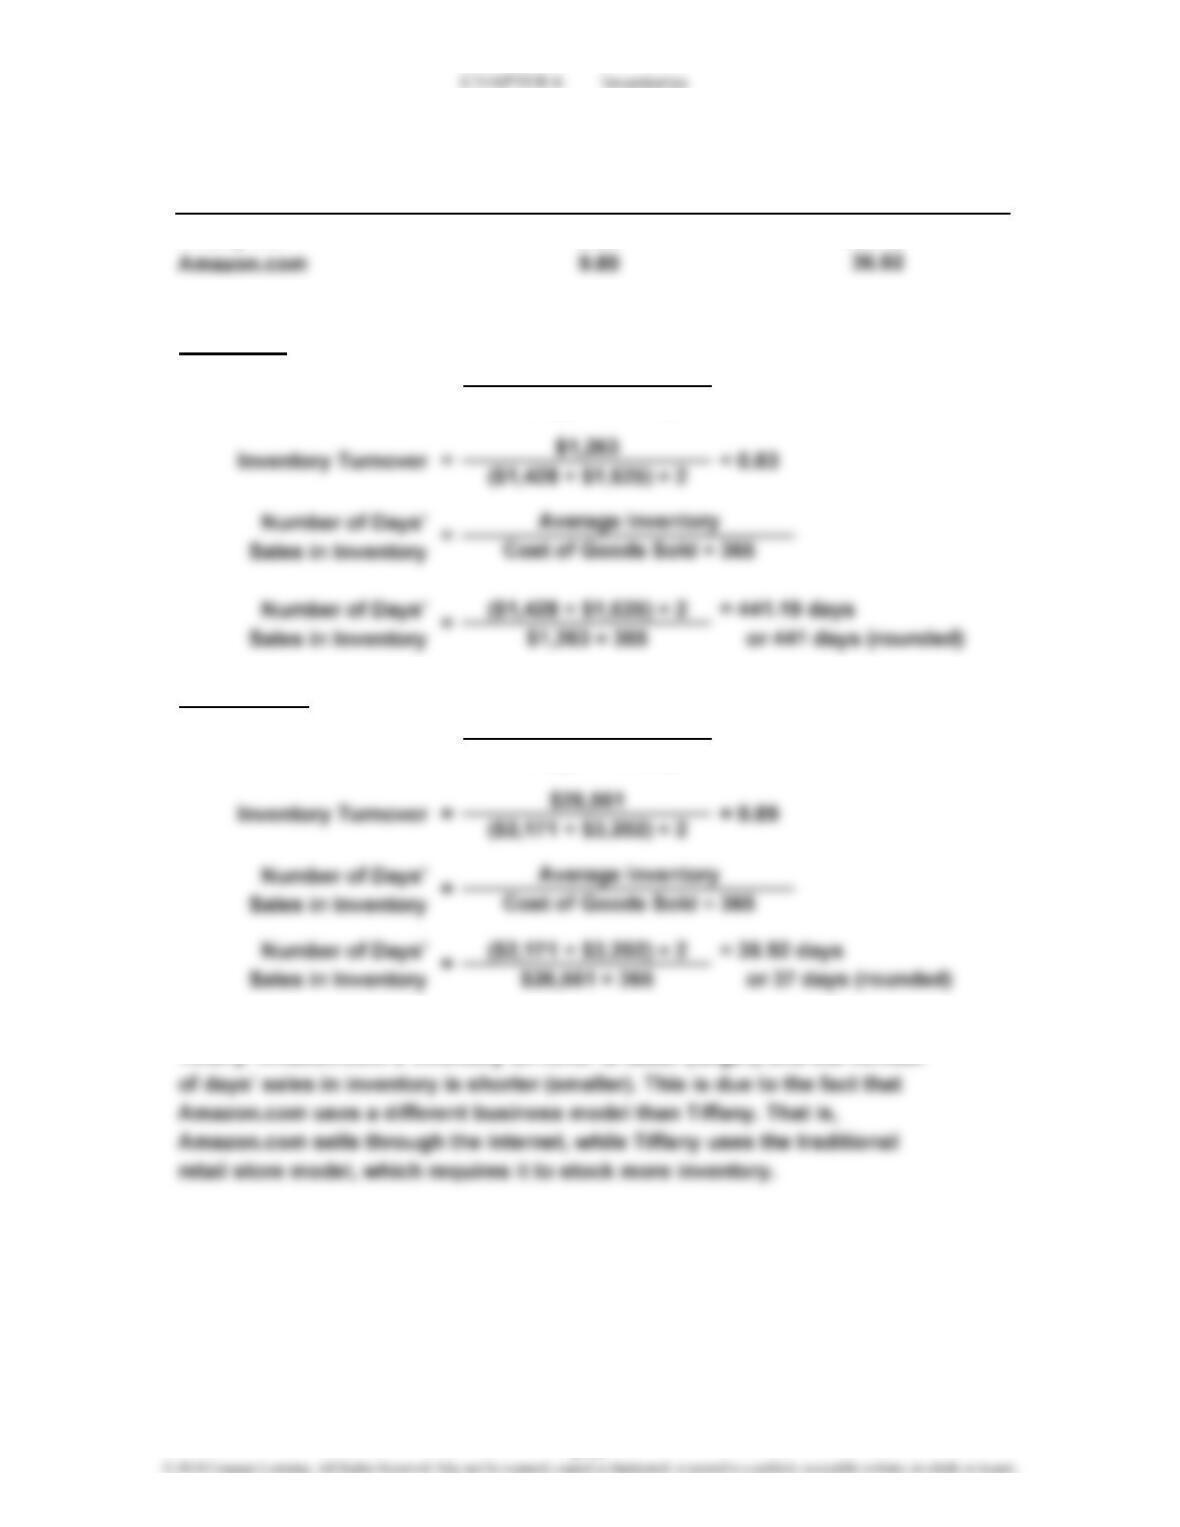
CP 6–5
Inventory
Turnover
0.83
Computations:
Tiffany Co.
Cost of Goods Sold
Average Inventory
Amazon.com
Cost of Goods Sold
Average Inventory
b. Amazon.com has a smaller investment in inventory for its volume than does
Tiffany. Amazon.com’s inventory turnover is faster (larger), and the number
Inventory Turnover
=
a. Number of Days’
Sales in Inventory
=Inventory Turnover
Tiffany Co. 441.15
6-47
CHAPTER 6 Inventories
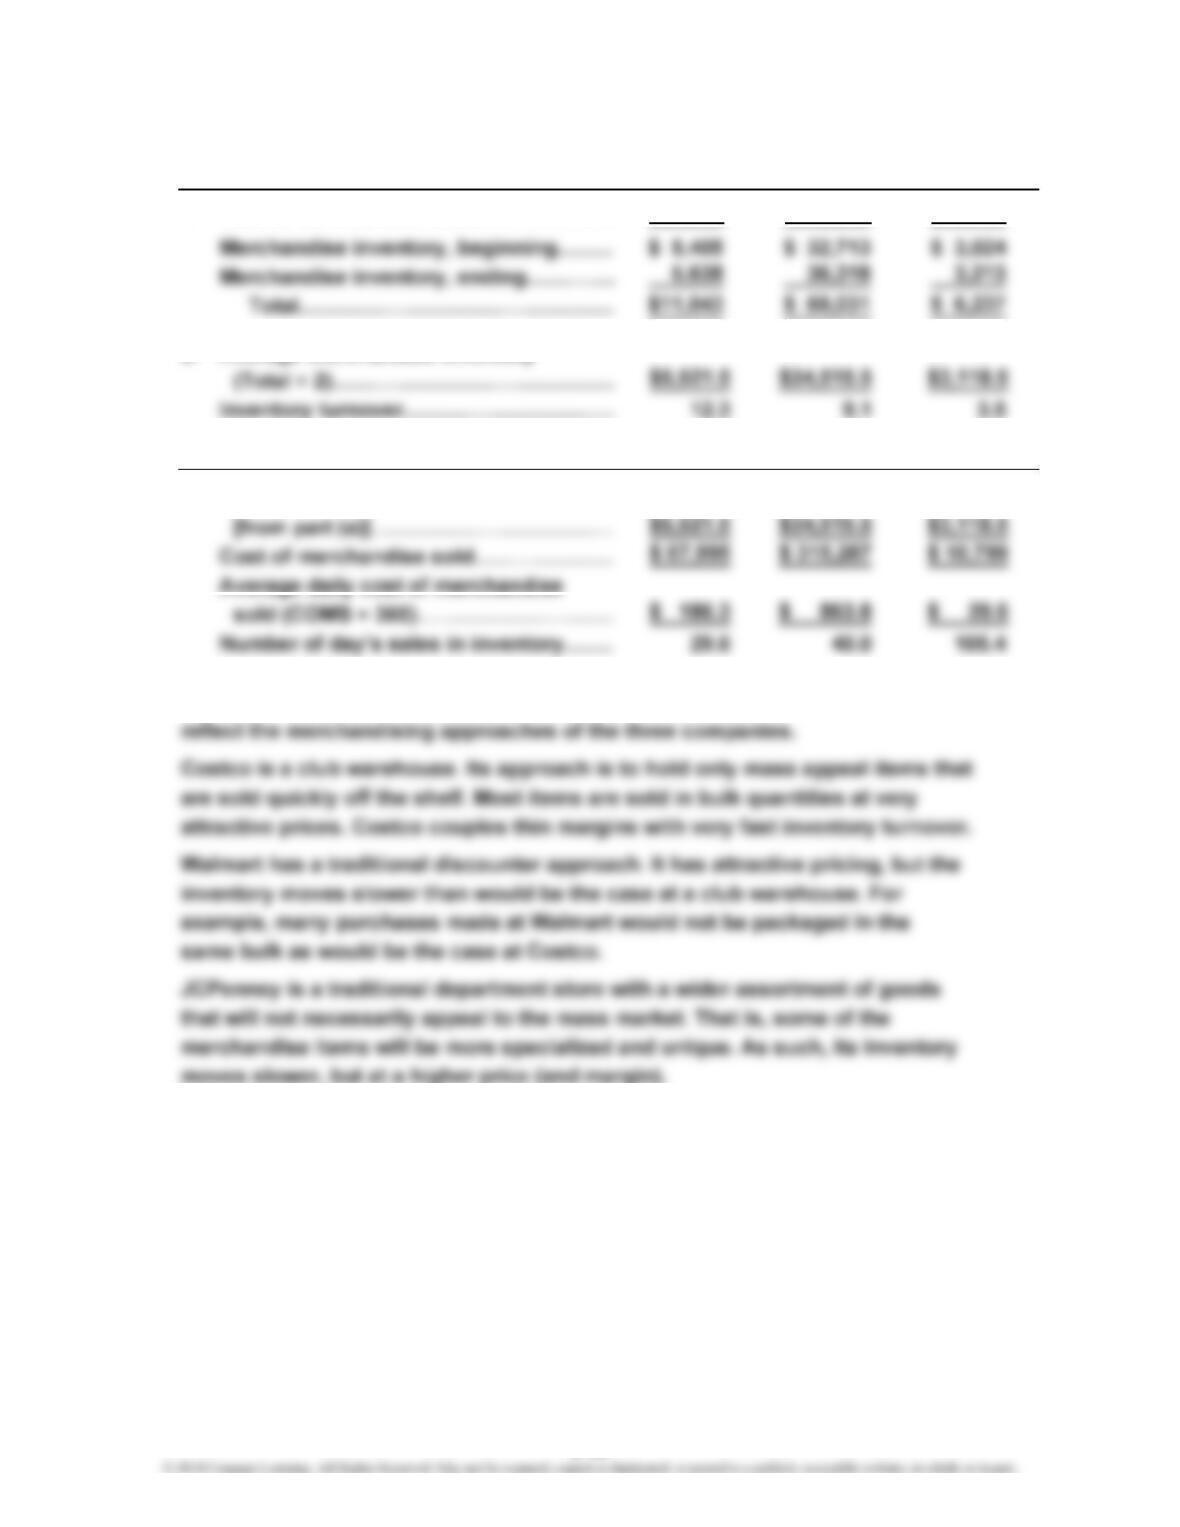
CP 6–6
a. Costco Walmart JCPenney
1. Cost of merchandise sold………………
…
$67,995 $315,287 $10,799
2. Average merchandise inventory
b. Costco Walmart JCPenney
1. Average merchandise inventory
…
c. Both the inventory turnover ratio and the number of day’s sales in inventory
6-48
…