CHAPTER 6 Inventories
Prob. 6–1A (Concluded)
2. Accounts Receivable 483,800
Sales 483,800
*
6-21
CHAPTER 6 Inventories
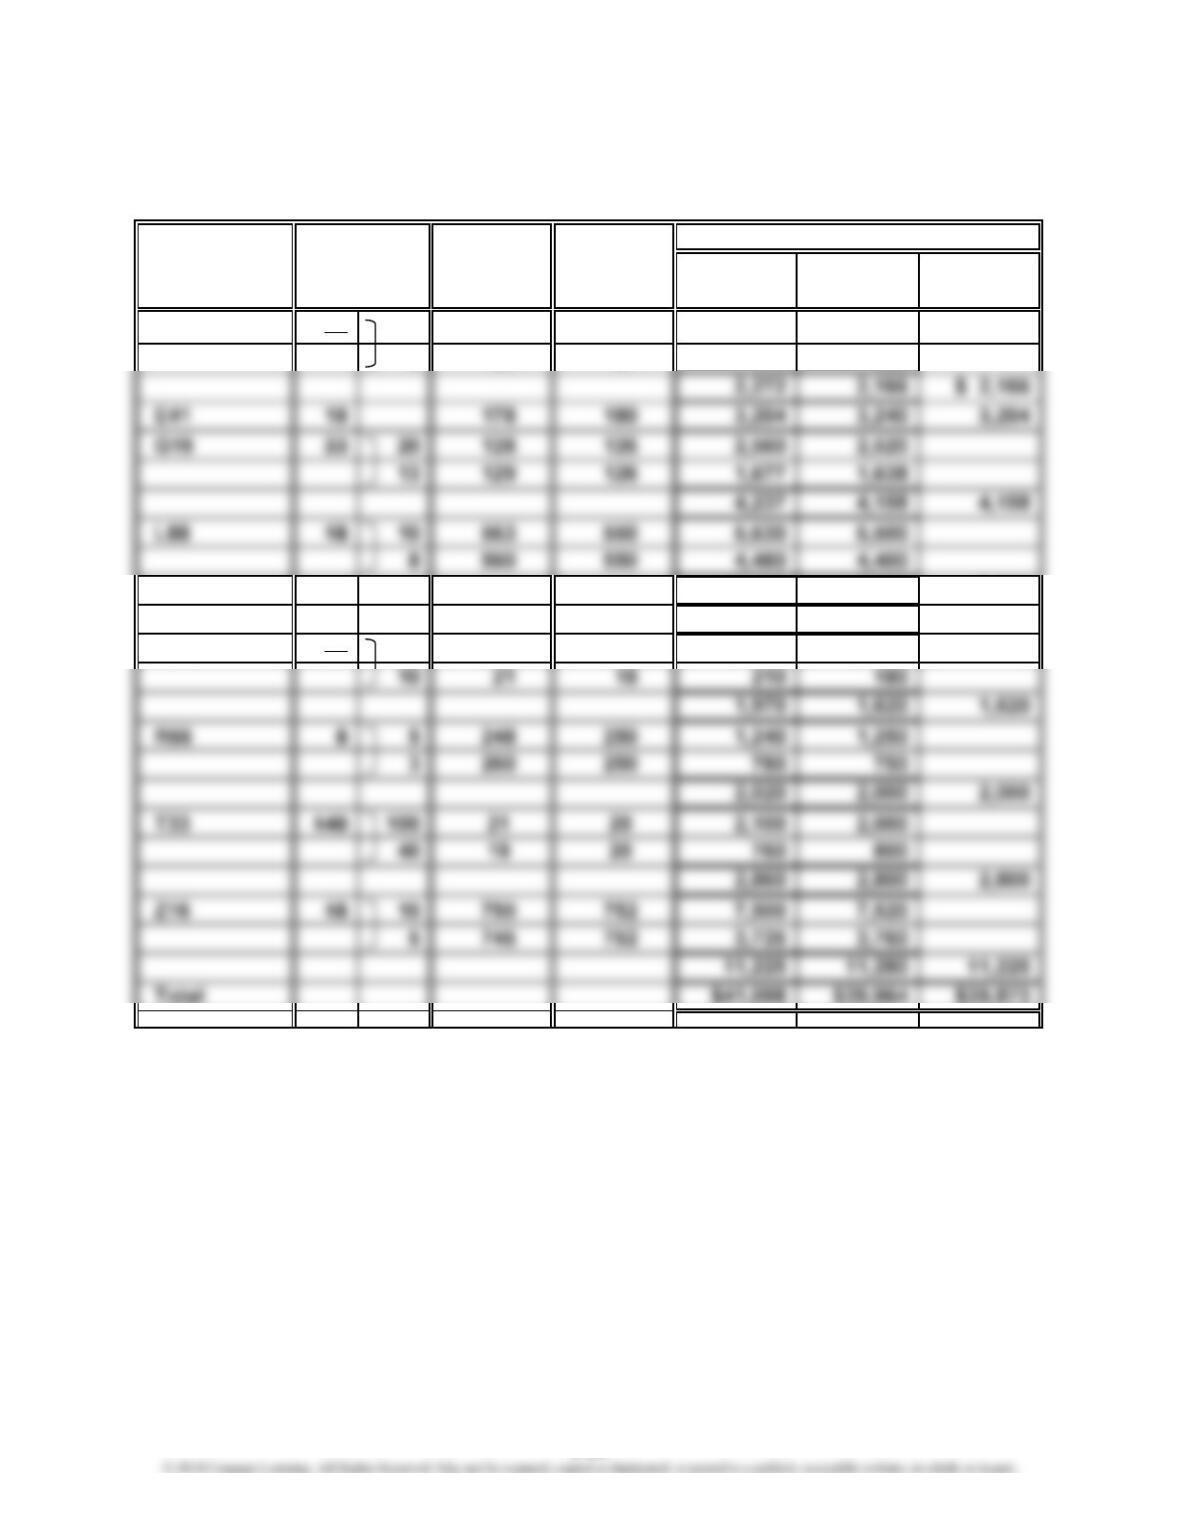
Prob. 6–2A
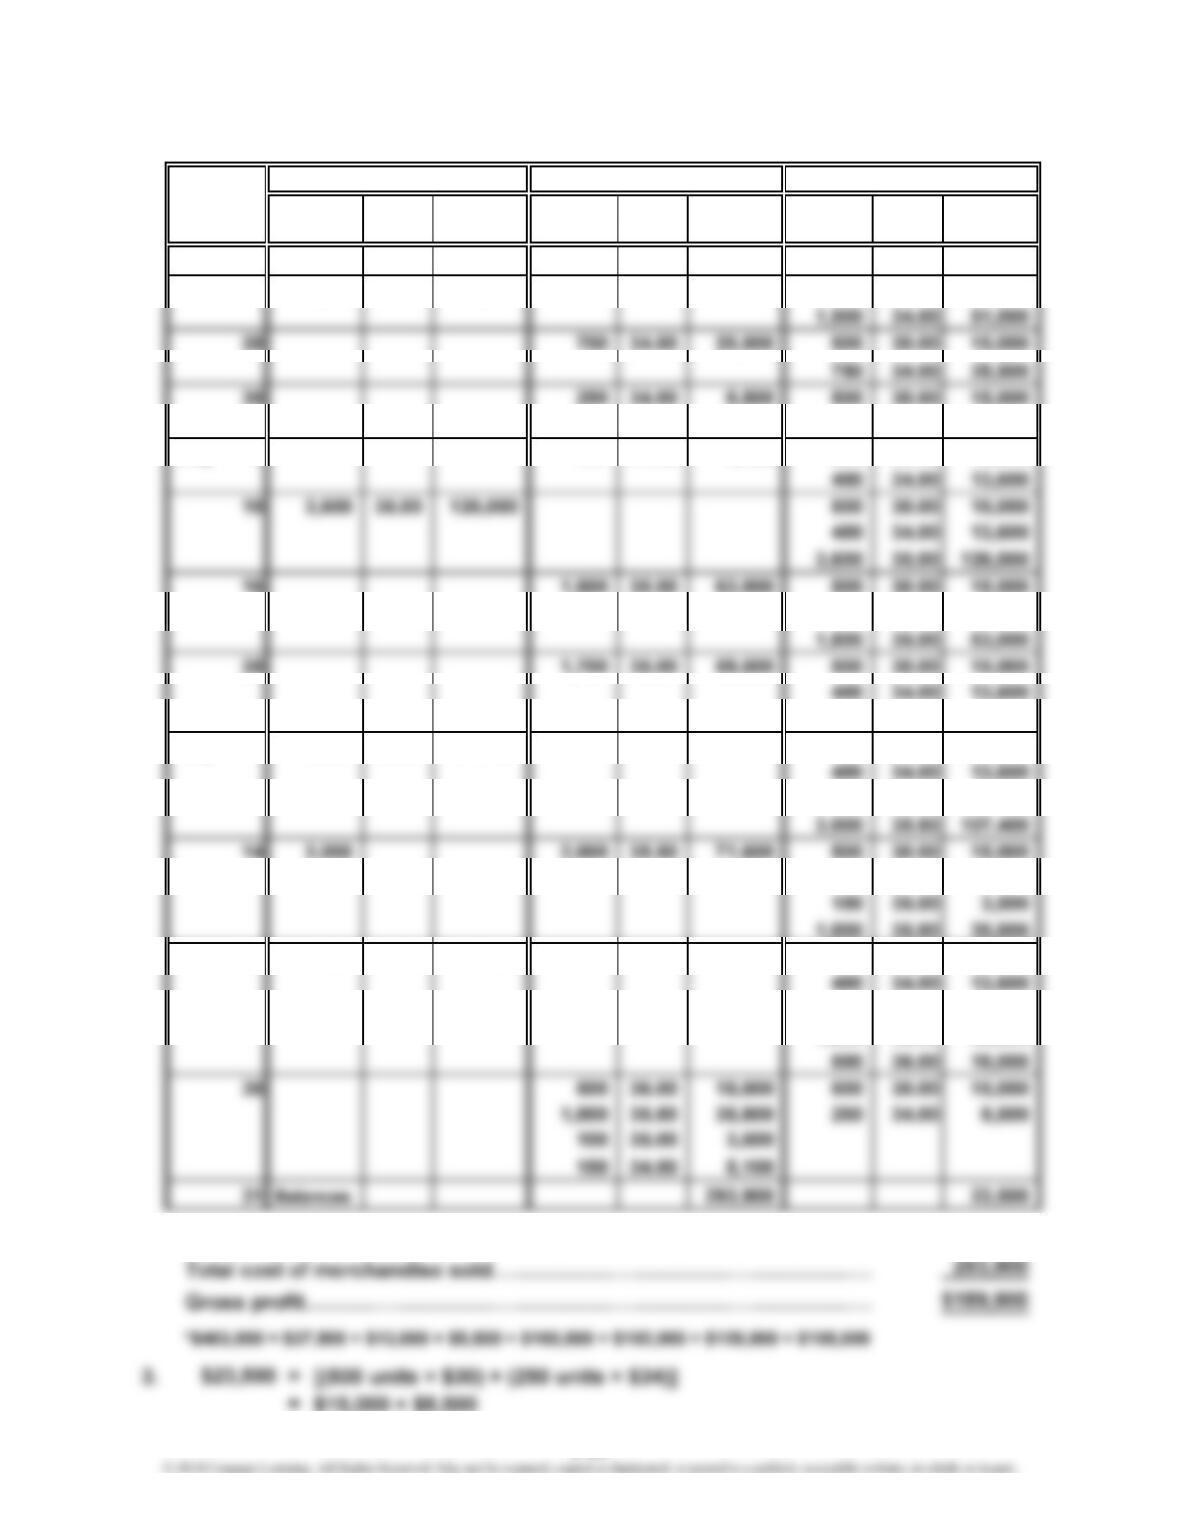
1.
Unit Total Unit Total Unit Total
Cost Cost Quantity Cost Cost Quantity Cost Cost
June 1 500 30.00 15,000
10 34.00 51,000 500 30.00 15,000
500 34.00 17,000
July 5 100 34.00 3,400 500 30.00 15,000
16 1,800 35.00 63,000 500 30.00 15,000
400 34.00 13,600
100 35.00 3,500
Aug. 5 35.80 107,400 500 30.00 15,000
100 35.00 3,500
400 34.00 13,600
25 36.00 18,000 500 30.00 15,000
100 35.00 3,500
1,000 35.80 35,800
2. Total sales………………………………………………………………………
…
500
3,000
1,500
$483,800
Cost of Merchandise Sold Inventory
Date
Purchases
Quantity
*
6-22
CHAPTER 6 Inventories
Prob. 6–3A
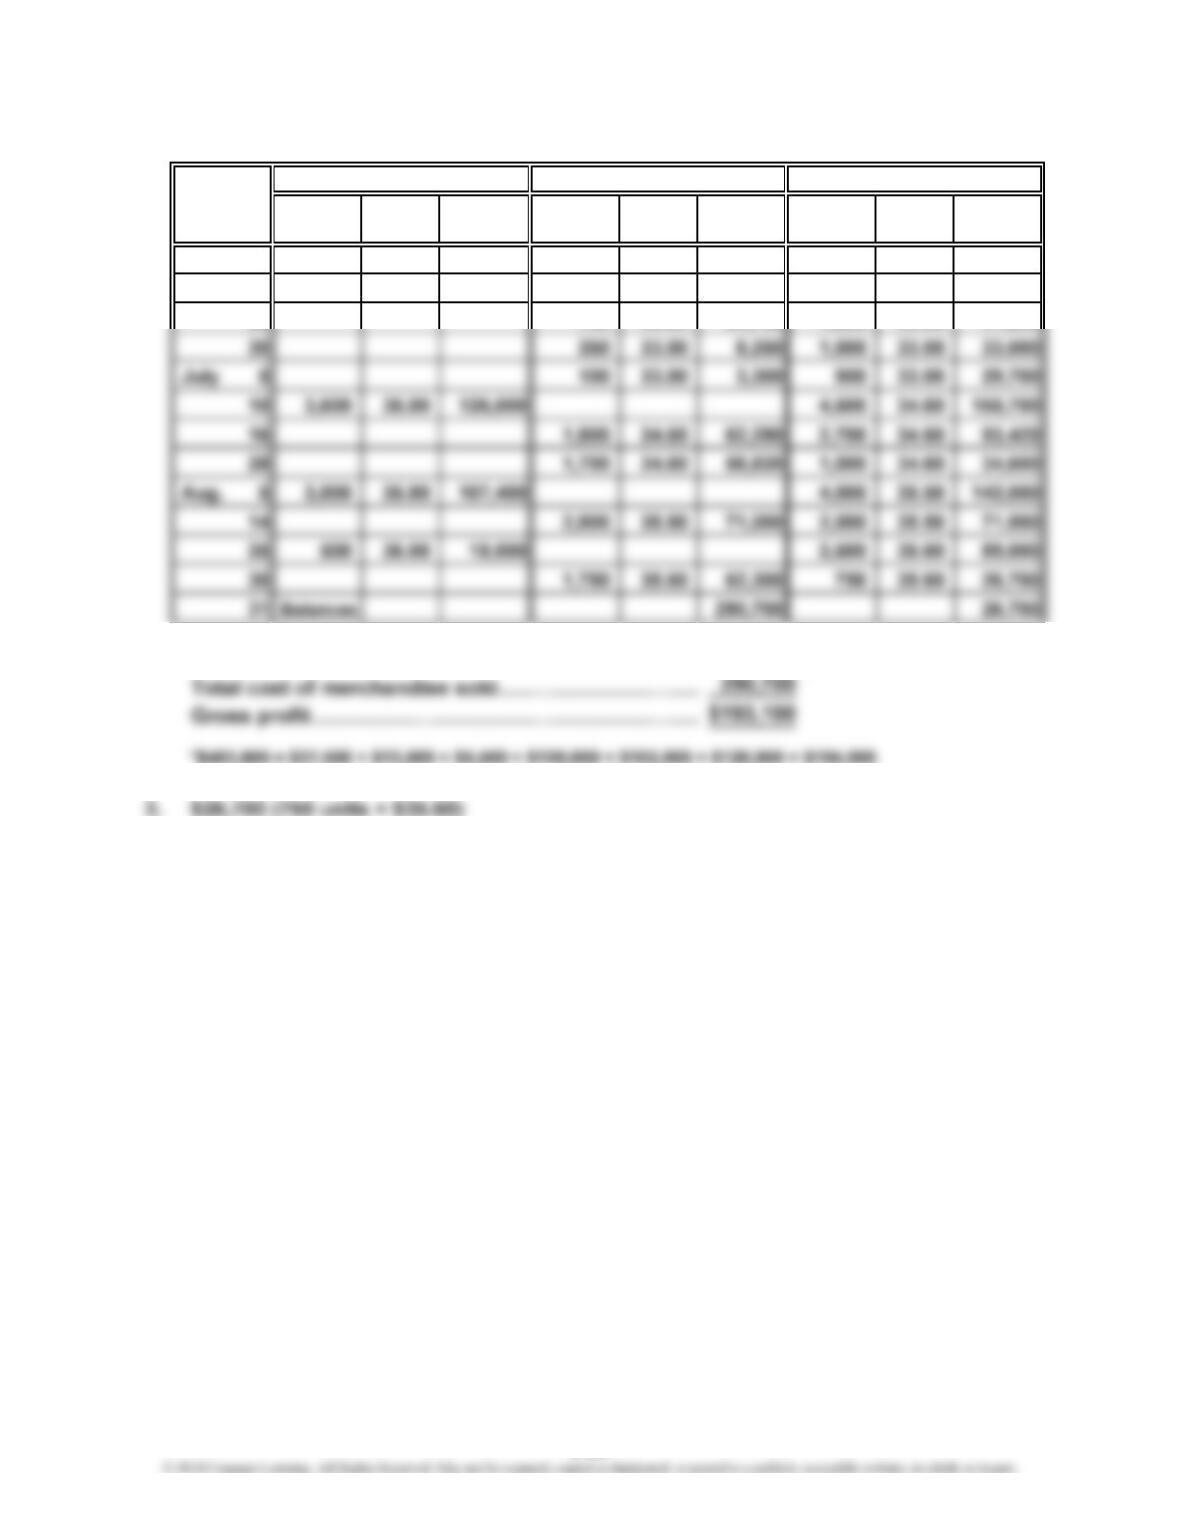
1.
Unit Total Unit Total Unit Total
Quantity Cost Cost Quantity Cost Cost Quantity Cost Cost
June 1 500 30.00 15,000
10 1,500 34.00 51,000 2,000 33.00 66,000
28 750 33.00 24,750 1,250 33.00 41,250
2. Total sales…………………………………………………
…
Date
Purchases
$483,800
Cost of Merchandise Sold Inventory
6-23
CHAPTER 6 Inventories
Prob. 6–4A
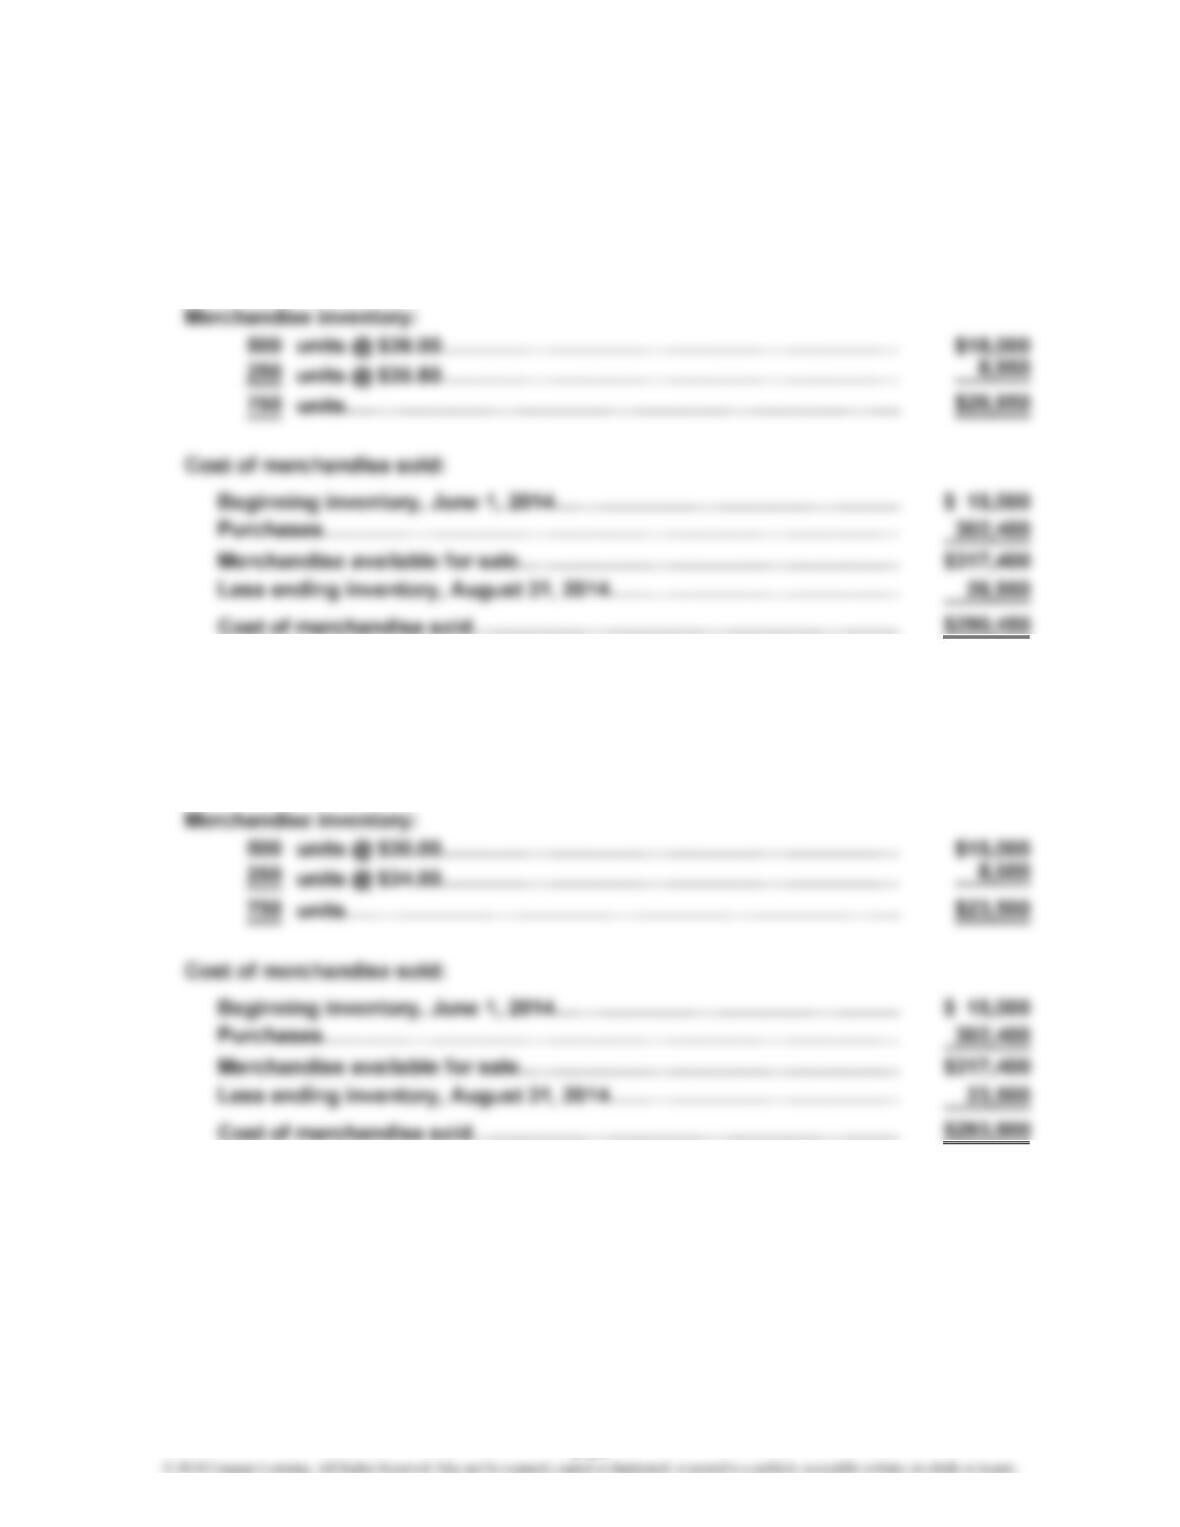
1. First-In, First-Out Method
Merchandise inventory, August 31, 2014…………………………………
…
$ 26,950
Cost of merchandise sold……………………………………………………
…
290,450
Supporting computations
2. Last-In, First-Out Method
Merchandise inventory, August 31, 2014…………………………………
…
$ 23,500
Cost of merchandise sold……………………………………………………
…
293,900
Supporting computations
…
…
6-24
…
…
CHAPTER 6 Inventories
Prob. 6–4A (Continued)
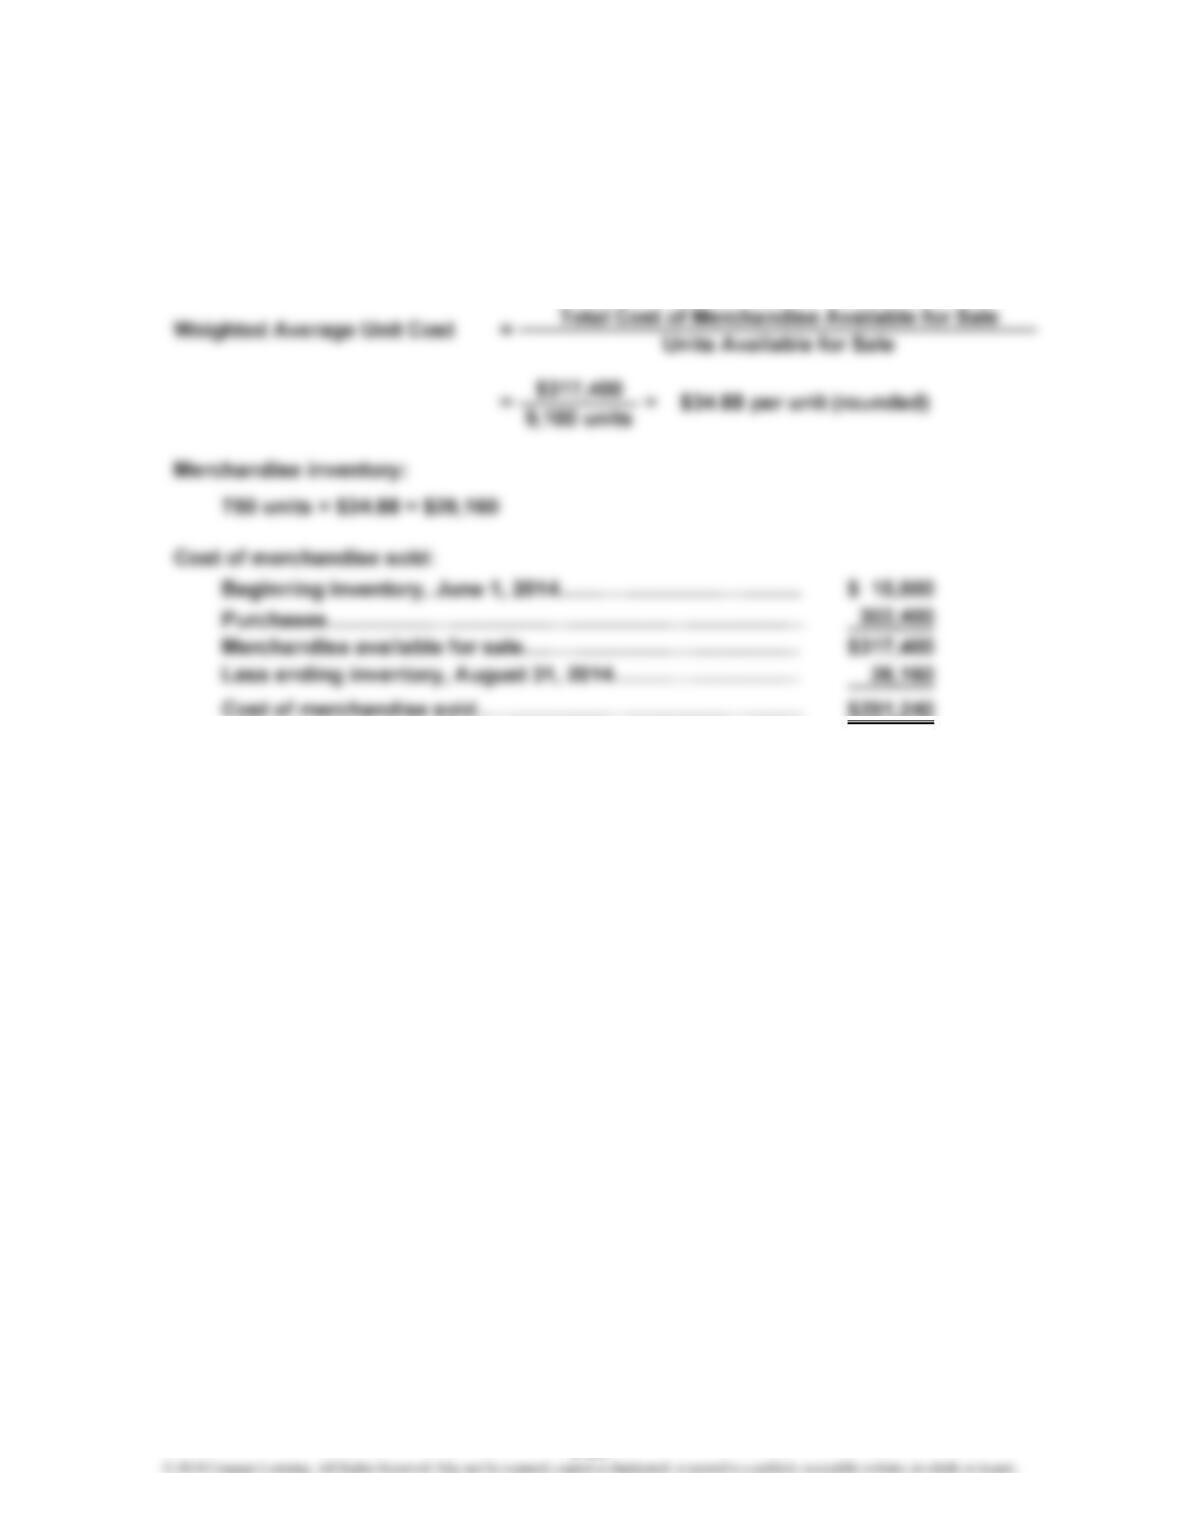
3. Weighted Average Cost Method
Merchandise inventory, August 31, 2014……………………
…
$ 26,160
Cost of merchandise sold………………………………………
…
291,240
Supporting computations
6-25
…
…
CHAPTER 6 Inventories
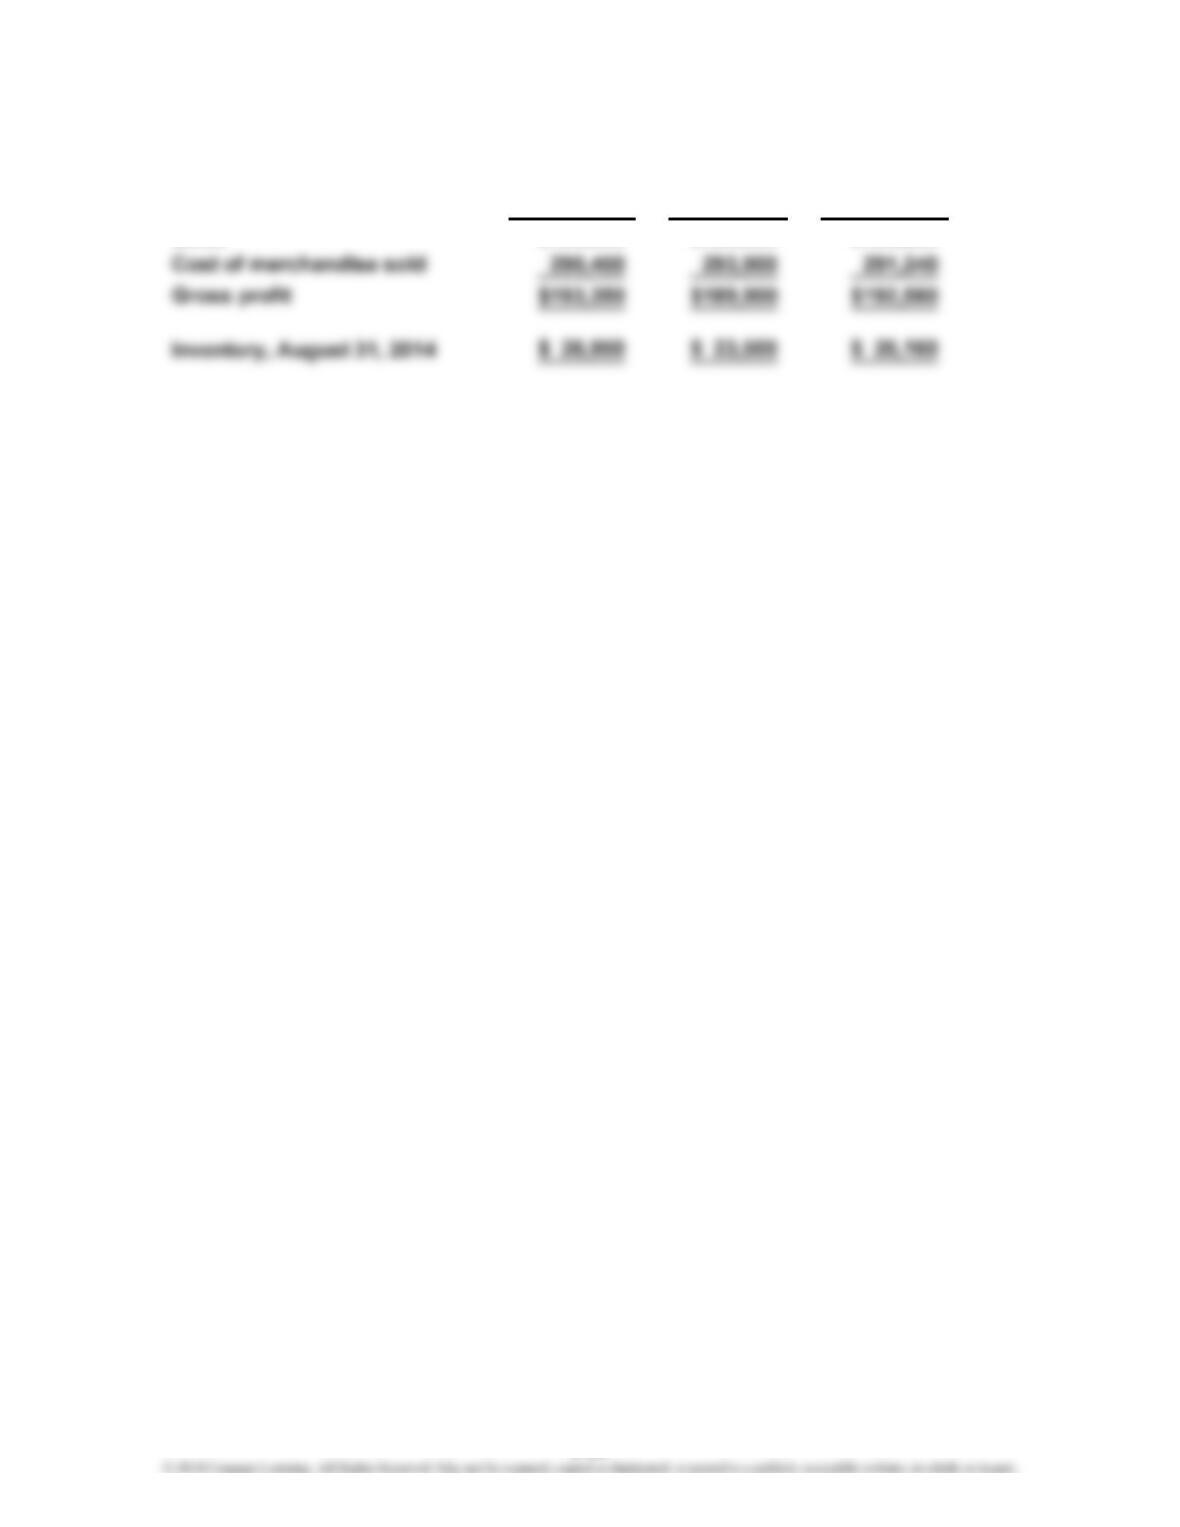
Prob. 6–4A (Concluded)
4. Weighted
FIFO LIFO Average
Sales $483,800 $483,800 $483,800
6-26
CHAPTER 6 Inventories
Prob. 6–5A
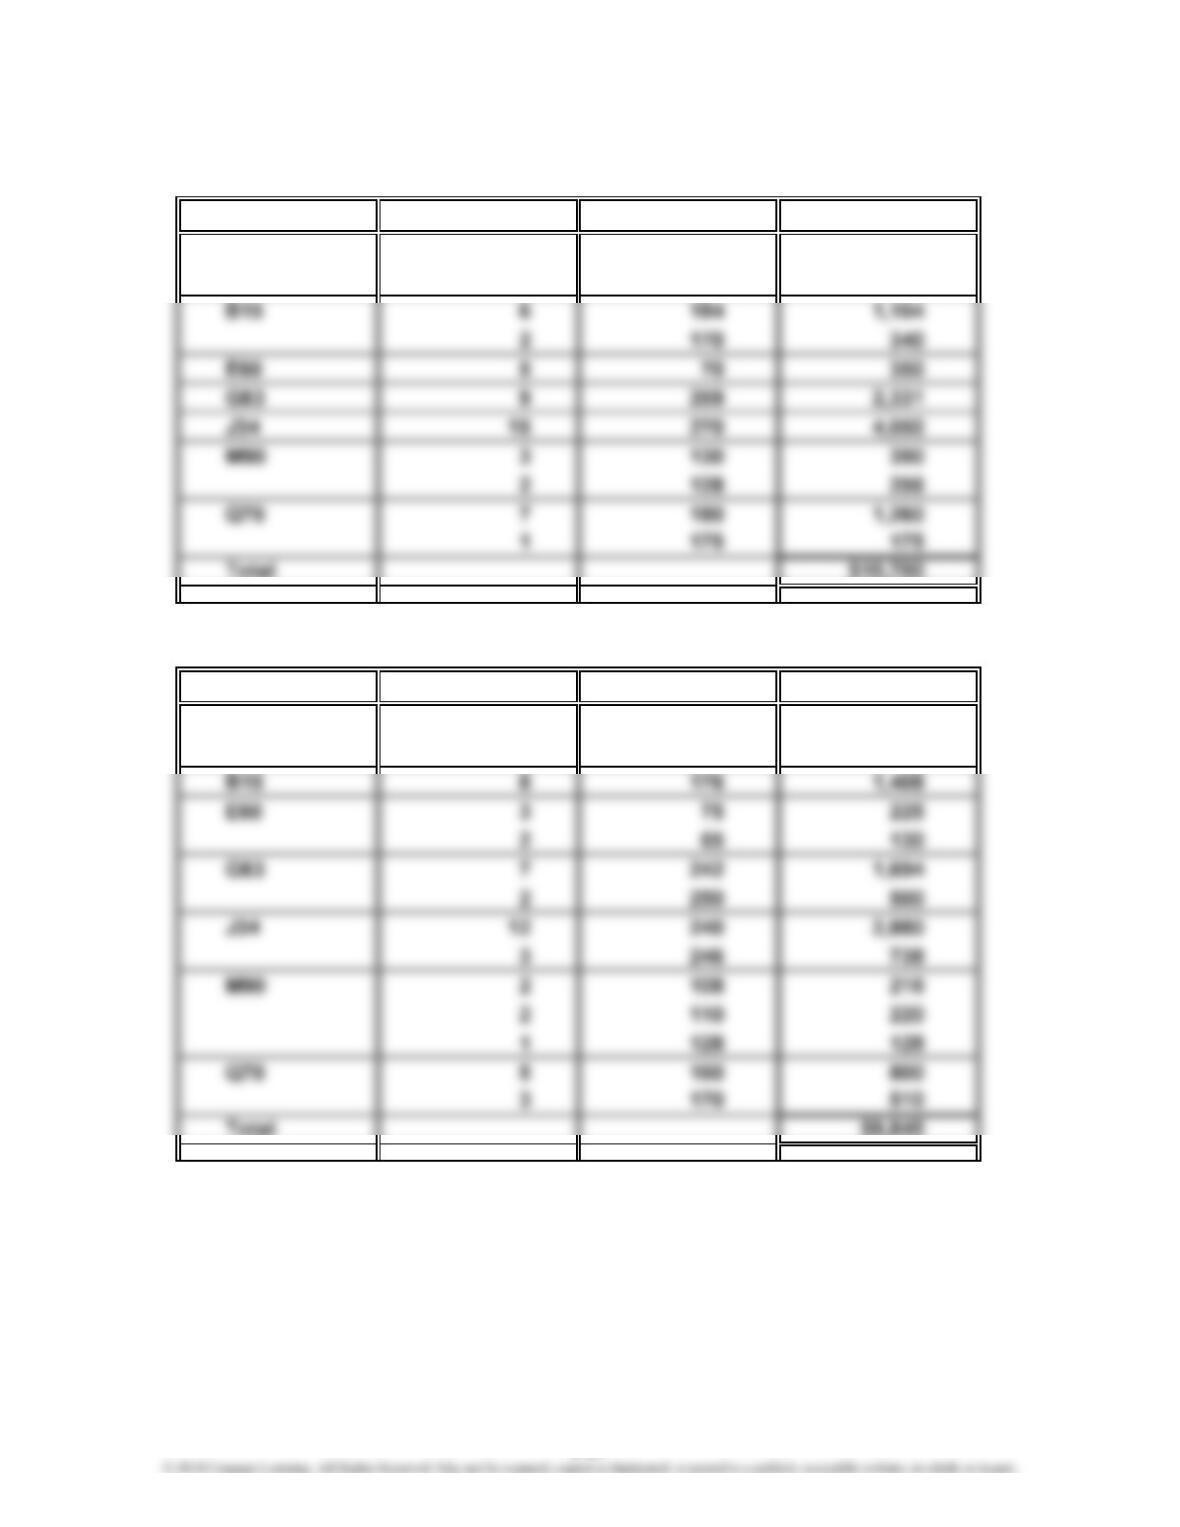
1. First-In, First-Out Method
Model Quantity Unit Cost Total Cost
A10 4 $ 76 $ 304
2 70 140
2. Last-In, First-Out Method
Model Quantity Unit Cost Total Cost
A10 4 $ 64 $ 256
2 70 140
6-27
CHAPTER 6 Inventories
Prob. 6–5A (Concluded)
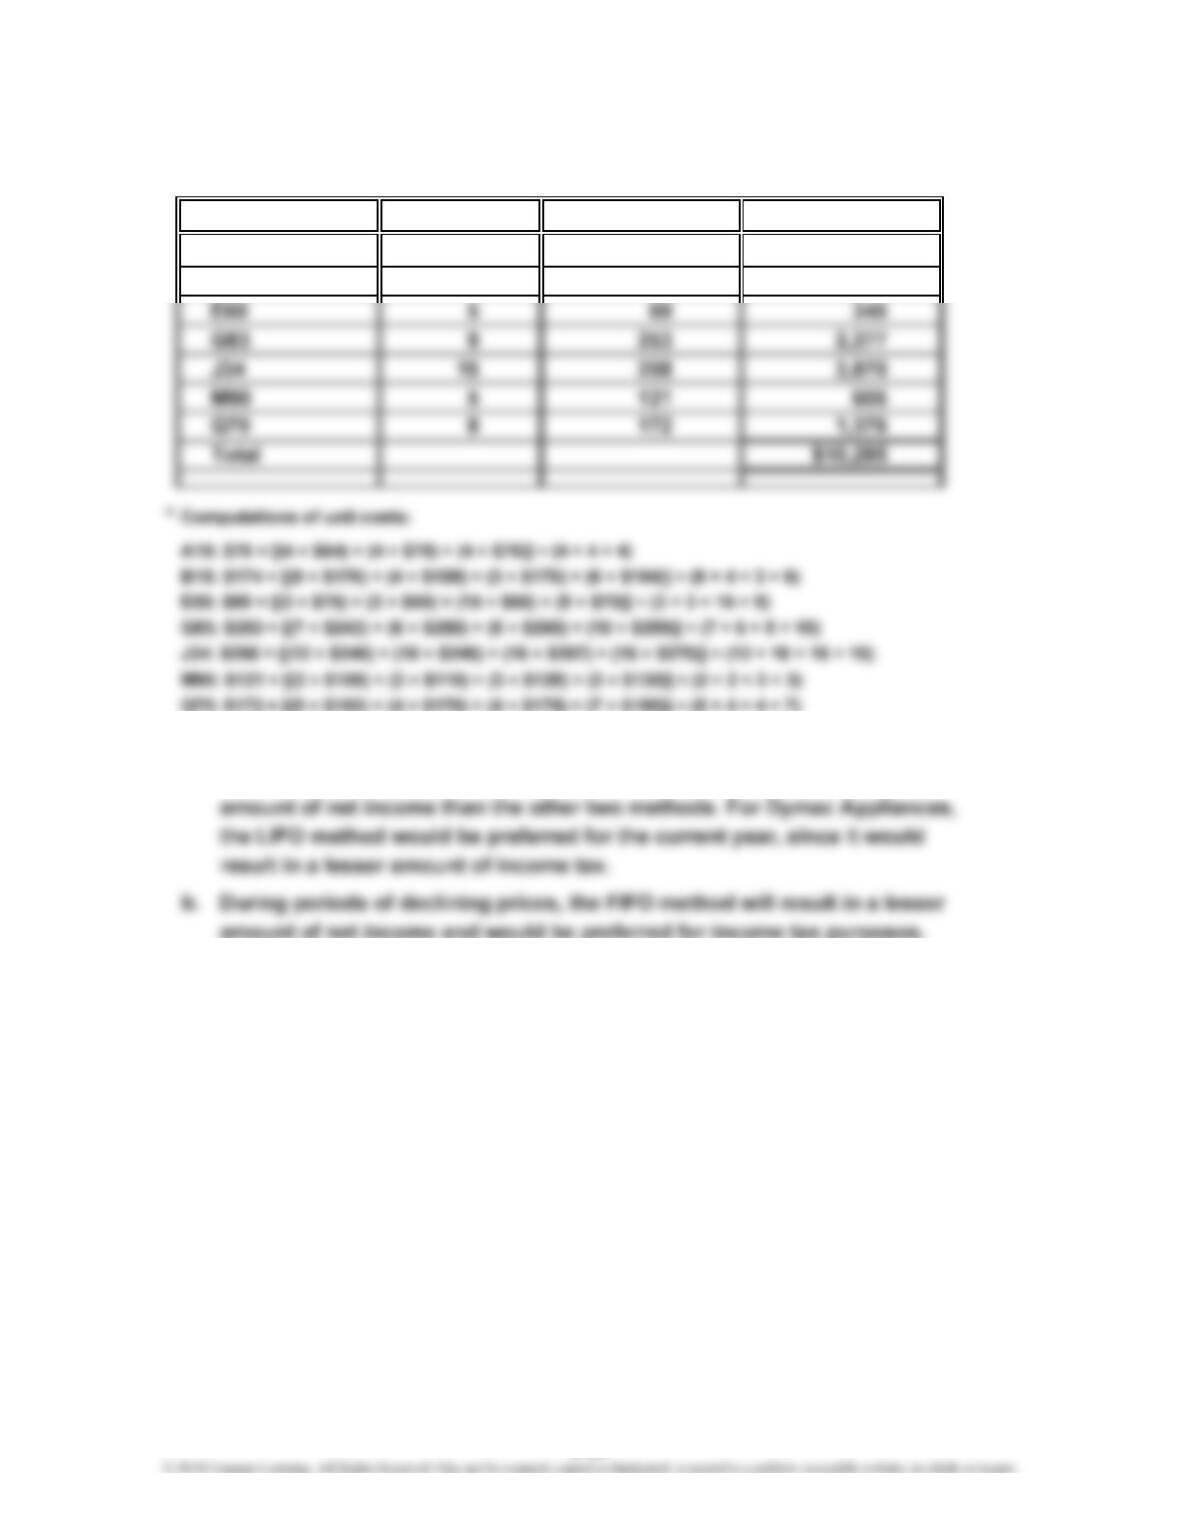
3. Weighted Average Cost Method
Quantity Unit Cost*Total Cost
6 $ 70 $ 420
8 174 1,392
4. a. During periods of rising prices, the LIFO method will result in a lower cost
of inventory, a greater amount of cost of merchandise sold, and a lesser
Model
A10
B15
6-28
CHAPTER 6 Inventories
Prob. 6–6A
Unit Unit
Cost Market Lower of
Description Price Price Cost Market C or M
B12 38 30 $ 60 $ 57 $ 1,800 $ 1,710
8 59 57 472 456
10,110 9,900 9,900
N94 400 8 7 3,200 2,800 2,800
P24 90 80 22 18 1,760 1,440
Quantity
Inventory Sheet
December 31, 2014
Inventory
Total
6-29
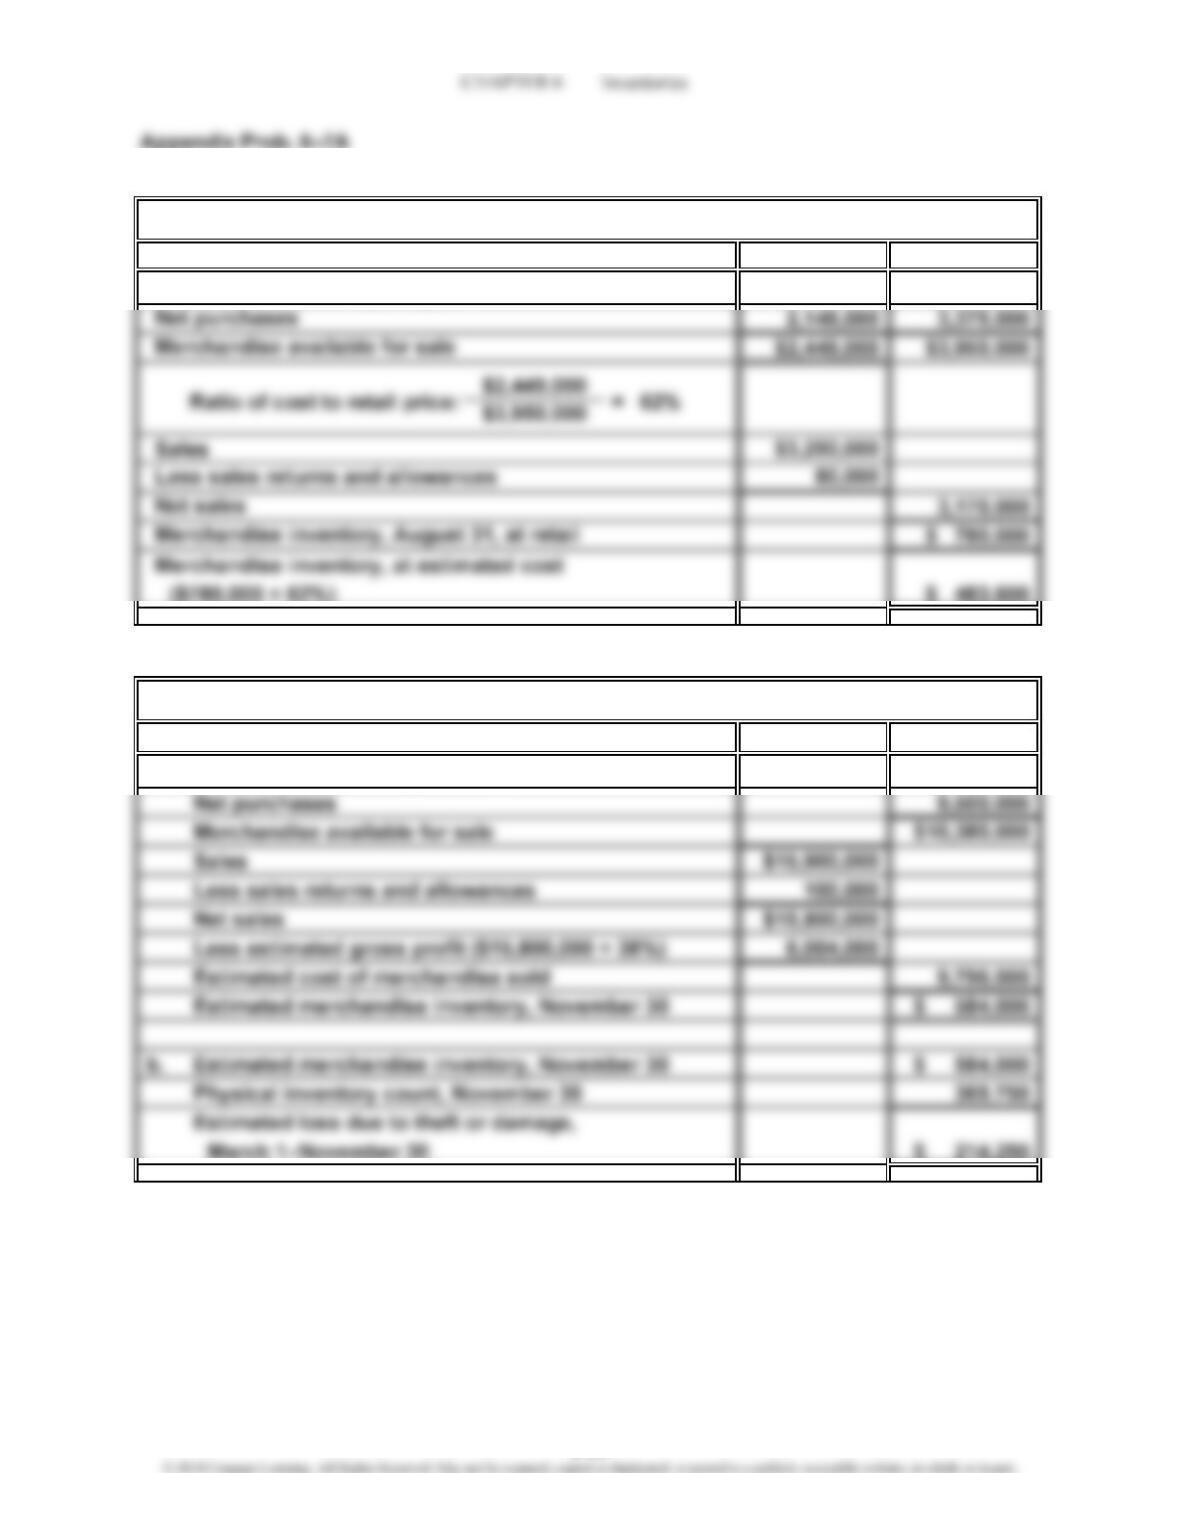
1.
Cost Retail
Merchandise inventory, August 1 $ 300,000 $ 575,000
2.
Cost
a. Merchandise inventory, March 1 $ 880,000
CELEBRITY TAN CO.
RANCHWORKS CO.
6-30
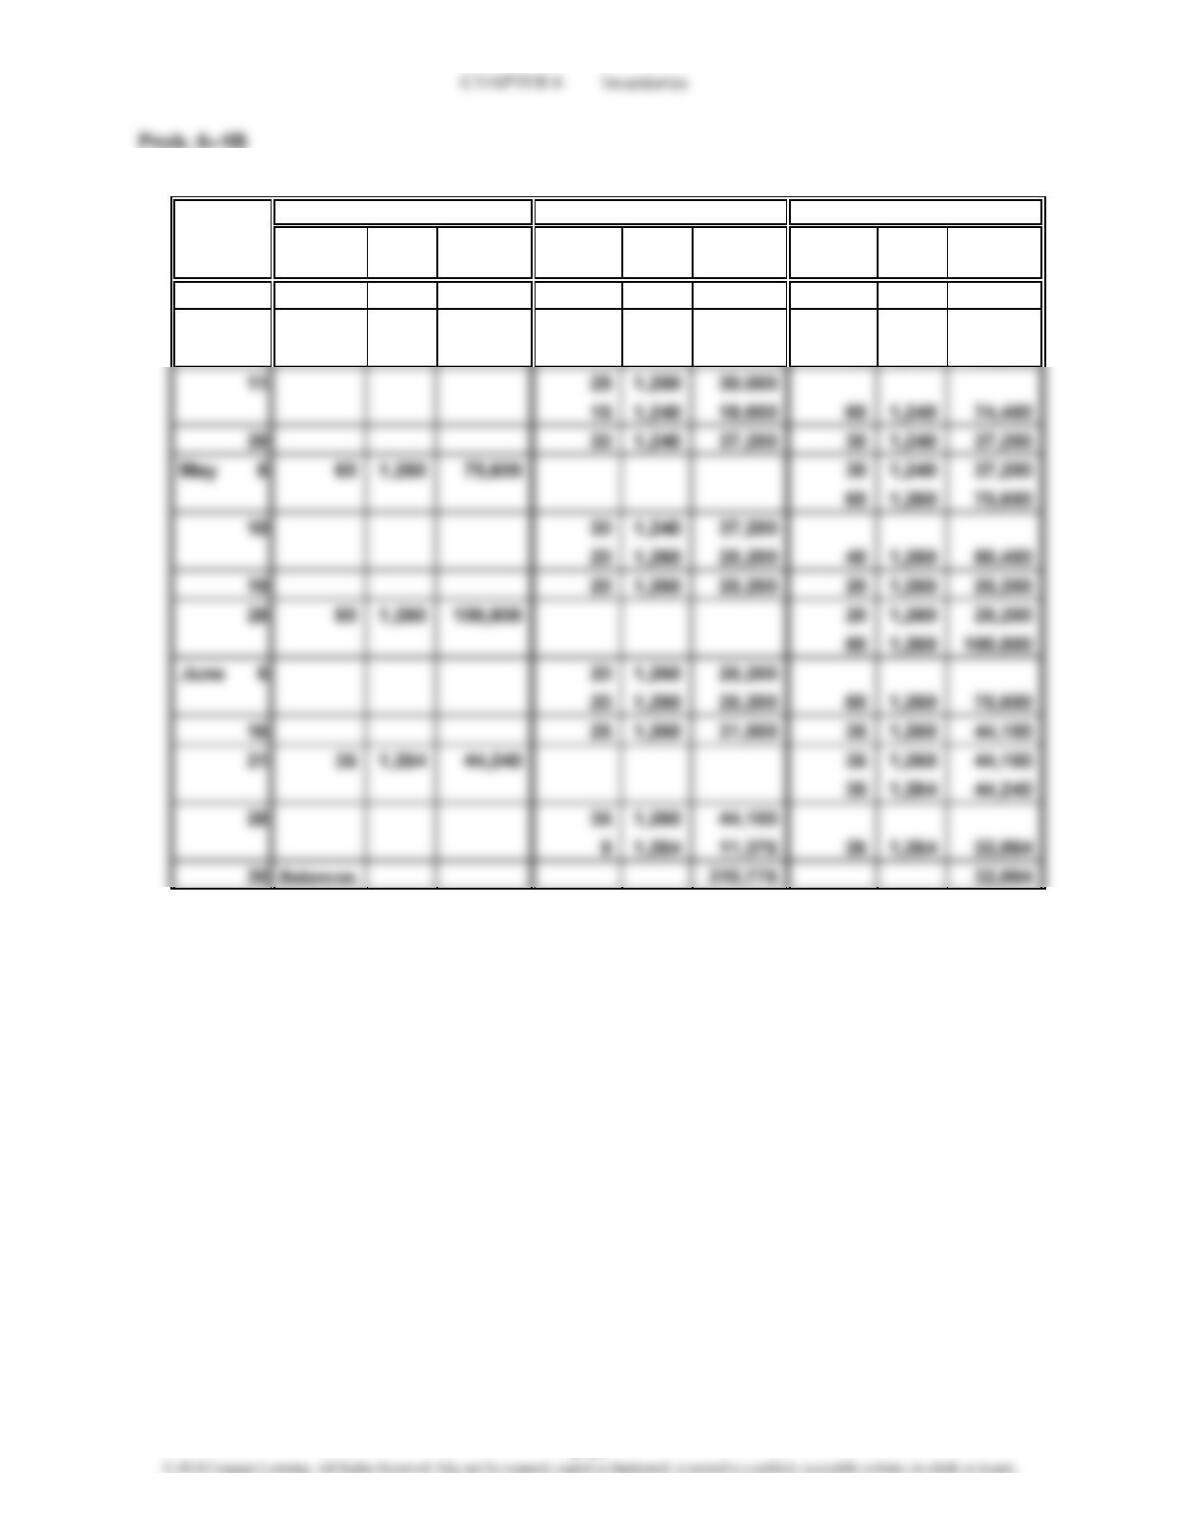
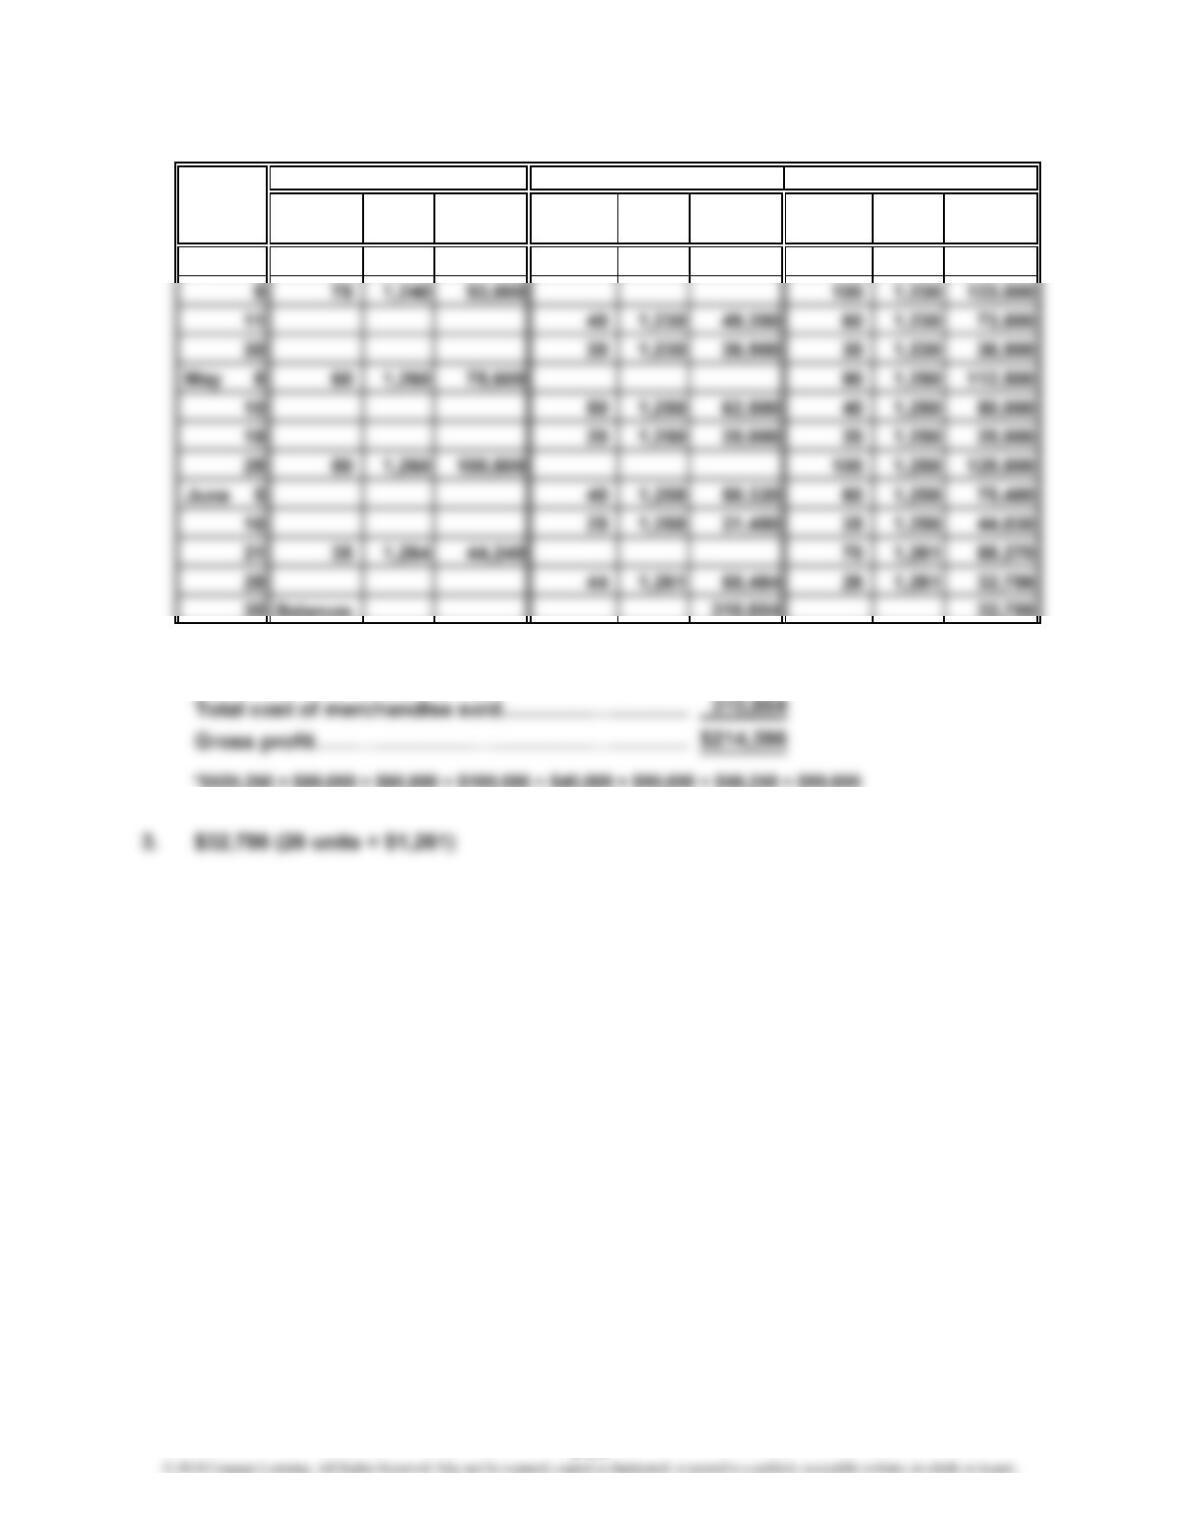
1.
Unit Total Unit Total Unit Total
Quantity Cost Cost Quantity Cost Cost Quantity Cost Cost
Apr. 3 25 1,200 30,000
8 75 1,240 93,000 25 1,200 30,000
75 1,240 93,000
Cost of Merchandise Sold Inventory
Date
Purchases
6-31
CHAPTER 6 Inventories
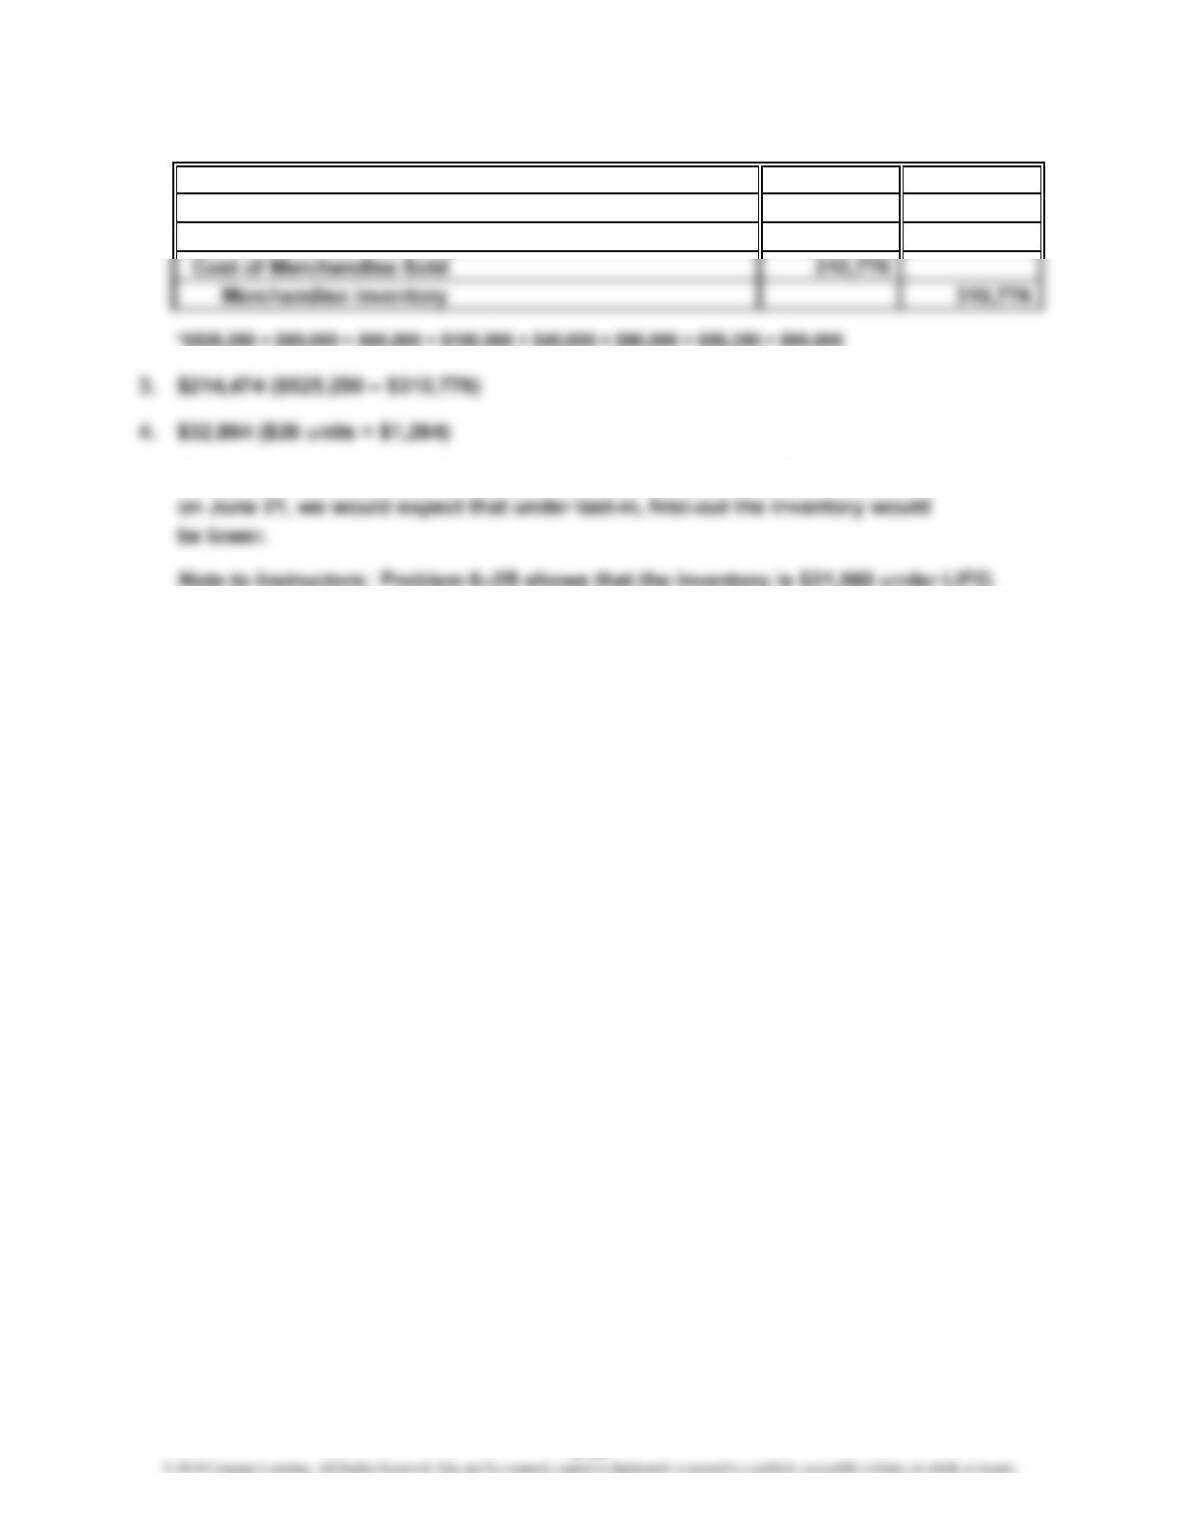
Prob. 6–1B (Concluded)
2. Accounts Receivable 525,250
Sales 525,250
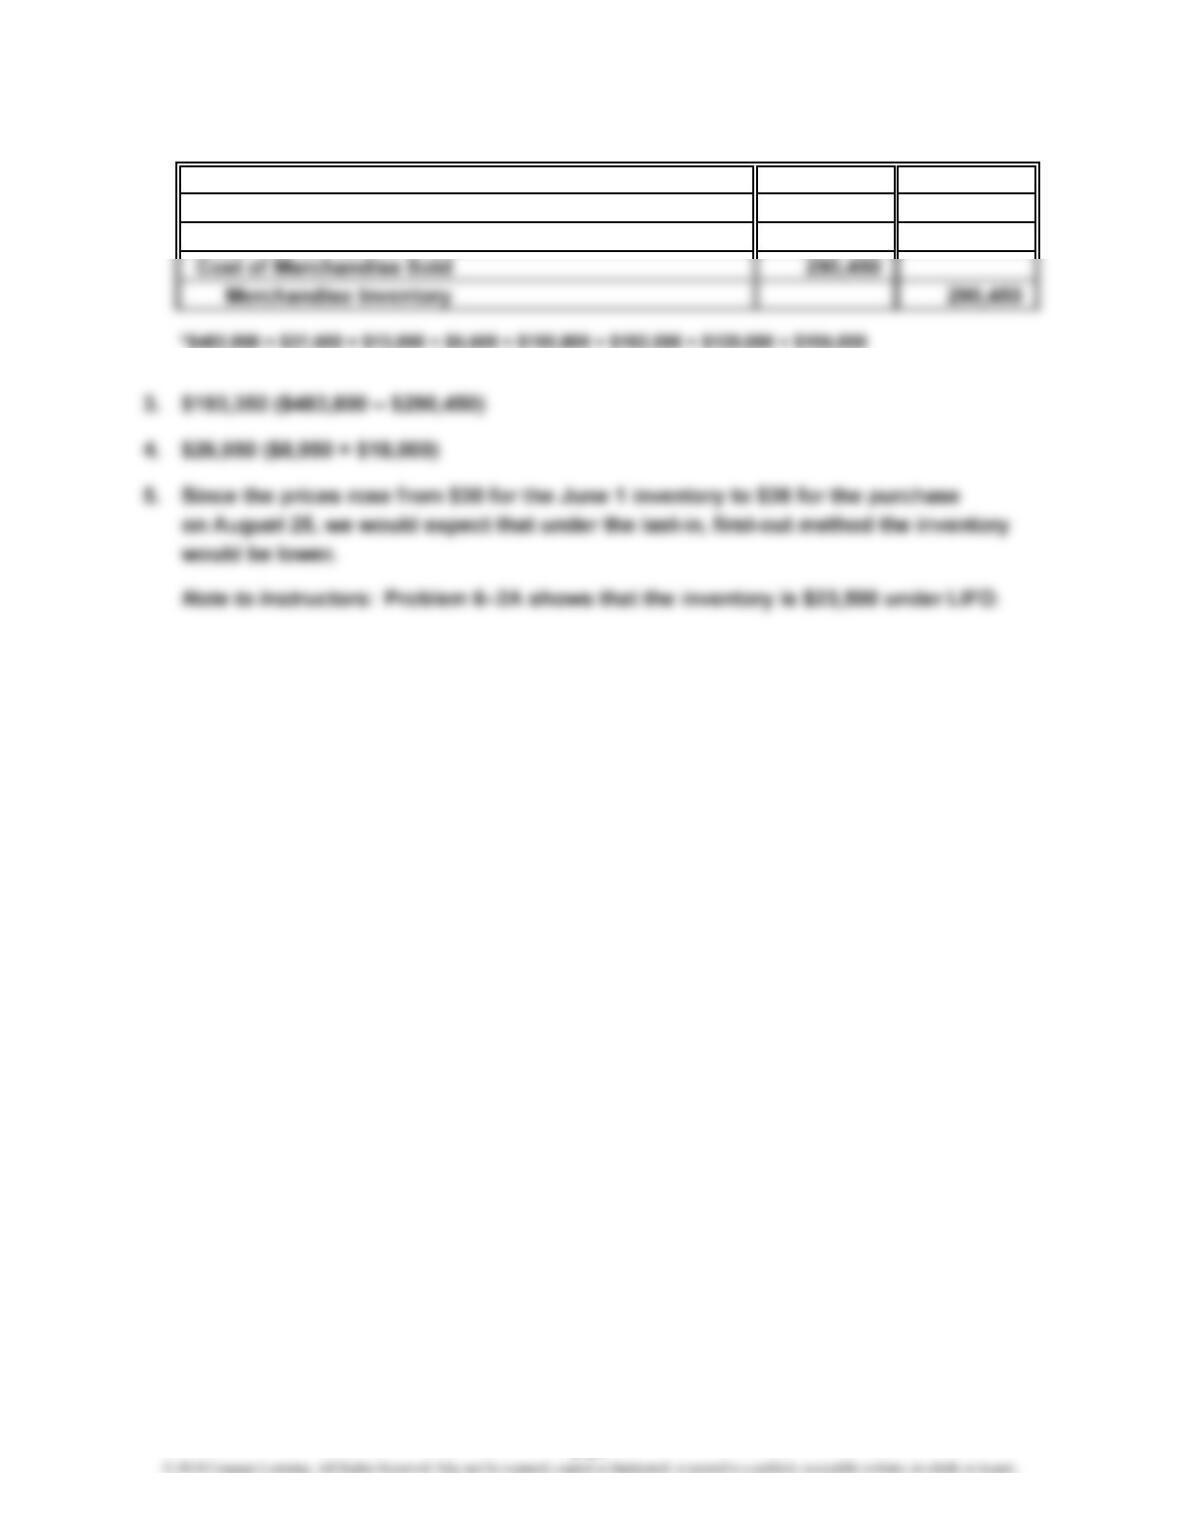
5. Since the prices rose from $1,200 for the April 3 inventory to $1,264 for the purchase
*
6-32
CHAPTER 6 Inventories
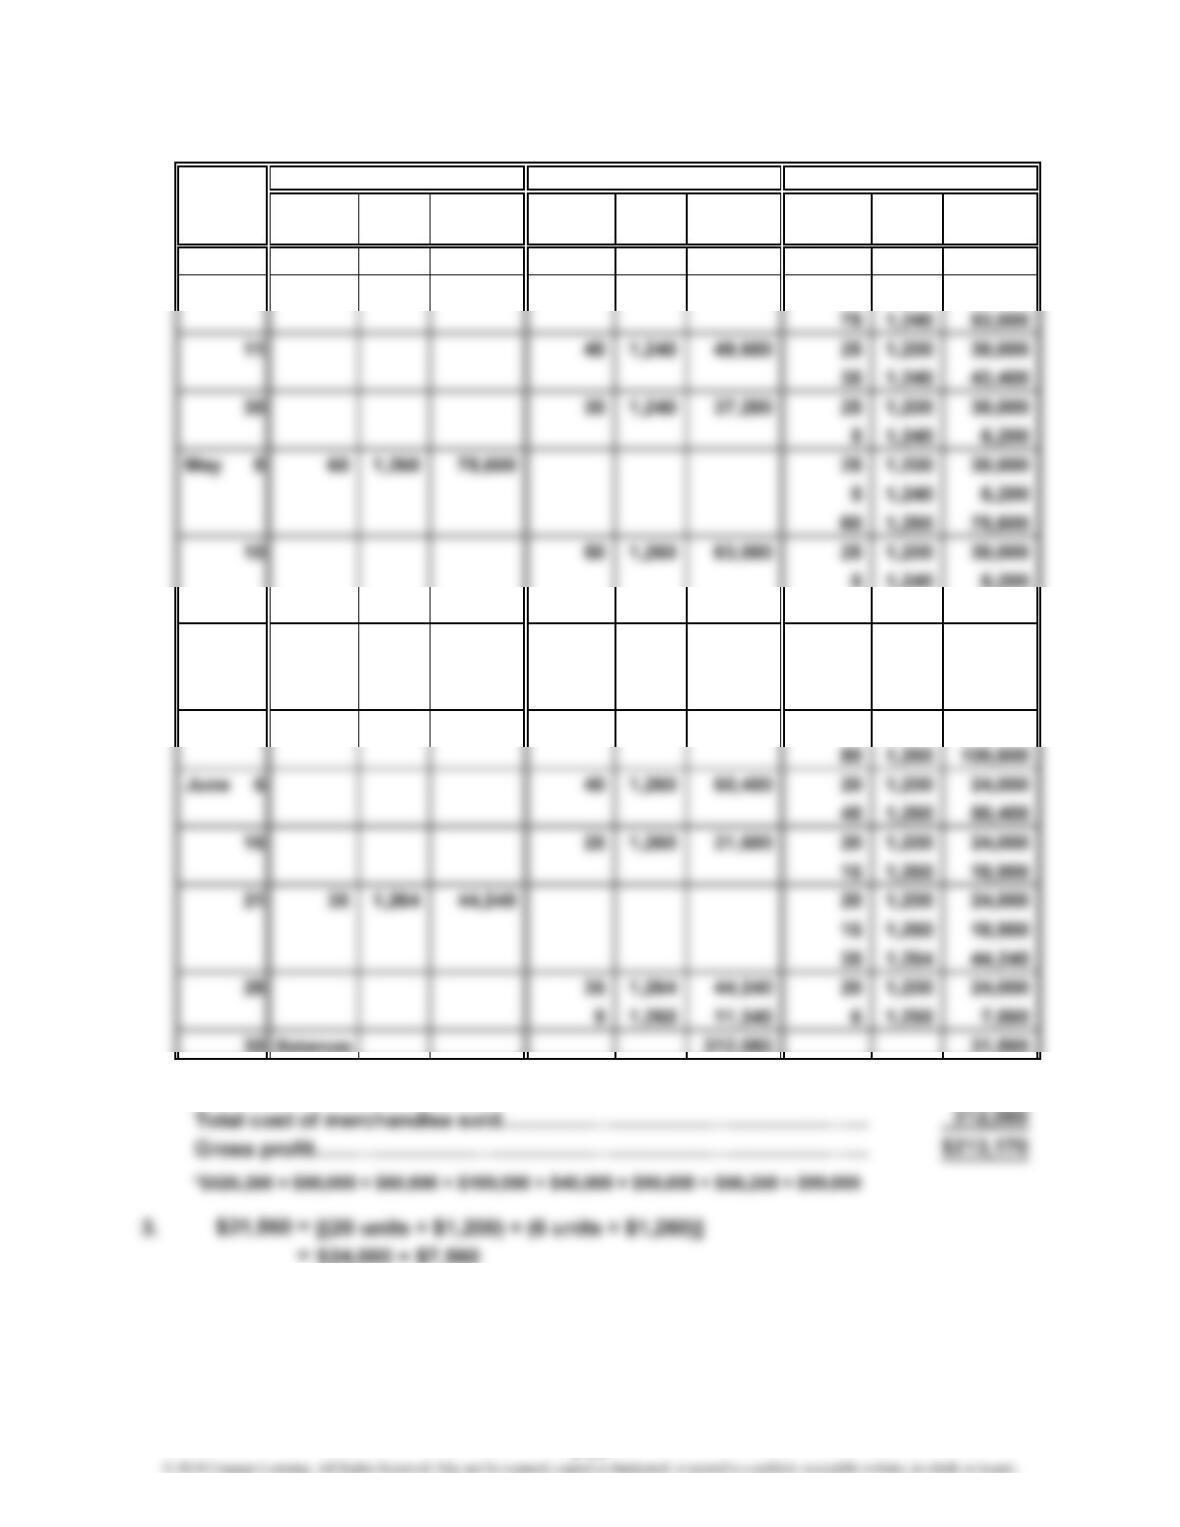
Prob. 6–2B
1.
Unit Total Unit Total Unit Total
Cost Cost Quantity Cost Cost Quantity Cost Cost
Apr. 3 25 1,200 30,000
8 1,240 93,000 25 1,200 30,000
10 1,260 12,600
19 10 1,260 12,600
5 1,240 6,200
5 1,200 6,000 20 1,200 24,000
28 1,260 100,800 20 1,200 24,000
2. Total sales………………………………………………………………………
…
80
Quantity
75
$525,250
Cost of Merchandise Sold Inventory
Date
Purchases
*
6-33
CHAPTER 6 Inventories
Prob. 6–3B
1.
Unit Total Unit Total Unit Total
Quantity Cost Cost Quantity Cost Cost Quantity Cost Cost
Apr. 3 25 1,200 30,000
2. Total sales………………………………………………
…
Date
Purchases
$525,250
Cost of Merchandise Sold Inventory
*
6-34