1. The variable and fixed costs for each product line—canoes and paddles—
possess both a manufacturing and a marketing component. However, the
manufacturing and marketing data are recorded separately, which means that
four separate high-low analyses must be conducted. The manufacturing and
marketing variable costs per unit can then be added together to arrive at the
variable cost per unit for the canoe product line and the paddle product line.
Similarly, the manufacturing and marketing total fixed costs can be added
together to arrive at the total fixed cost for the canoe product line and the
paddle product line.
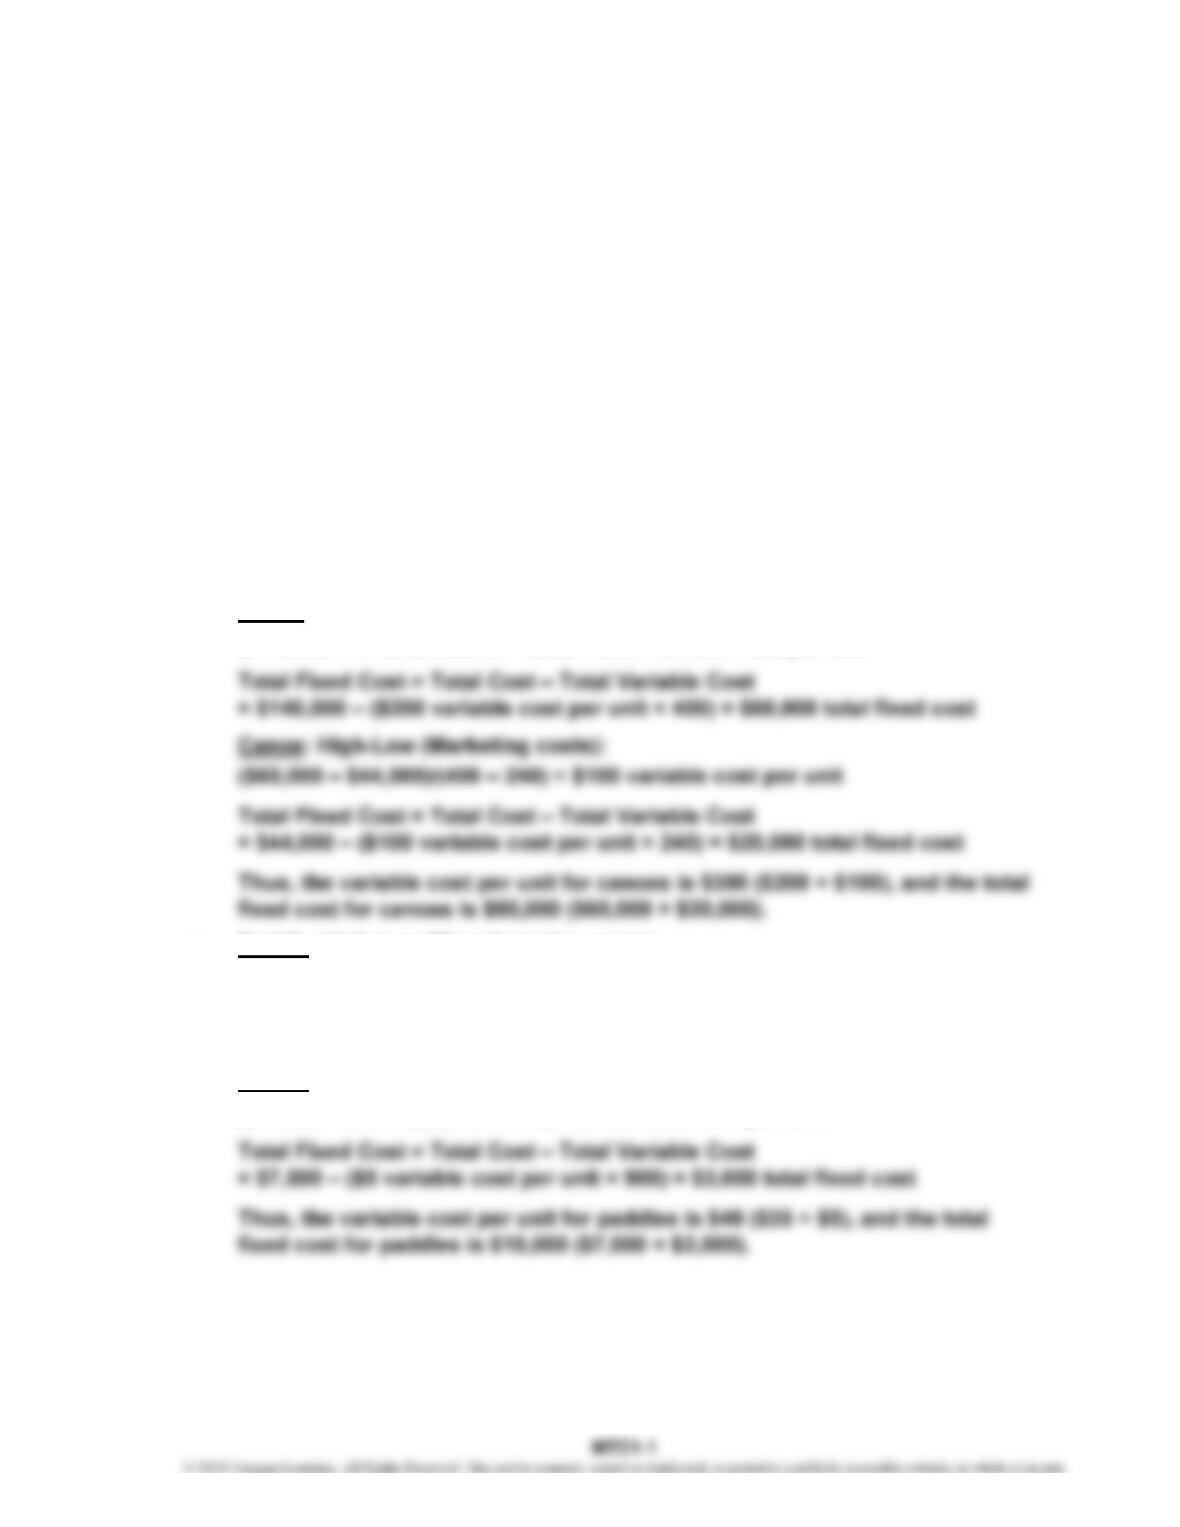
a. Canoe: High-Low (Manufacturing costs):
($140,000 – $108,000)/(400 – 240) = $200 variable cost per unit
b. Paddle: High-Low (Manufacturing costs):
($66,500 – $38,500)/(1,700 – 900) = $35 variable cost per unit
Total Fixed Cost = Total Cost – Total Variable Cost
= $38,500 – ($35 variable cost per unit × 900) = $7,000 total fixed cost
Paddle: High-Low (Marketing costs):
($11,500 – $7,500)/(1,700 – 900) = $5 variable cost per unit
FOR MANY GLACIER HOTEL
COST BEHAVIOR AND COST-VOLUME-PROFIT ANALYSIS
MAKING THE CONNECTION:
INTEGRATIVE EXERCISE (Chapters 2, 3, and 7)
Making the Connection Integrative Exercise (Chapters 2, 3, and 7)
2. The operating income equation for determining the break-even in units is as
follows:
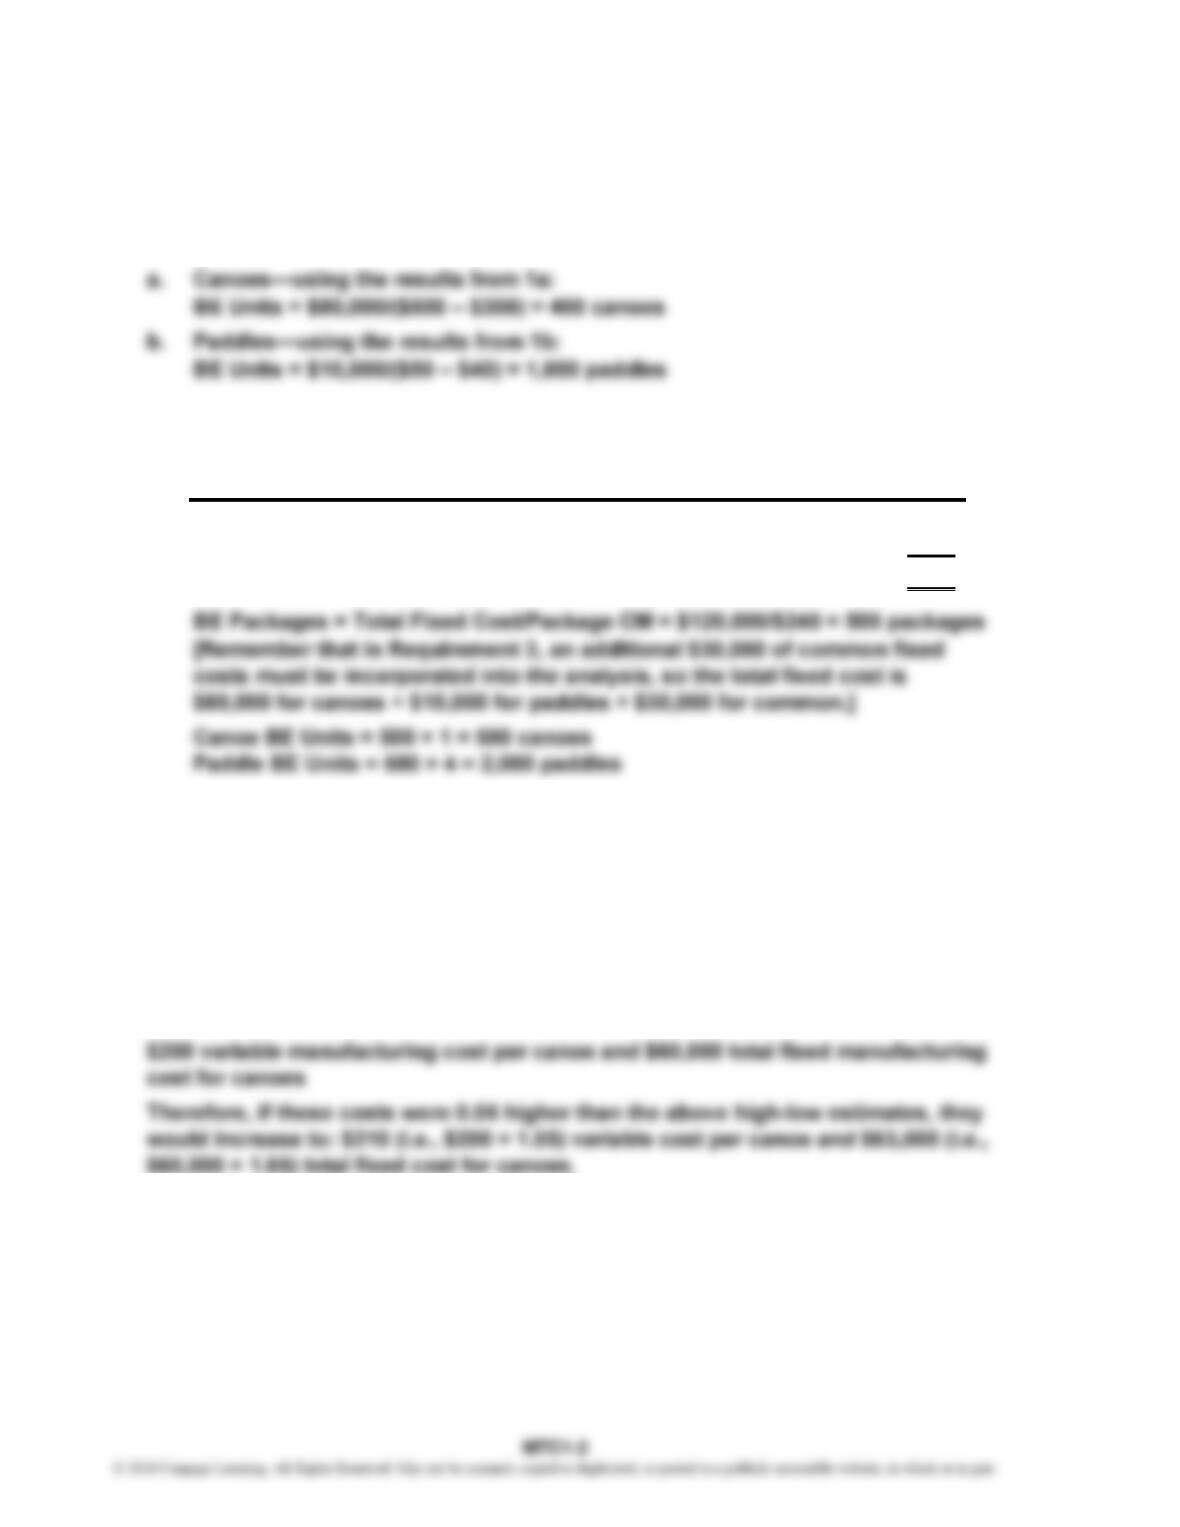
BE Units = Total Fixed Cost/(Price – VC per Unit)
3. The sales mix of canoes to paddles is 300:1,200, which can be reduced to 1:4.
Package
Product Price Unit VC Unit CM Package CM
Canoe……………… $500 $300 $200 1 $200
Paddle……………
…
50 40 10 4 40
Package total…………………………………………………………………
…
$240
4. a. All manufacturing costs are product costs. All marketing costs and
customer hotline costs are period costs.
b. Marketing costs are selling oriented; therefore, the marketing period costs
would be further classified as Selling Expenses. Customer hotline costs
relate to the customer service section of the value chain and would be
further classified as General and Administrative Expenses.
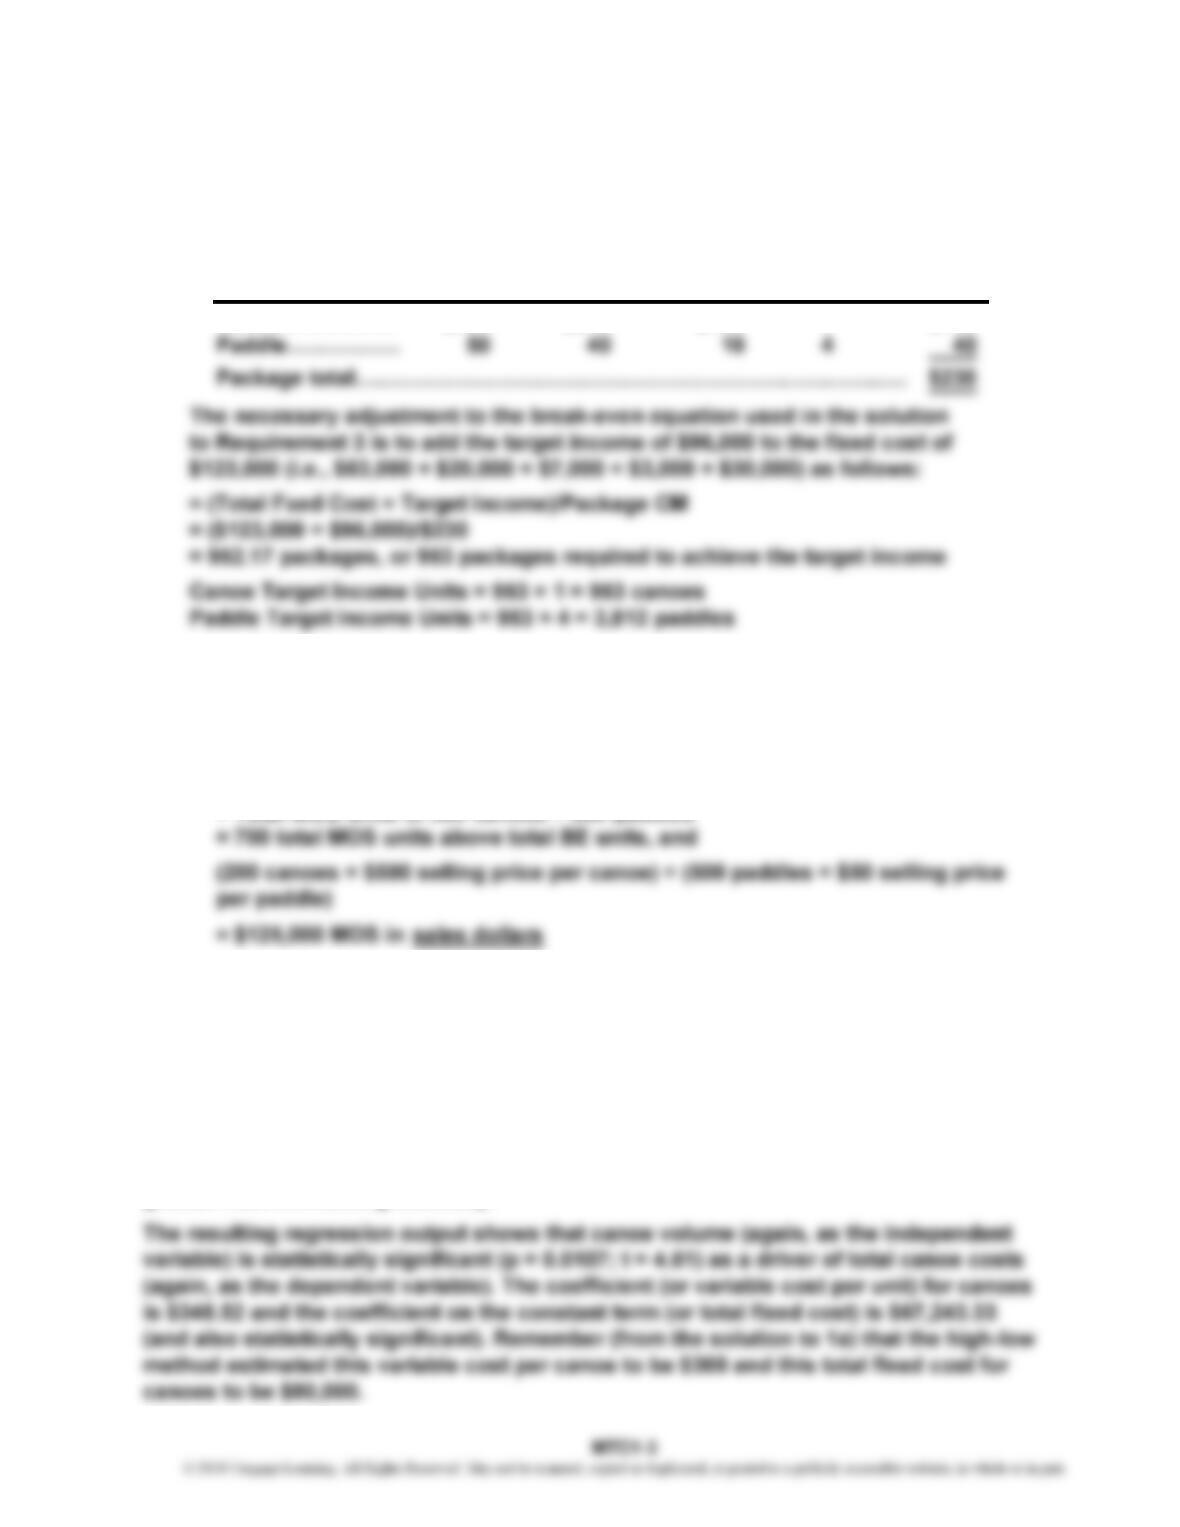
5. The canoe production (or manufacturing) costs are as follows (see solution
for Requirement 1a):
Making the Connection Integrative Exercise (Chapter 2, 3, and 7)
The sales mix of canoes to paddles is unchanged at 300:1,200, which can be
reduced to 1:4. However, the increase in canoe costs reduces the package
contribution margin as follows:
Package
Product Unit VC Unit CM Package CM
Canoe……………
…
$310 $190 1 $190
6. Margin of safety (MOS) is the units sold above the break-even volume.
MOS = Units Sold – BE Total Units Sold
700 canoes sold – 500 canoe units at BE (see solution to Requirement 3)
= 200 canoe MOS units, and 2,500 paddles sold – 2,000 paddle units at BE (see
solution to Requirement 3) = 500 paddle MOS units
Note: While not required or discussed in this Making the Connection exercise,
regression analysis can be performed on the canoe data by combining the canoe
manufacturing cost data and canoe marketing cost data and then regressing canoe
volume (as the independent variable) onto total canoe costs (as the dependent variable).
Showing students the following regression output results for the canoe data leads to an
interesting discussion about when the high-low method is “good enough” (i.e., produces
cost estimates of a sufficiently accurate nature) versus when the more expensive, time
consuming and complex regression method might be warranted due to its relatively
greater cost forecasting accuracy.
Price
$500
Making the Connection Integrative Exercise (Chapters 2, 3, and 7)
In addition, the regression output shows an R2 of 0.836, which suggests that the canoe
volume (as the independent variable) explains 83% of the variation in the total canoe
cost (as the dependent variable). Therefore, some other variable(s) appears to be
responsible for the remaining 17% of variation in total canoe cost.