6e Introduction Page 15 Chapter 1
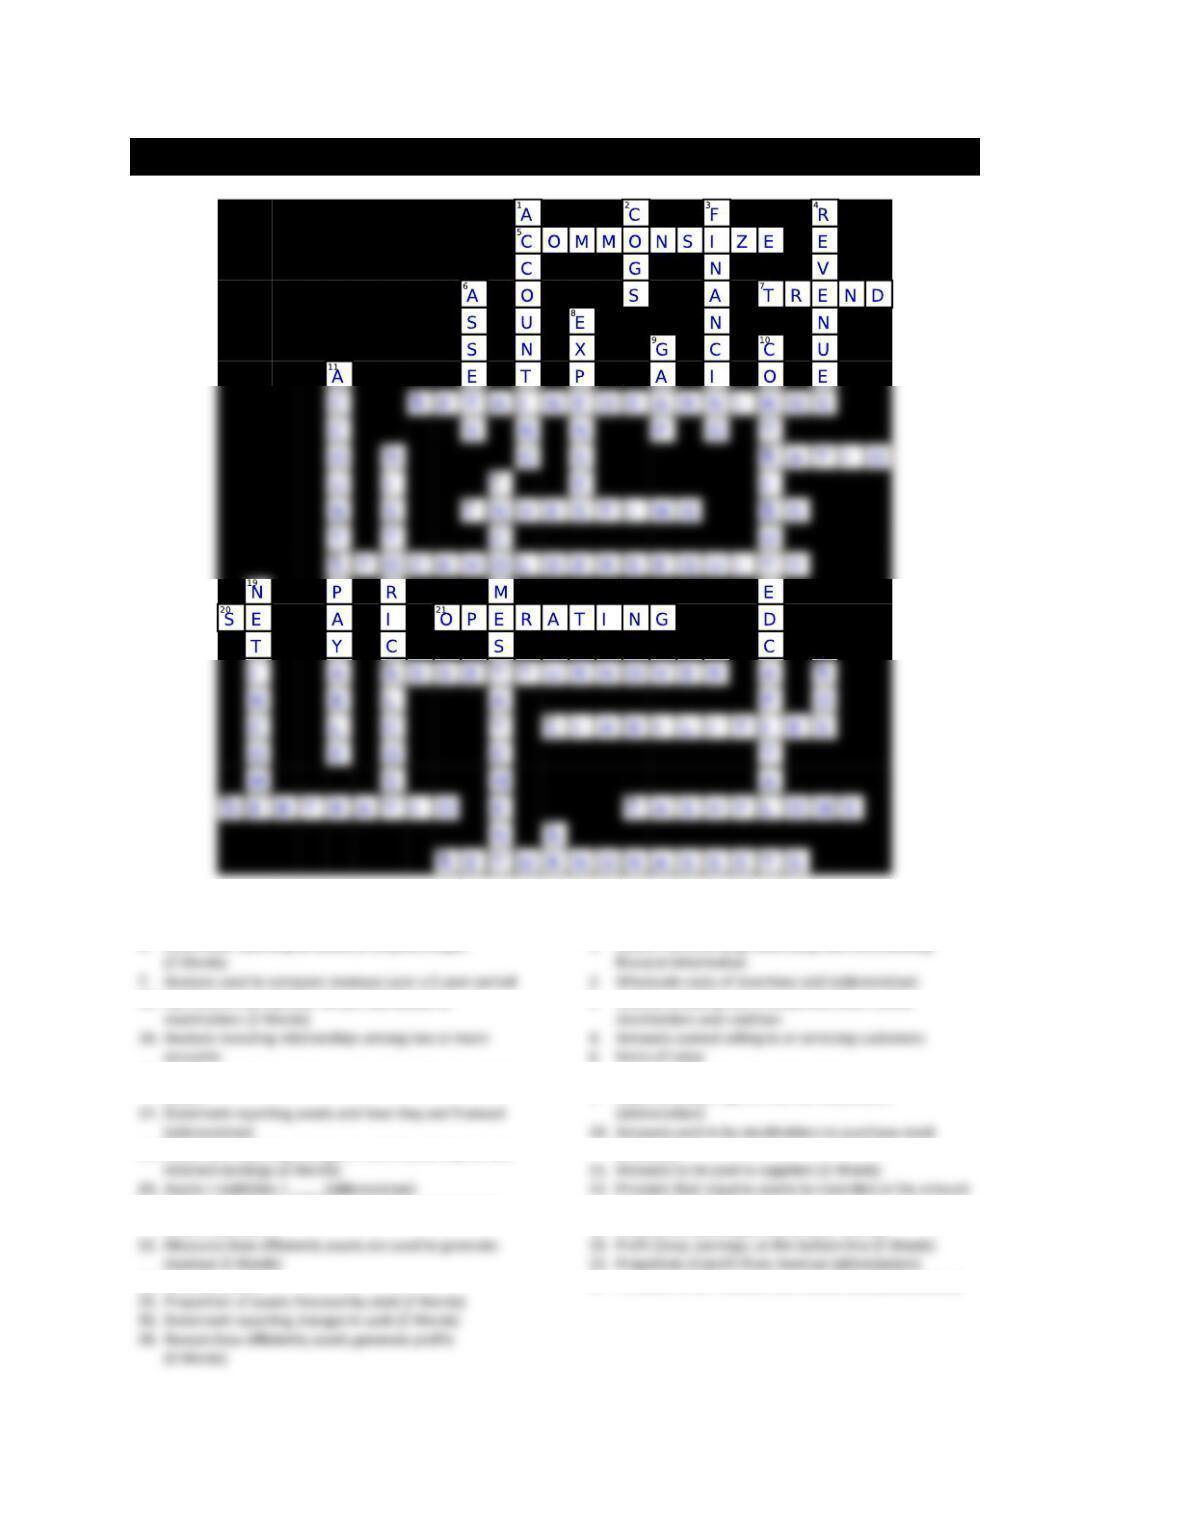
ACTIVITY 1 CHAPTER 1 CROSSWORD PUZZLE
Across
5. Statement reporting all amounts as percentages
12. Net income earned, but not yet distributed to
16. Activity including cash transactions involving long-term
assets
18. Statement reporting changes in contributed capital and
21. Activity including cash transactions from a company‘s
central business
24. Amounts owed
Down
1. System for recording, classifying, and summarizing
3. Activity including cash transactions that involve
8. Costs incurred to produce revenues
9. Rules for preparing the financial statements
(2 Words)
paid for them (2 Words)
15. Statement reporting profitability (2 Words)
27. Amounts to be received from customers (abbreviation)
6e Introduction Page 16 Chapter 1
ACTIVITY 2 THE FOUR FINANCIAL STATEMENTS
Purpose: • Identify the four financial statements.
• Understand the basic information provided by each financial statement.
Accounting is the system of recording, classifying, and reporting financial information. Four financial
statements report this information: balance sheet, income statement, statement of stockholders’ equity,
and the statement of cash flows.
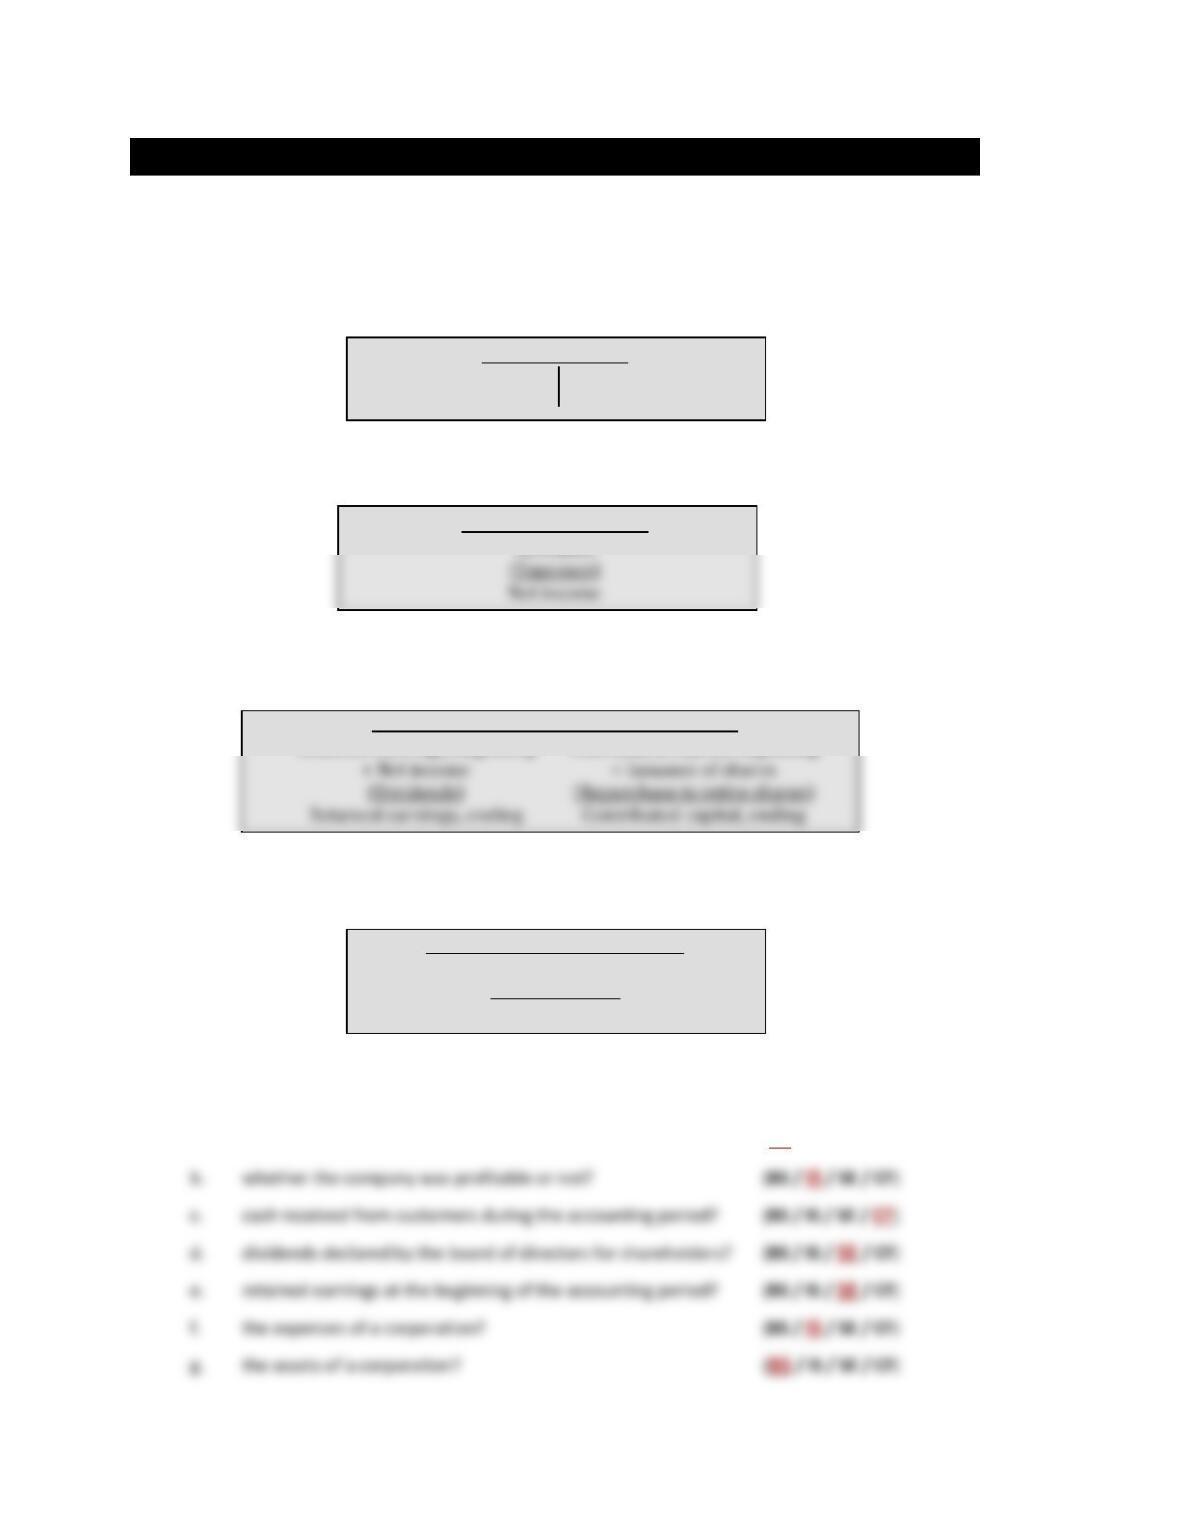
BALANCE SHEET
Assets Liabilities
Stockholders’ equity
The Balance Sheet (BS) provides a snapshot of a company’s financial position as of a certain date. It
reports assets, items of value such as inventory and equipment, and whether the assets are financed with
liabilities (debt) or stockholders’ equity (equity).
INCOME STATEMENT
Revenues
The Income Statement (IS) reports the company’s profitability during an accounting period. It reports
revenues, amounts received from customers for products sold or services provided, and expenses, the
costs incurred to produce revenues. The difference is net income.
STATEMENT OF STOCKHOLDERS’ EQUITY
Retained earnings, beginning Contributed capital, beginning
The Statement of Stockholders’ Equity (SE) reports if the earnings (net income) of this accounting period
are distributed as dividends or retained in the business as retained earnings. It also reports amounts
paid-in (contributed) by stockholders to purchase common stock and preferred stock.
STATEMENT OF CASH FLOWS
Cash inflows
(Cash outflows)
Change in the cash account
The Statement of Cash Flows (CF) reports cash inflows and cash outflows during an accounting period.
Q1 Which financial statement reports:
a. whether assets are primarily financed with debt or equity? (BS / IS / SE / CF)
6e Introduction Page 17 Chapter 1
ACTIVITY 3 BALANCE SHEET
Purpose: • Understand the information provided by the balance sheet.
• Identify asset, liability, and stockholders’ equity accounts reported on the
balance sheet.
• Understand the accounting equation.
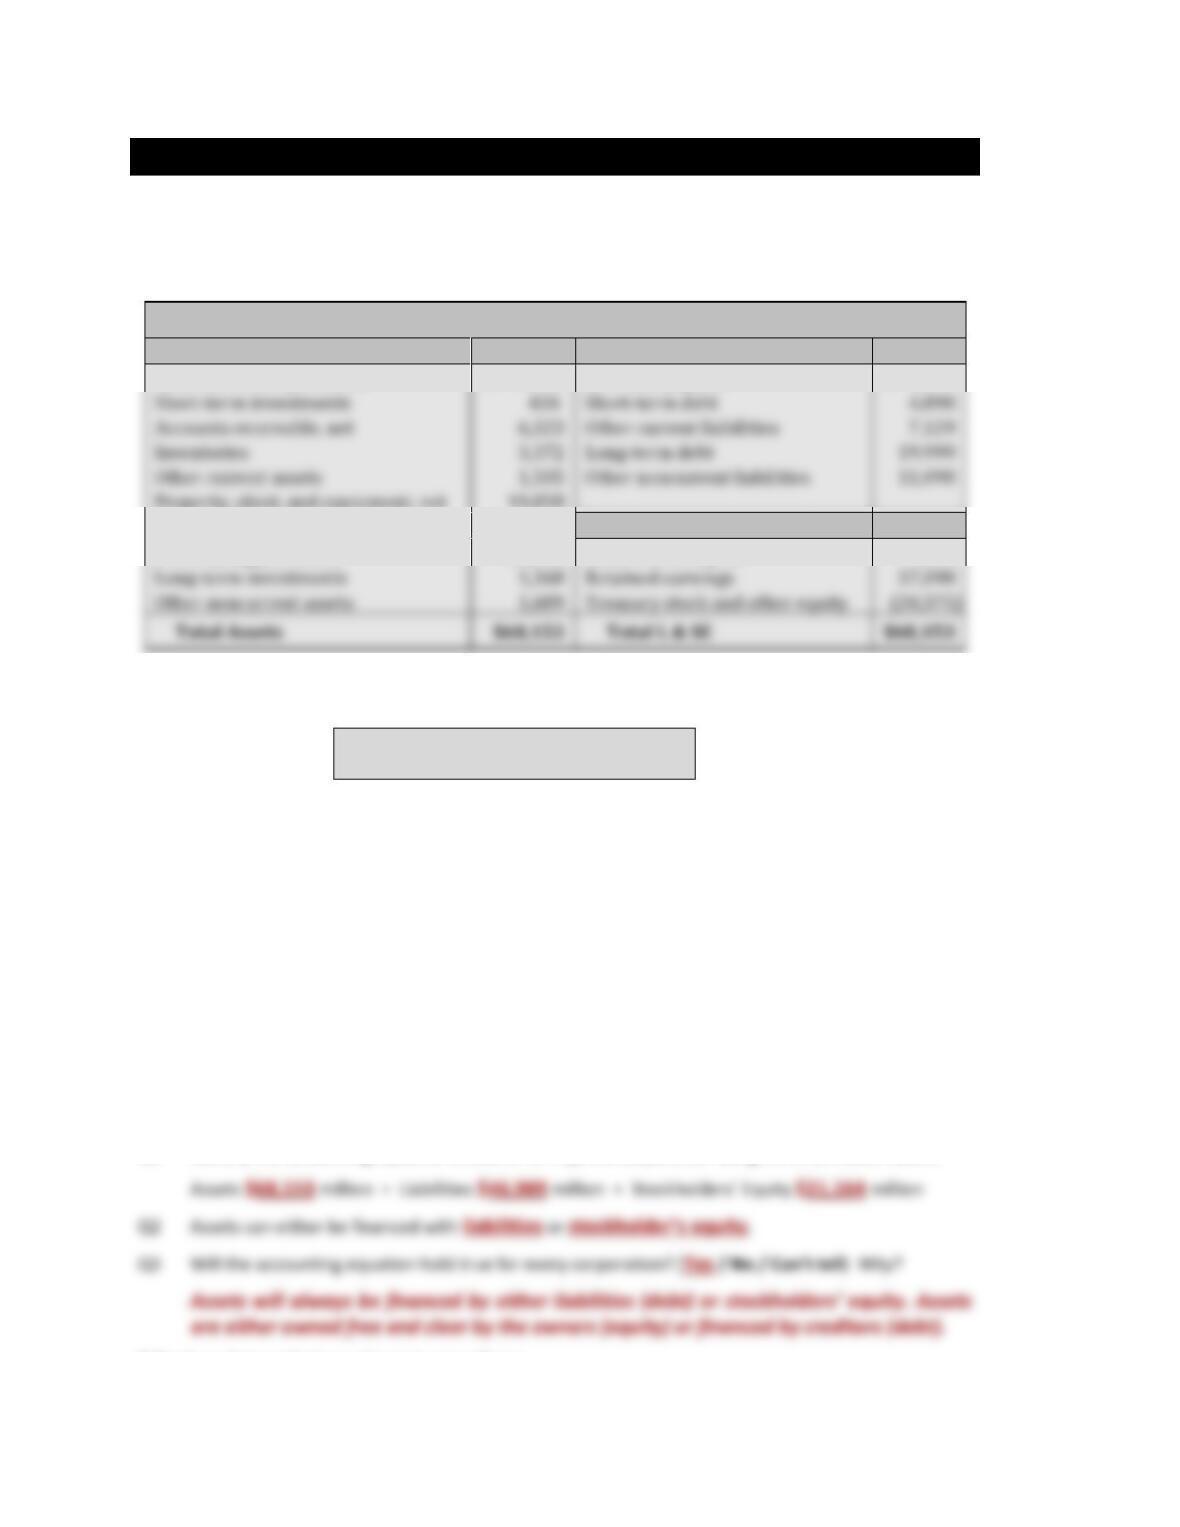
PEPSICO (PEP*) 12/25/2010 BALANCE SHEET ($ in millions)
ASSETS
LIABILITIES
Cash and cash equivalents
$ 5,943
Accounts payable
$ 3,865
Property, plant, and equipment, net
19,058
Goodwill
14,661
STOCKHOLDERS‘ EQUITY
Other intangible assets
13,808
Contributed capital
4,449
Long-term investments
Retained earnings
Other noncurrent assets
Treasury stock and other equity
The balance sheet reports assets and the amount of financing from liabilities and stockholders’ equity as
of a certain date. This relationship is summarized by the accounting equation, which is:
Assets = Liabilities + Stockholders’ Equity
Assets are items of value that a corporation owns or has a right to use. Typical asset accounts include
cash, accounts receivable, inventory, equipment, buildings, and land. Accounts receivable are amounts to
be received in the future from customers.
Liabilities are amounts owed to creditors; the amount of debt owed to third parties. Typical liability
accounts include accounts payable, wages payable, notes payable, and bonds payable. The key word
found in many liability accounts is payable. Accounts payable are amounts to be paid in the future to
suppliers.
Stockholders’ Equity is the portion of assets the owners own free and clear. Stockholders’ equity may also
be referred to as shareholders’ equity or owners’ equity. Typical stockholders’ equity accounts include:
Contributed Capital—Amounts paid-in (contributed) by stockholders to purchase common stock
and preferred stock.
Retained Earnings—Net income earned by the company since its incorporation and not yet
distributed as dividends.
Q1 Identify the accounting equation amounts for PepsiCo Corporation using the information above.
* Stock market symbols are shown in parentheses.
Short-term investments
Short-term debt
4,898
Accounts receivable, net
Other current liabilities
7,129
Inventories
Long-term debt
Other current assets
Other noncurrent liabilities
6e Introduction Page 18 Chapter 1
Q5 Circle whether the account is classified as an (A)sset, (L)iability, or part of Stockholders’ Equity (SE)
on the balance sheet.
a. Cash (A / L / SE)
e. Common stock (A / L / SE)
Q6 Use PepsiCo’s balance sheet on the previous page to answer the following questions:
a. What amount of cash does this company expect to receive from customers within the next
What types of asset costs are included in this account?
d. Since the company started business, what is the total amount shareholders have paid for
e. Since the company started business, how much net income was earned and not yet
6e Introduction Page 19 Chapter 1
ACTIVITY 4 INCOME STATEMENT
Purpose: • Understand the information reported on the income statement.
• Identify revenue and expense accounts reported on the income statement.
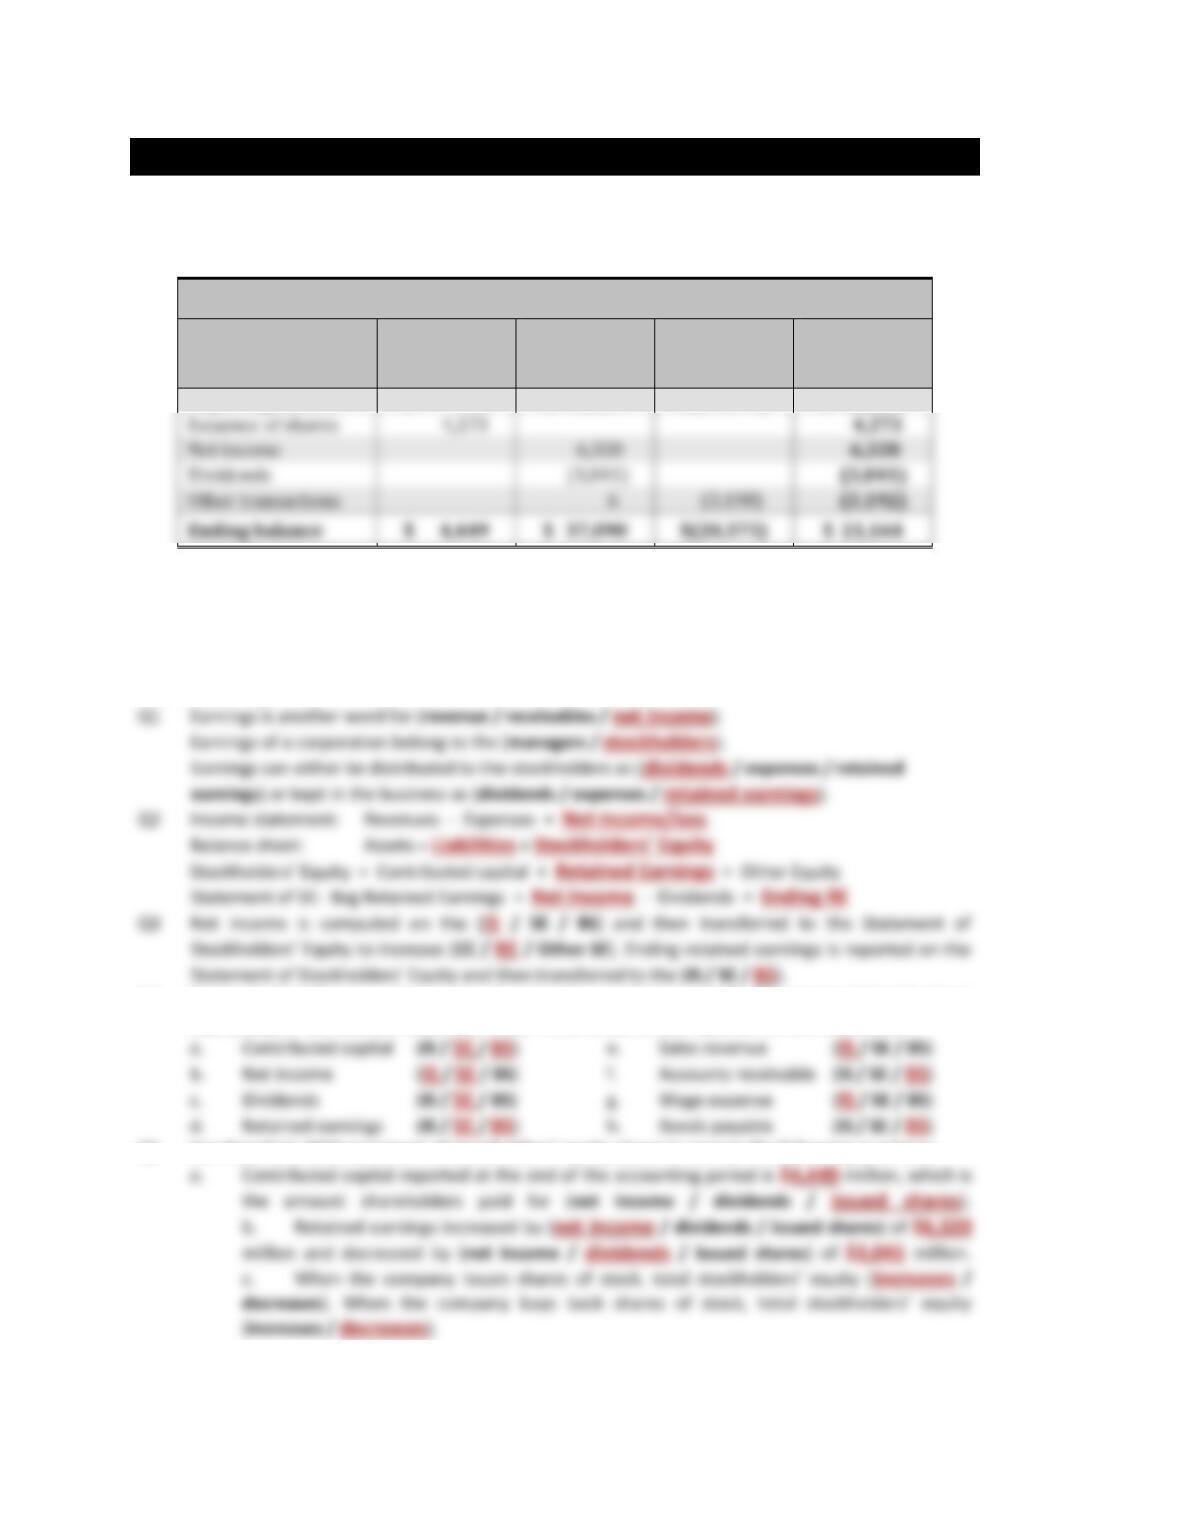
PEPSICO (PEP) 2010 INCOME STATEMENT ($ in millions)
Sales revenue
$ 57,838
Cost of goods sold
26,575
Gross profit
31,263
The income statement reports the company’s profitability during an accounting period.
Revenues are amounts received from customers for products sold and services provided. Sales revenue
and service revenue are amounts earned engaging in the primary business activity.
Expenses are the costs incurred to produce revenues. Expenses are recorded in the accounting period
they benefit (if a cause and effect relationship exists) or are incurred (if there is no cause and effect
relationship). Cost of goods sold expense reports the wholesale costs of inventory sold to customers
during the accounting period.
Net income is the difference between revenues and expenses. Net income is also referred to as profit
(loss), earnings, or the bottom line.
Revenues – Expenses = Net income
Q1 Circle whether the account is classified as a (Rev)enue, (Exp)ense, or (Not) reported on the income
statement.
Q2 Review PepsiCo’s 2010 income statement above and answer the following questions:
industry.
What specific types of costs would be included in this account for PepsiCo?
Selling, general and administrative (SGA) expense
22,326
Research and development expense
Other operating expenses
Income before income tax
Provision for income tax
6e Introduction Page 20 Chapter 1
ACTIVITY 5 STATEMENT OF STOCKHOLDERS’ EQUITY
Purpose: • Understand information provided by the Statement of Stockholders’ Equity.
• Understand changes within contributed capital and retained earnings.
• Identify relationships among the IS, RE, and the BS.
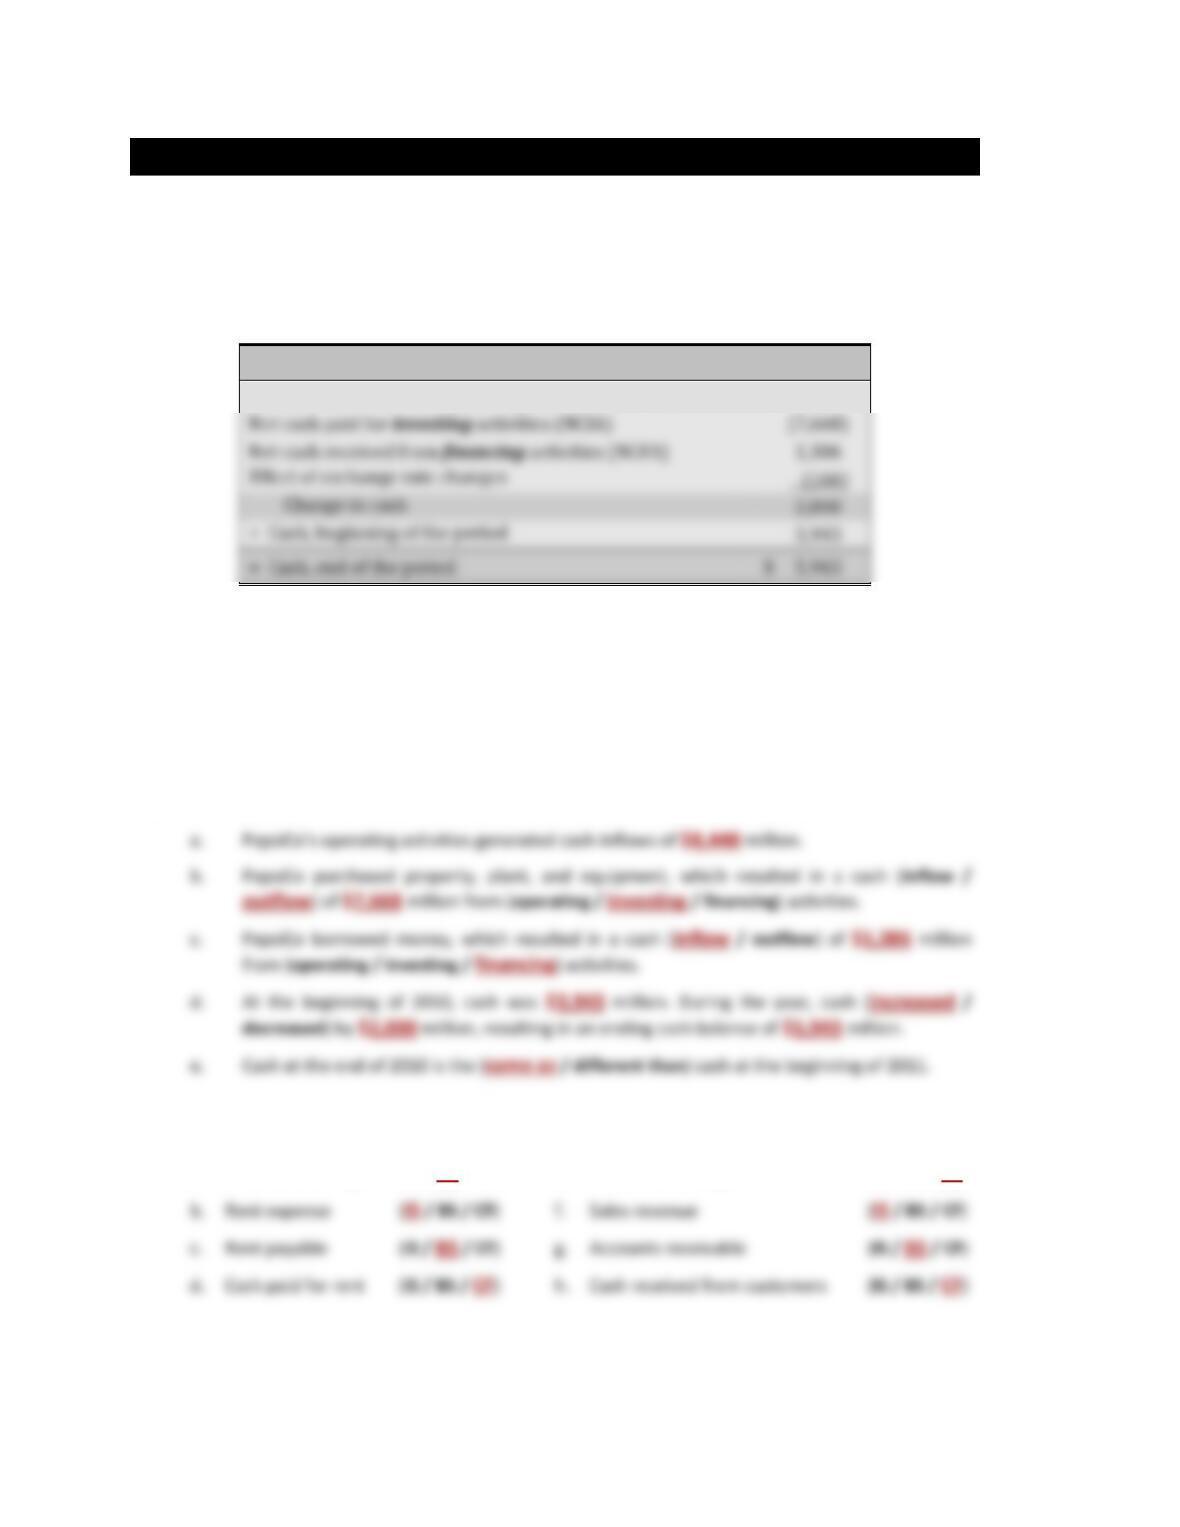
PEPSICO (PEP) 2010 STATEMENT OF STOCKHOLDERS’ EQUITY ($ in millions)
Contributed
Capital
Retained
Earnings
Other
Equity
Total
Stockholders
Equity
Beginning balance
$ 176
$ 33,805
$ (17,177)
$ 16,804
The statement of stockholders’ equity reports changes within the contributed capital, retained earnings,
and other equity accounts during an accounting period. Contributed capital (CC) is increased when
additional shares of stock are issued and decreased when those shares are retired. Retained earnings (RE)
is increased by net income (earnings) of the accounting period and decreased when earnings are
distributed as dividends to the stockholders. Earnings not distributed as dividends are reported as
retained earnings.
Q4 Circle whether the account is reported on the Income Statement (IS), Statement of Stockholders’
Equity (SE), or the Balance Sheet (BS). Note: Three amounts are reported on two statements.
Q5 Use PepsiCo’s 2010 statement of stockholders’ equity above to answer the following questions:
6e Introduction Page 21 Chapter 1
ACTIVITY 6 STATEMENT OF CASH FLOWS
Purpose: • Understand information provided by the Statement of Cash Flows.
• Understand that cash flows are organized as operating, investing, and financing
activities.
The statement of cash flows organizes cash inflows and cash outflows as operating activities, investing
activities, and financing activities.
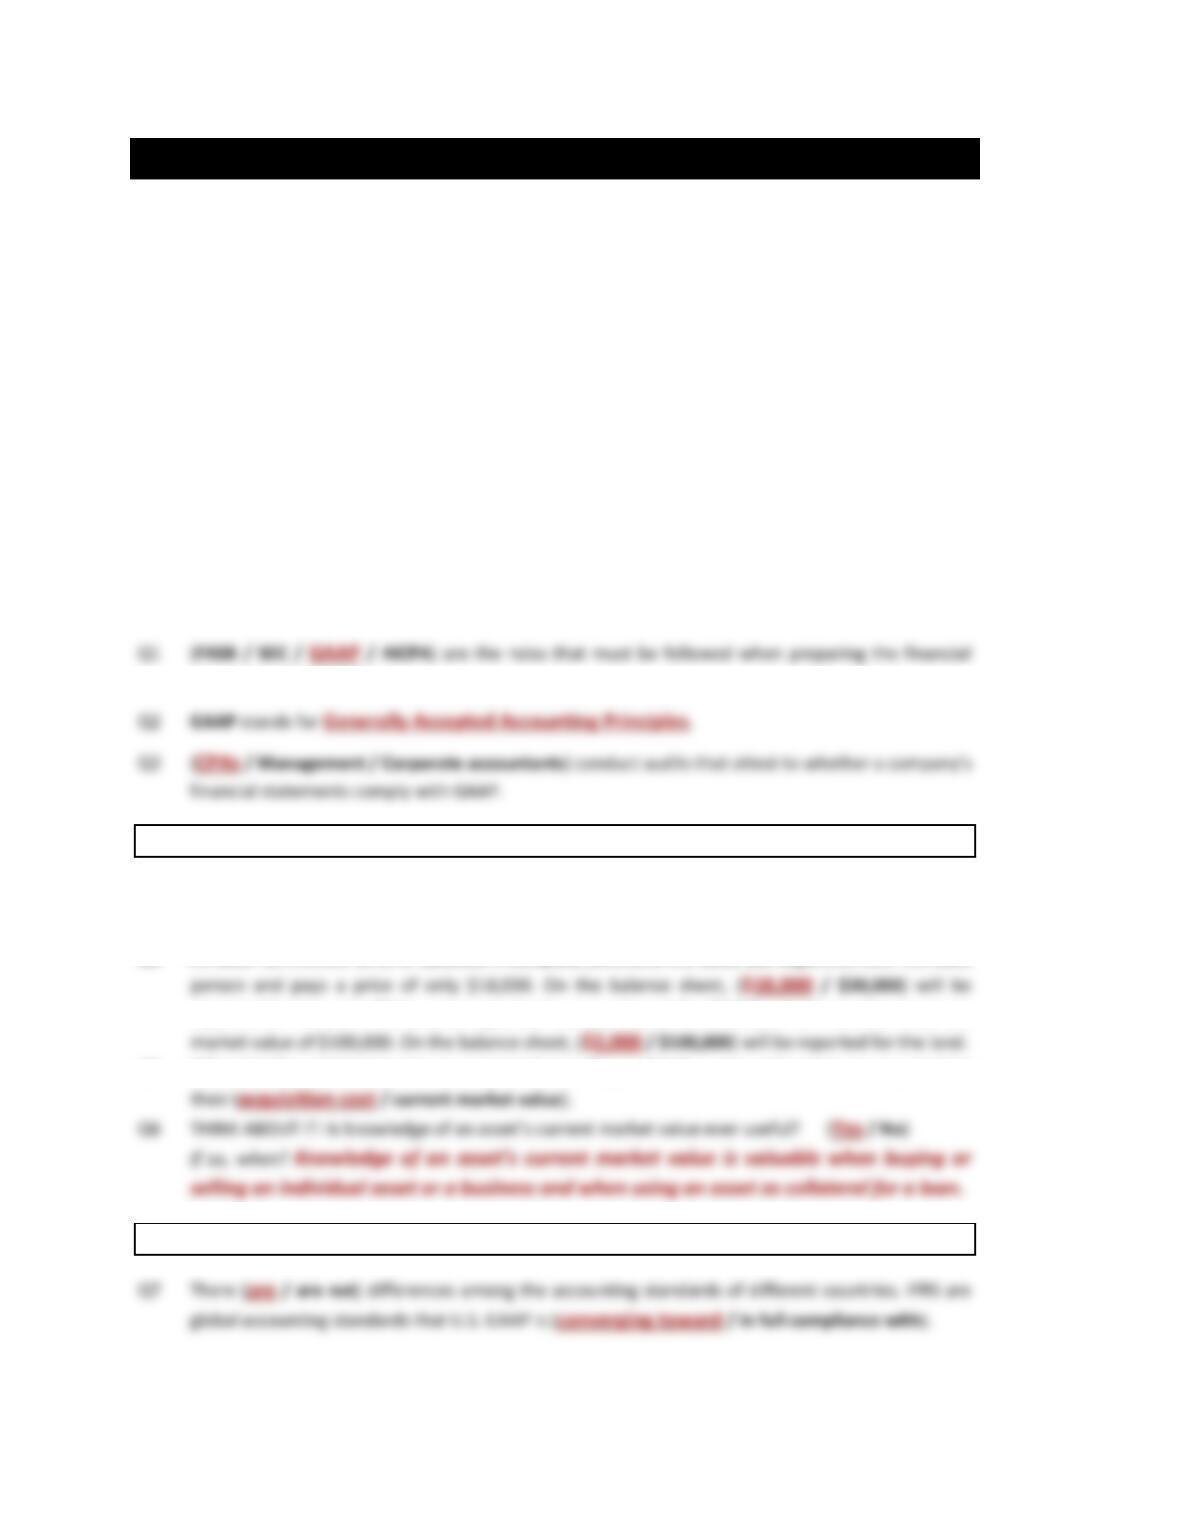
PEPSICO (PEP) 2010 STATEMENT OF CASH FLOWS ($ in millions)
Net cash received from operating activities (NCOA)
$ 8,448
Business activities can be classified into three distinct categories: operating, investing, and
financing. Operating Activities relate to a company’s main business of selling products or services to earn
net income. Investing Activities relate to the need for investing in property, plant, and equipment or
expanding by making investments in other companies. Financing Activities relate to how a company
finances its assets—with debt or stockholders’ equity. The Statement of Cash Flows describes a
company’s cash inflows and outflows for each of these three areas.
Q1 Use PepsiCo’s 2010 statement of cash flows above to answer the following questions:
Q2 Circle whether the account is reported on the Income Statement (IS), the Balance Sheet (BS), or the
Statement of Cash Flows (CF).
a. Retained earnings (IS / BS / CF) e. Cash from issuing common stock (IS / BS / CF)
Net cash paid for investing activities (NCIA)
Net cash received from financing activities (NCFA)
6e Introduction Page 22 Chapter 1
ACTIVITY 7 GENERALLY ACCEPTED ACCOUNTING PRINCIPLES (GAAP)
Purpose: • Understand that GAAP (Generally Accepted Accounting Principles) are the rules
of financial accounting.
• Apply the historical cost principle.
GAAP (Generally Accepted Accounting Principles) are the rules that companies must follow when
preparing financial statements.
• The SEC (Securities and Exchange Commission) has legislative authority to set the reporting rules
for accounting information of the publicly held corporations it regulates. It has designated GAAP to
be the official rules. The SEC provides oversight and enforcement authority over the Financial
Accounting Standards Board (FASB) and the Public Company Accounting Oversight Board (PCAOB).
• The seven full-time voting members of the FASB (Financial Accounting Standards Board) set
accounting reporting standards and formulate GAAP.
• Audits attest to whether a company’s financial statements comply with GAAP. Only CPAs (Certified
Public Accountants), licensed by the state, can conduct the audits.
• Ethical behavior is defined by the AICPA’s (American Institute of CPA’s) Code of Professional
Conduct. This code holds CPAs accountable for serving the public interest.
• The five full-time members of the PCAOB (Public Company Accounting Oversight Board) establish
auditing standards and conduct inspections of the public accounting firms that perform audits.
statements for external use.
HISTORICAL COST PRINCIPLE
GAAP #1: The Historical Cost Principle states that assets and services should be recorded at their
acquisition cost, thus using verifiable information that is the most reliable information.
Q4 An auto has a sticker price of $20,000. A company purchases the auto, but negotiates with the sales
reported for the auto. Thirty years ago, land was purchased for $2,000, which now has a current
Q5 When the financial statements are prepared according to GAAP, assets and services are reported at
INTERNATIONAL FINANCIAL REPORTING STANDARDS (IFRS)
6e Introduction Page 23 Chapter 1
ACTIVITY 8 ANALYSIS: RATIOS
Purpose: • Understand that analysis reveals relationships.
• Explore the relationships among assets, liabilities, revenues, and net income.
• Examine the debt ratio, ROS (return-on-sales) ratio, asset-turnover ratio, and
the ROA (return-on-asset) ratio.
The three types of analysis are Ratio Analysis, Trend Analysis (horizontal analysis), and Common-Size
Statements (vertical analysis). Analysis reveals relationships by comparing amounts to:
(2) the same information from a prior period (trend analysis),
RATIOS
Tiffany & Co (TIF), Wal-Mart Stores (WMT), and Ford Motor Company (F) are well-known companies, but
how much do you really know about them?
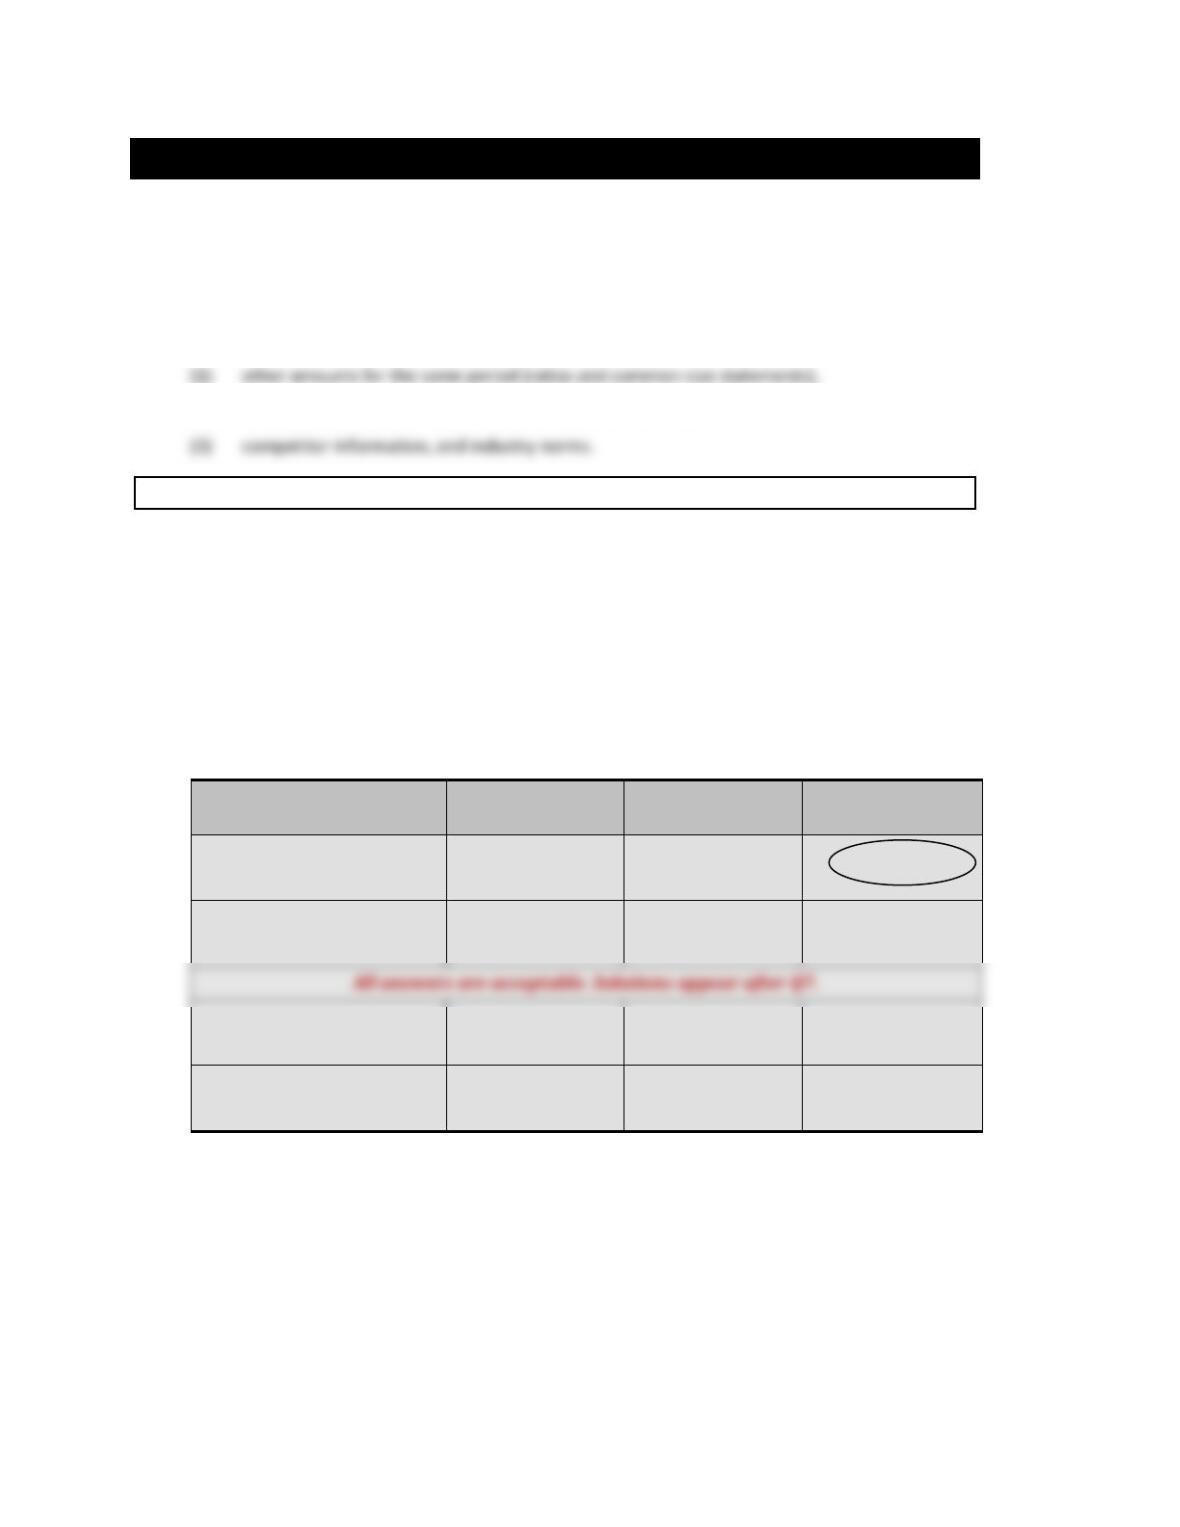
Q1 FINANCIAL TRIVIA For the fiscal years ending below, put a large circle in the box of the company
that you guess has …
a. the greatest amount of assets. (This one is completed for you.)
b. the greatest amount of liabilities.
c. the greatest amount of revenue.
d. the greatest amount of net income.
($ in millions)
TIF
Jan 31, 2011
WMT
Jan 31, 2011
F
Dec 31, 2010
ASSETS
$
$
$ 164,687
LIABILITIES
$
$
$
REVENUE
$
$
$
NET INCOME
$
$
$
Q2 FINANCIAL TRIVIA In each large circle, place the amount that you guess for …
a. the greatest amount of assets. (This is completed for you.)
b. the greatest amount of liabilities.
c. the greatest amount of revenue.
d. the greatest amount of net income.
Now turn to page 25 and see how well you guessed.
6e Introduction Page 24 Chapter 1
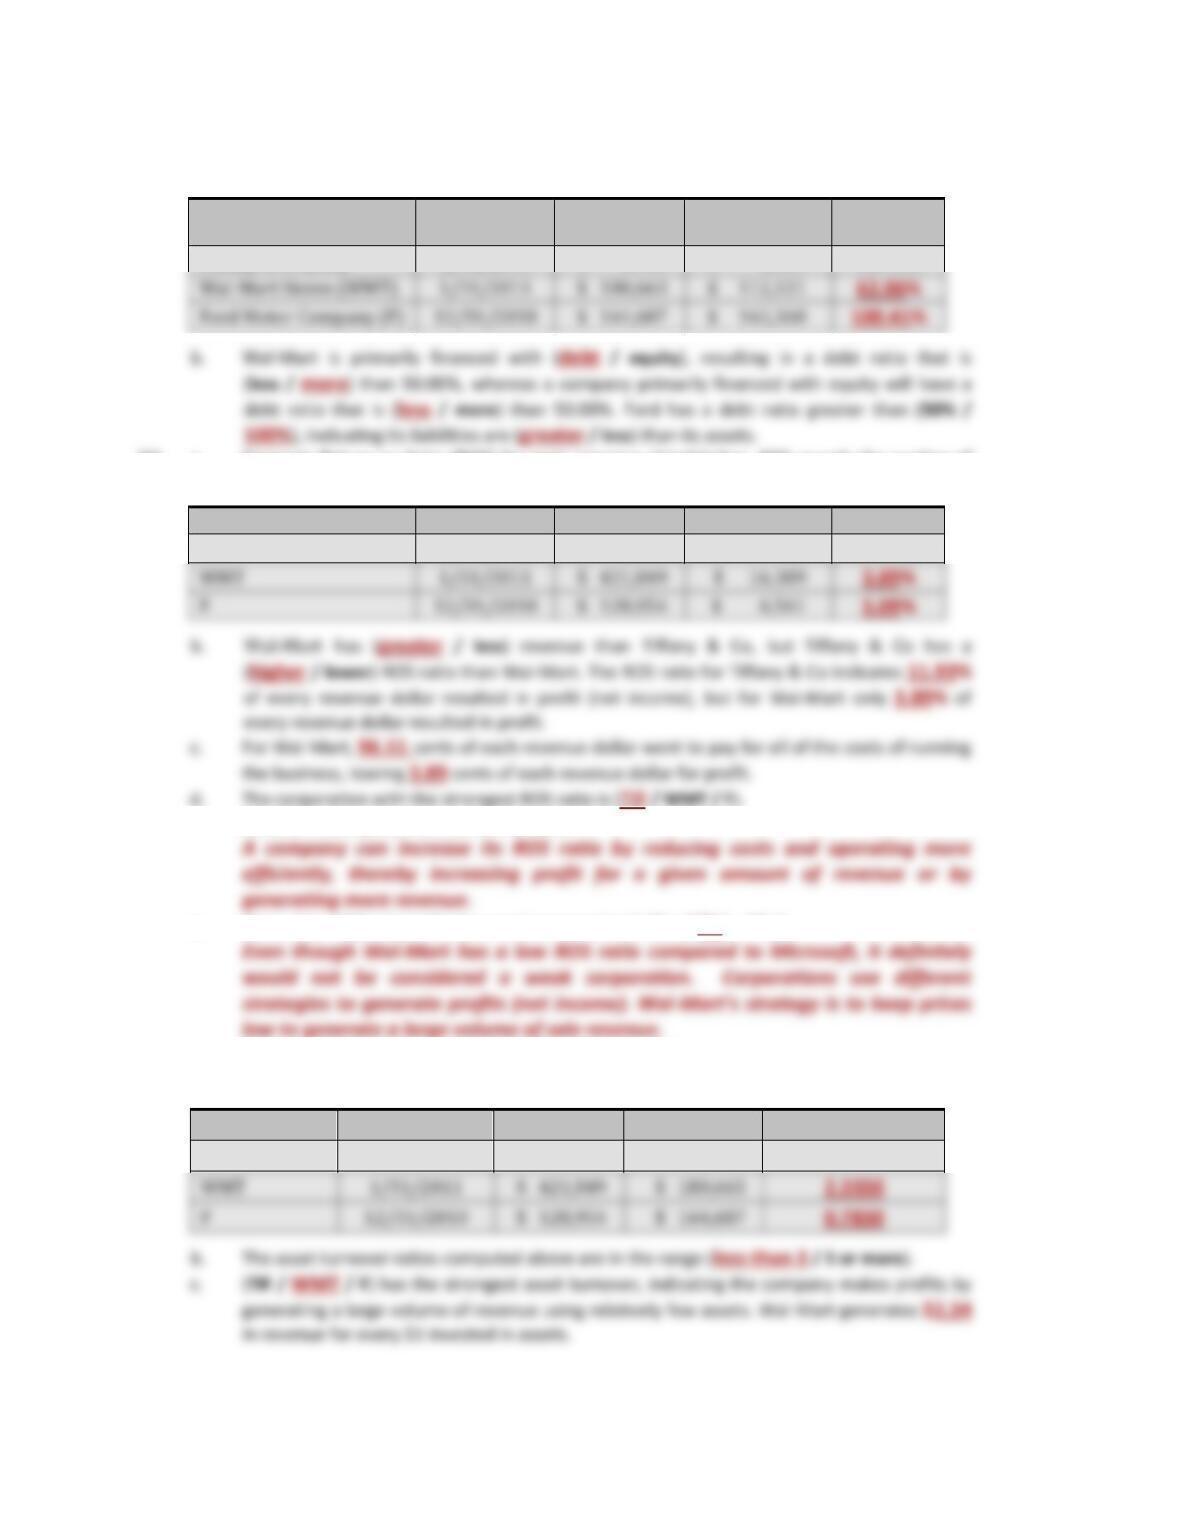
Q3 a. Compute the debt ratio for each company listed below. The debt ratio reveals the
proportion of assets financed with debt. Debt ratio = Total liabilities / Total assets
($ in millions)
Year Ended
Total Assets
Total
Liabilities
Debt
Ratio
Tiffany & Co (TIF)
1/31/2011
$ 3,736
$ 1,558
41.70%
Q4 a. Compute Return on Sales (ROS) for each company listed below. ROS reveals the portion of
each revenue dollar that results in profit. ROS = Net income / Sales revenue
($ in millions)
Year Ended
Revenue
Net income
ROS
TIF
1/31/2011
$ 3,085
$ 368
11.93%
WMT
$ 421,849
$ 16,389
F
$ 128,954
How can a company increase its ROS ratio?
e. Does a low ROS ratio indicate a weak corporation? (Yes / No) Why?
Q5 a. Compute Asset Turnover for each company listed below. Asset Turnover reveals how
efficiently assets are used to generate revenue. Asset Turnover = Sales Revenue / Total Assets
($ in millions)
Year Ended
Revenue
Total Assets
Asset Turnover
TIF
1/31/2011
$ 3,085
$ 3,736
0.8257
WMT
$ 421,849
$ 180,663
F
$ 128,954
$ 164,687
Ford Motor Company (F)
$ 164,687
$ 165,360
6e Introduction Page 25 Chapter 1
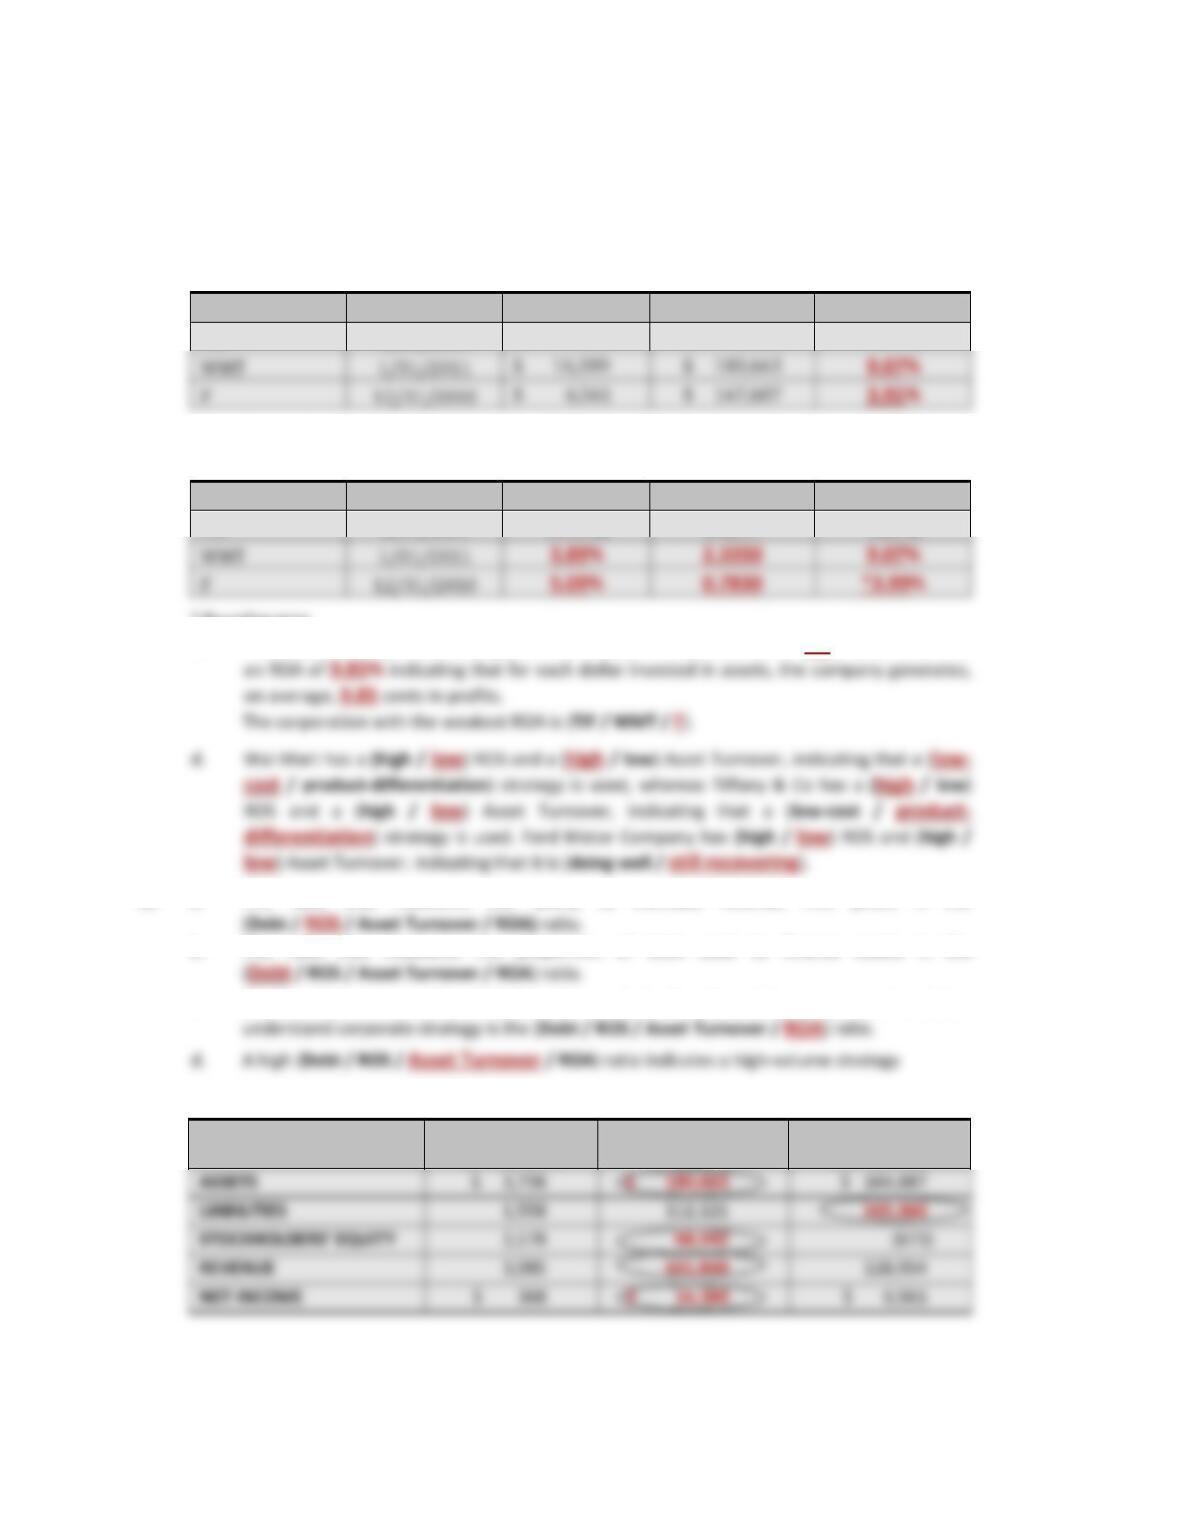
Q6 a. Compute Return on Assets (ROA) for each company listed below. ROA reveals how efficiently
a company uses its assets to generate profit (net income). A high ROA ratio depends on
managing asset investments and controlling expenses to keep net income high. Analyze the
components, ROS and Asset Turnover, to better understand corporate strategy (product–
differentiation vs. low-cost strategies). ROA is the broadest measure of profitability.
ROA = Net Income / Total Assets
($ in millions)
Year Ended
Net Income
Total Assets
ROA
TIF
1/31/2011
$ 368
$ 3,736
9.85%
b. For each company below, compute ROA by multiplying the two components, Return on
Sales and Asset Turnover (previously computed). ROA = ROS x Asset T/O
($ in millions)
Year Ended
ROS x
Asset Turnover
= ROA
TIF
1/31/2011
11.93%
0.8257
9.85%
WMT
F
* Rounding error
c. The corporation with the strongest overall measure of profitability is (TIF / WMT / F) with
Q7 a. The ratio that measures the ability to translate revenue into profit is the
b. The ratio that measures the proportion of debt used to finance assets is the
c. The broadest measure of profitability that can be broken down into components to better
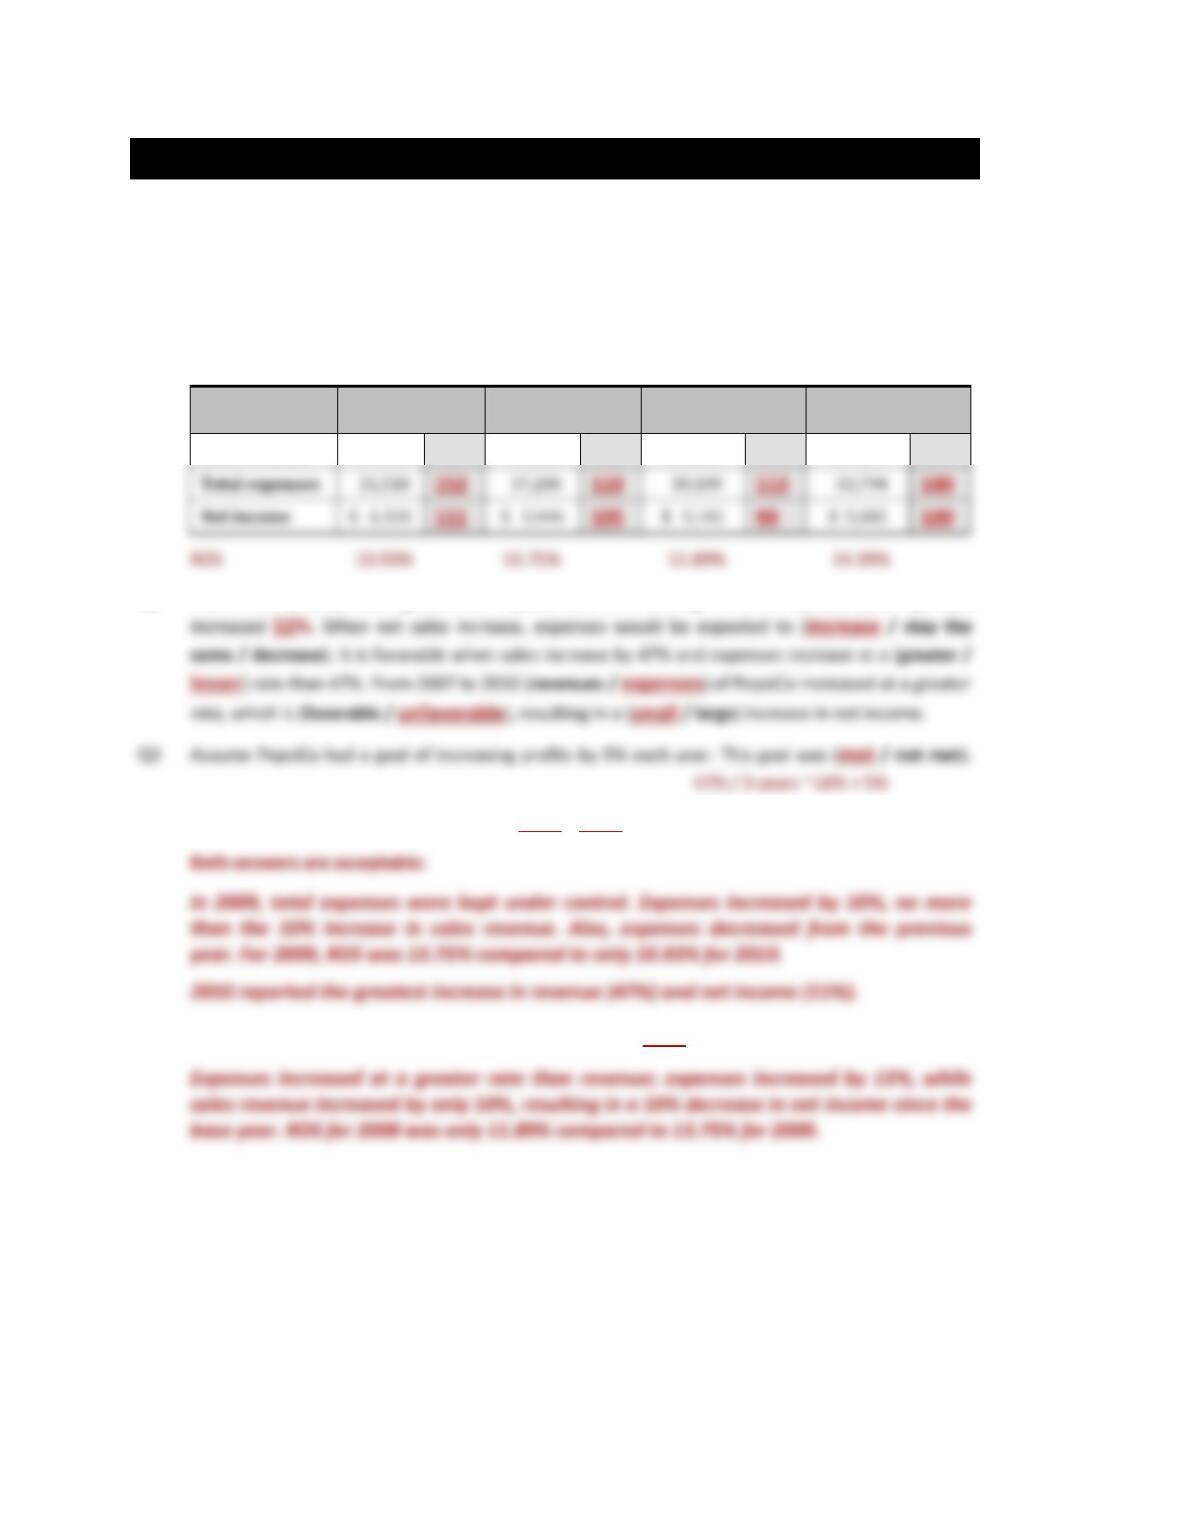
Solutions to FINANCIAL TRIVIA Q1 and Q2.
($ in millions)
TIF
Jan 31, 2011
WMT
Jan 31, 2011
F
Dec 31, 2010
WMT
$ 16,389
F
$ 6,561
6e Introduction Page 26 Chapter 1
ACTIVITY 9 ANALYSIS: TREND
Purpose: • Prepare a trend analysis and understand the information provided.
A trend analysis compares amounts of a more recent year to a base year. The base year is the earliest
year being studied. The analysis measures the percentage of change from the base year.
Q1 Complete the trend indexes for Total expenses and Net income using the amounts listed below. To
compute, divide each amount by the amount of the base year and multiply by 100. Record the
resulting trend index in the shaded area below. Use 2007 as the base year.
PEPSICO
($ in millions)
2010
2009
2008
Base Year
2007
Sales revenue
$57,838
147
$43,232
110
$43,251
110
$39,474
100
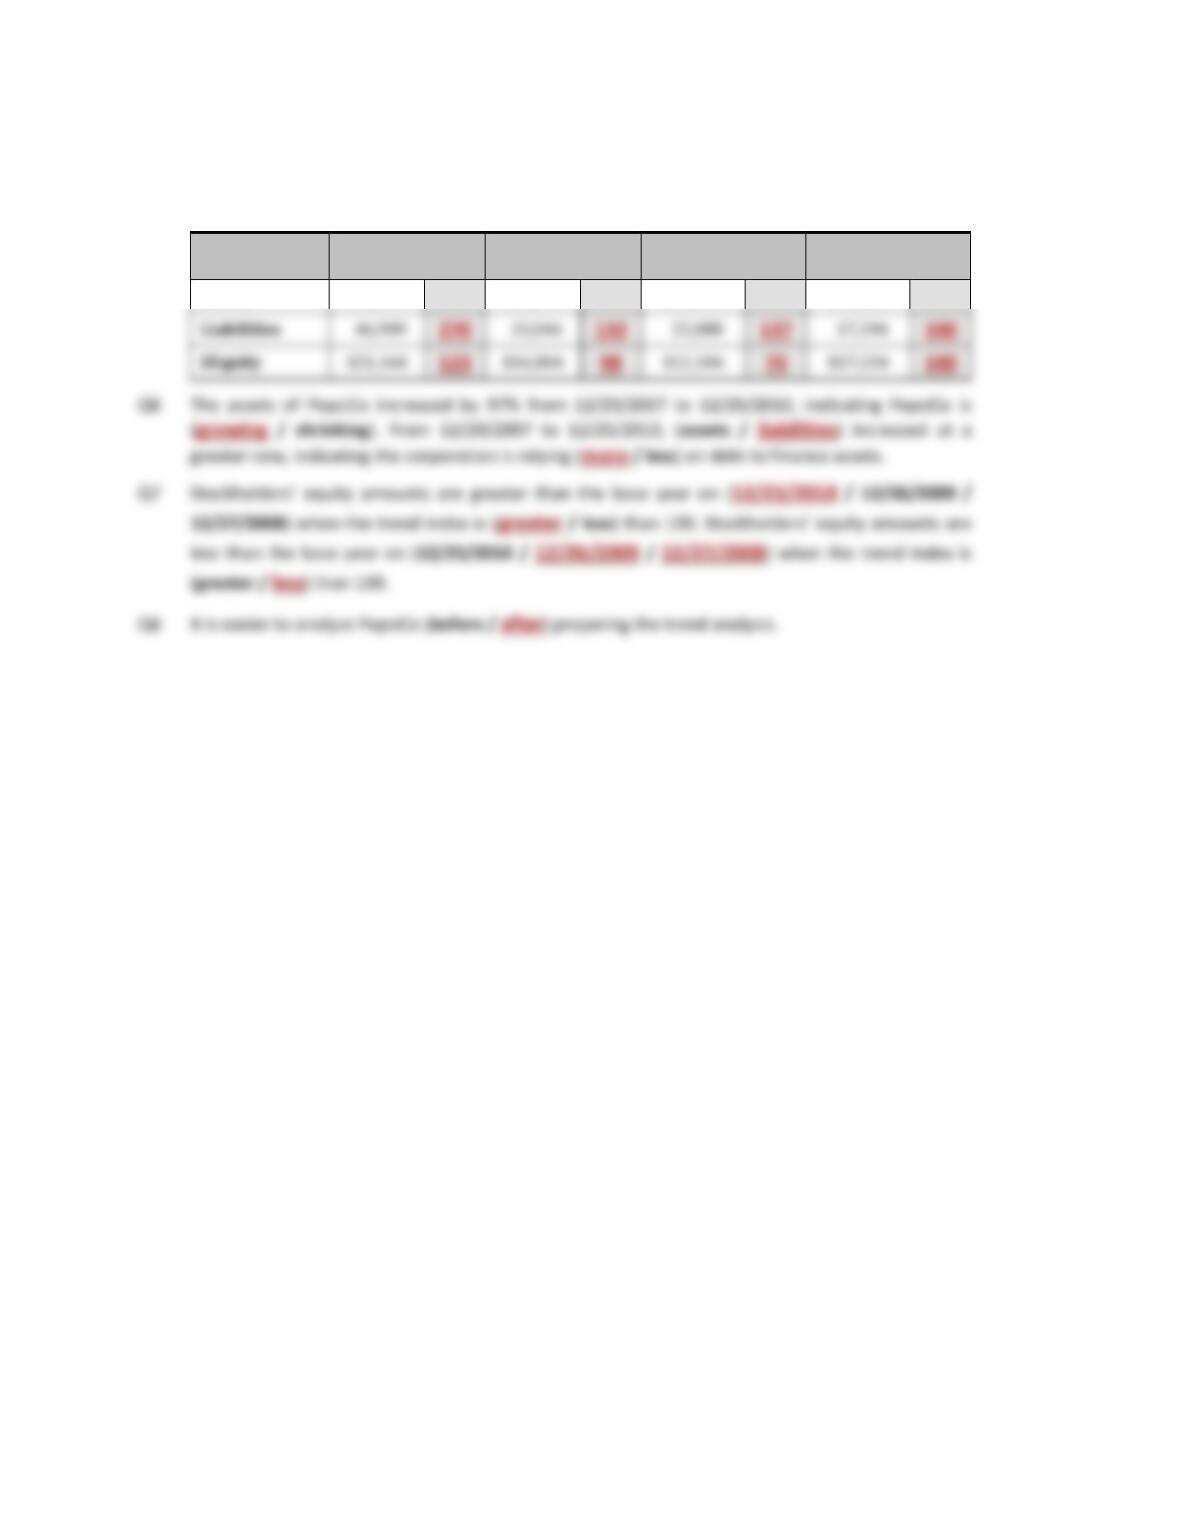
Q2 From 2007 to 2010 sales growth for PepsiCo was 47%. During the same period, total expenses
Q4 The best year financially for PepsiCo was (2010 / 2009 / 2008). Why?
The worst year financially for PepsiCo was (2010 / 2009 / 2008). Why?
Total expenses
Net income
$ 5,946
$ 5,682
6e Introduction Page 27 Chapter 1
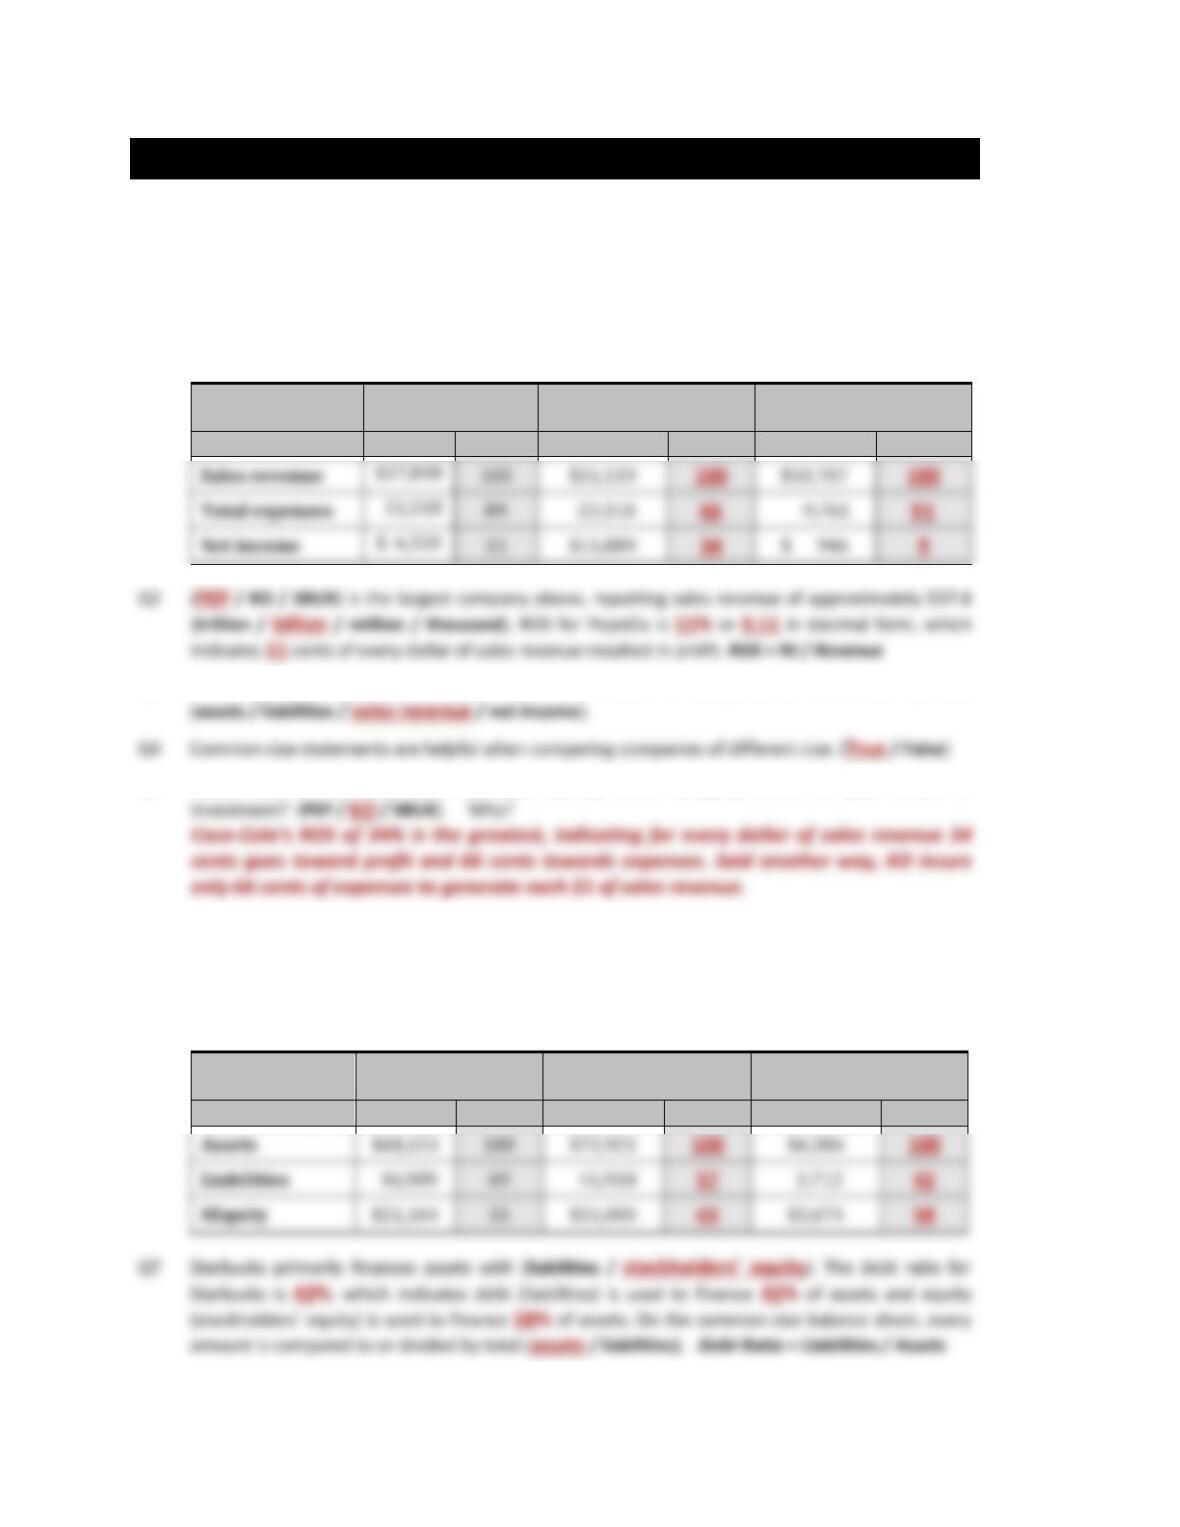
Q5 Complete the trend indexes for Liabilities and Stockholders’ Equity using the amounts listed below.
To compute, divide each amount by the amount for the base year and multiply by 100. Record the
resulting trend index in the shaded area below. Use 2007 as the base year.
PEPSICO
($ in millions)
12/25/2010
12/26/2009
12/27/2008
Base Year
12/29/2007
Assets
$68,153
197
$39,848
115
$35,994
104
$34,628
100
Liabilities
SEquity
$21,164
$16,804
$12,106
$17,234
6e Introduction Page 28 Chapter 1
ACTIVITY 10 ANALYSIS: COMMON–SIZE STATEMENTS
Purpose: • Prepare common-size statements and understand the information provided.
The COMMON-SIZE INCOME STATEMENT compares all amounts within one year to revenue of that same
year. The analysis measures each income statement amount as a percentage of revenue.
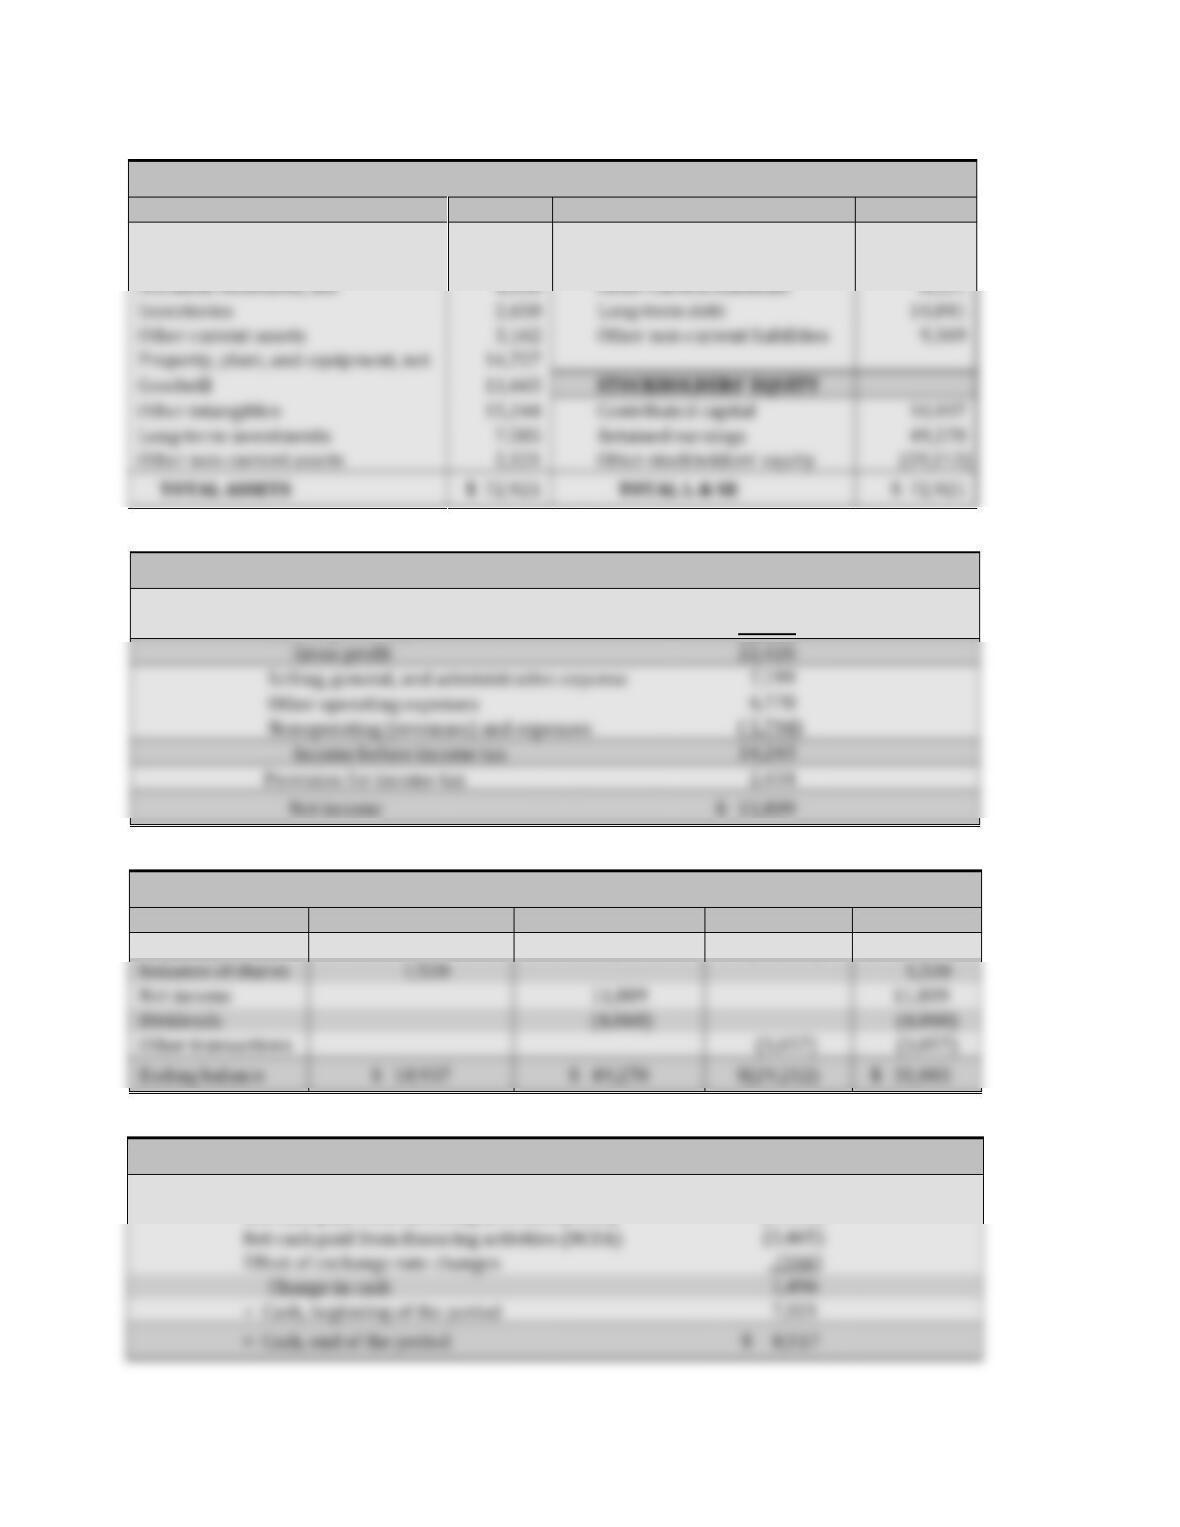
Q1 Prepare the common-size statements for the Coca-Cola (KO) and the Starbucks (SBUX) companies
listed below. To compute, divide each amount on the income statement by sales revenue. Record
the resulting common-size percent in the shaded area provided.
2010
PEPSICO (PEP)
COCA-COLA (KO)
STARBUCKS (SBUX)
($ in millions)
Amount
%
Amount
%
Amount
%
Q3 On the common-size income statement, every amount is compared to or divided by total
Q5 Based only on the information provided above, which company would be your choice of
The COMMON-SIZE BALANCE SHEET compares all amounts within one year to total assets of that same
year. The analysis measures each balance sheet amount as a percentage of total assets.
Q6 Prepare the common-size statements for the Coca-Cola (KO) and Starbucks (SBUX) companies
listed below. To compute, divide each amount on the balance sheet by total assets. Record the
resulting common-size percent in the shaded area provided.
2010
PEPSICO (PEP)
COCA-COLA (KO)
STARBUCKS (SBUX)
($ in millions)
Amount
%
Amount
%
Amount
%
6e Introduction Page 29 Chapter 1
COCA-COLA (KO*) 12/31/2010 BALANCE SHEET ($ in millions)
ASSETS
LIABILITIES
Cash and cash equivalents
$ 8,517
Accounts payable
$ 1,887
Short-term investments
2,820
Short-term debt
8,100
COCA-COLA (KO) 2010 INCOME STATEMENT ($ in millions)
Sales revenue
$ 35,119
Cost of goods sold
12,693
Gross profit
22,426
Selling, general, and administrative expense
Other operating expenses
Nonoperating (revenues) and expenses
( 5,794)
Income before income tax
Provision for income tax
COCA-COLA (KO) 2010 STATEMENT OF STOCKHOLDERS’ EQUITY ($ in millions)
Contributed Capital
Retained Earnings
Other Equity
TOTAL S/E
Beginning balance
$ 9,417
$ 41,537
$ (26,155)
$ 24,799
Issuance of shares
1,520
1,520
Dividends
(4,068)
Other transactions
(3,057)
COCA-COLA (KO) 2010 STATEMENT OF CASH FLOWS ($ in millions)
Net cash received from operating activities (NCOA)
$ 9,532
Net cash paid from investing activities (NCIA)
(4,405)
Net cash paid from financing activities (NCFA)
Effect of exchange rate changes
(166)
Change in cash
1,496
+ Cash, beginning of the period
7,021
Accounts receivable, net
4,430
Other current liabilities
8,521
Inventories
Long-term debt
Other current assets
3,162
Other non-current liabilities
9,369
Property, plant, and equipment, net
Goodwill
Other intangibles
Contributed capital
Long-term investments
7,585
Retained earnings
Other non-current assets
2,121
Other stockholders’ equity
6e Introduction Page 30 Chapter 1
ACTIVITY 11 TEST YOUR UNDERSTANDING
Purpose: • Review the four financial statements.
• Compute net income.
• Prepare and evaluate trend analyses, common-size statements, and ratios.
Q1 Make the following statements true by correcting the false information.
Note: There may be more than one way to correct the false information.
cash flows.
those assets are financed.
stockholders’ equity account.
Q2 Circle the income statement amounts and cross out amounts not reported on the income
statement. Then compute net income.
Supply expense $ 8,000 Sales revenue $100,000
Q3 Suppose that during the first year of business $100,000 of wage costs were incurred; $90,000 were
paid in cash to employees; and the remaining wages will be paid to employees on January 3 of the
coming year, the next payday. What account title and amount will be reported on the following
year-end financial statements?
6e Introduction Page 31 Chapter 1
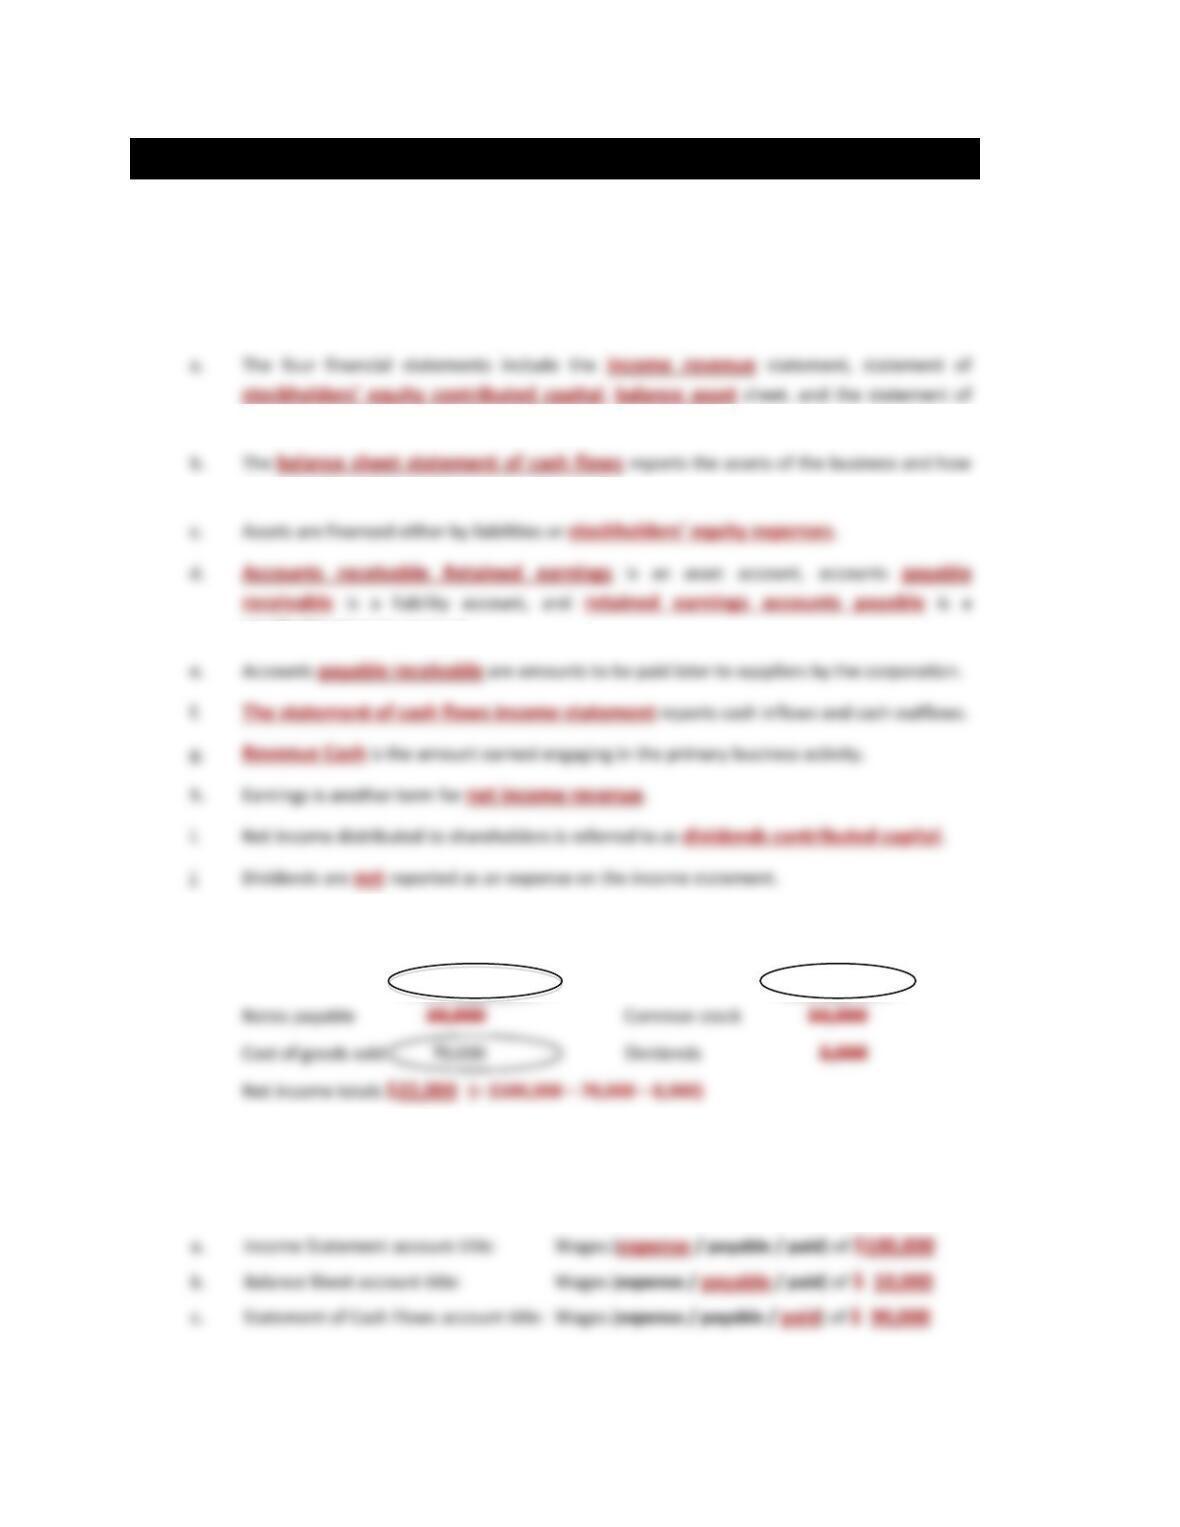
Q4 Review the 2010 Financial Statements of the Coca-Cola Company on page 28 to answer the
following questions:
Q5 Complete Coca-Cola’s trend indexes for Total expenses and Net income using the amounts listed
below. Record the resulting trend index in the shaded area. Use 2007 as the base year.
Coca-Cola (KO)
($ in millions)
2010
2009
2008
Base Year
2007
Sales revenue
$35,119
122
$30,990
107
$31,994
111
$28,857
100
Net income
$11,809
$ 6,824
$ 5,981
6e Introduction Page 32 Chapter 1
Q6 Complete Coca-Cola’s common-size statements for 12/31/2008, 12/31/2009, and 12/31/2010
using the amounts listed below. Record the resulting common-size percent in the shaded area
provided.
Coca-Cola (KO)
($ in millions)
Dec 31,
2010
%
Dec 31,
2009
%
Dec 31,
2008
%
Dec 31,
2007
%
Q7 To answer the following questions, use the chart below that presents financial information for
PepsiCo, Coca-Cola, and ratio averages for the beverage industry.
($ in millions)
PEP
12/25/2010
KO
12/31/2010
Beverage
Industry Average
Assets
$ 68,153
$ 72,921
NA
Liabilities
46,989
41,918
NA
Stockholders’ Equity
21,164
31,003
NA
Revenue
57,838
35,119
NA
Net Income
$ 6,320
$ 11,809
NA
ROS
10.93%
33.63%
19%
Asset Turnover
0.8486
0.4816
0.80
ROA
9.27%
16.19%
15%
Debt Ratio
68.95%
57.48%
74%
Assets
Liabilities
SEquity