MAKING THE CONNECTION: INTEGRATIVE EXERCISE
PART 1: CHAPTERS 1–4
1. Basic Enhanced Premium
*0.7 × $15.00; 0.7 × $22.00; 0.7 × $28.00
Method I costs include all production, marketing, and customer service costs.
2. Direct tracing is a cost assignment method that relies on physically observa-
ble causal relationships to assign costs to cost objects. Driver tracing relies
on causal factors called drivers to assign costs to cost objects. Allocation re-
lies on assumed linkages or convenience (ease of use) to assign cost to cost
Comp. Prob. 1 (Continued)
3. The two divisions differ based on the nature of their output. Telephones are
tangible products, and cable services are intangible products. Tangible prod-
4. Cable Service Division
Income Statement
For the Month of March
Sales revenue ………………………………………………………………… $27,800,000a
Cost of services sold ……………………………………………………… 14,105,000b
MTC1-3
Comp. Prob. 1 (Continued)
5.
Phone Division
Income Statement
For the Month of March
Sales …………………………………………………………… $1,170,000
Cost of goods sold:
Beginning finished goods inventory ………… $ 480,000
Add: Cost of goods manufactured* ………….. 832,000
*Statement of Cost of Goods Manufactured
For the Month of March
Direct materials:
Beginning inventory ……………………………….. $ 23,000
Add: Purchases ………………………………………. 312,000
Overhead:
Plant and equipment depreciation ……………. $ 50,000
Materials handling …………………………………… 85,000
Inspections …………………………..………………… 60,000
Scheduling ……………………………………………… 30,000
Comp. Prob. 1 (Continued)
6. The Phone Division has added a number of different products over the years.
The different products seem to consume overhead resources in quite differ-
ent proportions. There is some belief that using only unit-based drivers is in-
adequate for assigning overhead costs. Furthermore, 10 years have passed
Comp. Prob. 1 (Continued)
7. Formula one, overhead and direct labor cost:
Regression Statistics
Multiple R
0.61704
R Square
0.380739
Adjusted R Square
0.333103
Standard Error
31620.71
Observations
ANOVA
df
SS
MS
F
Regression
1
7.99E+09
7.99E+09
7.992748
Residual
Total
Intercept
1.255728
0.231316
2.827145
0.014268
Formula two, materials handling cost and number of moves:
Regression Statistics
Multiple R
0.95028
R Square
0.903033
Adjusted R Square
0.890912
Standard Error
2879.832
Observations
ANOVA
df
SS
MS
F
Regression
1
6.18E+08
6.18E+08
74.50204
Residual
8
66347449
8293431
Intercept
4.621647
0.001707
8.631457
Comp. Prob. 1 (Continued)
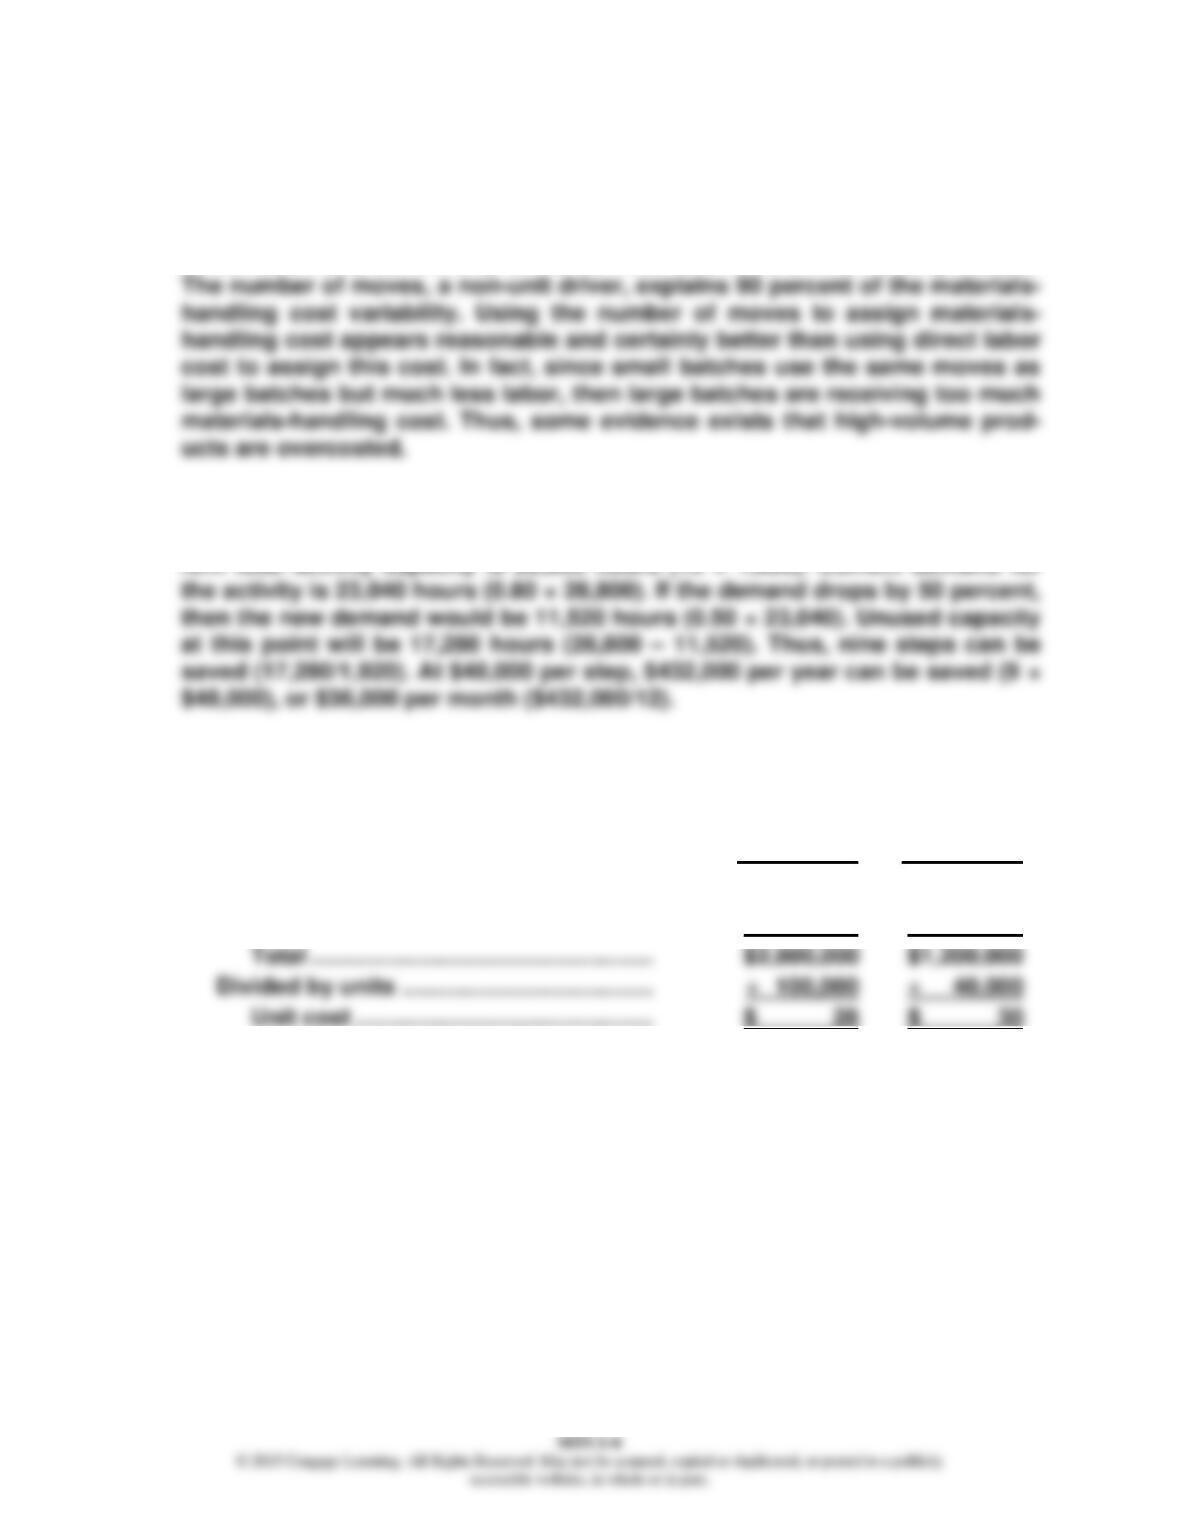
Jacob’s comments seem to be on target. Direct labor cost explains less than
40 percent of the variability in overhead cost—not enough to justify using
direct labor cost as the only driver to trace overhead to individual products.
8. Inspection activity follows a step-cost function, with each step being defined
by 1,920 hours per year (12 × 160). Each step costs $48,000 ($4,000 × 12). Cur-
rent total activity capacity is 28,800 hours (15 × 1,920). Current demand for
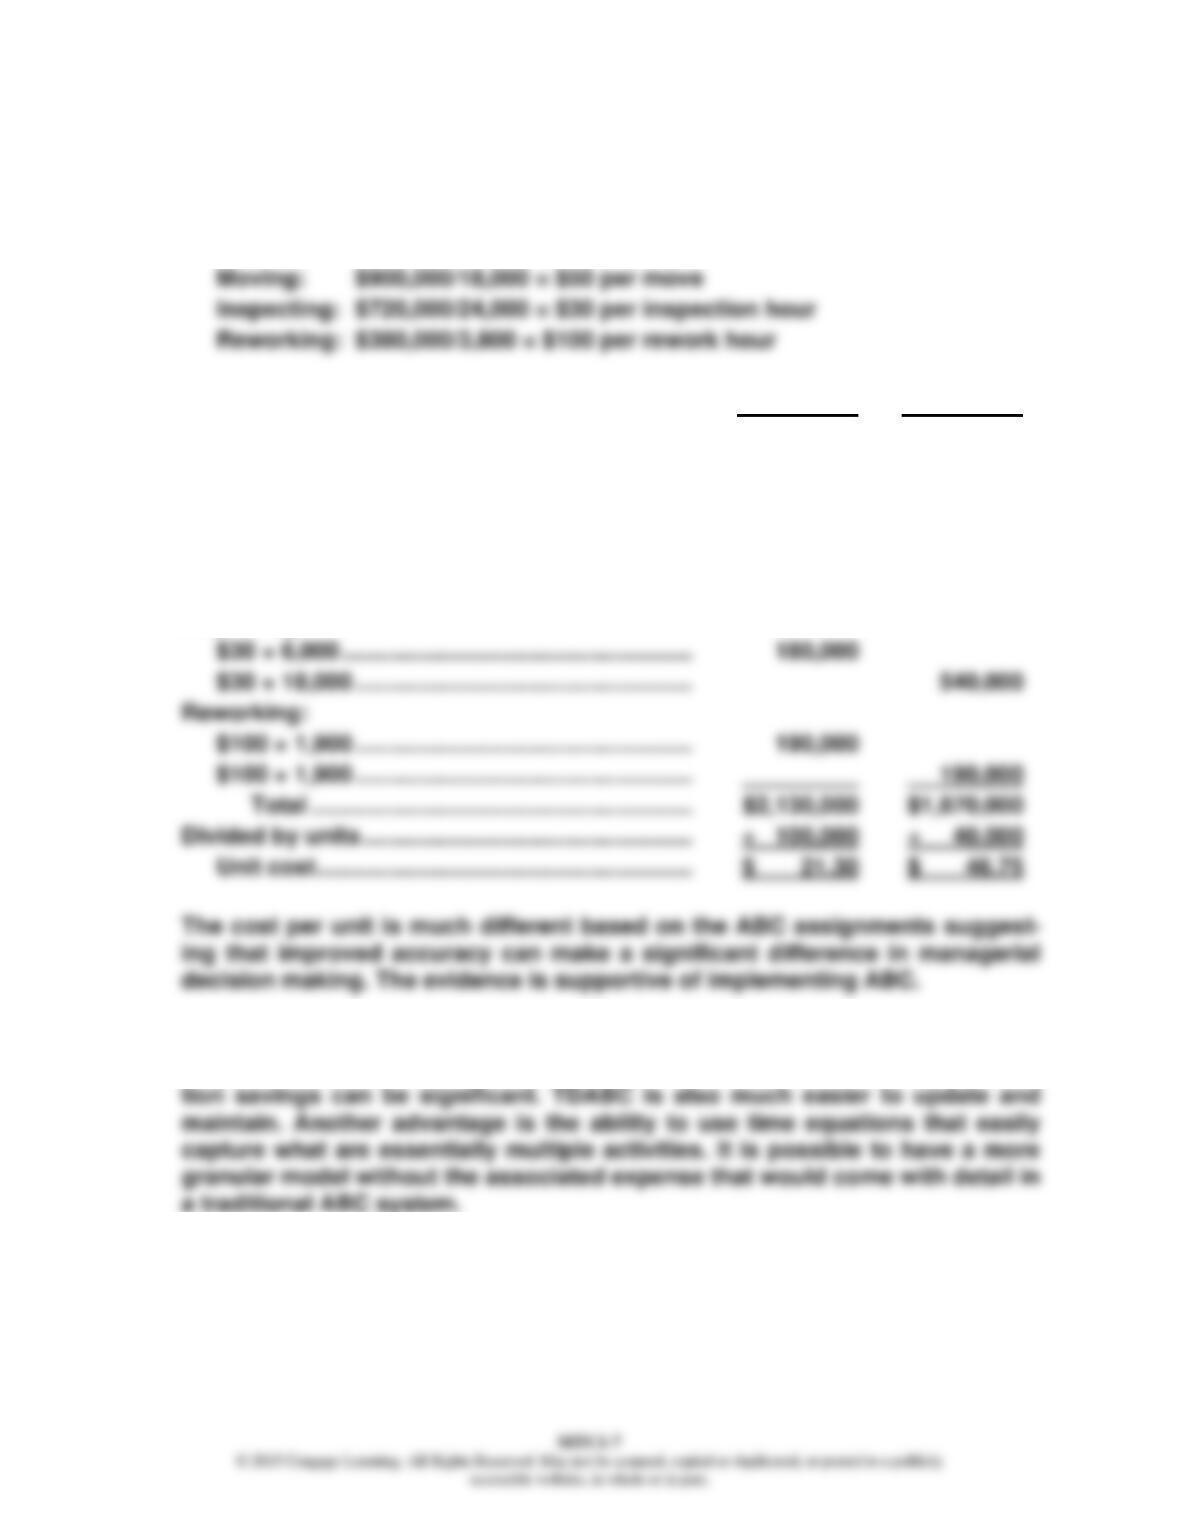
9. Overhead rate: $4,000,000/$1,250,000 = $3.20 per direct labor dollar, or 320
percent of direct labor cost. Total overhead assigned to each model:
Regular Deluxe
3.20 × $875,000 ………………………………….. $2,800,000
3.20 × $375,000 ………………………………….. $1,200,000
Comp. Prob. 1 (Continued)
10. Activity Rates:
Other: $2,000,000/$1,250,000 = 1.60 per direct labor dollar
Regular Deluxe
Other:
1.60 × $875,000 ……………………………………….. $1,400,000
1.60 × $375,000 ……………………………………….. $ 600,000
Moving:
$50 × 7,200 ……………………………………………… 360,000
$50 × 10,800 ……………………………………………. 540,000
Inspecting:
11. TDABC simplifies the implementation of ABC by eliminating the need for first–
stage ABC. It is easier and faster to build a TDABC model. The implementa-