Name:
Section:
Score: 0%
Key Code:
a.
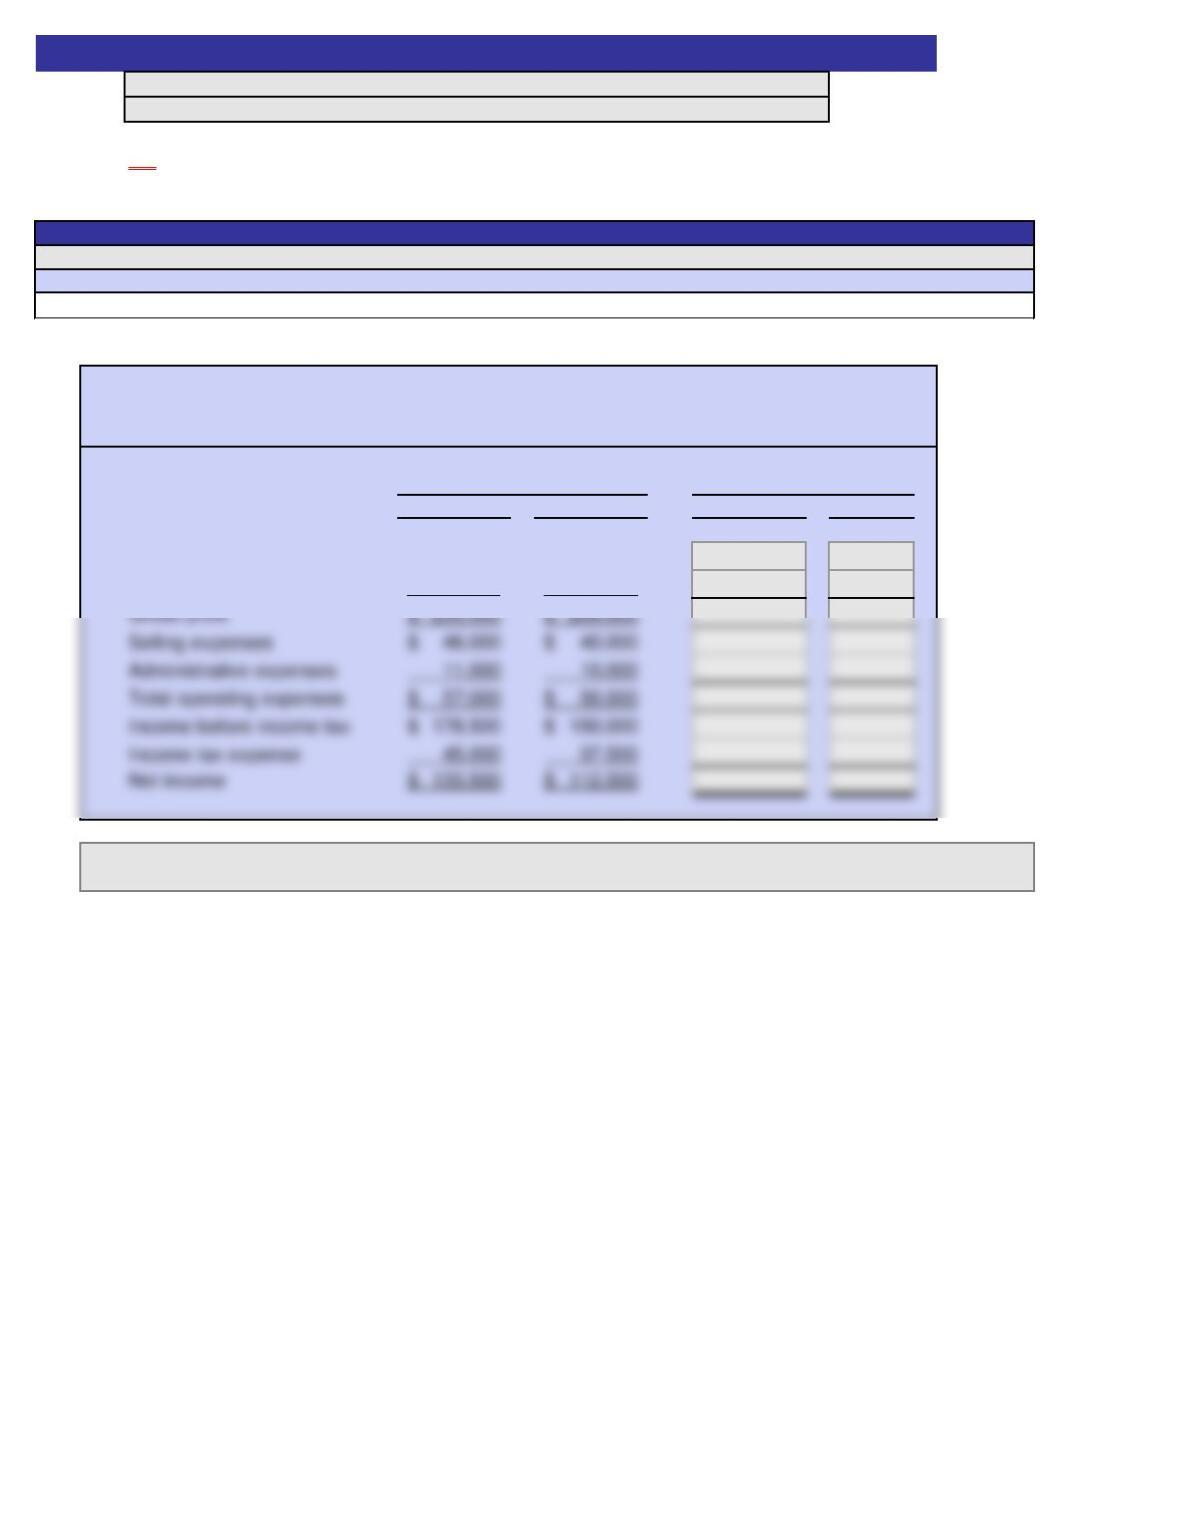
Amount Percent Amount Percent
Sales
Cost of goods sold
b.
Exercise 9-1
Instructions
2
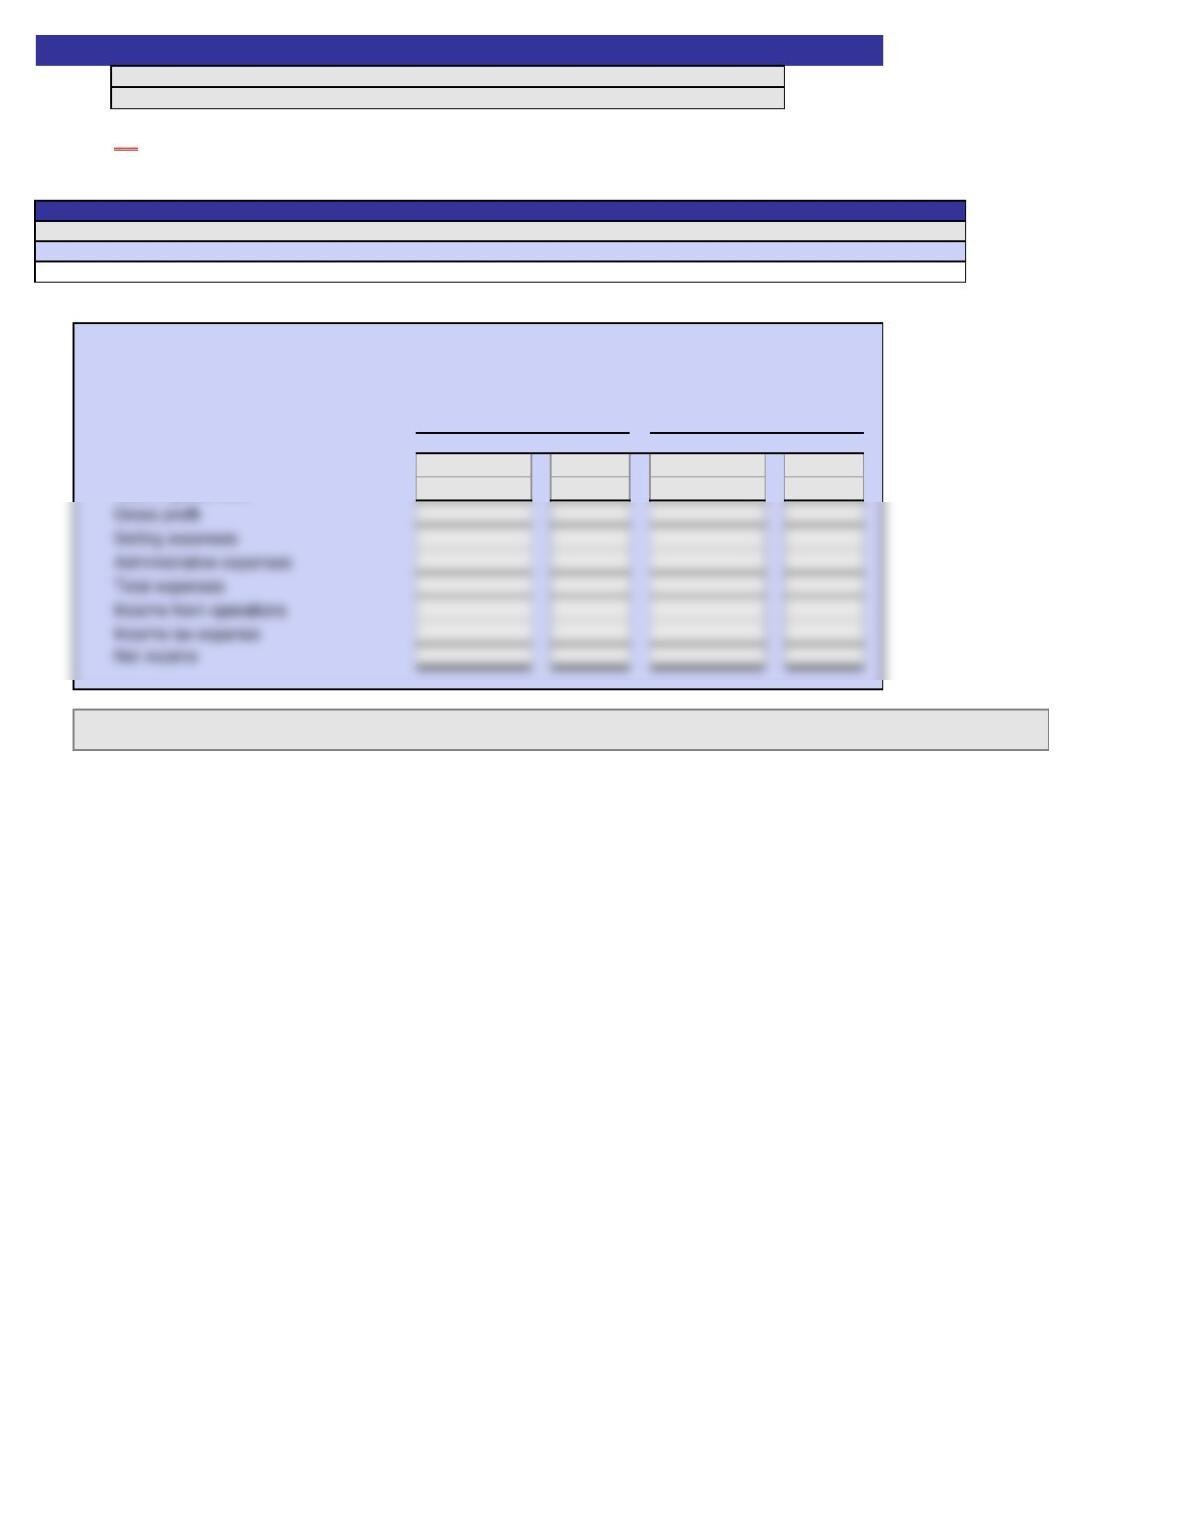
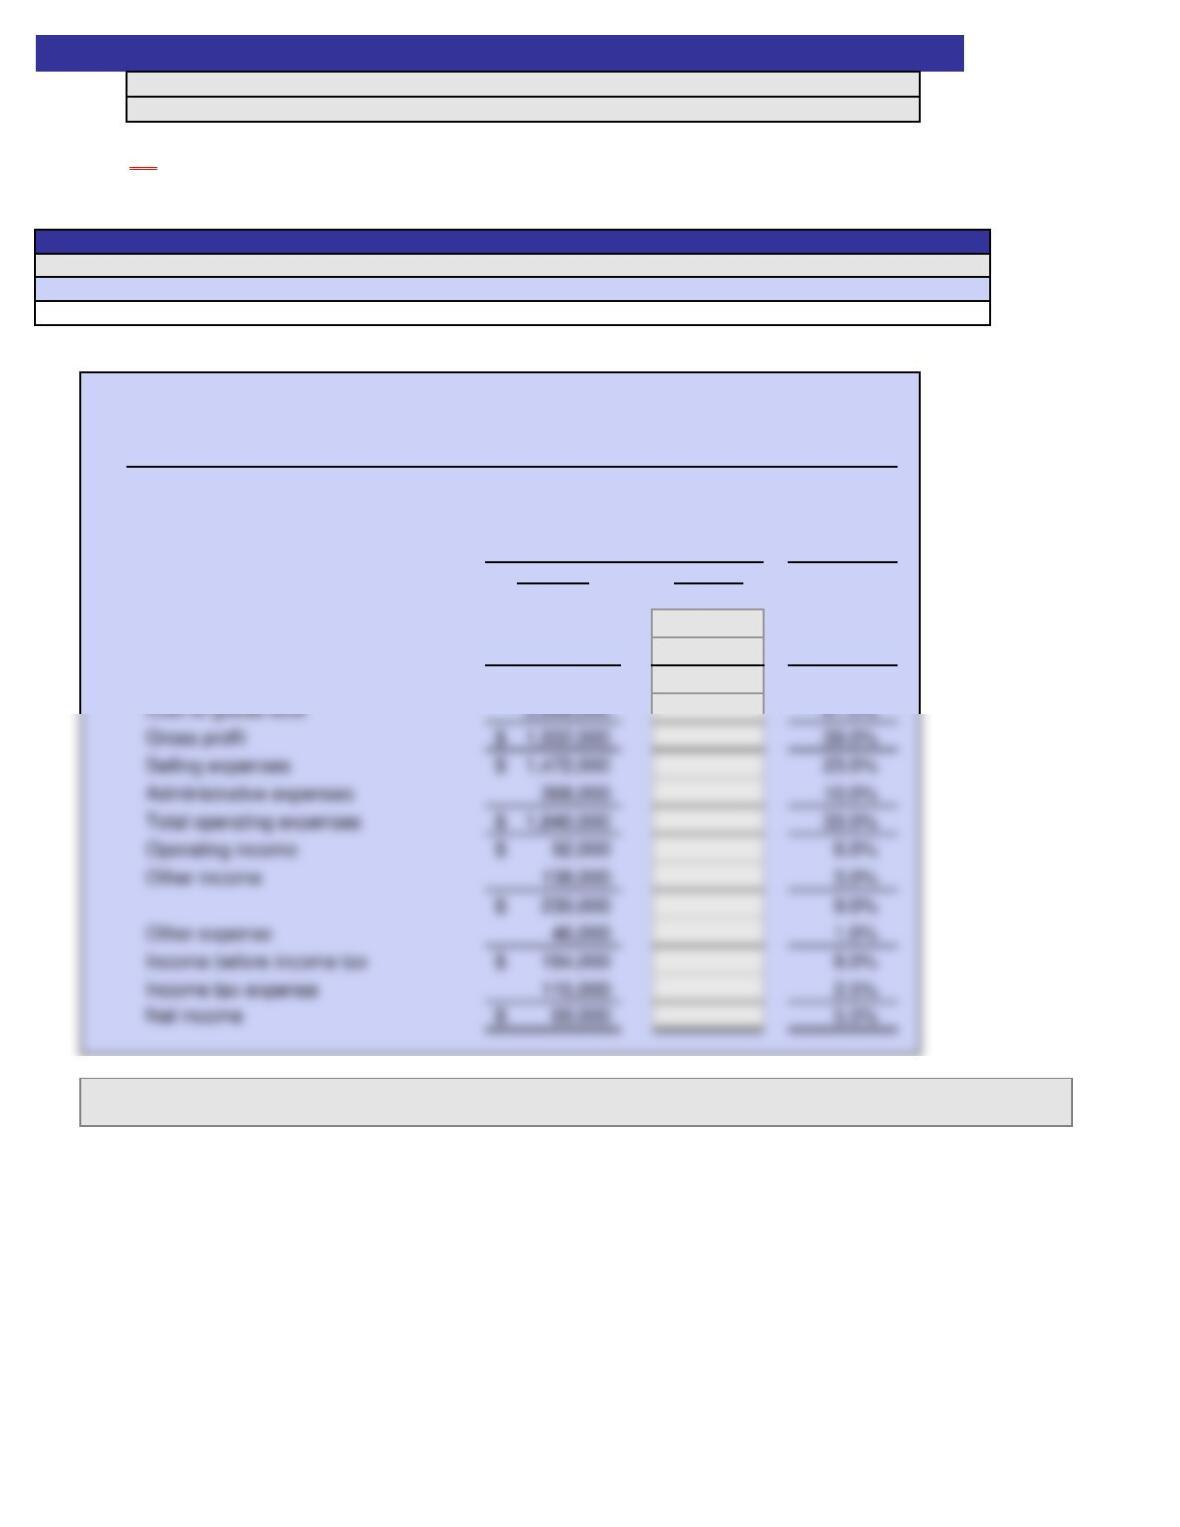
SEARLE TECHNOLOGIES CO.
Comparative Income Statement
A red asterisk (*) will appear in the column to the right of an incorrect answer.
Answers are entered in the cells with gray backgrounds.
Cells with non-gray backgrounds are protected and cannot be edited.
For the Years Ended December 31, 20Y8 and 20Y7
20Y8
20Y7
Name:
Section:
Score:
Scoring:
a.
Amount Percent Amount Percent
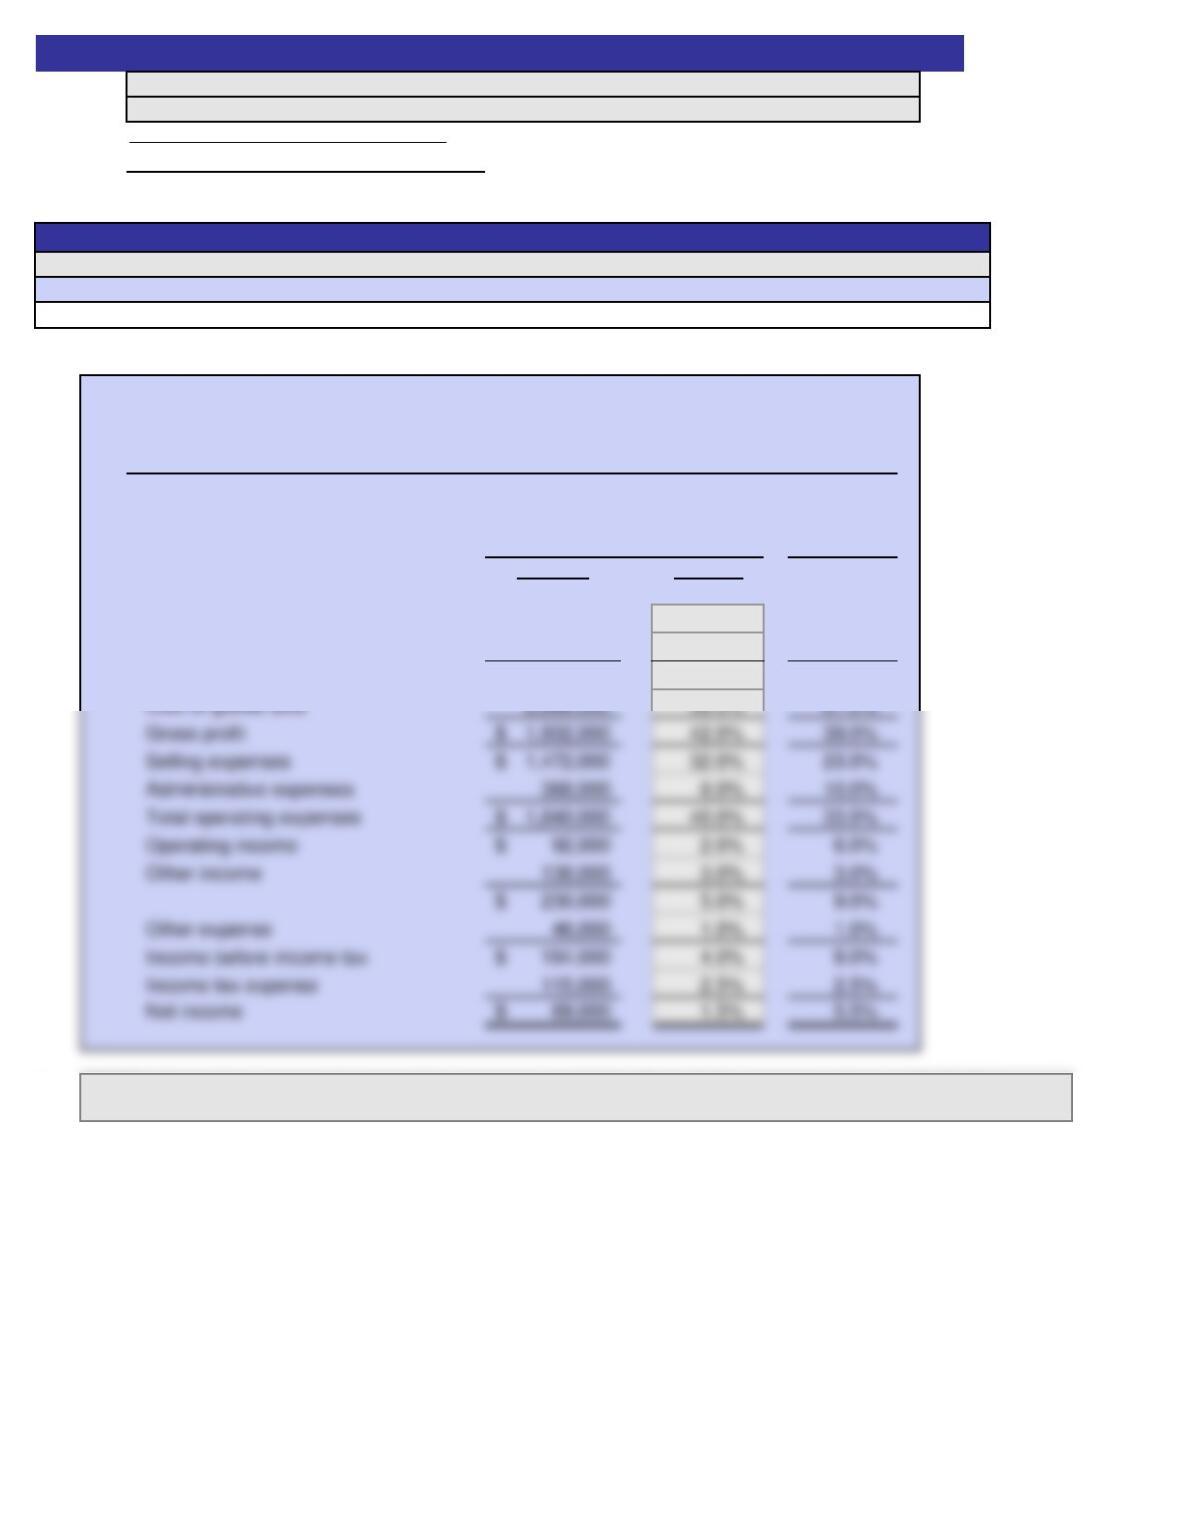
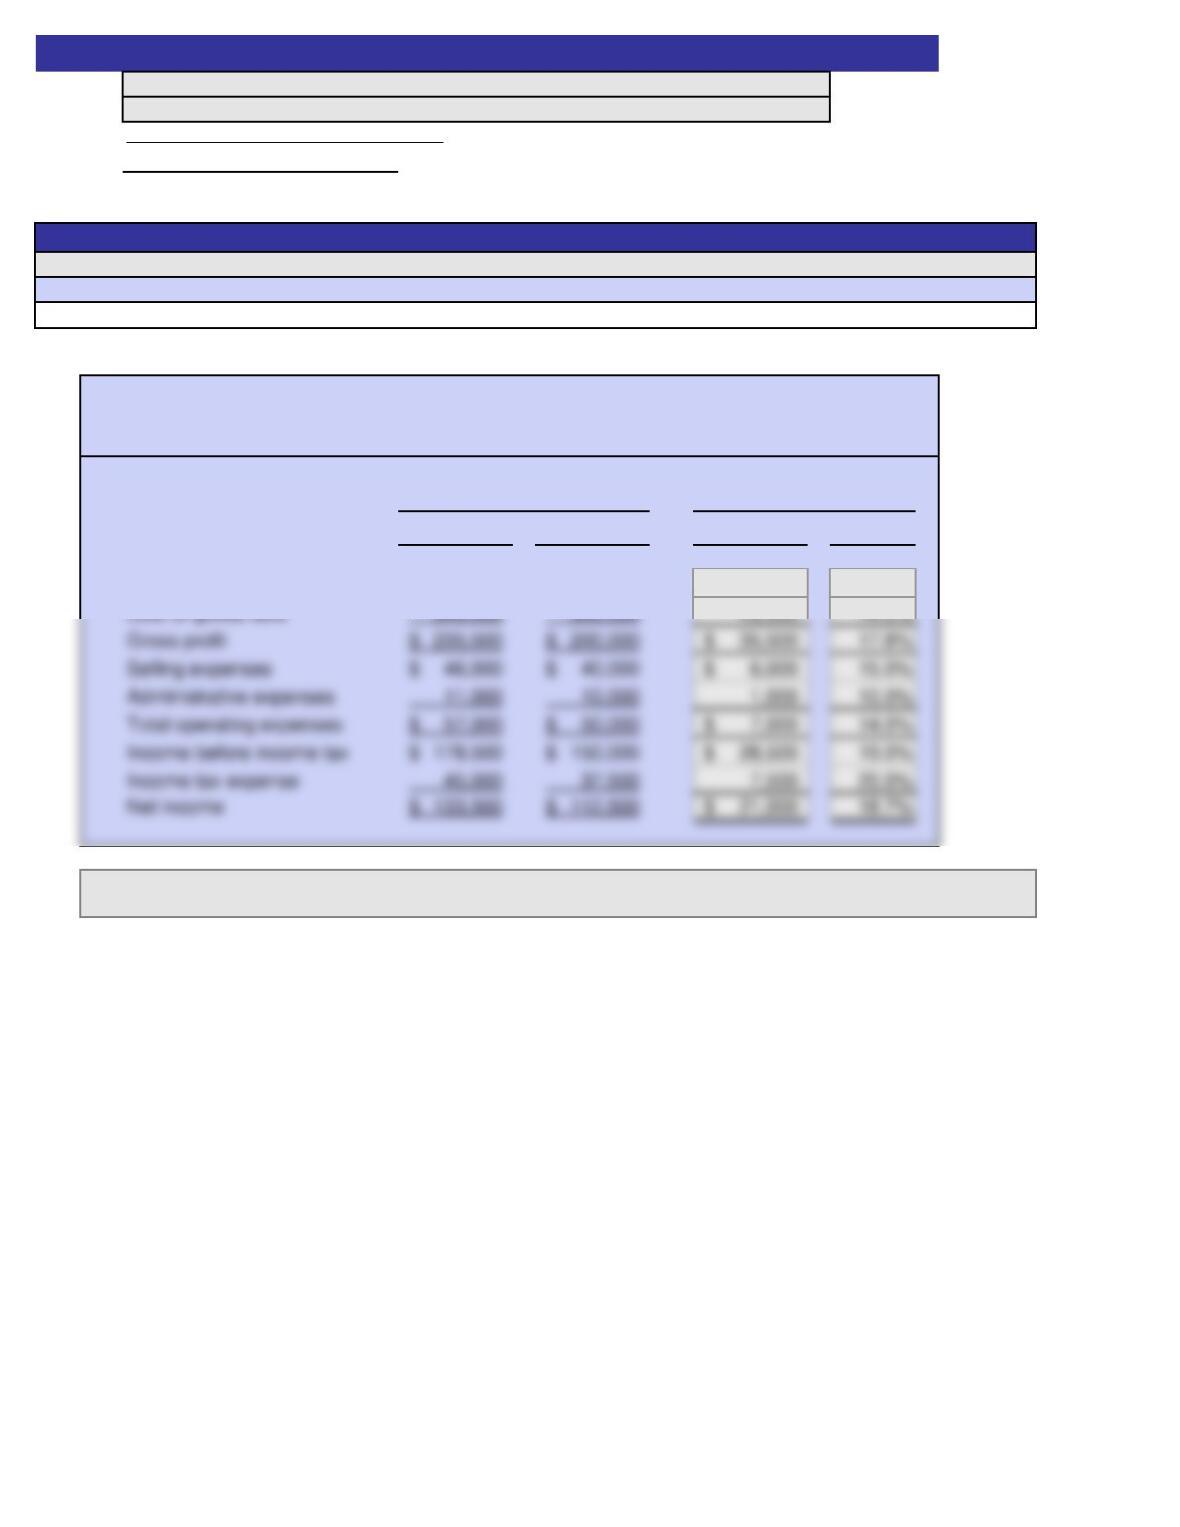
Sales 900,000$ 100.0% 725,000$ 100.0%
Cost of goods sold 558,000 62.0% 435,000 60.0%
Gross profit 342,000$ 38.0% 290,000$ 40.0%
b.
Instructions
Answers are entered in the cells with gray backgrounds.
ON
Exercise 9-1
SOLUTION
See student sheet for student’s score
The analysis indicates that the increase in cost of goods sold was partially offset by the decreases in selling, administrative, and
income tax expenses.
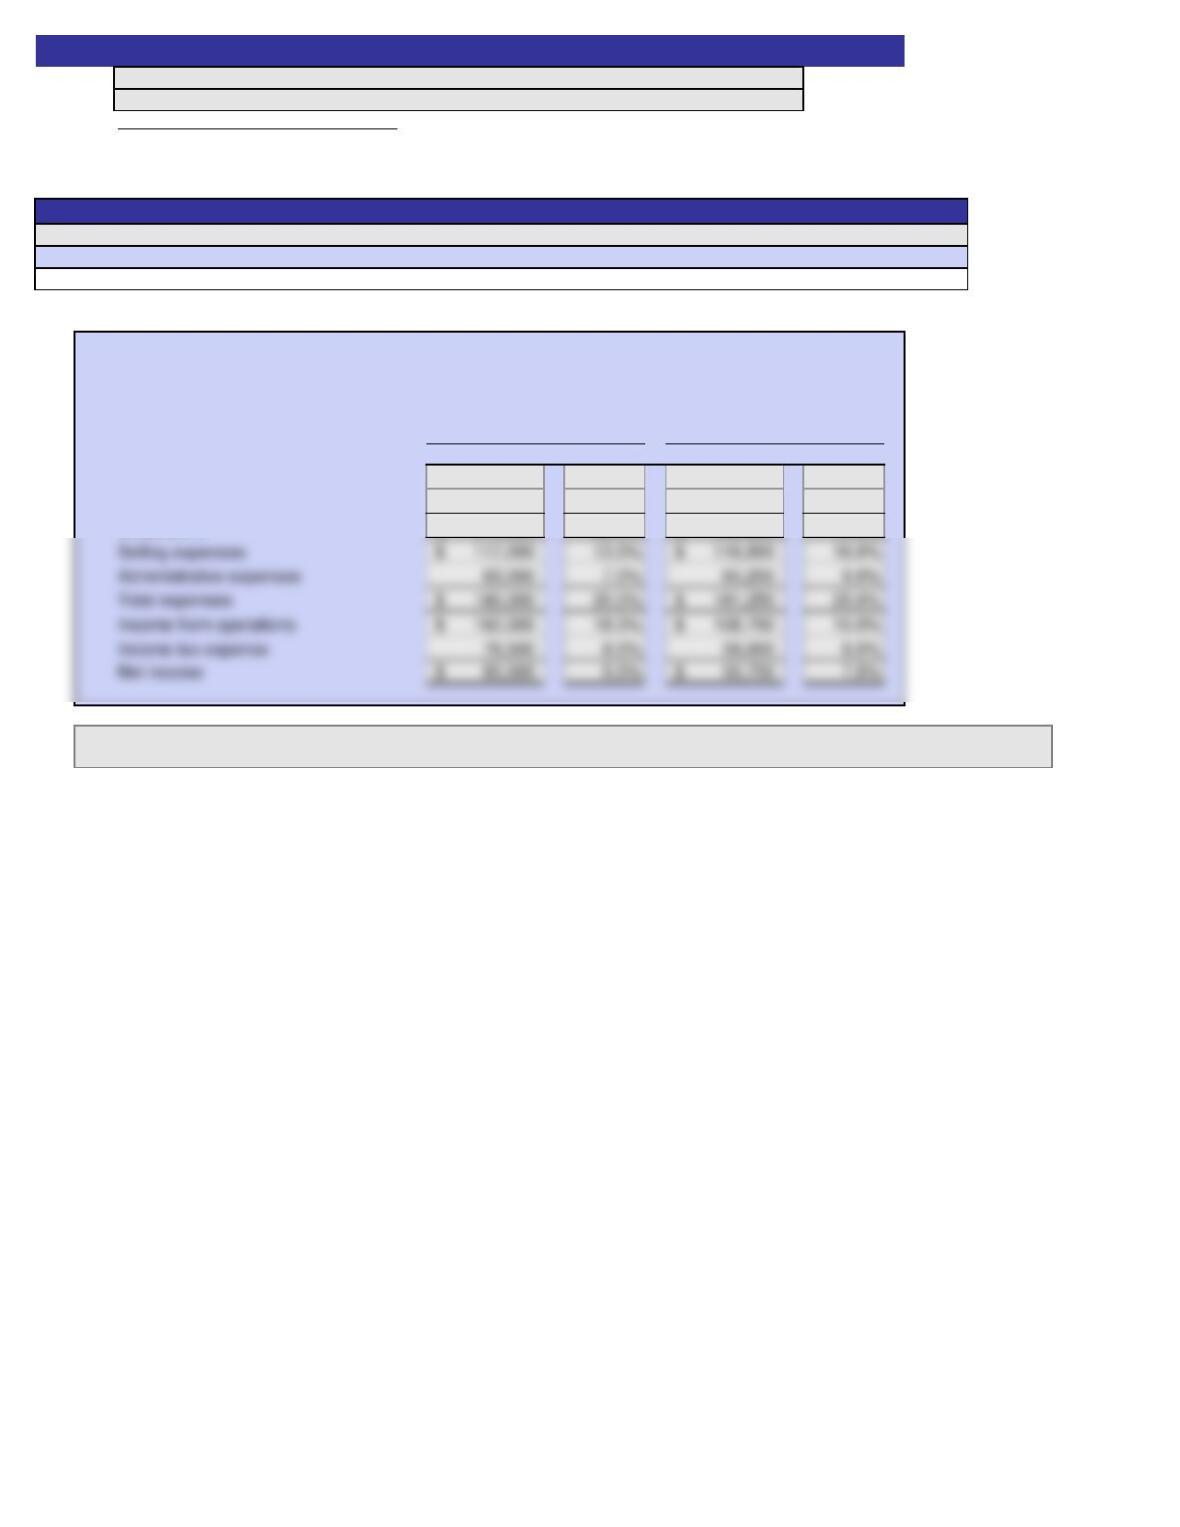
SEARLE TECHNOLOGIES CO.
Comparative Income Statement
Cells with non-gray backgrounds are protected and cannot be edited.
A red asterisk (*) will appear in the column to the right of an incorrect answer.
For the Years Ended December 31, 20Y8 and 20Y7
20Y8
20Y7
Name:
Section:
Score: 0%
Key Code:
1.
20Y3 20Y2
Amount Amount Amount Percent
Sales 880,000$ 800,000$
Sales returns and allowances 18,000 15,000
Net sales 862,000$ 785,000$
2.
Problem 9-1
Increase (Decrease)
Instructions
Answers are entered in the cells with gray backgrounds.
Cells with non-gray backgrounds are protected and cannot be edited.
2
A red asterisk (*) will appear in the column to the right of an incorrect answer.
GREYHOUND TECHNOLOGY COMPANY
Comparative Income Statement
For the Years Ended December 31, 20Y3 and 20Y2
Name:
Section:
Score:
Scoring:
1.
20Y3 20Y2
Amount Amount Amount Percent
Sales 880,000$ 800,000$ 80,000$ 10.0%
Sales returns and allowances 18,000 15,000 3,000 20.0%
Net sales 862,000$ 785,000$ 77,000$ 9.8%
Cost of goods sold 650,000 500,000 150,000 30.0%
2.
Net income decreased because sales increased at a smaller percentage rate than did cost of goods sold.
For the Years Ended December 31, 20Y3 and 20Y2
Increase (Decrease)
GREYHOUND TECHNOLOGY COMPANY
Comparative Income Statement
Problem 9-1
SOLUTION
See student sheet for student’s score
A red asterisk (*) will appear in the column to the right of an incorrect answer.
ON
Instructions
Answers are entered in the cells with gray backgrounds.
Cells with non-gray backgrounds are protected and cannot be edited.
Name:
Section:
Score: 0%
Key Code:
a.
Amount Percent Amount Percent
Revenues:
Admissions 130,239$ 139,125$
Event-related revenue 163,621 156,691
NASCAR broadcasting revenue 185,394 178,722
Other operating revenue 26,591 27,705
Total revenue 505,845$ 502,243$
b.
Answers are entered in the cells with gray backgrounds.
Cells with non-gray backgrounds are protected and cannot be edited.
Exercise 9-2
Instructions
2
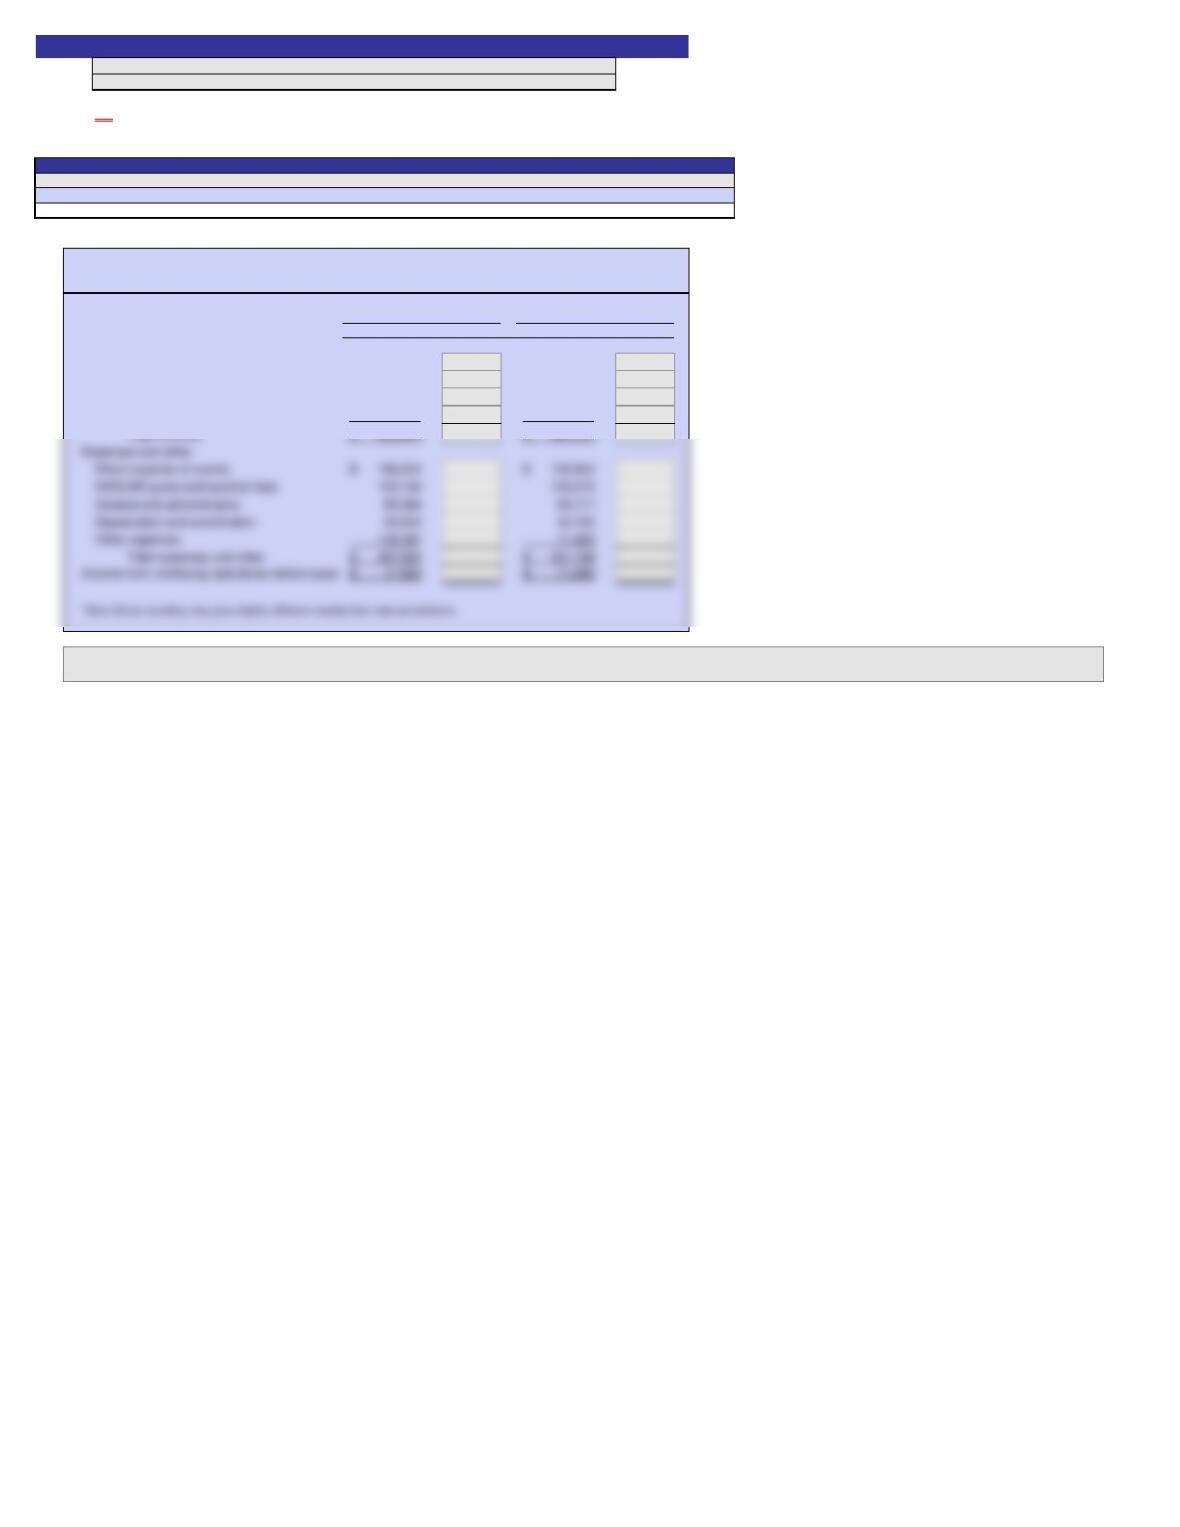
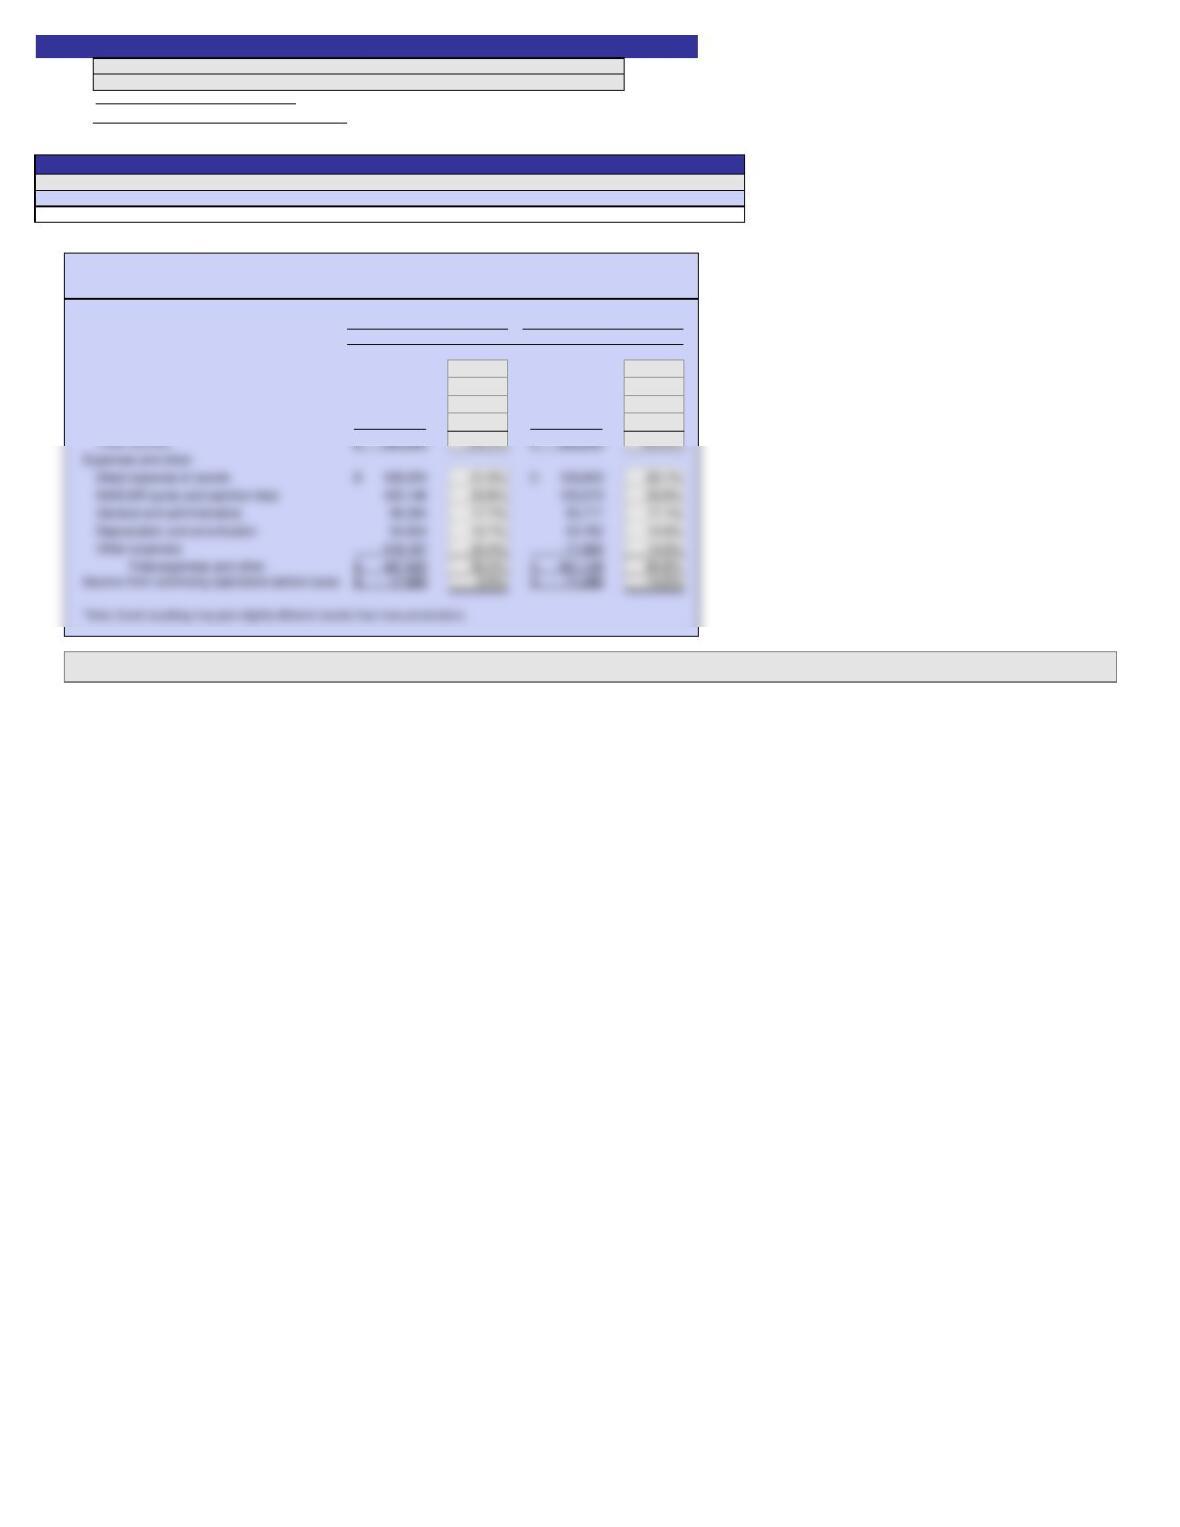
Comparative Income Statement (in thousands of dollars)
Year 2
Year 1
A red asterisk (*) will appear in the column to the right of an incorrect answer.
SPEEDWAY MOTORSPORTS, INC.
Name:
Section:
Score:
Scoring:
a.
Amount Percent Amount Percent
Revenues:
Admissions 130,239$ 25.7% 139,125$ 27.7%
Event-related revenue 163,621 32.3% 156,691 31.2%
NASCAR broadcasting revenue 185,394 36.7% 178,722 35.6%
Other operating revenue 26,591 5.3% 27,705 5.5%
b.
Answers are entered in the cells with gray backgrounds.
Cells with non-gray backgrounds are protected and cannot be edited.
Comparative Income Statement (in thousands of dollars)
Year 2
Year 1
The increase in total expenses as a percentage of the total revenue offset the increase in total revenue, largely because of the write-down of goodwill (other expense) during the year.
Exercise 9-2
SOLUTION
See student sheet for student’s score
A red asterisk (*) will appear in the column to the right of an incorrect answer.
ON
SPEEDWAY MOTORSPORTS, INC.
Instructions
Name:
Section:
Score: 0%
Key Code:
1.
Amount Percent Amount Percent
Sales 1,545,000$ 1,224,000$
Sales returns and allowances 45,000 24,000
Net sales 1,500,000$ 1,200,000$
Cost of goods sold 960,000 780,000
Gross profit 540,000$ 420,000$
2.
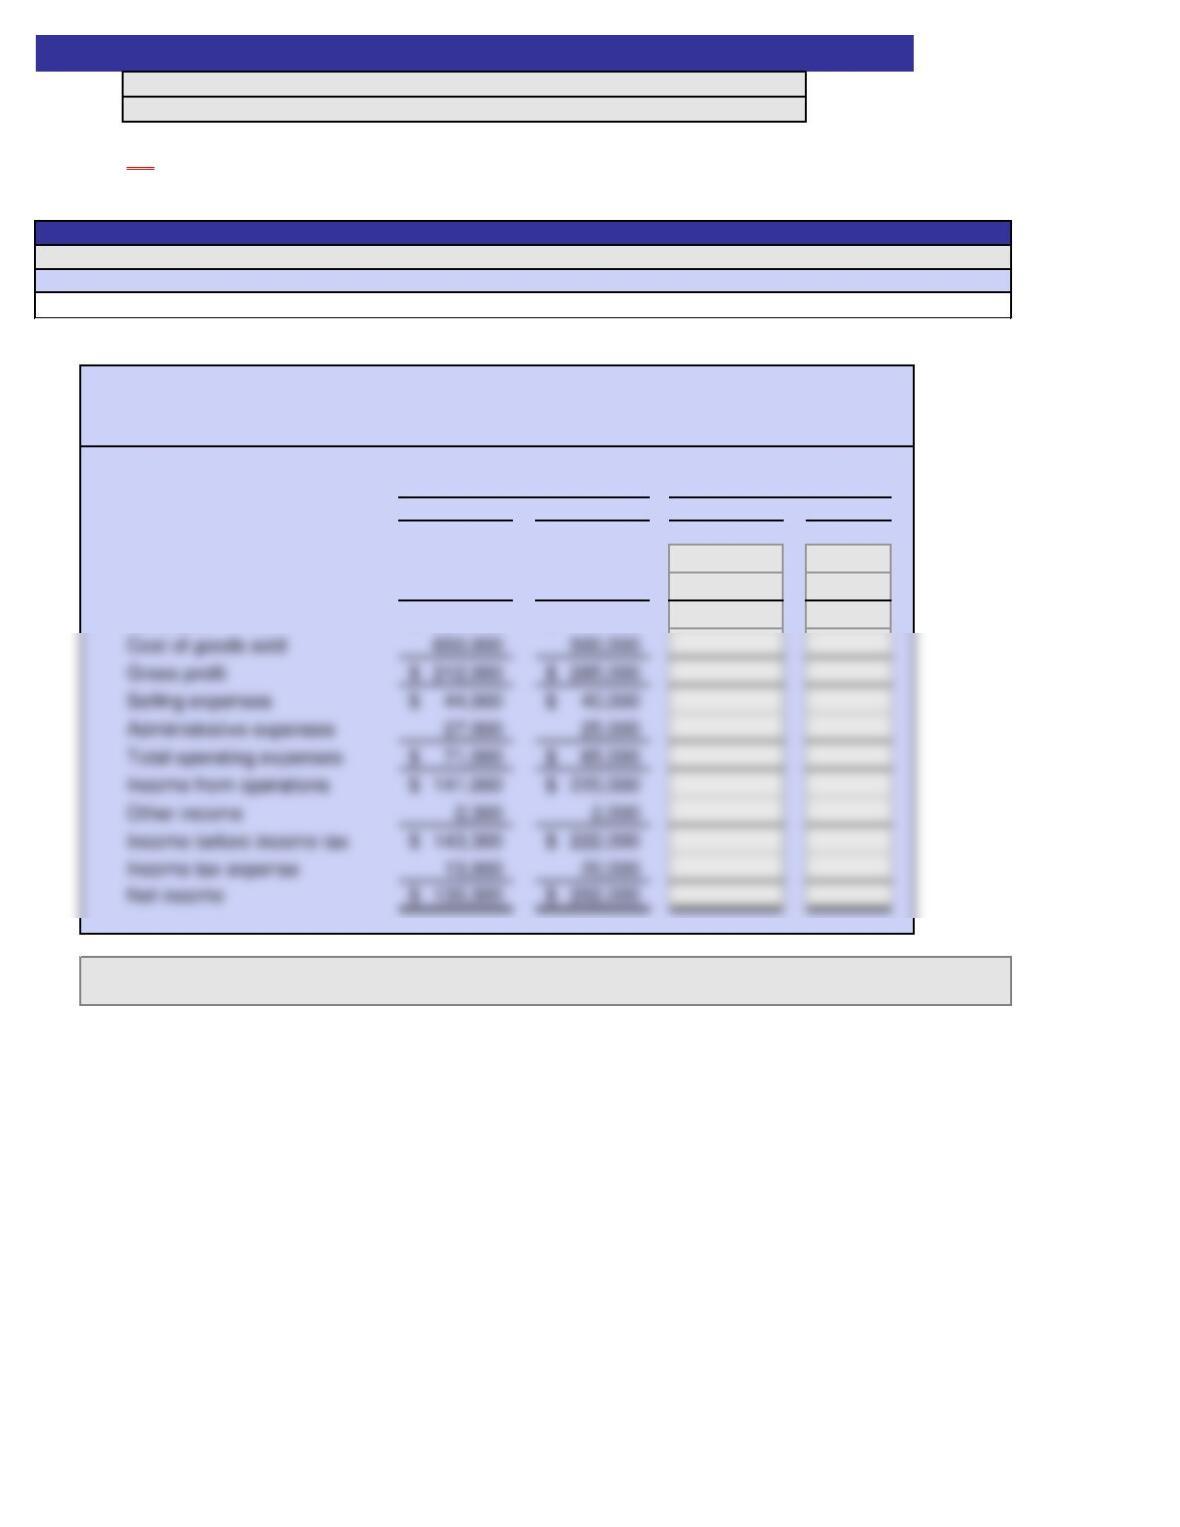
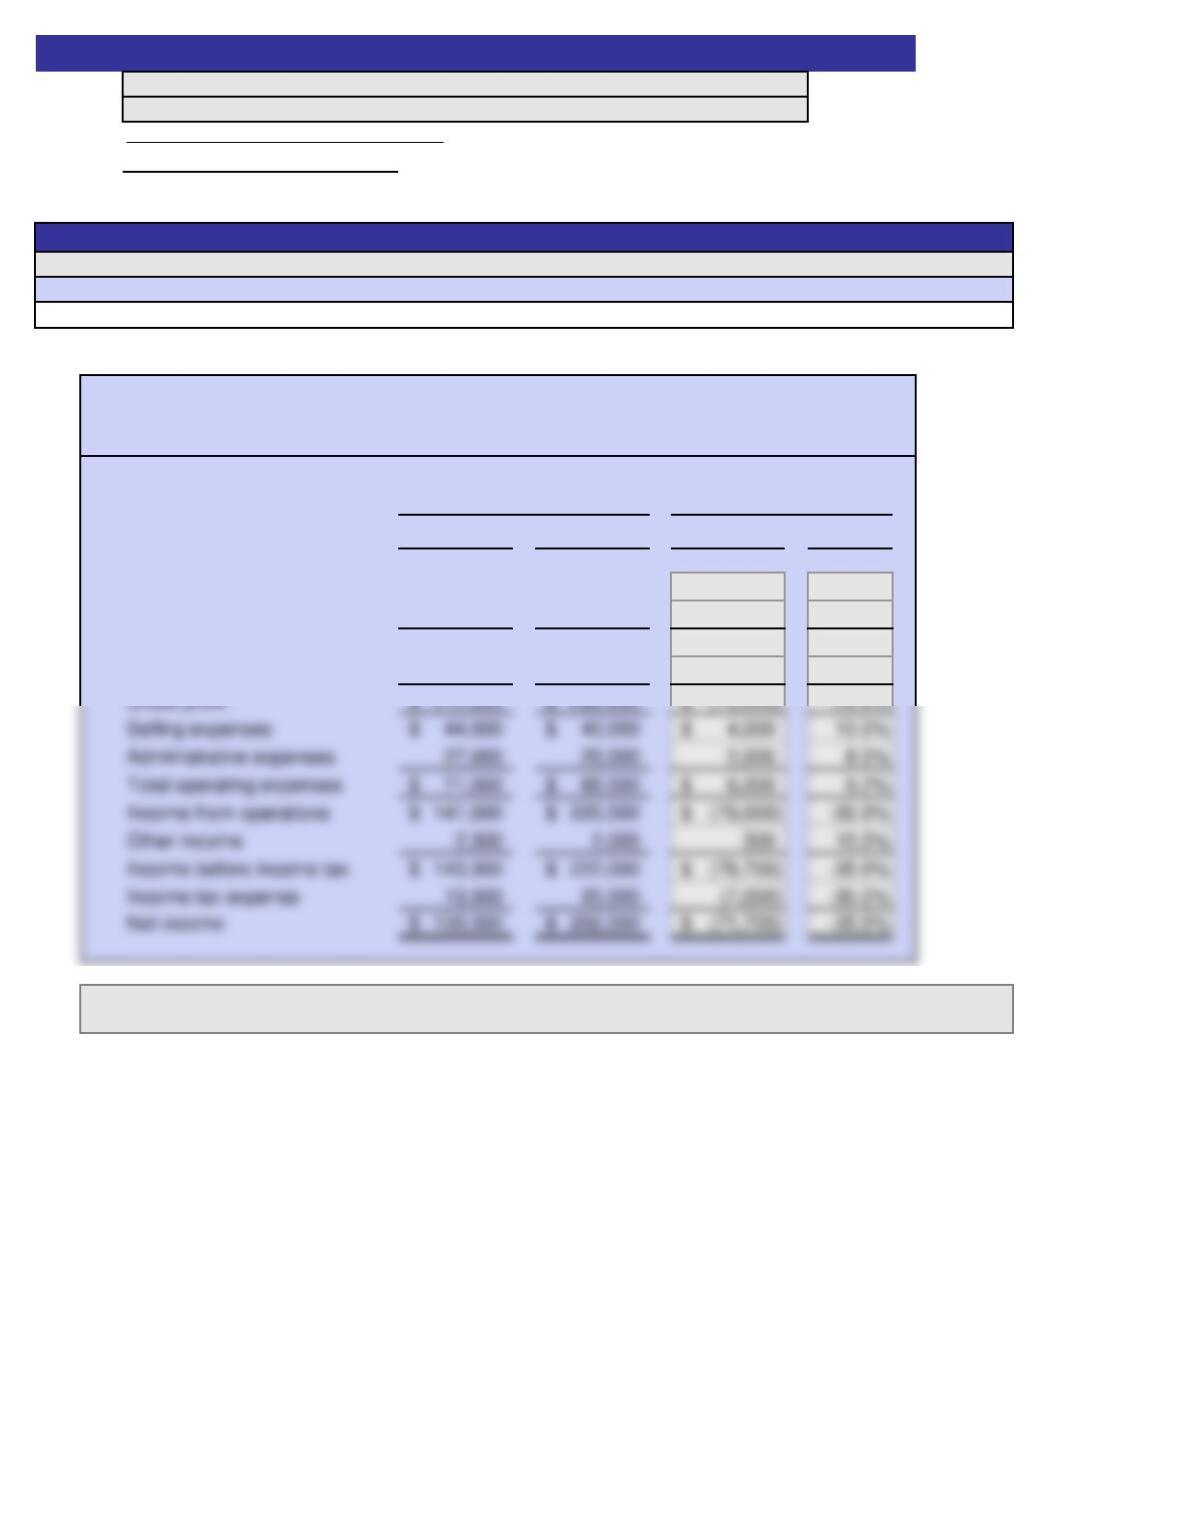
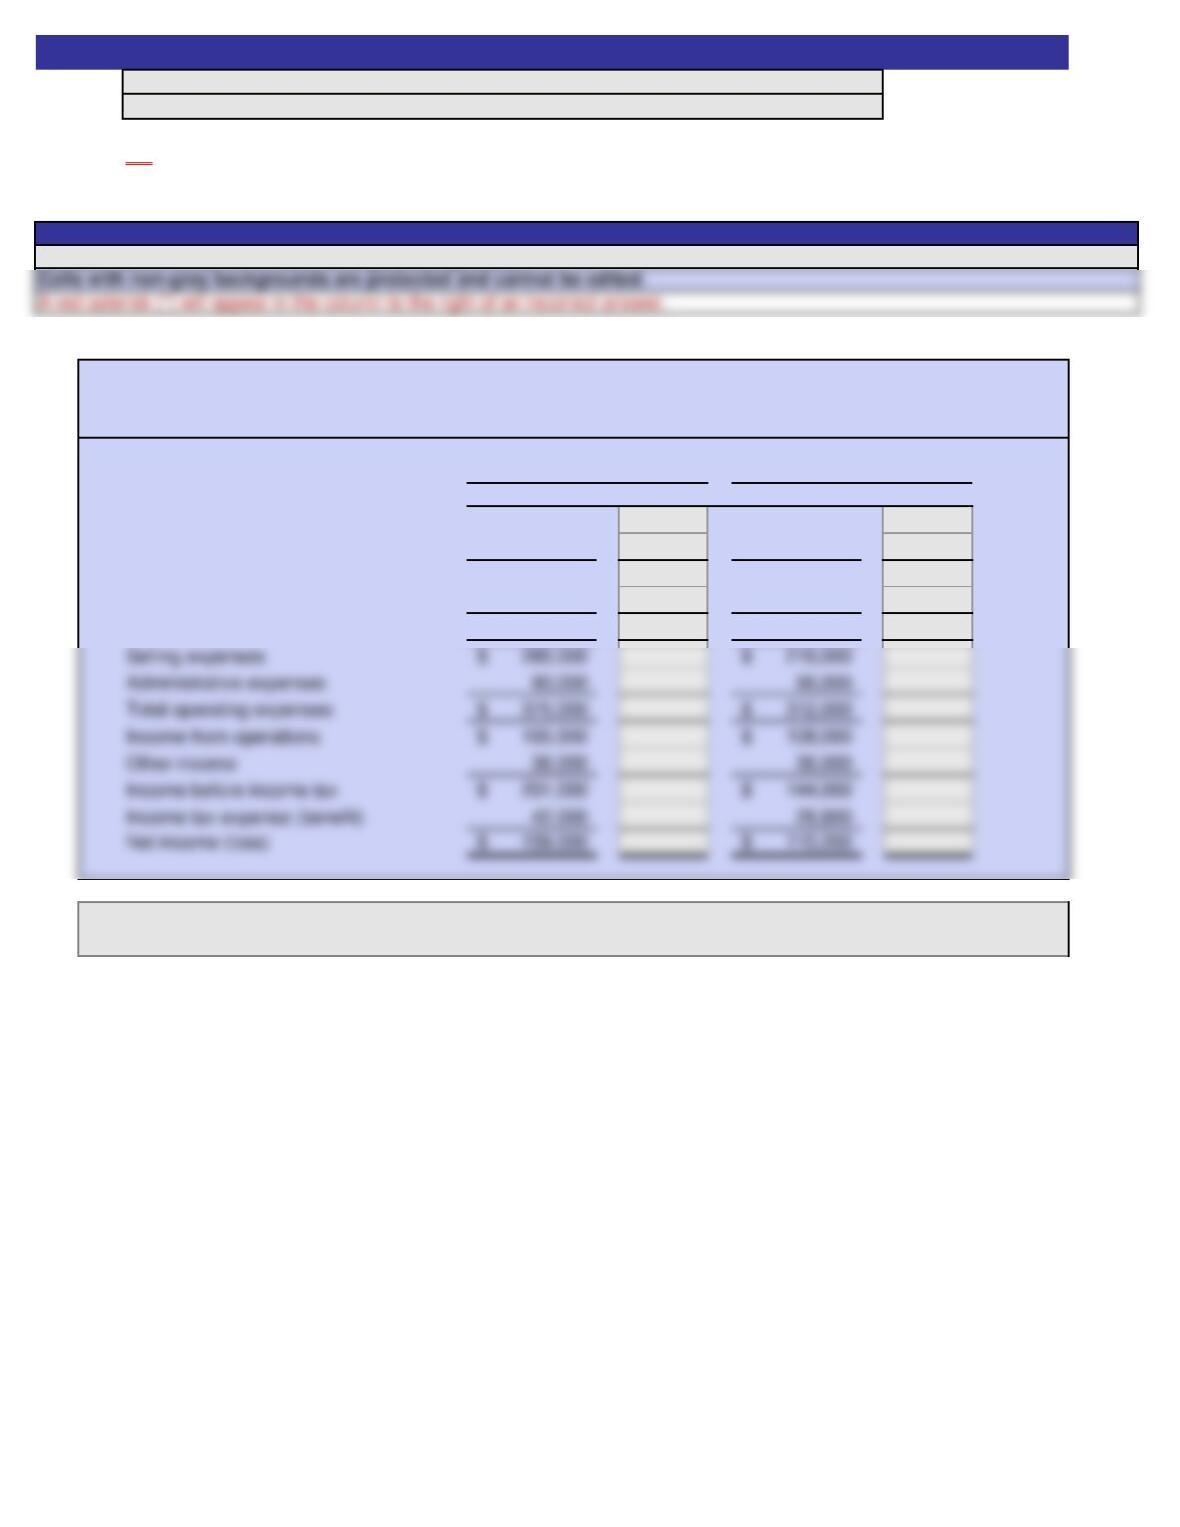
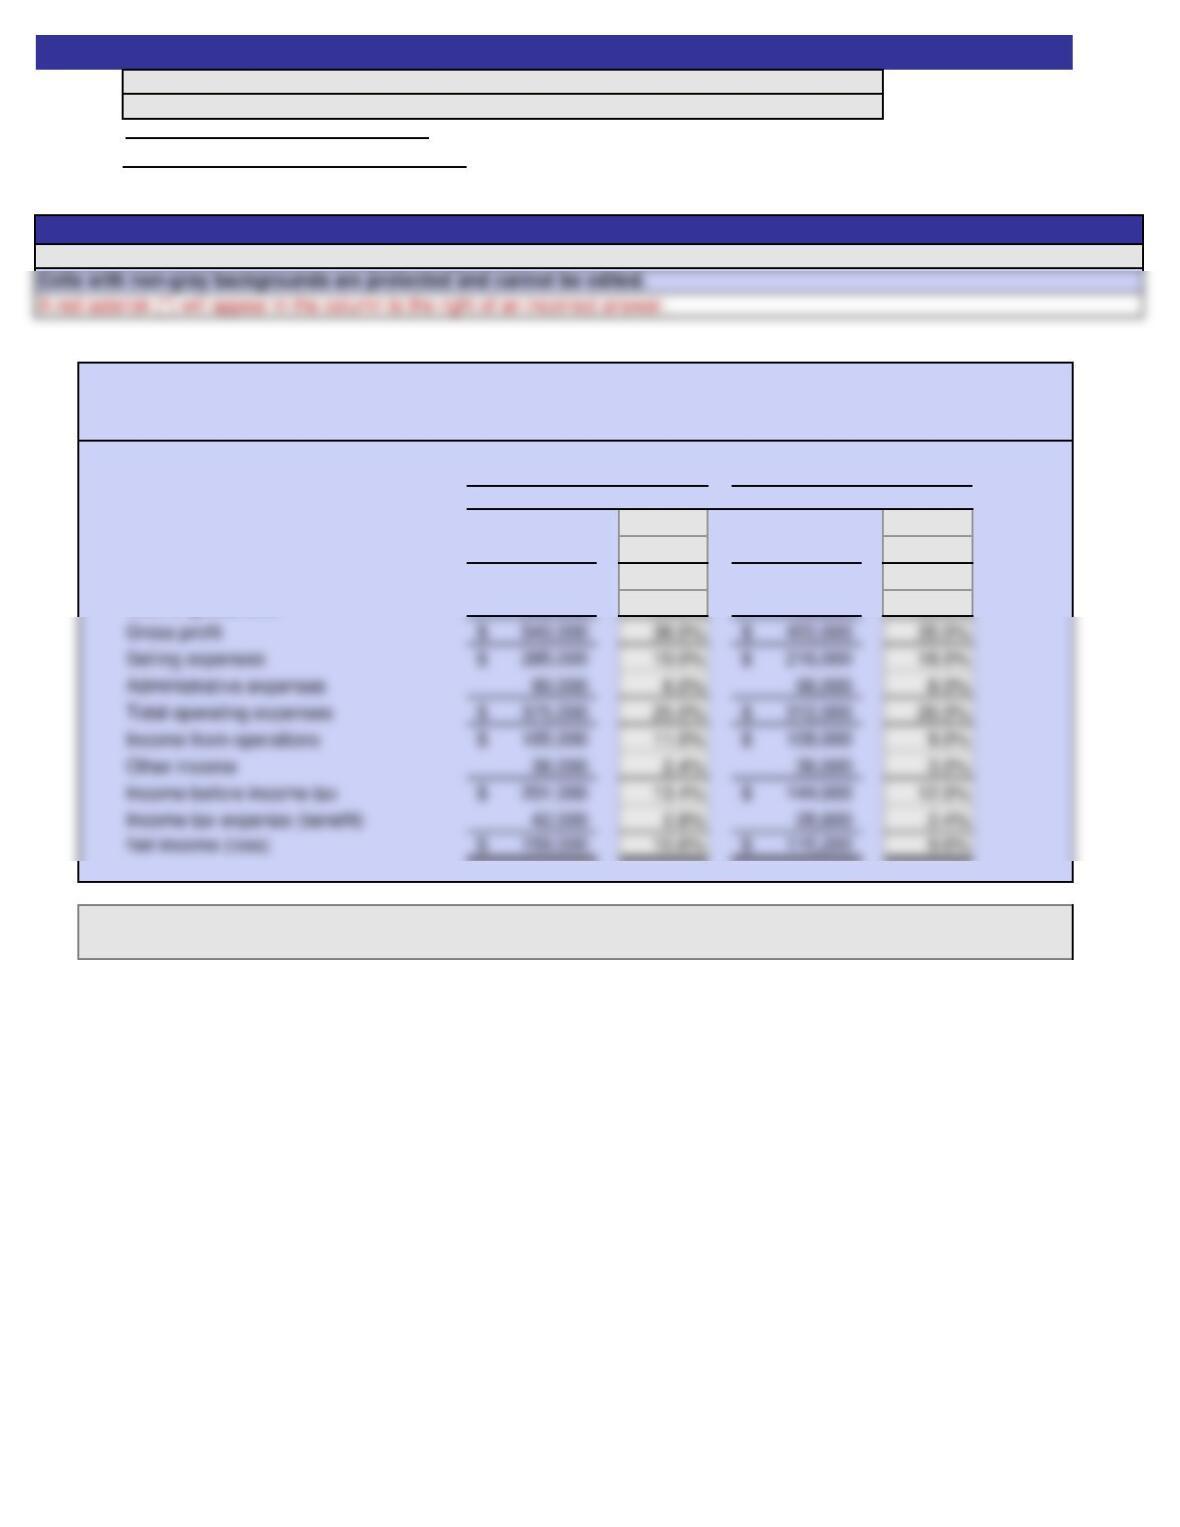
BLUE BUFFALO COMPANY
Comparative Income Statement
Cells with non-gray backgrounds are protected and cannot be edited.
For the Years Ended December 31, 20Y6 and 20Y5
20Y6
20Y5
2
Problem 9-2
Instructions
Answers are entered in the cells with gray backgrounds.
Name:
Section:
Score:
Scoring:
1.
Amount Percent Amount Percent
Sales 1,545,000$ 103.0% 1,224,000$ 102.0%
Sales returns and allowances 45,000 3.0% 24,000 2.0%
Net sales 1,500,000$ 100.0% 1,200,000$ 100.0%
Cost of goods sold 960,000 64.0% 780,000 65.0%
2.
Problem 9-2
SOLUTION
See student sheet for student’s score
Instructions
Answers are entered in the cells with gray backgrounds.
For the Years Ended December 31, 20Y6 and 20Y5
20Y6
20Y5
The analysis indicates that sales, cost of goods sold, selling expenses, and net income all increased as a result of a
successful sales promotion.
Cells with non-gray backgrounds are protected and cannot be edited.
ON
BLUE BUFFALO COMPANY
Comparative Income Statement
Name:
Section:
Score: 0%
Key Code:
a.
Electronics
Industry
Average
Amount Percent
Sales 4,728,800$ 102.5%
Sales returns and allowances 128,800 2.5%
Net sales 4,600,000$ 100.0%
b.
GARRITY ELECTRONICS COMPANY
Common-Size Income Statement
Electronics Company
Garrity
Instructions
Answers are entered in the cells with gray backgrounds.
Cells with non-gray backgrounds are protected and cannot be edited.
A red asterisk (*) will appear in the column to the right of an incorrect answer.
2
Exercise 9-3
Name:
Section:
Score:
Scoring:
a.
Electronics
Industry
Average
Amount Percent
Sales 4,728,800$ 102.8% 102.5%
Sales returns and allowances 128,800 2.8% 2.5%
Net sales 4,600,000$ 100.0% 100.0%
b.
Instructions
Answers are entered in the cells with gray backgrounds.
Cells with non-gray backgrounds are protected and cannot be edited.
Exercise 9-3
SOLUTION
See student sheet for student’s score
ON
A red asterisk (*) will appear in the column to the right of an incorrect answer.
Electronics Company
COGS is lower than average, but operating expenses are higher. Overall, the company is less profitable than
average.
Garrity
GARRITY ELECTRONICS COMPANY
Common-Size Income Statement
Name:
Section:
Score: 0%
Key Code:
Amount Percent Amount Percent
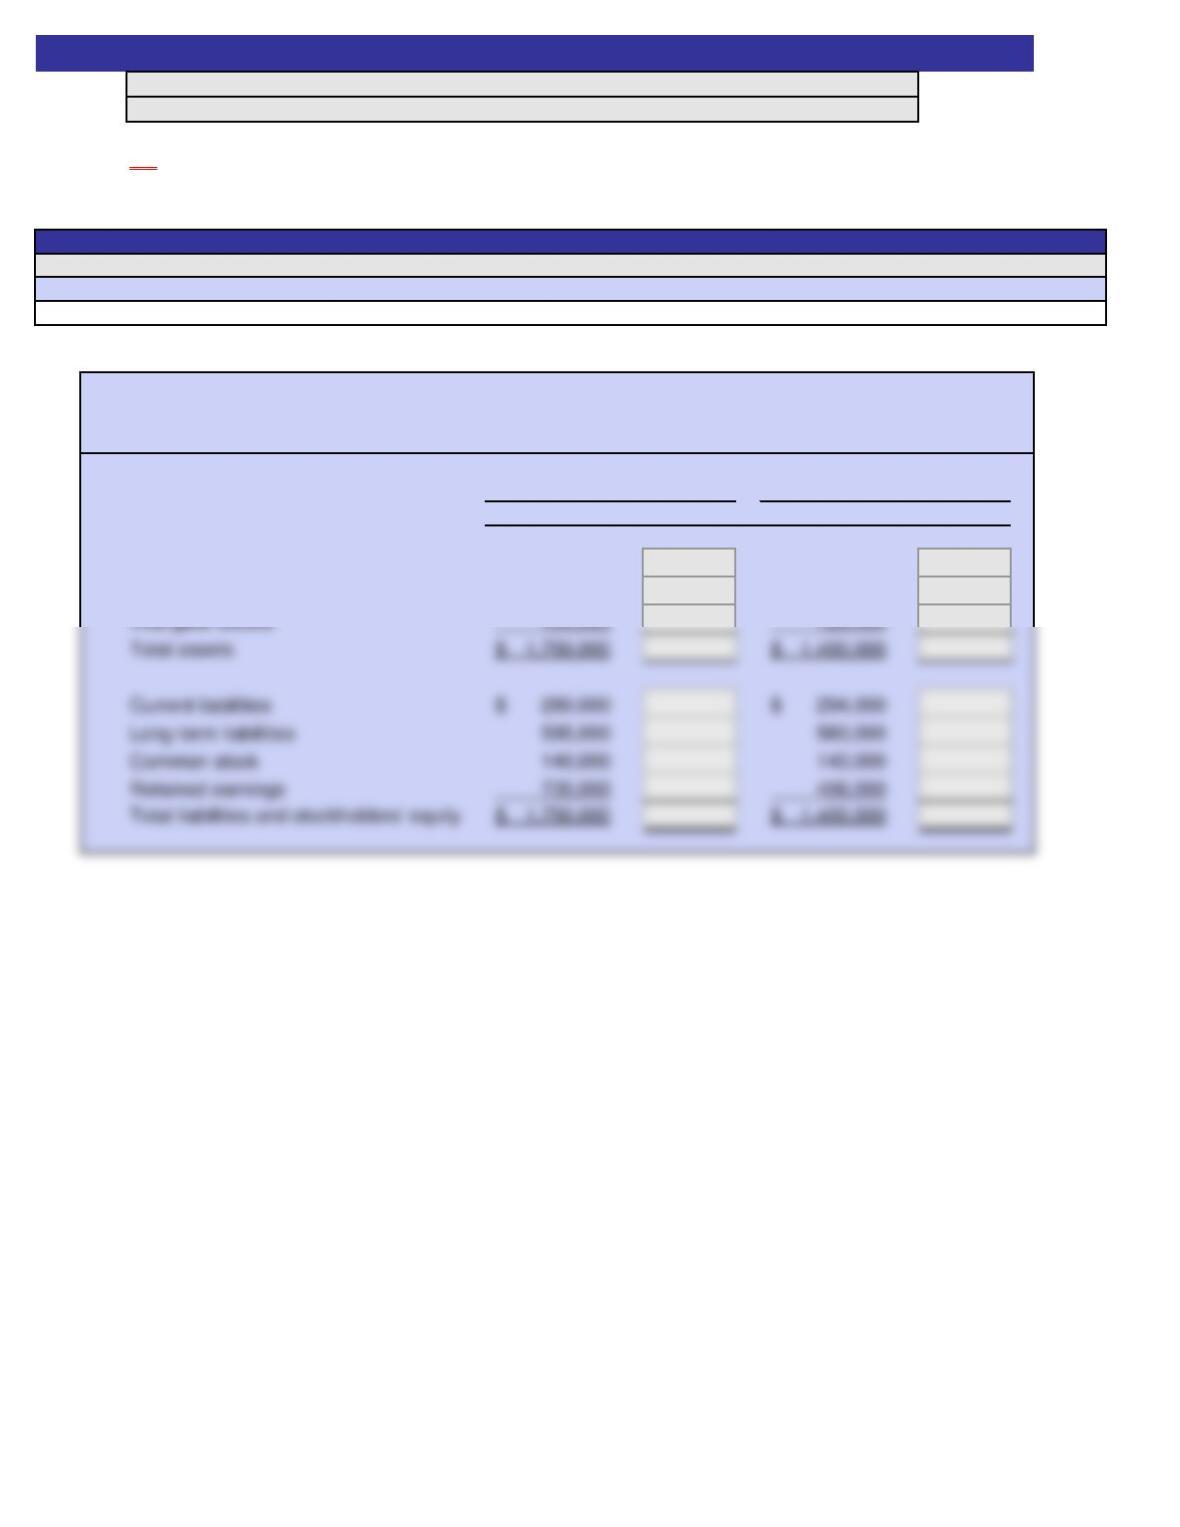
Current assets 700,000$ 504,000$
Property, plant, and equipment 945,000 770,000
December 31, 20Y2 and 20Y1
20Y2
20Y1
Instructions
Answers are entered in the cells with gray backgrounds.
Cells with non-gray backgrounds are protected and cannot be edited.
A red asterisk (*) will appear in the column to the right of an incorrect answer.
OTTER CREEK COMPANY
Comparative Balance Sheet
Exercise 9-4
2
Name:
Section:
Score:
Scoring:
Amount Percent Amount Percent
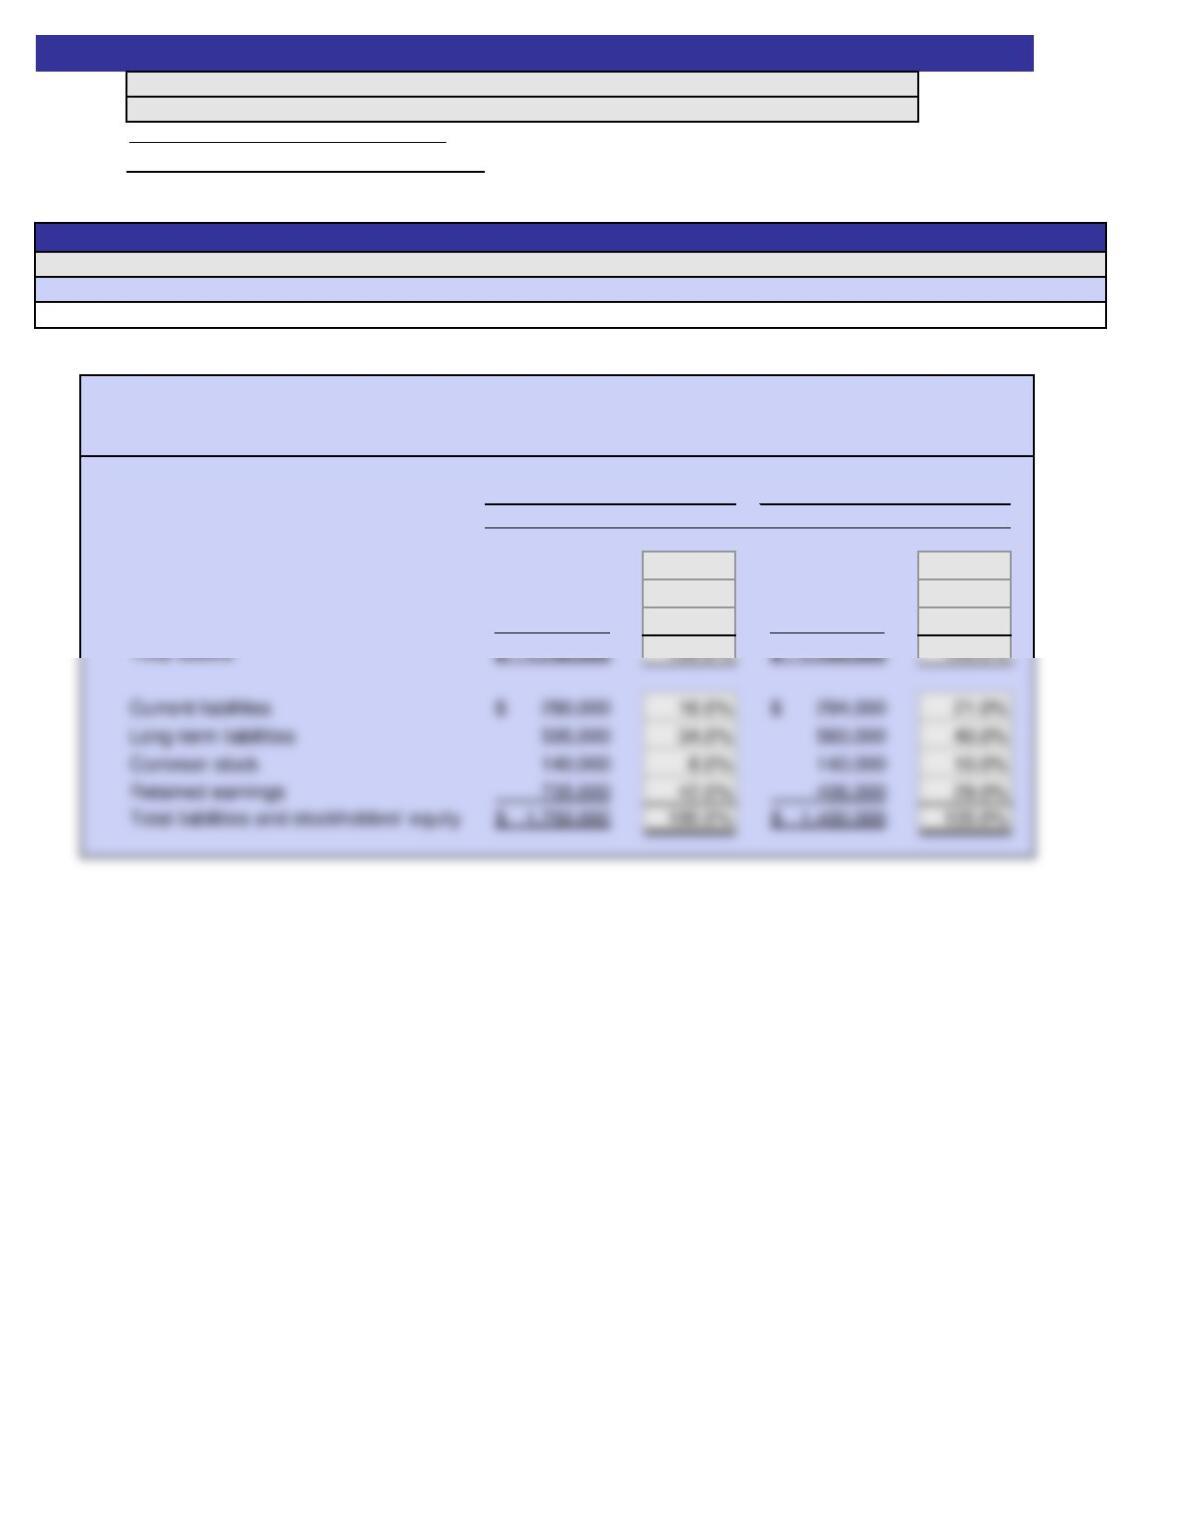
Current assets 700,000$ 40.0% 504,000$ 36.0%
Property, plant, and equipment 945,000 54.0% 770,000 55.0%
Intangible assets 105,000 6.0% 126,000 9.0%
ON
Instructions
Exercise 9-4
SOLUTION
See student sheet for student’s score
December 31, 20Y2 and 20Y1
20Y2
20Y1
OTTER CREEK COMPANY
Comparative Balance Sheet
Answers are entered in the cells with gray backgrounds.
Cells with non-gray backgrounds are protected and cannot be edited.
A red asterisk (*) will appear in the column to the right of an incorrect answer.
Name:
Section:
Score: 0%
Key Code:
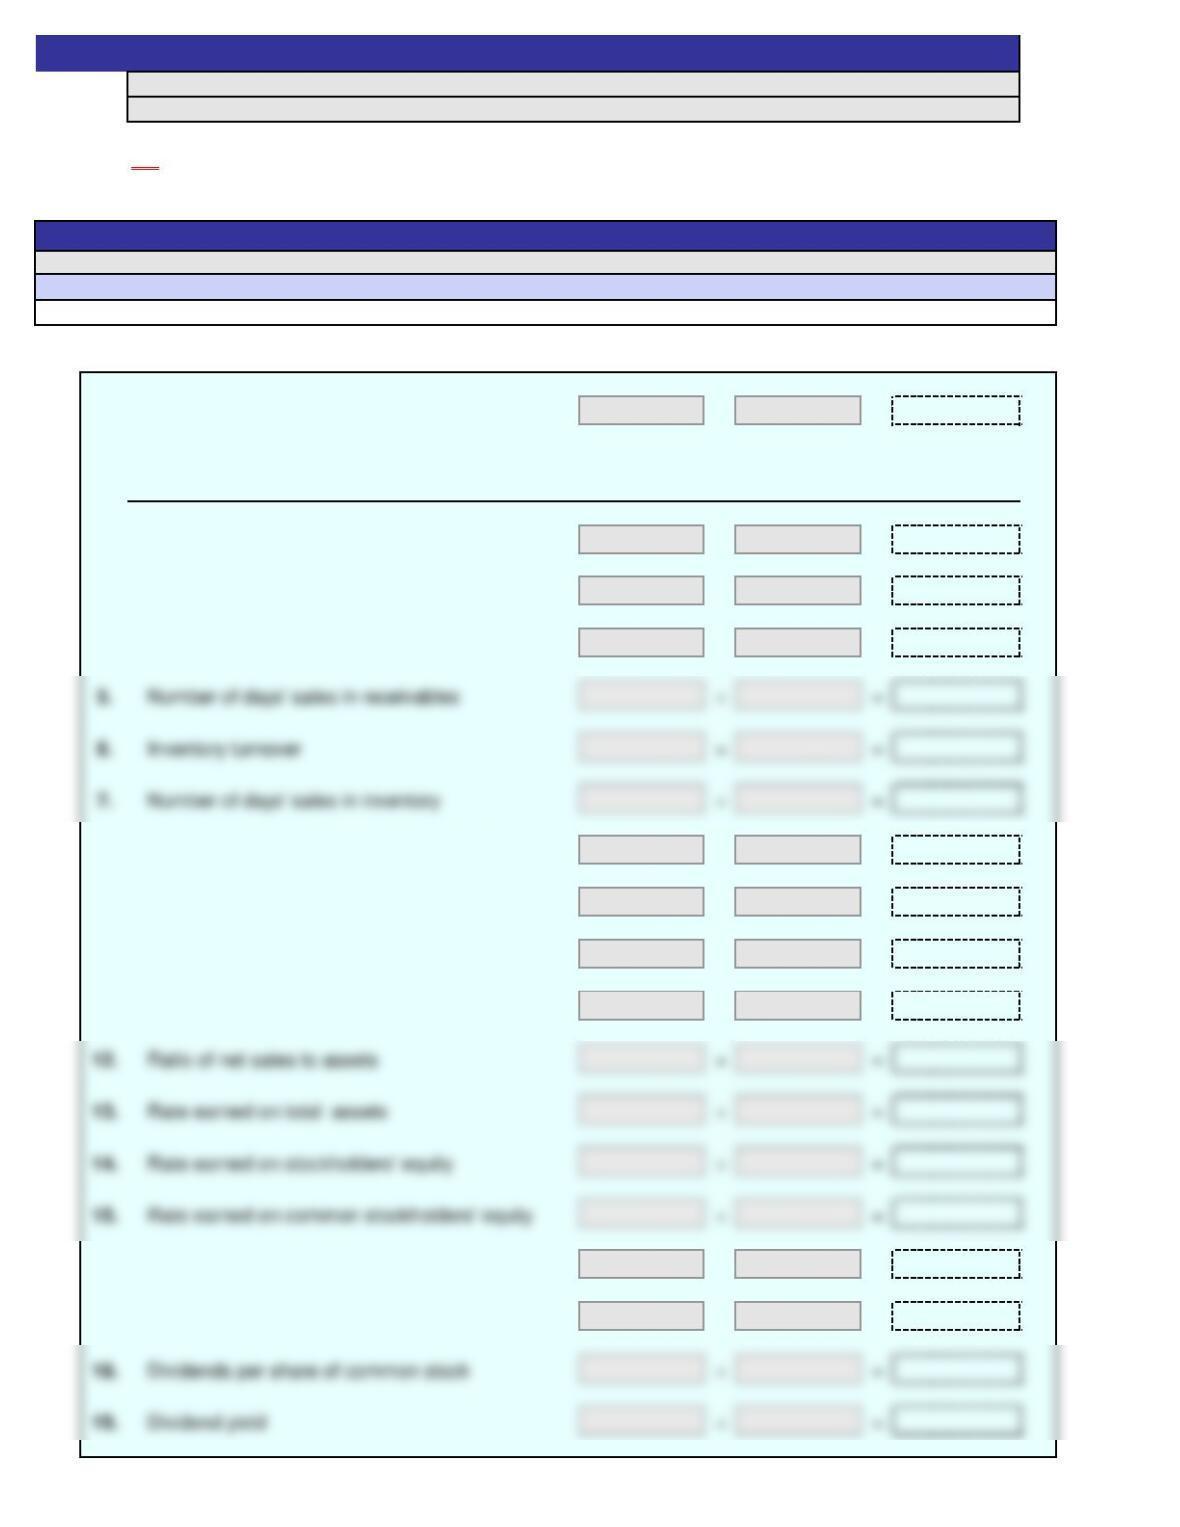
1. Working capital:
–=
Calculated
Ratio Numerator ÷Denominator Value
2. Current ratio ÷ =
3. Quick ratio ÷ =
4. Accounts receivable turnover ÷ =
8. Ratio of fixed assets to long-term liabilities ÷ =
9. Ratio of liabilities to stockholders’ equity ÷ =
10. Number of times interest charges earned ÷ =
11. Number of times preferred dividends earned ÷ =
16. Earnings per share on common stock ÷ =
17. Price-earnings ratio ÷ =
Problem 9-4
Cells with non-gray backgrounds are protected and cannot be edited.
A red asterisk (*) will appear in the row immediately beneath an incorrect answer.
Instructions
Answers are entered in the cells with gray backgrounds.
2
Name:
Section:
Score:
Scoring:
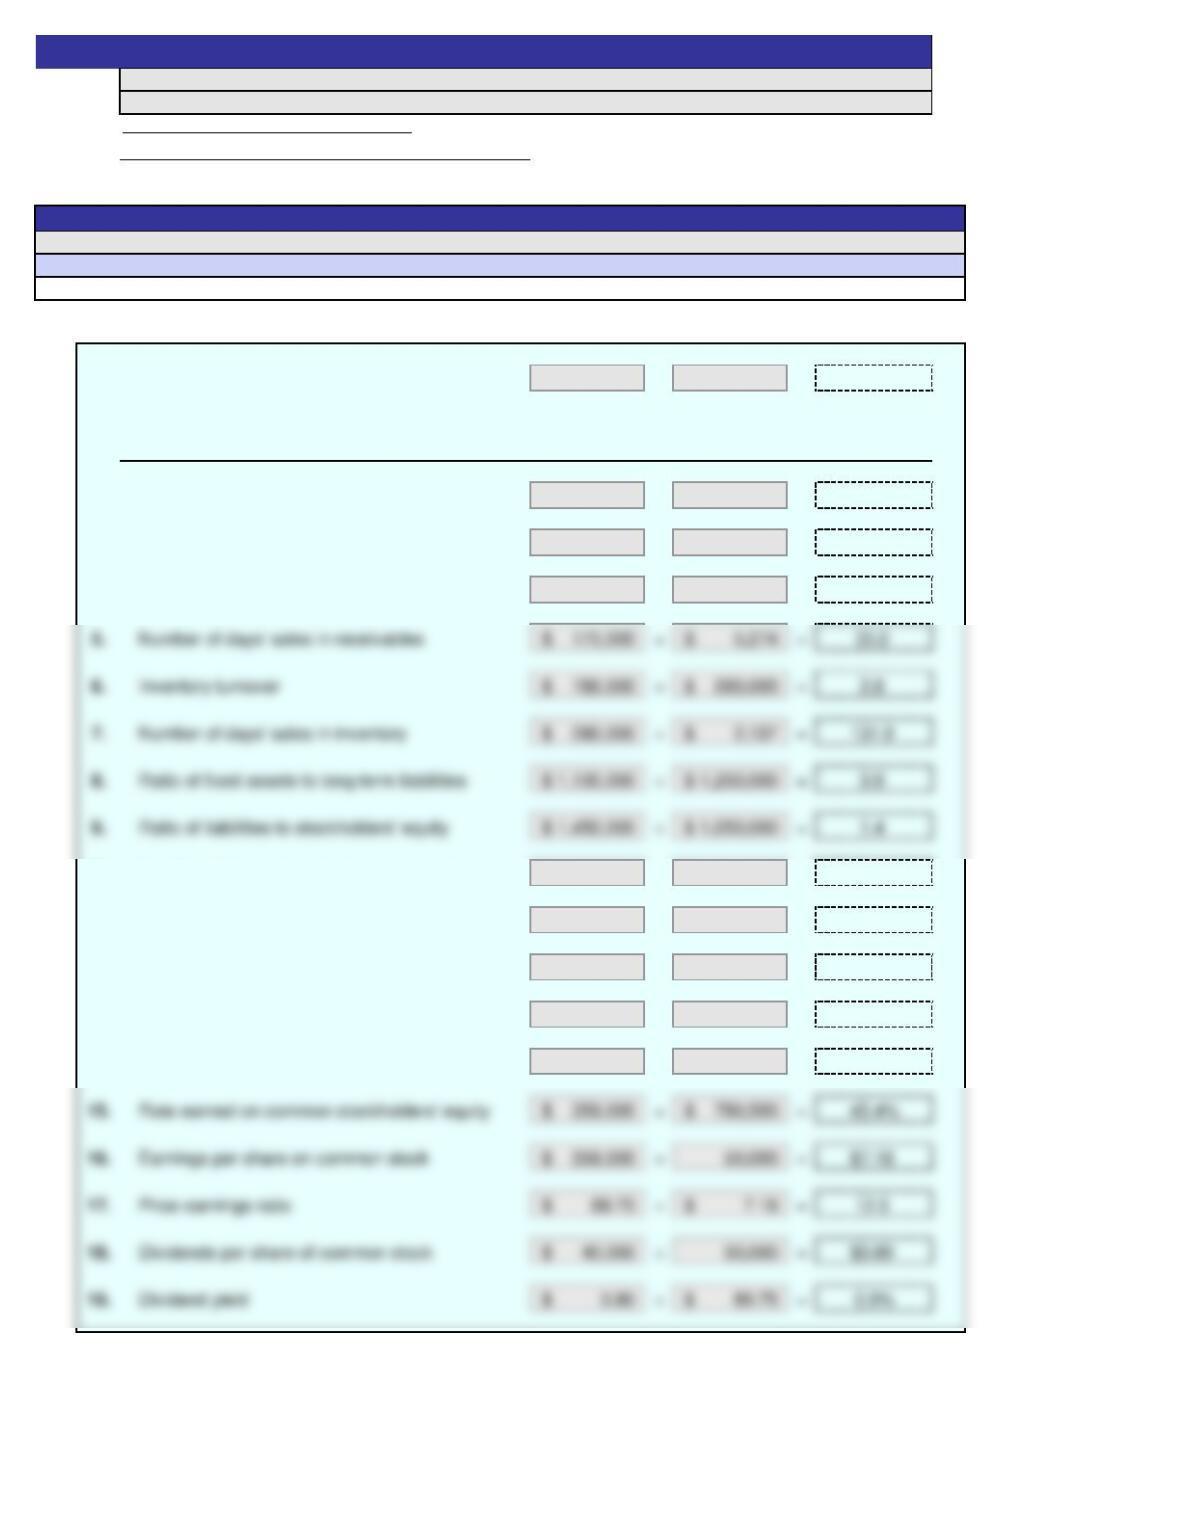
1. Working capital: $965,000
–$200,000 = $765,000
Calculated
Ratio Numerator ÷Denominator Value
2. Current ratio 965,000$ ÷ 200,000$ = 4.8
3. Quick ratio 615,000$ ÷ 200,000$ = 3.1
4. Accounts receivable turnover 1,925,000$ ÷ 175,000$ = 11.0
10. Number of times interest charges earned 570,000$ ÷ 115,000$ = 5.0
11. Number of times preferred dividends earned 364,000$ ÷ 5,000$ = 72.8
12. Ratio of net sales to assets 1,925,000$ ÷ 1,950,000$ = 1.0
13. Rate earned on total assets 479,000$ ÷ 2,200,000$ = 21.8%
14. Rate earned on stockholders’ equity 364,000$ ÷ 890,500$ = 40.9%
A red asterisk (*) will appear in the row immediately beneath an incorrect answer.
See student sheet for student’s score
Problem 9-4
Instructions
Answers are entered in the cells with gray backgrounds.
Cells with non-gray backgrounds are protected and cannot be edited.
SOLUTION
ON
Name:
Section:
Score: 0%
Key Code:
a.
20Y5 20Y4
Amount Amount Amount Percent
Sales 579,000$ 500,000$
Cost of goods sold 343,500 300,000
b.
Increase (Decrease)
A red asterisk (*) will appear in the column to the right of an incorrect answer.
MONTANA IMAGES COMPANY
Comparative Income Statement
For the Years Ended December 31, 20Y5 and 20Y4
Instructions
Answers are entered in the cells with gray backgrounds.
Cells with non-gray backgrounds are protected and cannot be edited.
Exercise 9-5
2
Name:
Section:
Score:
Scoring:
a.
20Y5 20Y4
Amount Amount Amount Percent
Sales 579,000$ 500,000$ 79,000$ 15.8%
b.
ON
Instructions
Exercise 9-5
SOLUTION
See student sheet for student’s score
Net income increased because sales increased at a greater percentage rate than did cost of goods sold and
operating expenses.
For the Years Ended December 31, 20Y5 and 20Y4
Increase (Decrease)
MONTANA IMAGES COMPANY
Comparative Income Statement
Answers are entered in the cells with gray backgrounds.
Cells with non-gray backgrounds are protected and cannot be edited.
A red asterisk (*) will appear in the column to the right of an incorrect answer.
Problem 9-3
Name:
Section:
Score: 0%
Key Code:
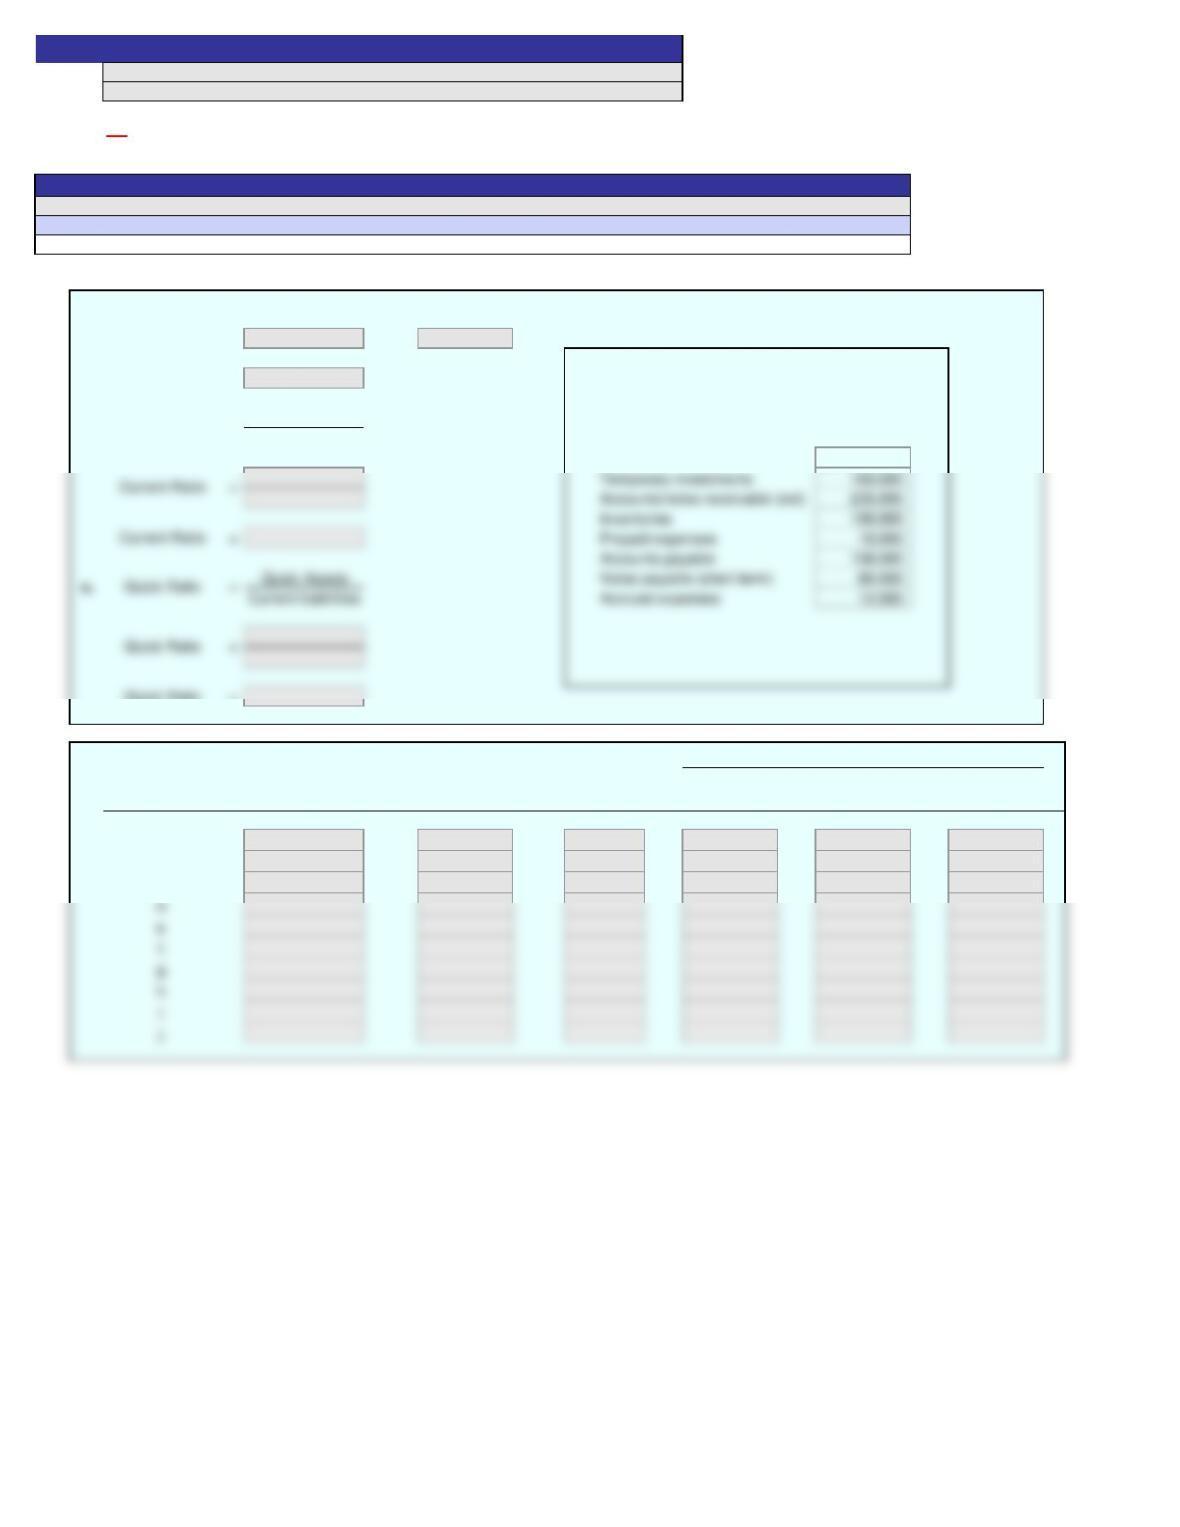
1.
a. Working Capital = Current Assets
–Current Liabilities
=
–
Working Capital =
Given data:
Call on the following amounts with your
b. Current Assets
formulas:
Current Liabilities
Cash 80,000$
Quick Ratio =
2.
Working Current Quick Current Quick Current
Transaction Capital Ratio Ratio Assets Assets Liabilities
a.
b.
c.
Supporting Calculations
Instructions
1
Answers are entered in the cells with gray backgrounds.
Current Ratio
=
Cells with non-gray backgrounds are protected and cannot be edited.
A red asterisk (*) will appear in the row immediately to the right of an incorrect answer.
Inventories
Current Ratio
=
=
=
Name:
Section:
Score:
Scoring:
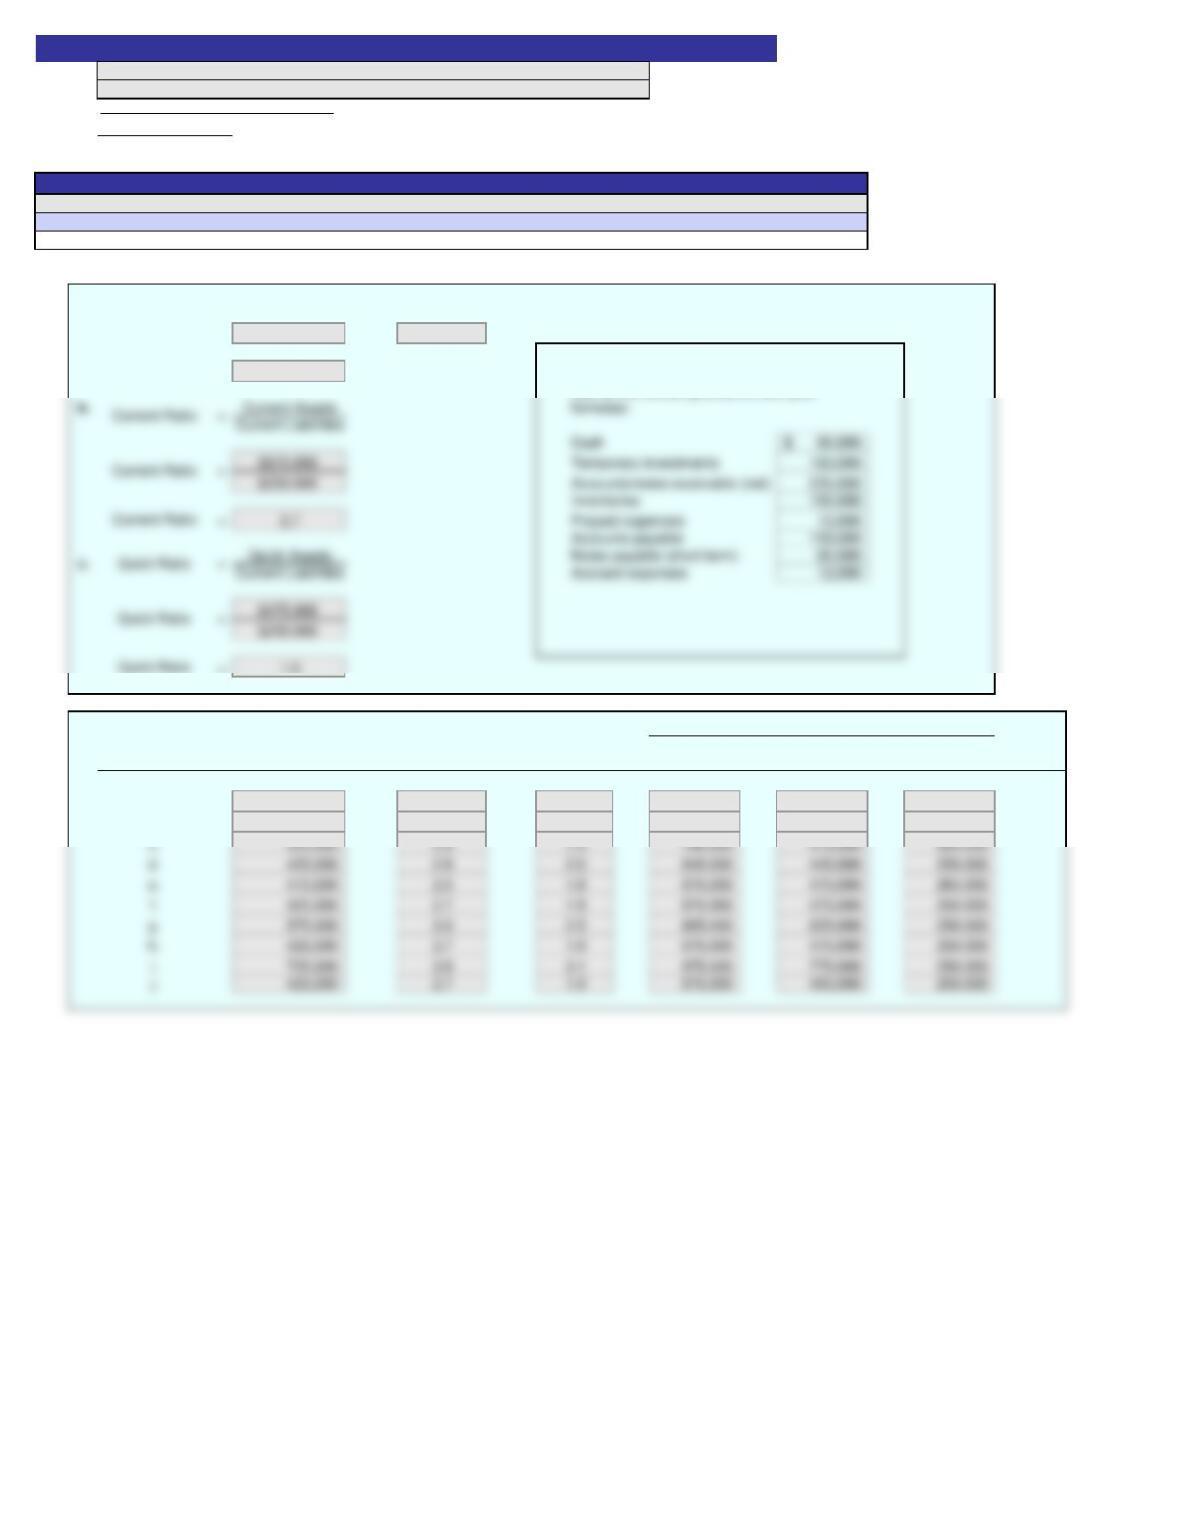
1.
a. Working Capital = Current Assets
–Current Liabilities
=$675,000
–250,000
Working Capital = $425,000
Given data:
Call on the following amounts with your
2.
Working Current Quick Current Quick Current
Transaction Capital Ratio Ratio Assets Assets Liabilities
a. 425,000$ 2.7 1.9 675,000$ 475,000$ 250,000$
b. 425,000 3.0 2.1 635,000 435,000 210,000
Supporting Calculations
A red asterisk (*) will appear in the row immediately to the right of an incorrect answer.
ON
Problem 9-3
SOLUTION
See student sheet for student’s score
Instructions
Answers are entered in the cells with gray backgrounds.
Cells with non-gray backgrounds are protected and cannot be edited.