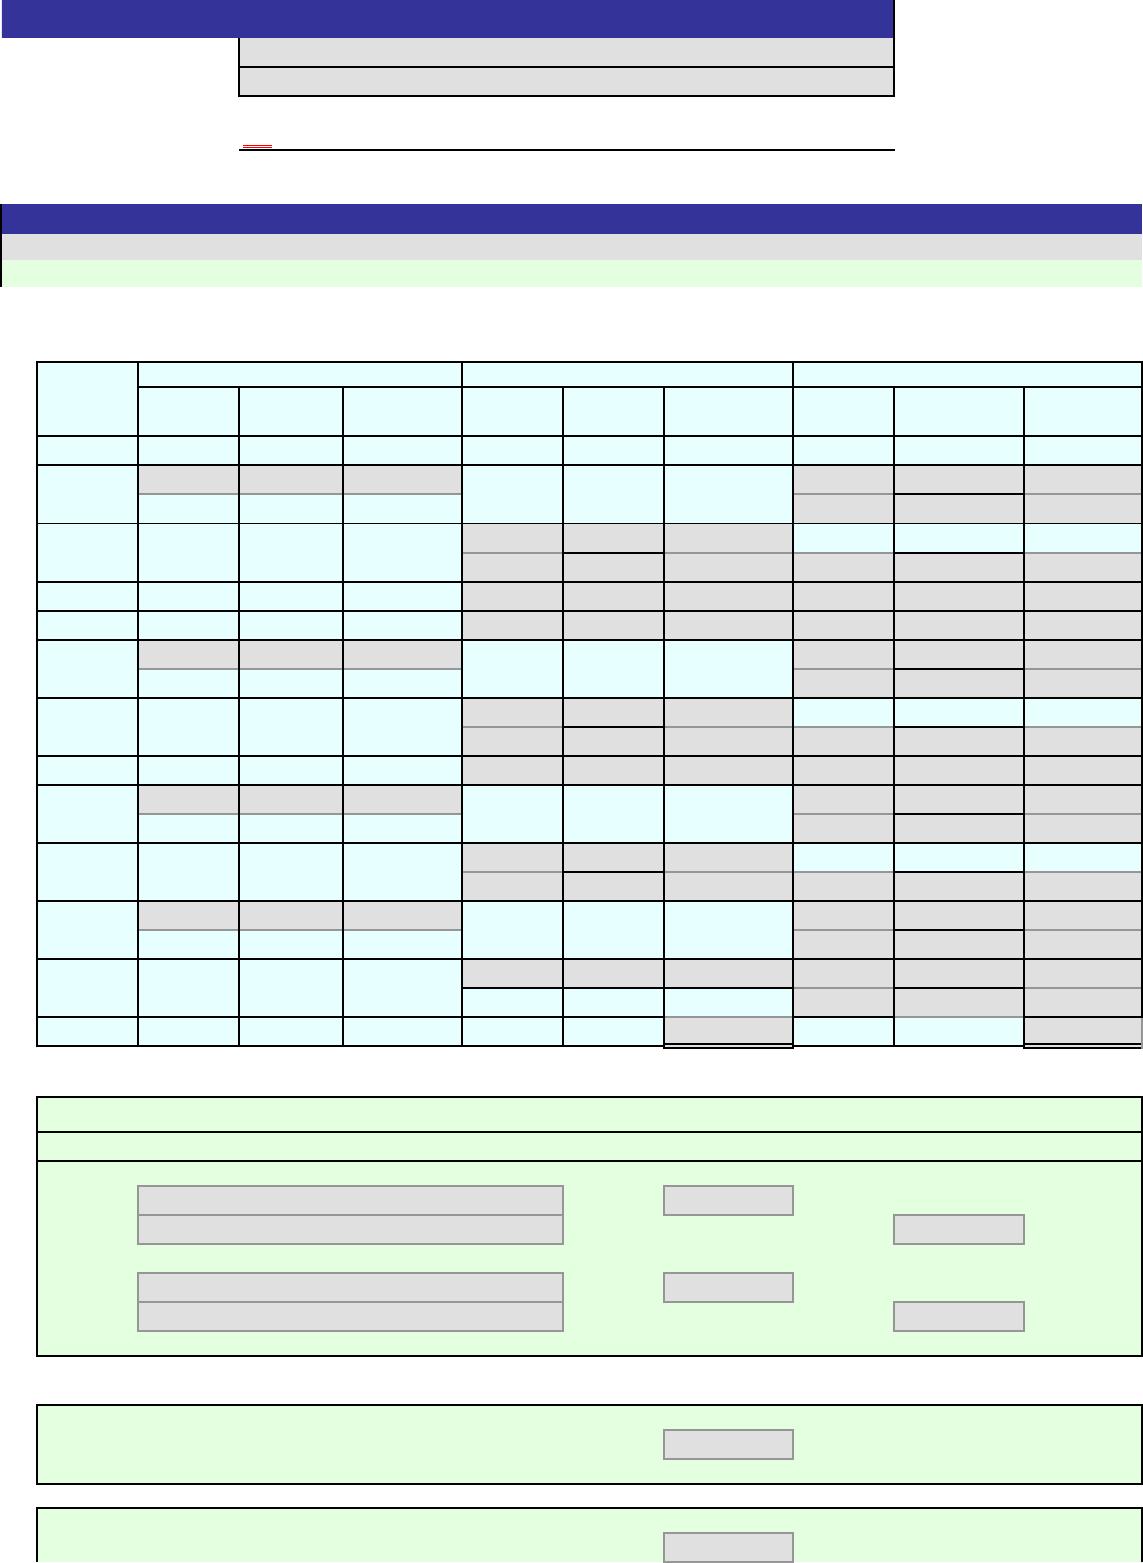
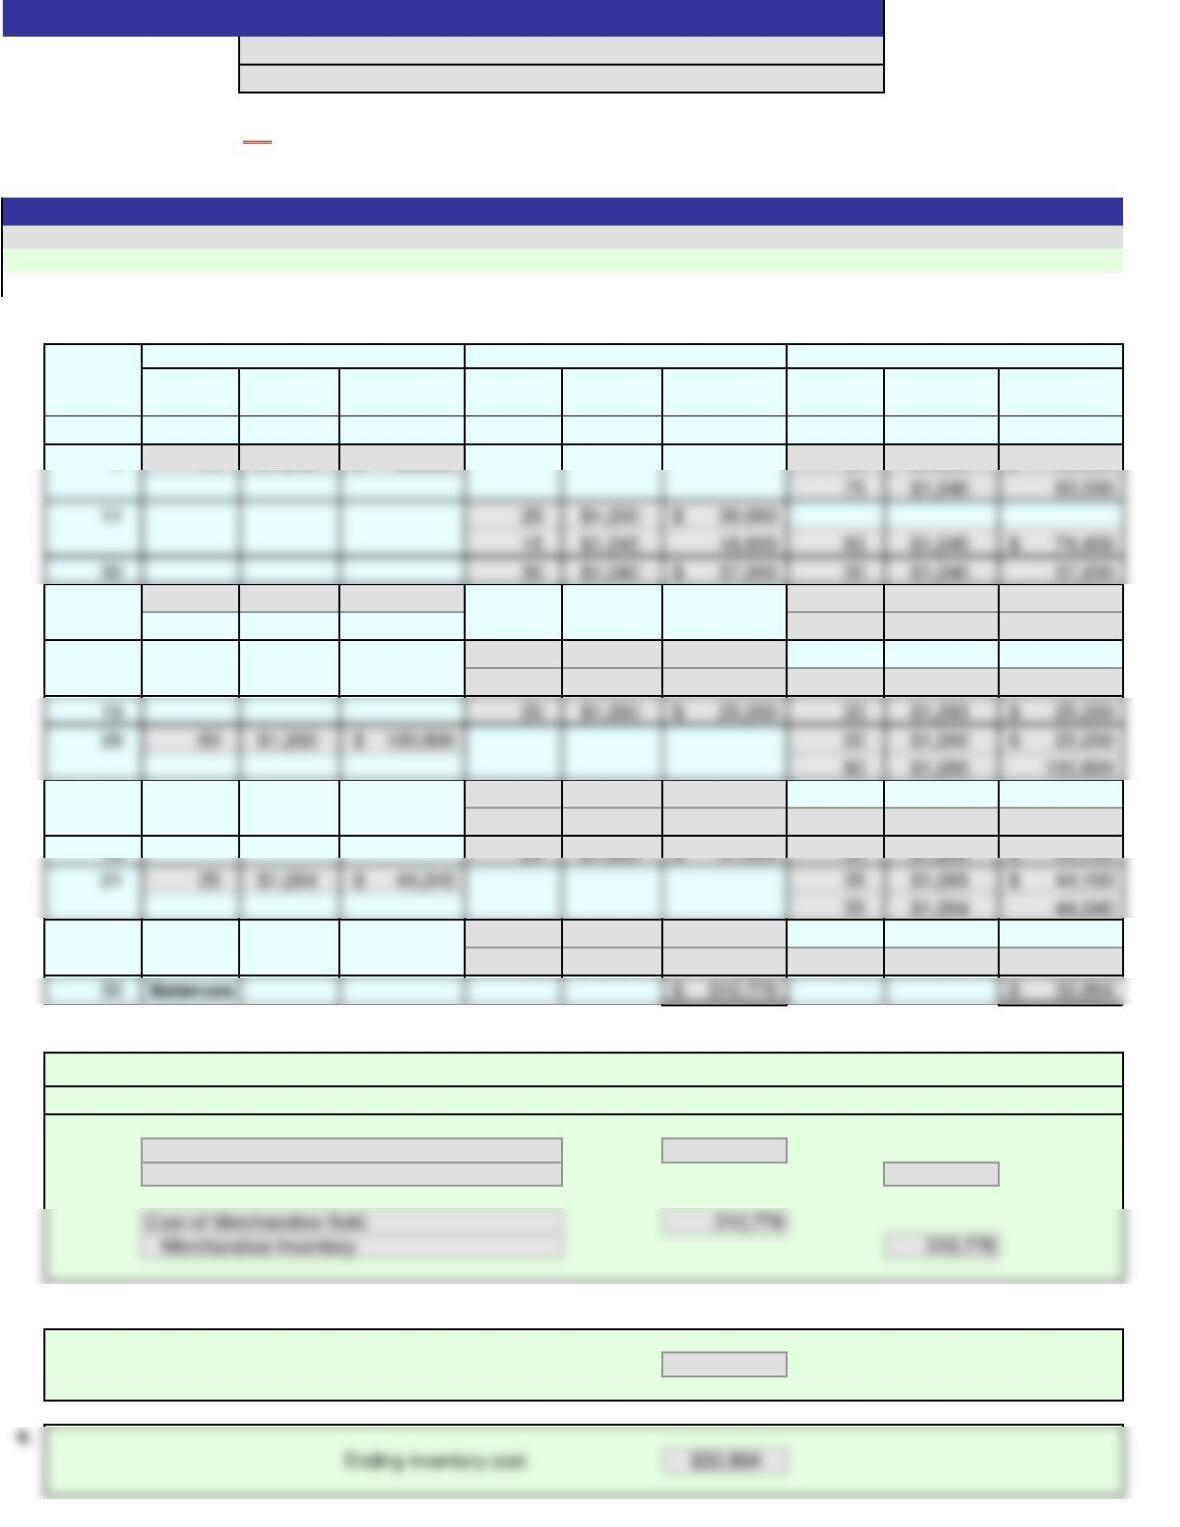
An asterisk (*) will appear to the right of an incorrect entry. In part 1, only final inventory cost – Column K – will be graded.
1.
Jan. 1 2,500 $60.00 150,000$
10
28
30
Feb. 5
10
16
28
Mar. 5
14
25
30
31 Balances
2.
Debit Credit
3.
4.
Answers are entered in the cells with gray backgrounds.
Unit
Cost
Total
Cost
Cells with non-gray backgrounds are protected and cannot be edited.
Instructions
Inventory
Unit
Cost
Date
Purchases
Cost of Merchandise Sold
Quantity
Unit
Cost
Total
Cost
Quantity
Ending inventory cost
Description
Total
Cost
Quantity
JOURNAL
Gross profit for the sales period
0%
[Key code here]
Problem 7-1A
Name:
Section:
Score:
Key Code:

5.
Inventory under LIFO would be
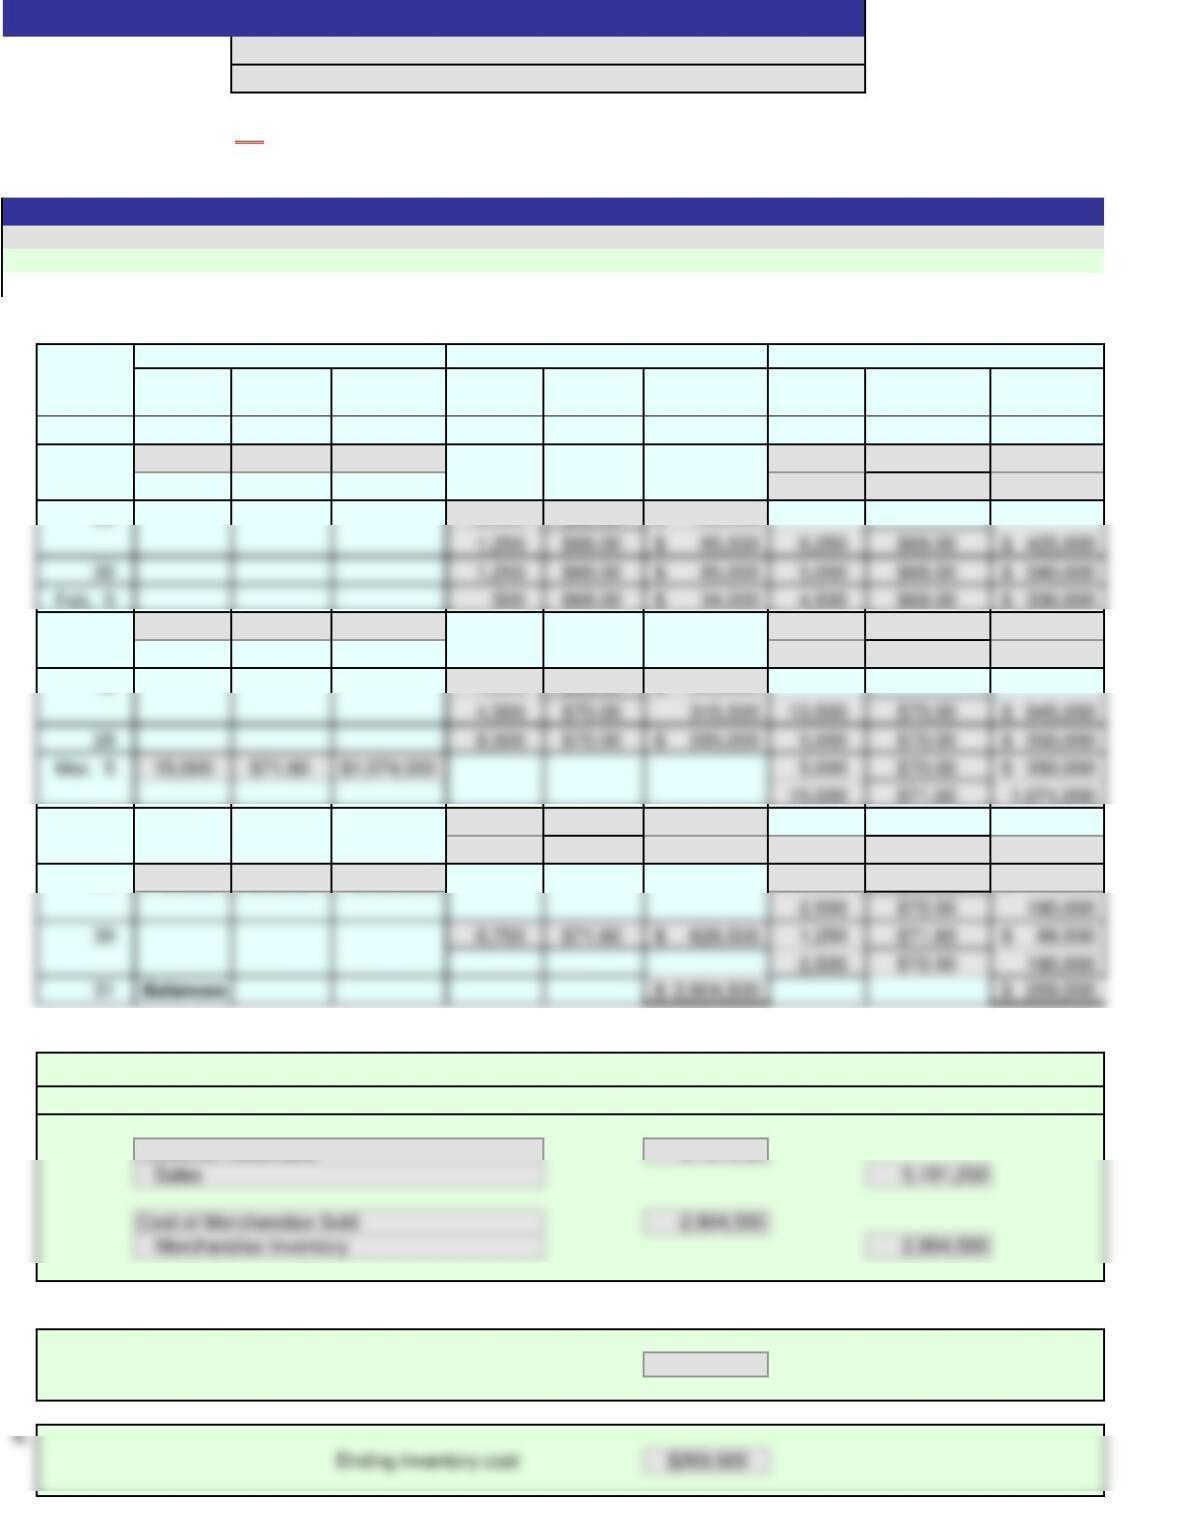
1.
Jan. 1 2,500 $60.00 150,000$
10 7,500 $68.00 $510,000 2,500 $60.00 150,000$
7,500 $68.00 510,000
28 2,500 $60.00 150,000$
10 18,000 $70.00 $1,260,000 4,500 $68.00 306,000$
18,000 $70.00 1,260,000
16 4,500 $68.00 306,000$
14 5,000 $70.00 350,000$
5,000 $71.60 358,000 10,000 $71.60 716,000$
25 2,500 $72.00 $180,000 10,000 $71.60 716,000$
2.
Debit Credit
5,191,250
Cost of Merchandise Sold
3.
$2,286,750
4.
Answers are entered in the cells with gray backgrounds.
ON
Gross profit for the sales period
Accounts Receivable
Cells with non-gray backgrounds are protected and cannot be edited.
An asterisk (*) will appear to the right of an incorrect entry. In part 1, only final inventory cost – Column K – will be graded.
Scoring:
Instructions
Problem 7-1A
Name:
Solution
Section:
Total
Cost
Quantity
JOURNAL
Description
Date
Purchases
Cost of Merchandise Sold
Inventory
Quantity
Unit
Cost
Total
Cost
Unit
Cost
Total
Cost
Quantity
Unit
Cost

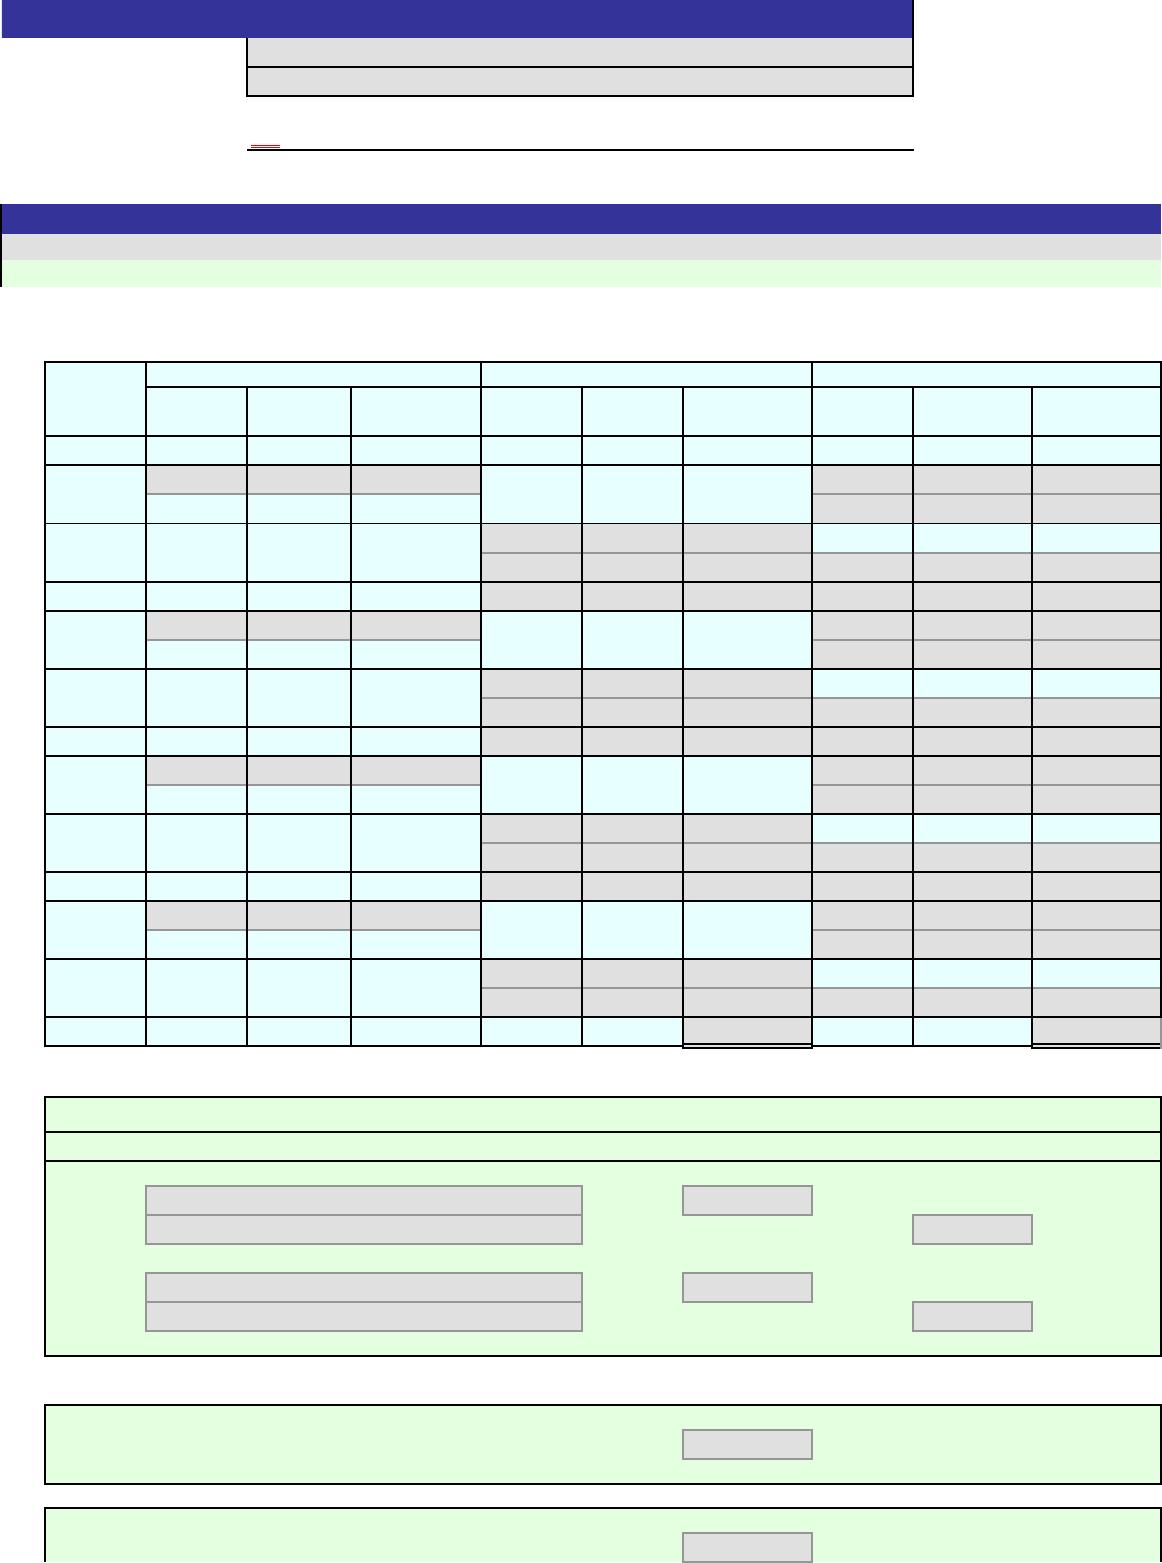
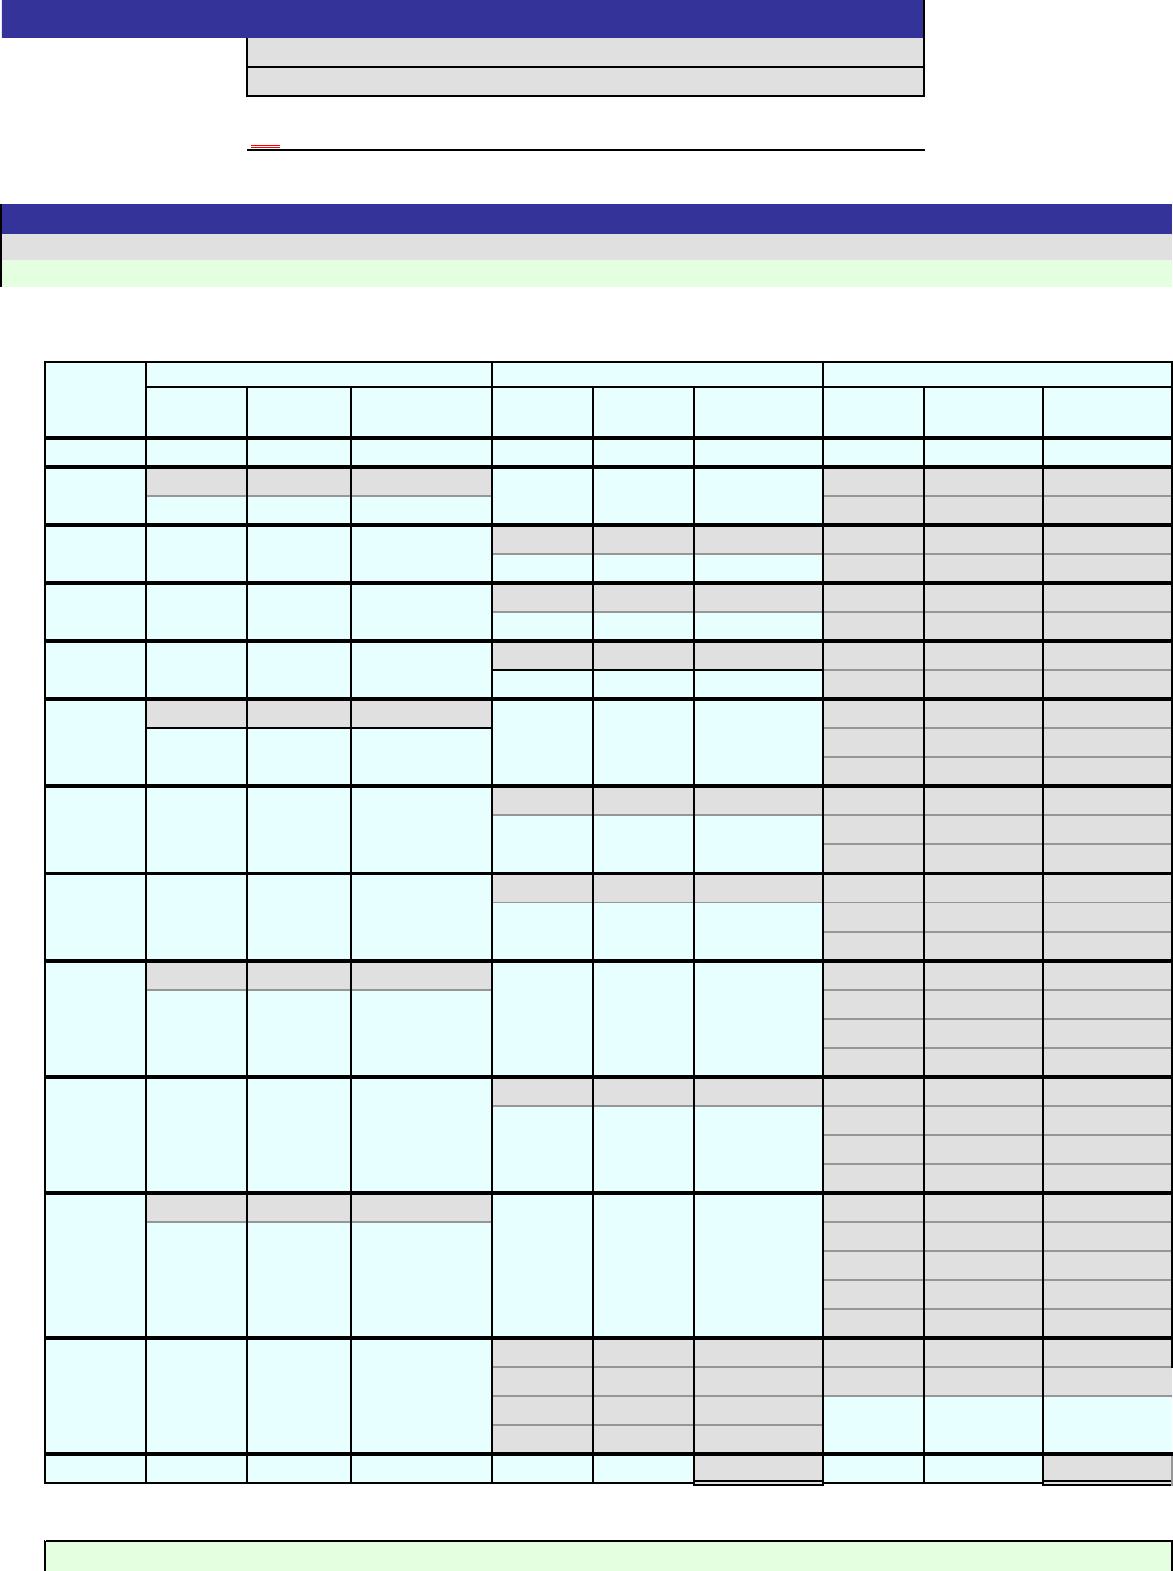
An asterisk (*) will appear to the right of an incorrect entry. In part 1, only final inventory cost – Column K – will be graded.
1.
Apr. 3 25 $1,200 30,000$
8
11
30
May 8
10
19
28
June 5
16
21
28
30 Balances
2.
Debit Credit
3.
4.
Total
Cost
Score:
Key Code:
Answers are entered in the cells with gray backgrounds.
Unit
Cost
Total
Cost
Cells with non-gray backgrounds are protected and cannot be edited.
Instructions
Total
Cost
Quantity
Inventory
Unit
Cost
Date
Purchases
Cost of Merchandise Sold
Quantity
Unit
Cost
Gross profit for the sales period
Quantity
Ending inventory cost
Description
JOURNAL
0%
[Key code here]
Problem 7-1B
Name:
Section:
5.
Inventory under LIFO would be
1.
Apr. 3 25 $1,200 30,000$
875 $1,240 93,000$ 25 $1,200 30,000$
May 8 60 $1,260 75,600$ 30 $1,240 37,200$
60 $1,260 75,600
10 30 $1,240 37,200$
20 $1,260 25,200 40 $1,260 50,400$
June 5 20 $1,260 25,200$
20 $1,260 25,200 60 $1,260 75,600$
28 35 $1,260 44,100$
9$1,264 11,376 26 $1,264 32,864$
2.
Debit Credit
525,250
Cost of Merchandise Sold
525,250
3.
$214,474
4.
Scoring:
Instructions
Answers are entered in the cells with gray backgrounds.
Gross profit for the sales period
Accounts Receivable
Sales
ON
Unit
Cost
Total
Cost
Unit
Cost
Total
Cost
Quantity
Unit
Cost
Cells with non-gray backgrounds are protected and cannot be edited.
An asterisk (*) will appear to the right of an incorrect entry. In part 1, only final inventory cost – Column K – will be graded.
JOURNAL
Description
Problem 7-1B
Name:
Solution
Section:
Total
Cost
Quantity
Date
Purchases
Cost of Merchandise Sold
Inventory
Quantity

5.
An asterisk (*) will appear to the right of an incorrect entry. In part 1, only final inventory cost – Column K – will be graded.
1.
Jan. 1 2,500 $60.00 150,000$
10
28
30
Feb. 5
10
16
28
Mar. 5
14
25
30
31 Balances
2.
0%
[Key code here]
Answers are entered in the cells with gray backgrounds.
Cost of Merchandise Sold
Unit
Cost
Problem 7-2A
Name:
Section:
Total
Cost
Quantity
Unit
Cost
Total
Cost
Total
Cost
Quantity
Score:
Key Code:
Date
Purchases
Cells with non-gray backgrounds are protected and cannot be edited.
Inventory
Instructions
Unit
Cost
Quantity

3.
Gross profit
Ending inventory cost
Total sales
Total cost of goods sold
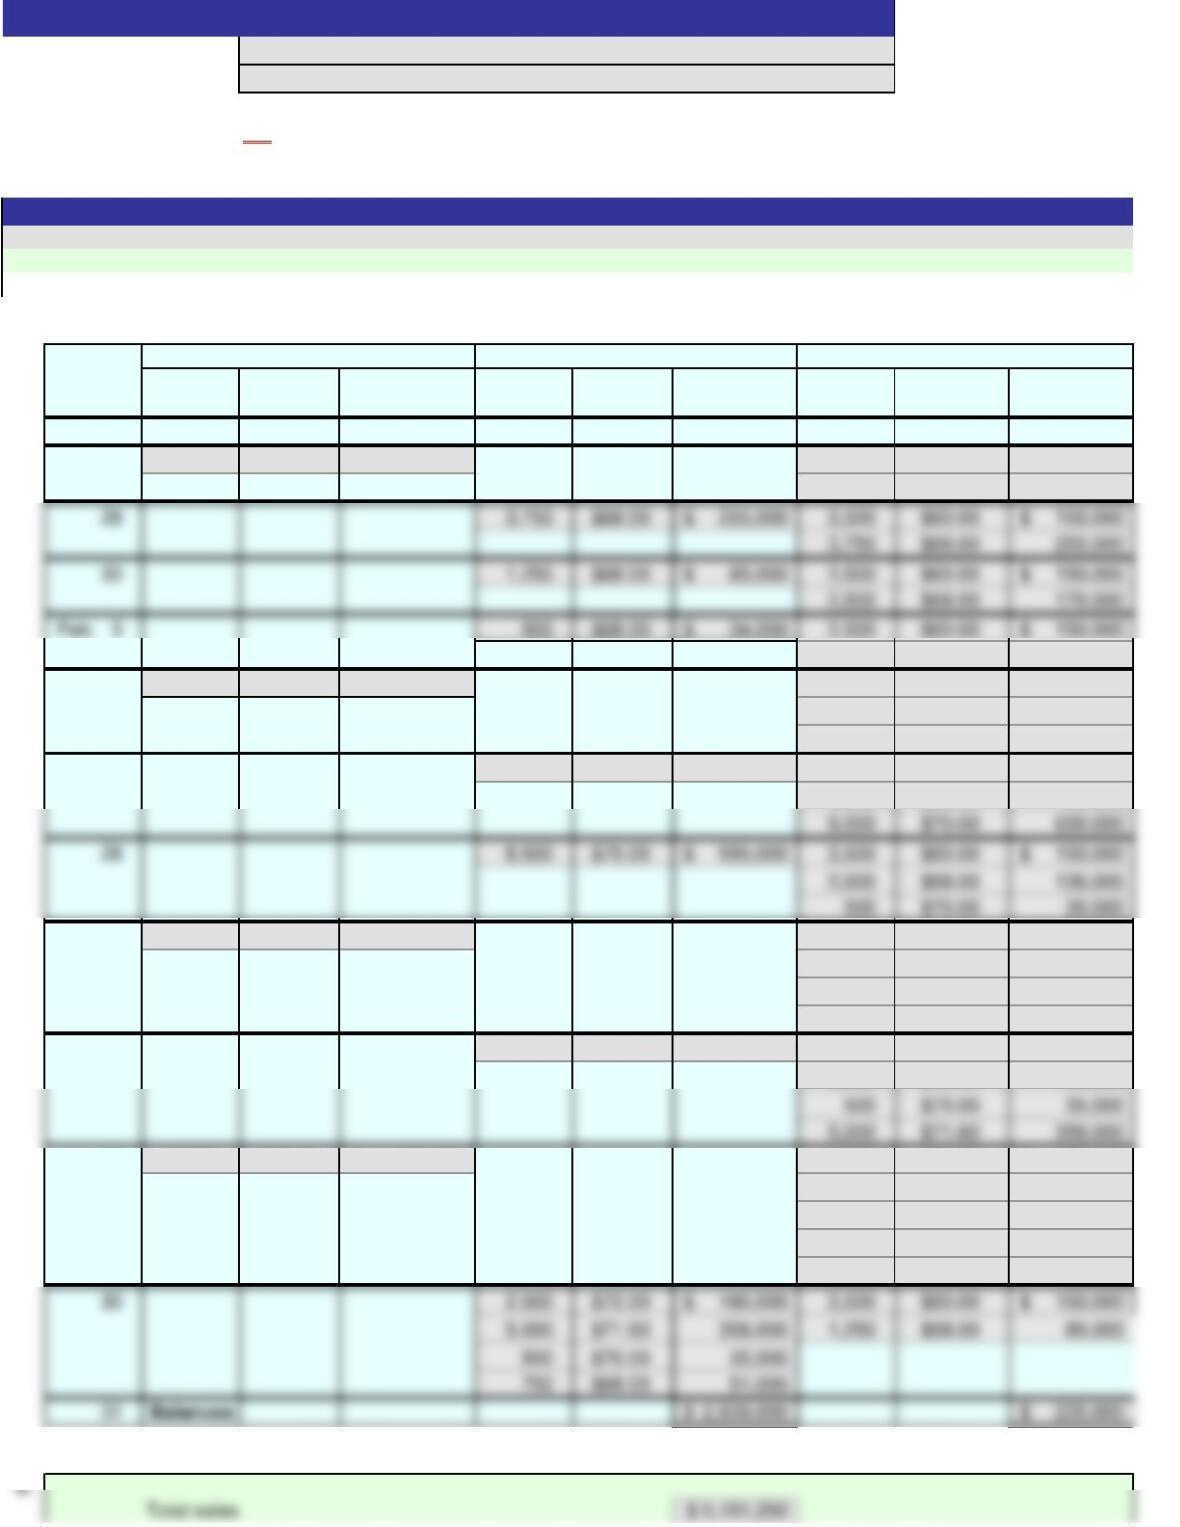
1.
Jan. 1 2,500 $60.00 150,000$
10 7,500 $68.00 510,000$ 2,500 $60.00 150,000$
7,500 $68.00 510,000
2,000 $68.00 136,000
10 18,000 $70.00 1,260,000$ 2,500 $60.00 150,000$
2,000 $68.00 136,000
18,000 $70.00 1,260,000
16 9,000 $70.00 630,000$ 2,500 $60.00 150,000$
2,000 $68.00 136,000
Mar. 5 15,000 $71.60 1,074,000$ 2,500 $60.00 150,000$
2,000 $68.00 136,000
500 $70.00 35,000
15,000 $71.60 1,074,000
14 10,000 $71.60 716,000$ 2,500 $60.00 150,000$
2,000 $68.00 136,000
25 2,500 $72.00 180,000$ 2,500 $60.00 150,000$
2,000 $68.00 136,000
500 $70.00 35,000
5,000 $71.60 358,000
2,500 $72.00 180,000
2.
Total
Cost
Unit
Cost
Total
Cost
Quantity
Unit
Cost
Total
Cost
Quantity
Date
Purchases
Cost of Merchandise Sold
Inventory
Quantity
Unit
Cost
Problem 7-2A
Name:
Solution
Section:
Cells with non-gray backgrounds are protected and cannot be edited.
An asterisk (*) will appear to the right of an incorrect entry. In part 1, only final inventory cost – Column K – will be graded.
Scoring:
Instructions
Answers are entered in the cells with gray backgrounds.
ON