APPENDIX B
PROCESS COST SYSTEMS
EXERCISES
E–1
a. Work in Process—Blending Department Increase
Materials—Cocoa Beans Decrease
Materials—Sugar Decrease
Materials—Dehydrated Milk Decrease
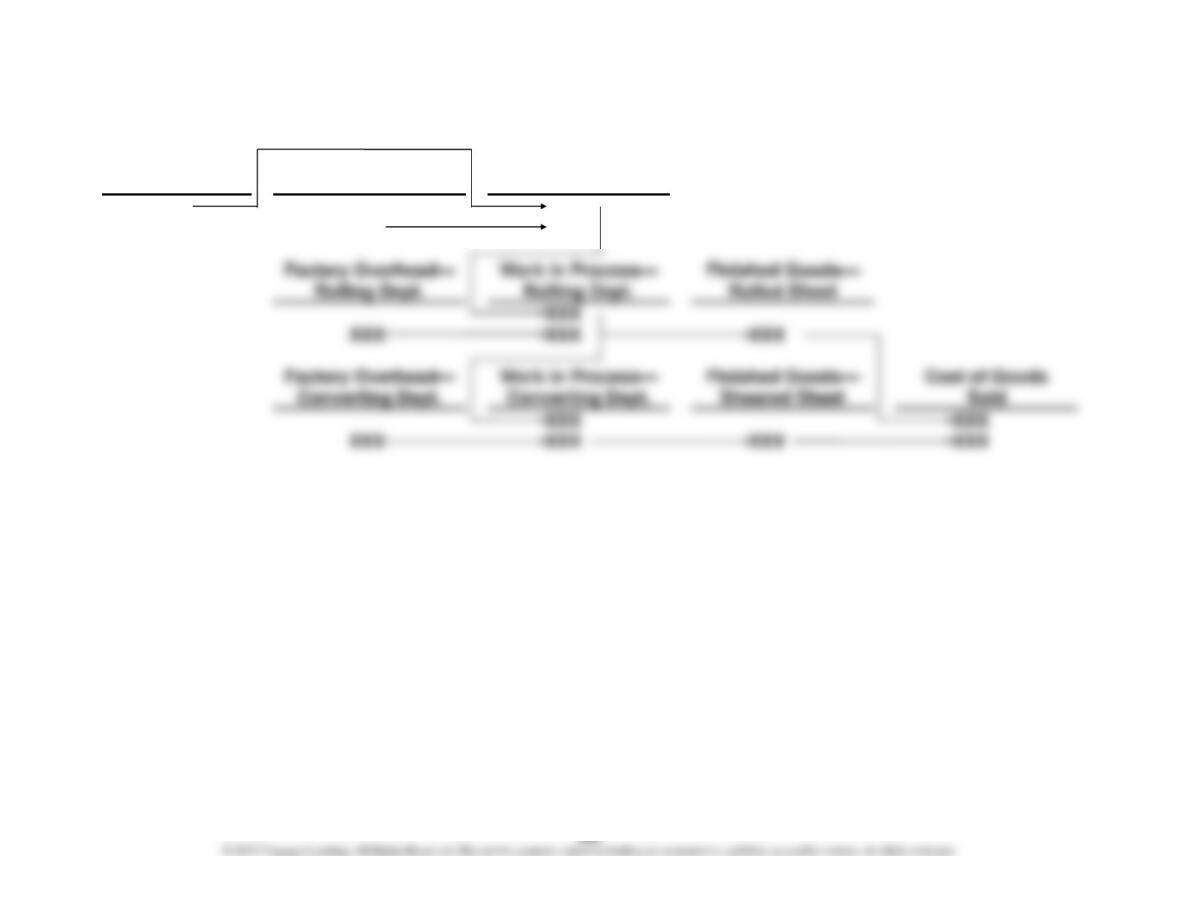
E–2
Materials
Factory Overhead—
Smelting Dept.
Work in Process—
Smelting Dept.
XXX
XXX
XXX
XXX
Rolling Dept.
Rolled Sheet
XXX
XXX
XXX
XXX
Sheared Sheet
XXX
XXX
XXX
XXX
XXX
XXX
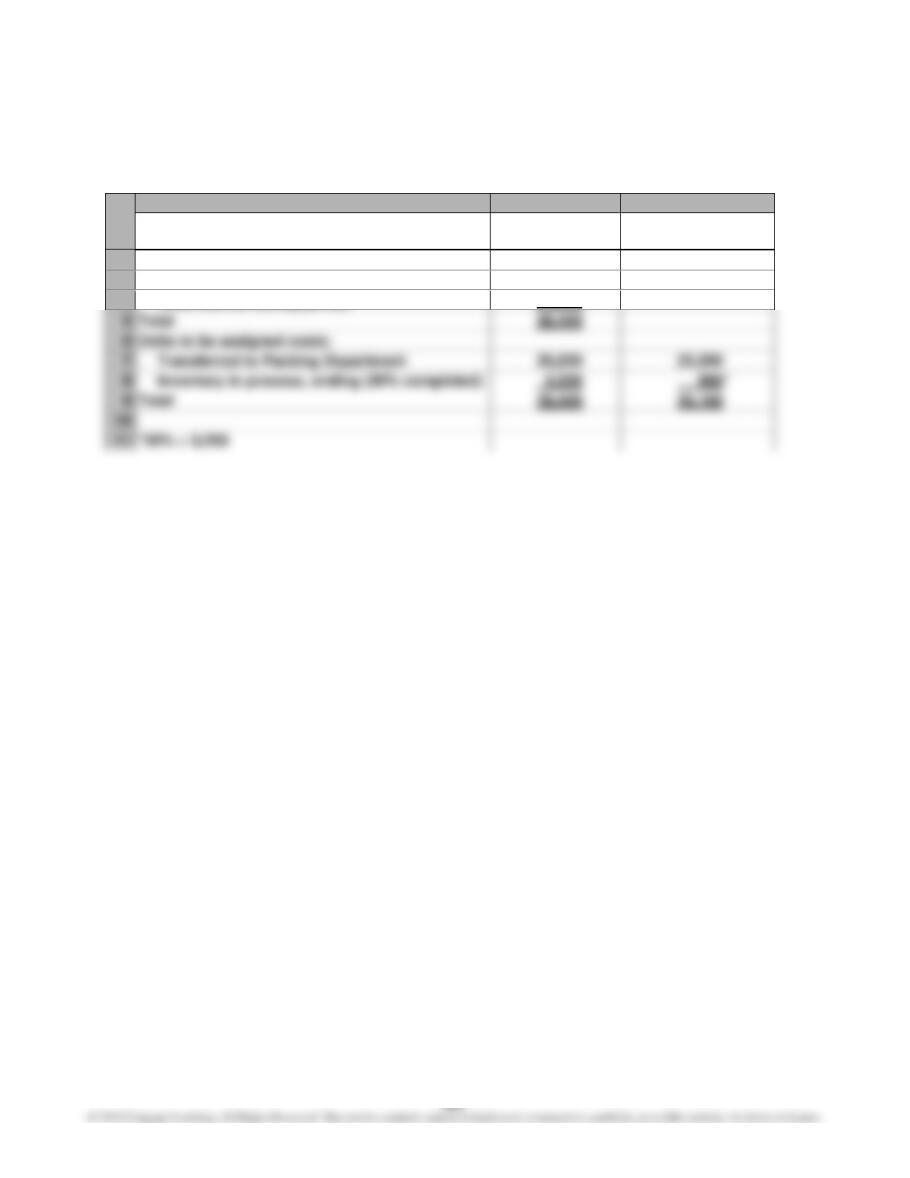
E–3
a. and b.
A
B
C
1
a. Units
b. Equivalent Units
of Production
2
Units to be accounted for:
3
Beginning work in process
3,500
4
Units started during period
24,900
5
Total
28,400
6
Units to be assigned costs:
7
Transferred to Packing Department
8
Inventory in process, ending (30% completed)
9
Total
*30% × 3,200
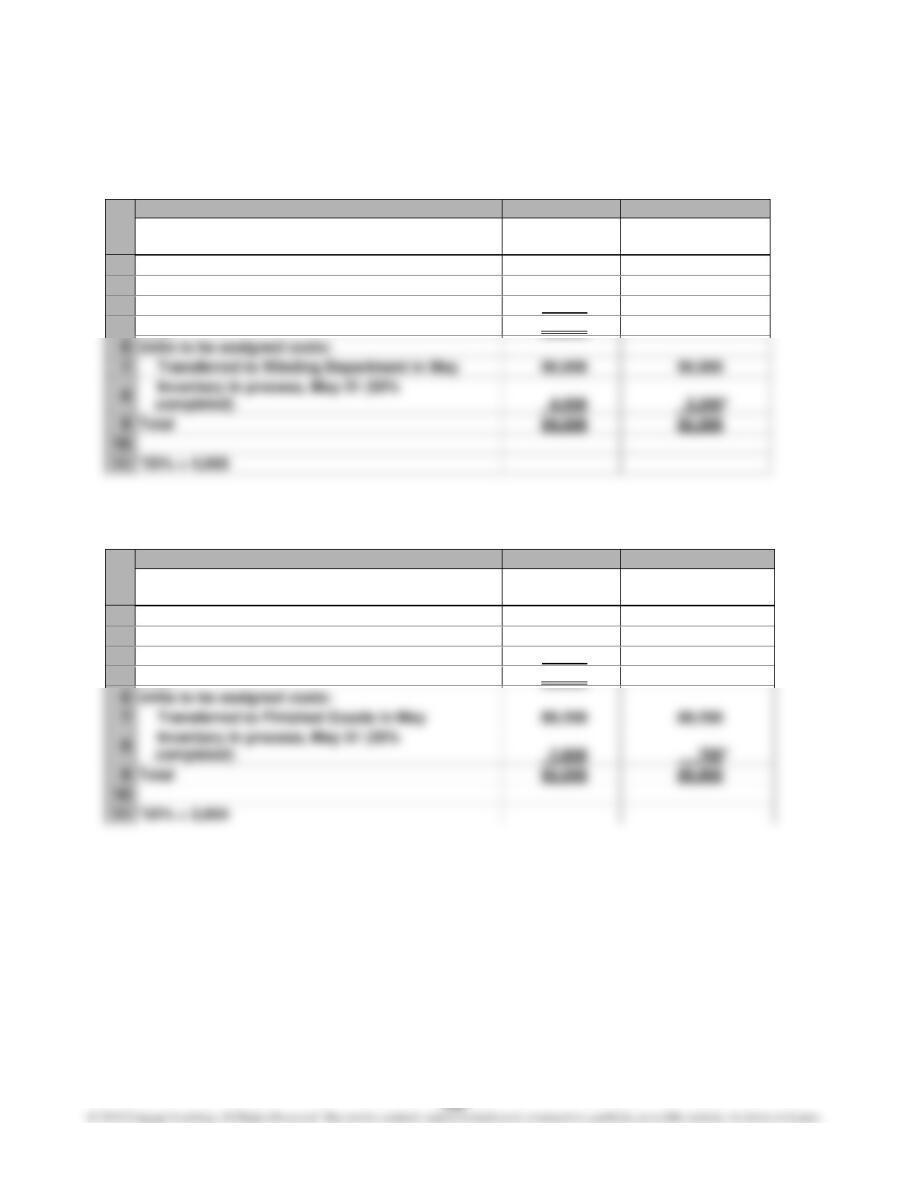
E–4
a. Drawing Department
A
B
C
1
Units
Equivalent Units
of Production
2
Units to be accounted for:
3
Beginning work in process
3,000
4
Units started during period
91,000
5
Total
94,000
6
Units to be assigned costs:
7
Transferred to Winding Department in May
90,000
9
Total
94,000
*55% × 4,000
b. Winding Department
A
B
C
1
Units
Equivalent Units
of Production
2
Units to be accounted for:
3
Beginning work in process
2,000
4
Units started during the period
90,000
5
Total
92,000
6
Units to be assigned costs:
7
Transferred to Finished Goods in May
89,200
9
Total
92,000
*25% × 2,800
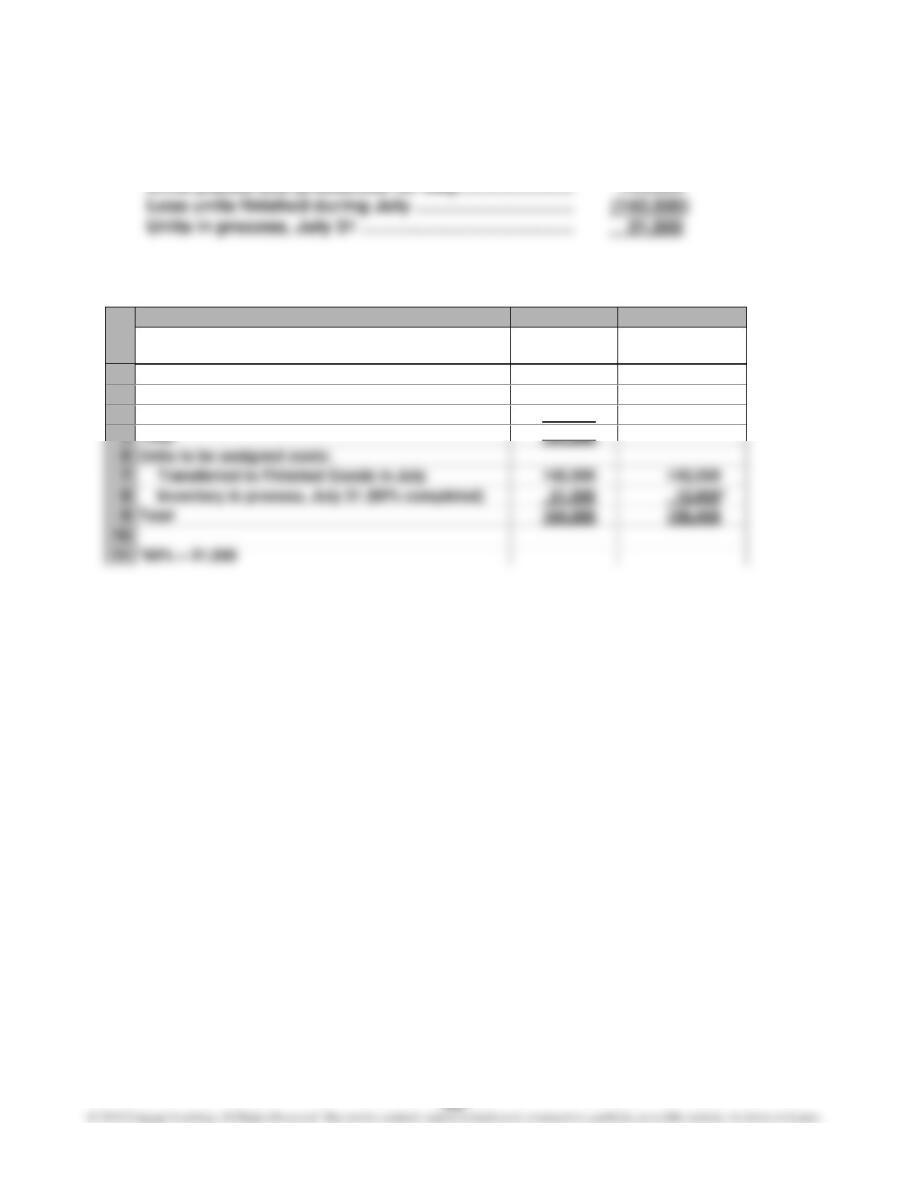
E–5
a. Units in process, July 1 ……………………………………… 20,000
Units placed into production for July ………………….. 144,000
b.
A
B
C
1
Units
Equivalent Units
of Production
2
Units to be accounted for:
3
Beginning work in process
20,000
4
Units started during the period
144,000
5
Total
164,000
6
Units to be assigned costs:
7
Transferred to Finished Goods in July
8
Inventory in process, July 31 (60% completed)
9
Total
164,000
*60% × 21,500
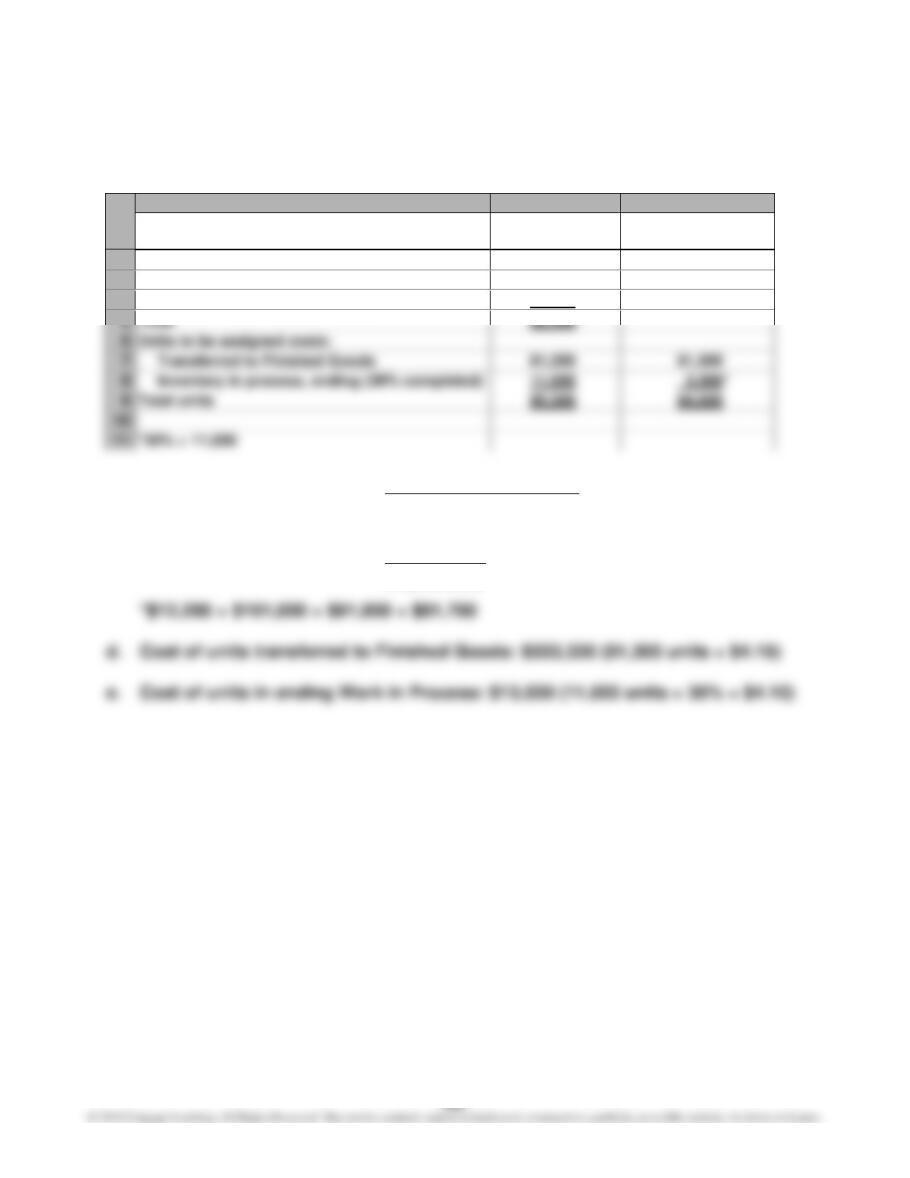
E–6
a. and b.
A
B
C
1
a. Units
b. Equivalent Units
of Production
2
Units to be accounted for:
3
Beginning work in process
10,000
4
Units started during the period
82,300
5
Total
6
Units to be assigned costs:
7
Transferred to Finished Goods
81,300
8
Inventory in process, ending (30% completed)
11,000
9
Total units
*30% × 11,000
c. Cost per Equivalent Unit =
Units Equivalent Total
Costs Production Total
Cost per Equivalent Unit =
units 84,600
*$346,860
= $4.10
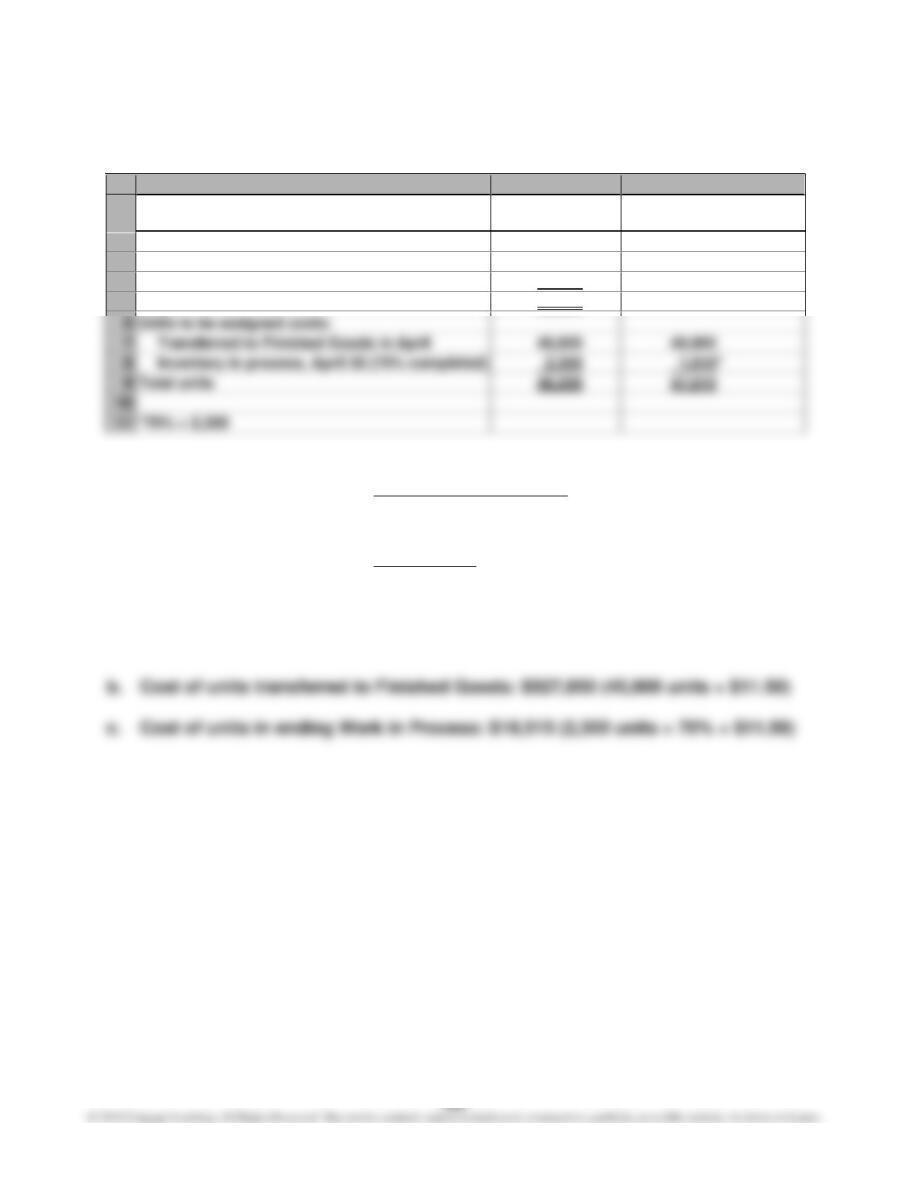
E–7
a.
A
B
C
1
Units
Equivalent Units
of Production
2
Units to be accounted for:
3
Beginning work in process
2,000
4
Units started during the period
46,200
5
Total
48,200
6
Units to be assigned costs:
7
Transferred to Finished Goods in April
45,900
8
Inventory in process, April 30 (70% completed)
9
Total units
48,200
*70% × 2,300
Cost per Equivalent Unit =
Units Equivalent Total
Costs Production Total
Cost per Equivalent Unit =
units 47,510
*$546,365
= $11.50
*$9,120 + $324,800 + $137,045 + $75,400
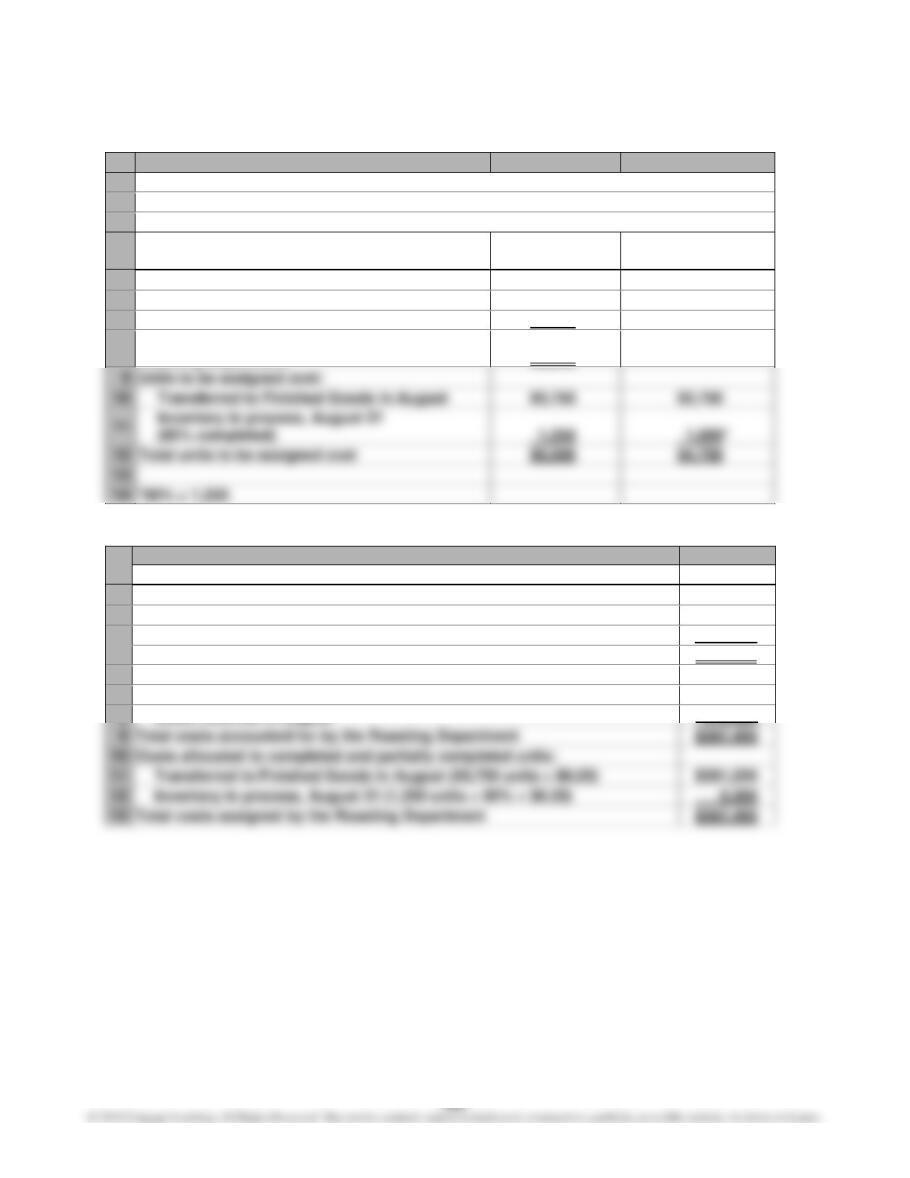
E–8
A
B
C
1
COLONEL DIRKS COFFEE COMPANY
2
Cost of Production Report—Roasting Department
3
For the Month Ended August 31
4
Units
Units
Equivalent Units
of Production
5
Units charged to production:
6
Inventory in process, August 1
2,000
7
Received from materials storeroom
93,000
8
Total units accounted for by the
Roasting Department
95,000
9
Units to be assigned cost:
Transferred to Finished Goods in August
93,750
Inventory in process, August 31
Total units to be assigned cost
95,000
*80% × 1,250
A
B
1
Costs
2
Unit costs:
3
Total costs for August in Roasting Department
$ 587,450
4
Total equivalent units
÷ 94,750
5
Cost per equivalent unit
$ 6.20
6
Costs assigned to production:
7
Inventory in process, August 1
$ 8,130
8
Costs incurred in August
579,320
9
Total costs accounted for by the Roasting Department
$ 587,450
Costs allocated to completed and partially completed units:
Transferred to Finished Goods in August (93,750 units × $6.20)
$ 581,250
Inventory in process, August 31 (1,250 units × 80% × $6.20)
6,200
Total costs assigned by the Roasting Department
$ 587,450
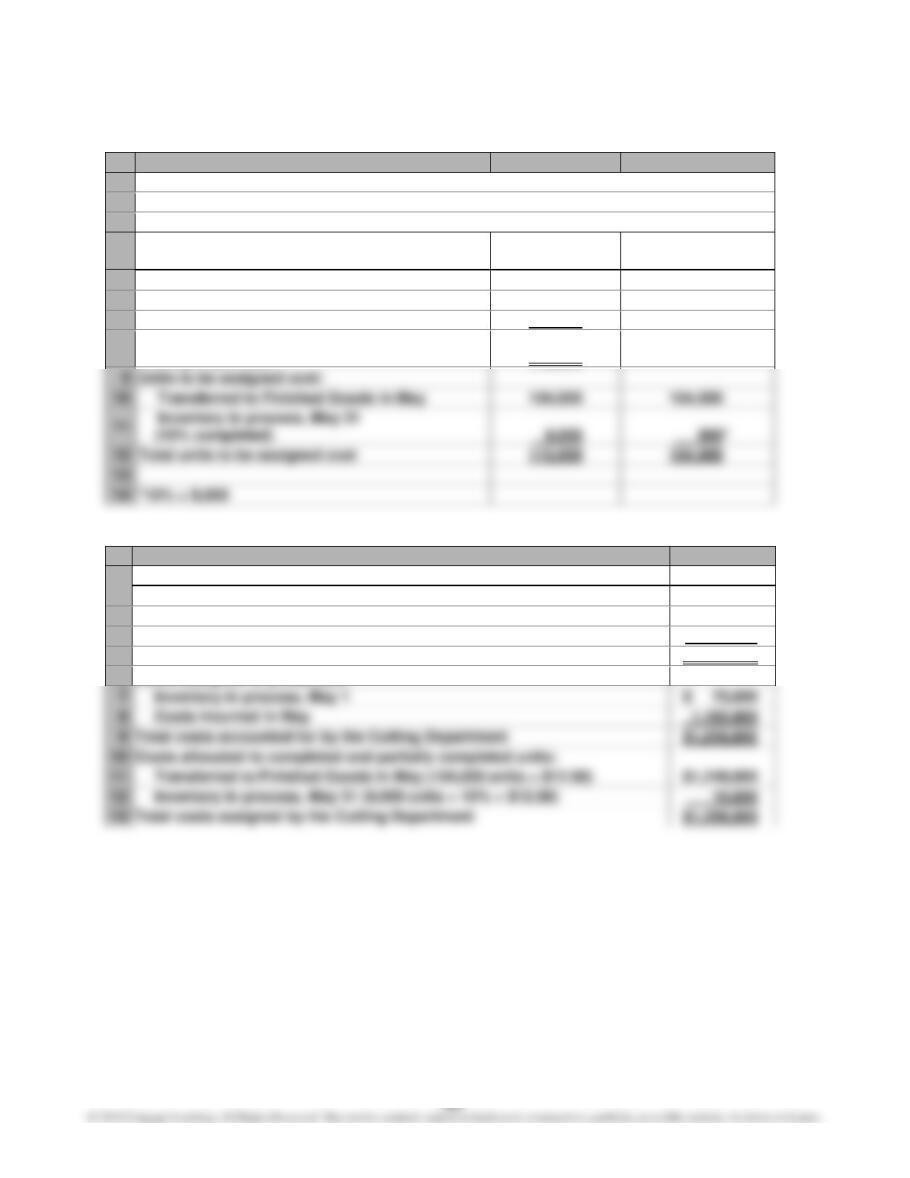
E–9
A
B
C
1
ORIENTAL CARPET COMPANY
2
Cost of Production Report—Cutting Department
3
For the Month Ended May 31
4
Units
Units
Equivalent Units
of Production
5
Units charged to production:
6
Inventory in process, May 1
8,000
7
Received from Weaving Department
105,000
8
Total units accounted for by the
Cutting Department
113,000
9
Units to be assigned cost:
Transferred to Finished Goods in May
104,000
Inventory in process, May 31
Total units to be assigned cost
113,000
*10% × 9,000
A
B
1
Costs
2
Unit costs:
3
Total costs for May in Cutting Department
$1,258,800
4
Total equivalent units
÷ 104,900
5
Cost per equivalent unit
$ 12.00
6
Costs assigned to production:
7
Inventory in process, May 1
$ 75,000
8
Costs incurred in May
1,183,800
9
Total costs accounted for by the Cutting Department
$1,258,800
Costs allocated to completed and partially completed units:
Transferred to Finished Goods in May (104,000 units × $12.00)
$ 1,248,000
Inventory in process, May 31 (9,000 units × 10% × $12.00)
10,800
Total costs assigned by the Cutting Department
$ 1,258,800
E–10
Memo
To: Production Manager
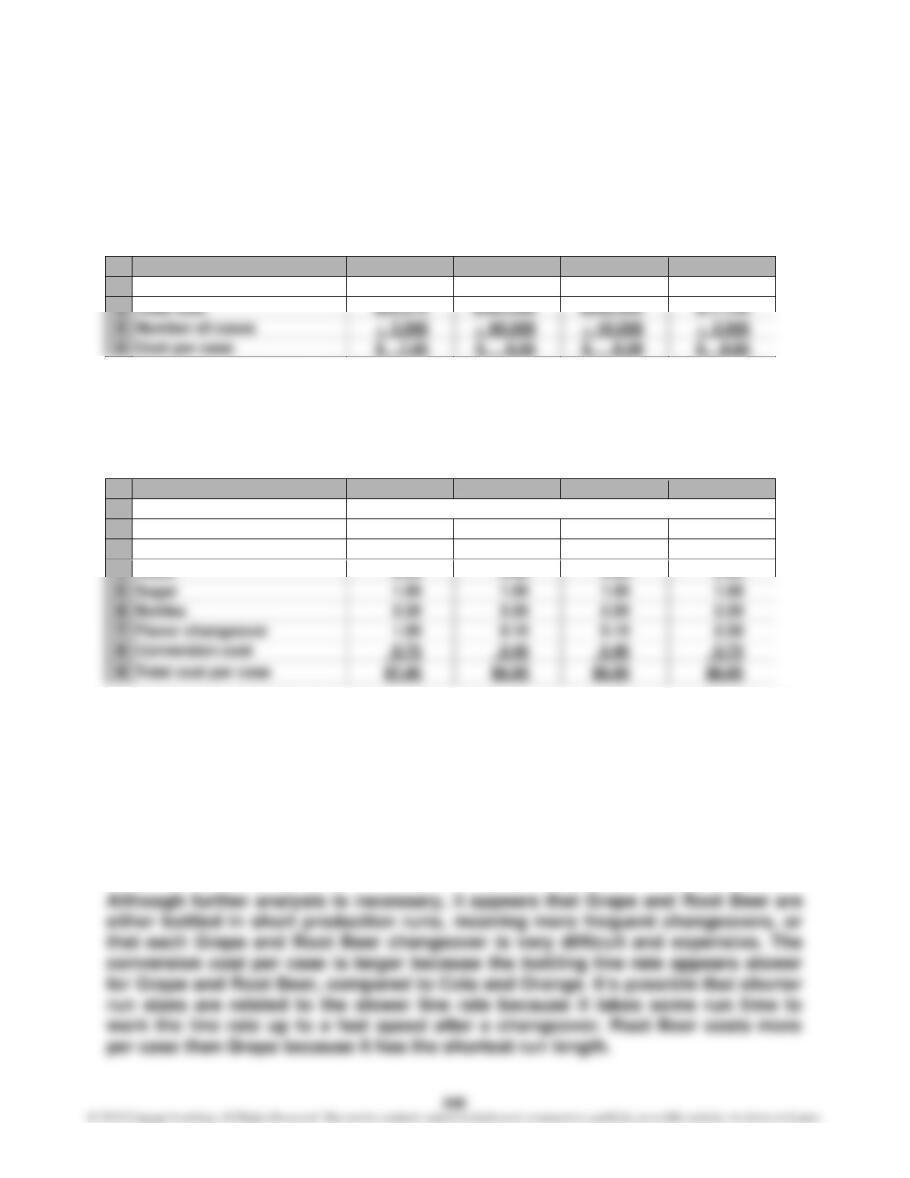
The cost of production report was used to identify the cost per case for each of
the four flavors as shown below.
A
B
C
D
E
1
Grape
Cola
Orange
Root Beer
2
Total cost
$26,075
$17,700
3
Number of cases
÷ 3,500
4
Cost per case
$ 7.45
As can be seen, the cost per case of Root Beer is significantly above the cost per
case of the other three flavors. A more detailed analysis is necessary to under-
stand the causes of this difference. The individual cost elements that determine
the total cost can be divided by the number of cases. This analysis is provided
below.
A
B
C
D
E
1
Cost per Case by Cost Element
2
Grape
Cola
Orange
Root Beer
3
Concentrate
$1.90
$2.25
$2.20
$1.80
4
Water
0.60
0.60
0.60
0.60
5
Sugar
1.00
1.00
1.00
1.00
6
Bottles
2.20
2.20
2.20
7
Flavor changeover
1.00
0.10
2.50
8
Conversion cost
The table above indicates that the concentrate per case is actually less for
Grape and Root Beer than for Cola and Orange. This is because the concentrate
supplier charges a higher price for the more popular flavors. The costs per case
for water, sugar, and bottles are the same for each flavor. However, the costs per
case for changeover are much greater for Grape and Root Beer than for the other
two flavors. In addition, the conversion costs per unit for Grape and Root Beer
are $0.35 higher than for Cola and Orange. These last two cost elements are suf-
ficient to cause the cost per case of Grape and Root Beer to be greater than Cola
and Orange.
E–11
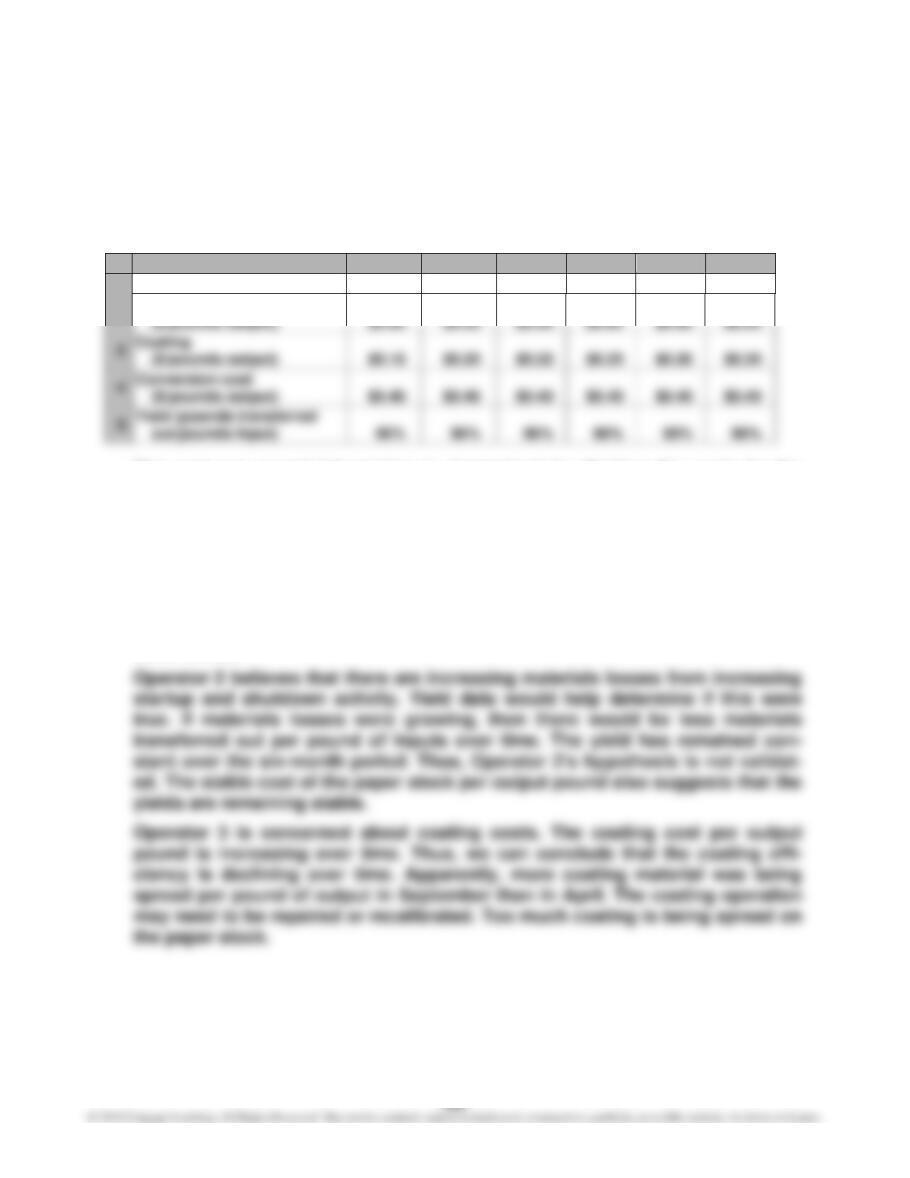
The solution to this exercise is to determine if cost per pound trends in paper
stock, conversion, and coating costs are remaining stable over time. The follow-
ing table can be developed from the data:
a.
A
B
C
D
E
F
G
1
April
May
June
July
August
Sept.
2
$0.80
$0.80
$0.80
$0.80
$0.18
$0.22
$0.25
$0.26
$0.40
$0.40
$0.40
$0.40
Paper stock
The cost per pound information is determined by dividing the costs by the
pounds transferred out. The yield is determined by dividing the pounds trans–
ferred out by the pounds input.
b. Operator 1 believes that energy consumption is becoming less efficient. The
energy cost is part of the conversion cost. The conversion cost per output
pound has remained constant for the six months. If the energy efficiency were
declining, it would take more energy per pound of output over time. Thus, we
would expect to see the conversion rate per pound increasing if Operator 1
were correct.
PROBLEMS
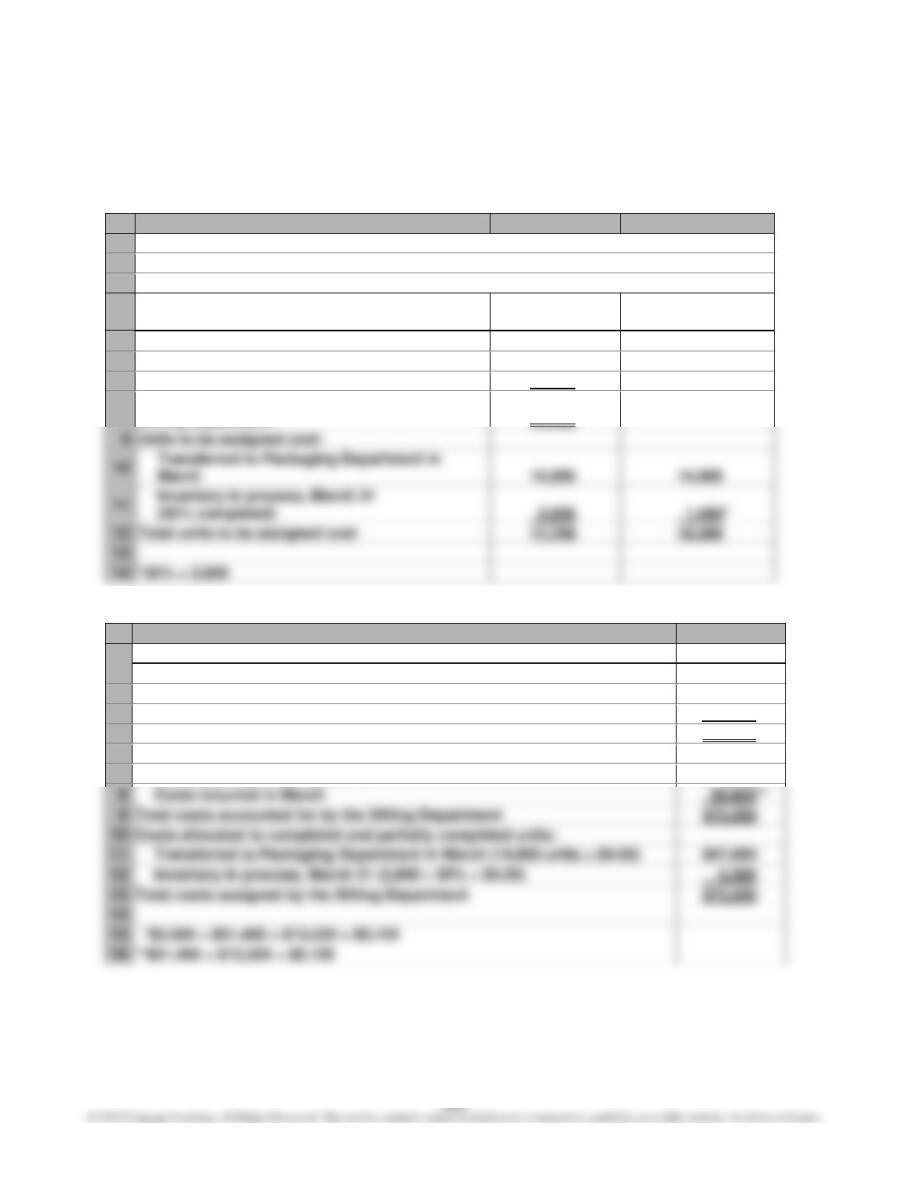
P–1
A
B
C
1
JOSHUA FLOUR COMPANY
2
Cost of Production Report—Sifting Department
3
For the Month Ended March 31
4
Units
Units
Equivalent Units
of Production
5
Units charged to production:
6
Inventory in process, March 1
3,200
7
Received from Milling Department
14,500
8
Total units accounted for by the
Sifting Department
17,700
9
Units to be assigned cost:
Transferred to Packaging Department in
Inventory in process, March 31
Total units to be assigned cost
17,700
A
B
1
Costs
2
Unit costs:
3
Total costs for March in Sifting Department
$73,350*
4
Total equivalent units
÷16,300
5
Cost per equivalent unit
$ 4.50
6
Costs charged to production:
7
Inventory in process, March 1
$ 3,500
8
Costs incurred in March
69,850**
9
Total costs accounted for by the Sifting Department
$73,350
Costs allocated to completed and partially completed units:
Transferred to Packaging Department in March (14,900 units × $4.50)
$67,050
Inventory in process, March 31 (2,800 × 50% × $4.50)
6,300
Total costs assigned by the Sifting Department
$73,350
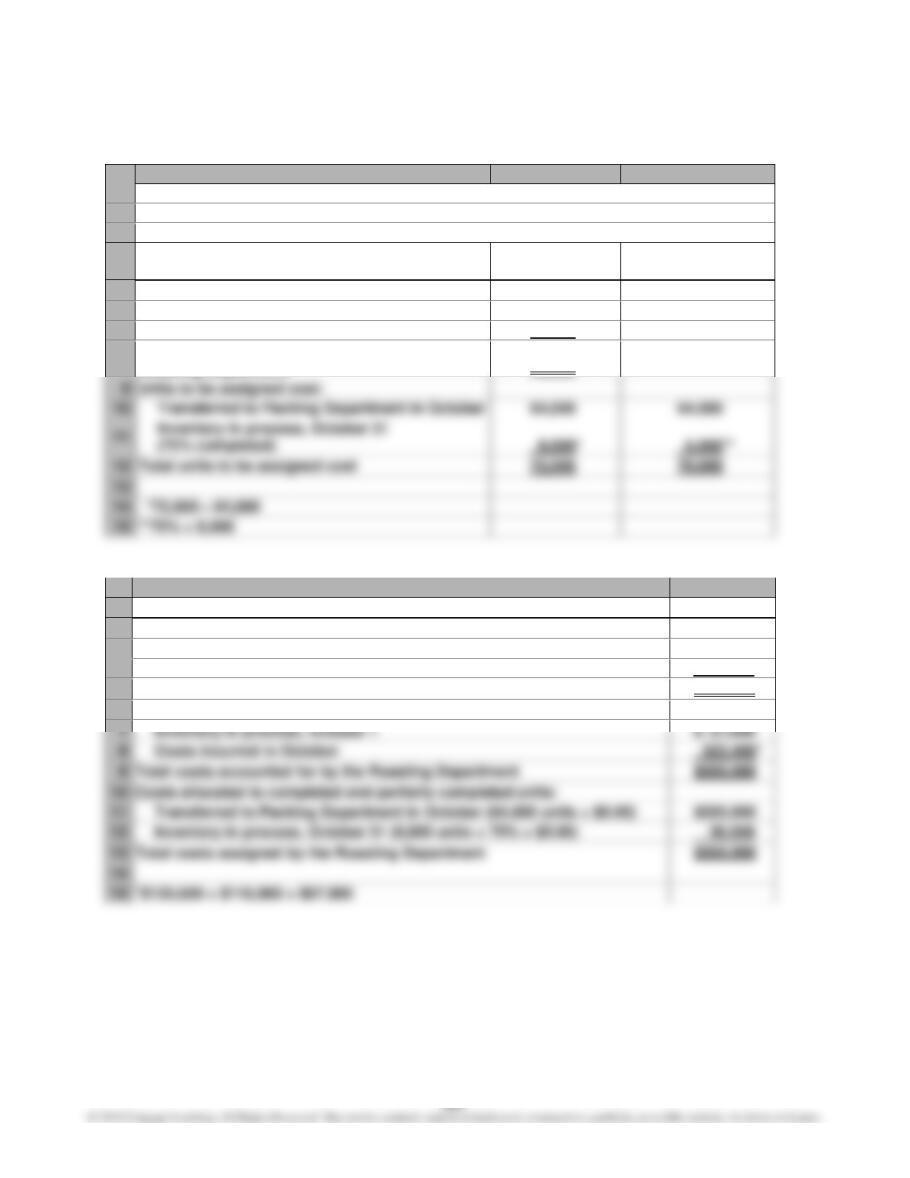
P–2
A
B
C
1
SERGEANT WILKES COFFEE COMPANY
2
Cost of Production Report—Roasting Department
3
For the Month Ended October 31
4
Units
Units
Equivalent Units
of Production
5
Units charged to production:
6
Inventory in process, October 1
7,500
7
Received from materials storeroom
64,500
8
Total units accounted for by the
Roasting Department
72,000
9
Units to be assigned cost:
Transferred to Packing Department in October
64,000
Inventory in process, October 31
Total units to be assigned cost
A
B
1
Costs
2
Unit costs:
3
Total costs for October in Roasting Department
$350,000
4
Total equivalent units
÷ 70,000
5
Cost per equivalent unit
$ 5.00
6
Costs charged to production:
7
Inventory in process, October 1
$ 27,600
8
Costs incurred in October
9
Total costs accounted for by the Roasting Department
Costs allocated to completed and partially completed units:
Transferred to Packing Department in October (64,000 units × $5.00)
$320,000
Inventory in process, October 31 (8,000 units × 75% × $5.00)
30,000
Total costs assigned by the Roasting Department
*$135,600 + $118,900 + $67,900