SA1–1
SPECIAL APPENDIX 1
UNDERSTANDING THE ISSUES
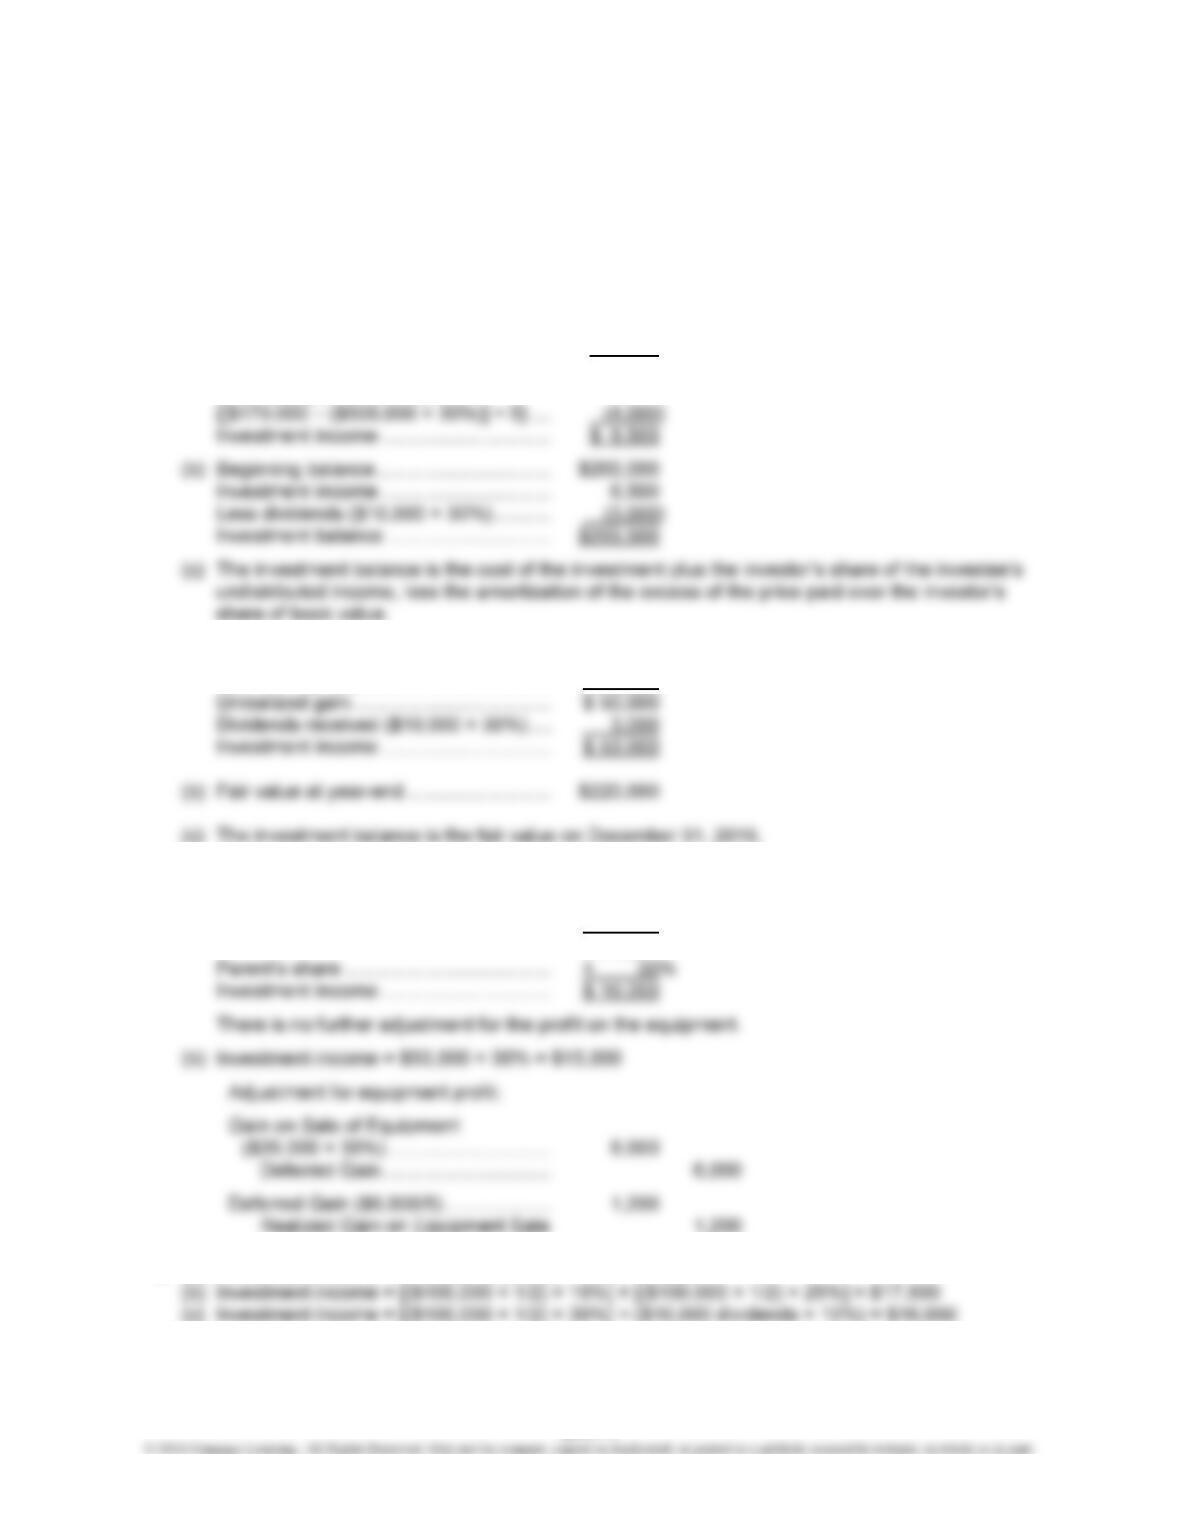
1. (a) Company E net income ……………………. $35,000
Parent’s share ………………………………… × 30%
$10,500
Less: Equipment amortization
2. (a) Fair value of investment, year-end, ……. $220,000
Cost of investment …………………………… 170,000
3. (a) Company E income …………………………. $ 50,000
Gain on sale of equipment………………… (20,000)
Realized gain ($20,000 ÷ 5) ……………… 4,000
$ 34,000
4. (a) Investment income = $10,000 dividends × 10% = $1,000
5. Cost of investment ………………………………… $ 20,000
2010–2014 income (25% × $200,000) ……… 50,000
SA1–3 Special Appendix 1—Exercises
EXERCISES
EXERCISE SA1-1
(a)
Investment in Lincoln ………………………………………………………………….. 4,250
Investment Income ………………………………………………………………… 4,250
To record 2017 investment income.
Investment in Lincoln ………………………………………………………………….. 4,000
Dividends Receivable …………………………………………………………………. 1,250
2017 2018
Lincoln Company income ……………………………………………………….. $25,000 $30,000
Adjustment for inventory profit ($5,000 profit × 20%) ………………….. (1,000)
Adjusted income …………………………………………………………………… $25,000 $29,000
Ownership percentage …………………………………………………………… × 25% × 25%
$ 6,250 $ 7,250
Less amortization of excess:
EXERCISE SA1-2
Determination and Distribution of Excess Schedule
Price paid for investment …………………… $90,000
Less book value of interest acquired:
Common stock ($10 par) ………………. $100,000
Paid-in capital in excess of par ……… 20,000
Exercise SA1-2, Concluded
Minnie Company Income Distribution
Profit in ending inventory Internally generated net
(40% × $40,000) …………………. $16,000 income ……………………………. $60,000
Realized profit on beginning
inventory (40% × $10,000) … 4,000
Investment in Minnie ……………………………………………………………… 13,650
Investment Income …………………………………………………………… 13,650
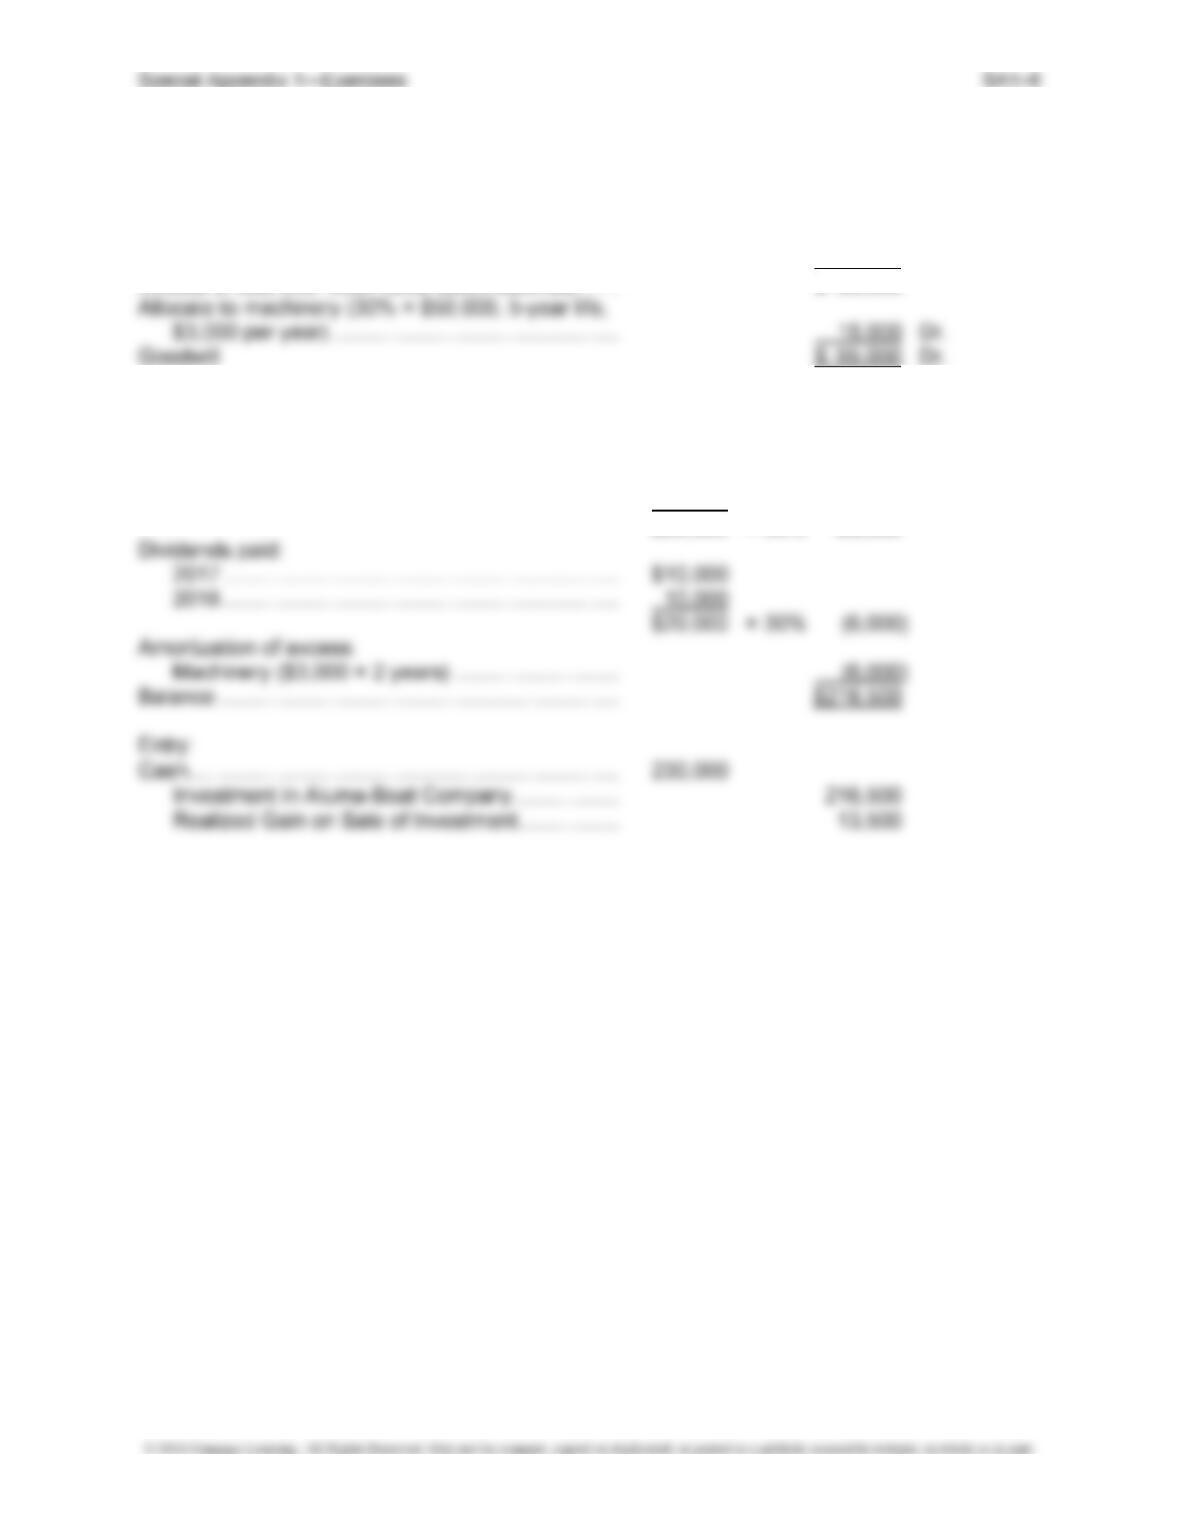
EXERCISE SA1-3
Werl Corporation Income Distribution
Profit in ending inventory Internally generated net
(30% × $30,000) …………………. $9,000 income ………………………….. $90,000
Gain on sale of machine …………… 5,000 Realize 1/5 of machine
Investment in Werl ………………………………………………………………… 21,700
Investment Income …………………………………………………………… 21,700
EXERCISE SA1-4
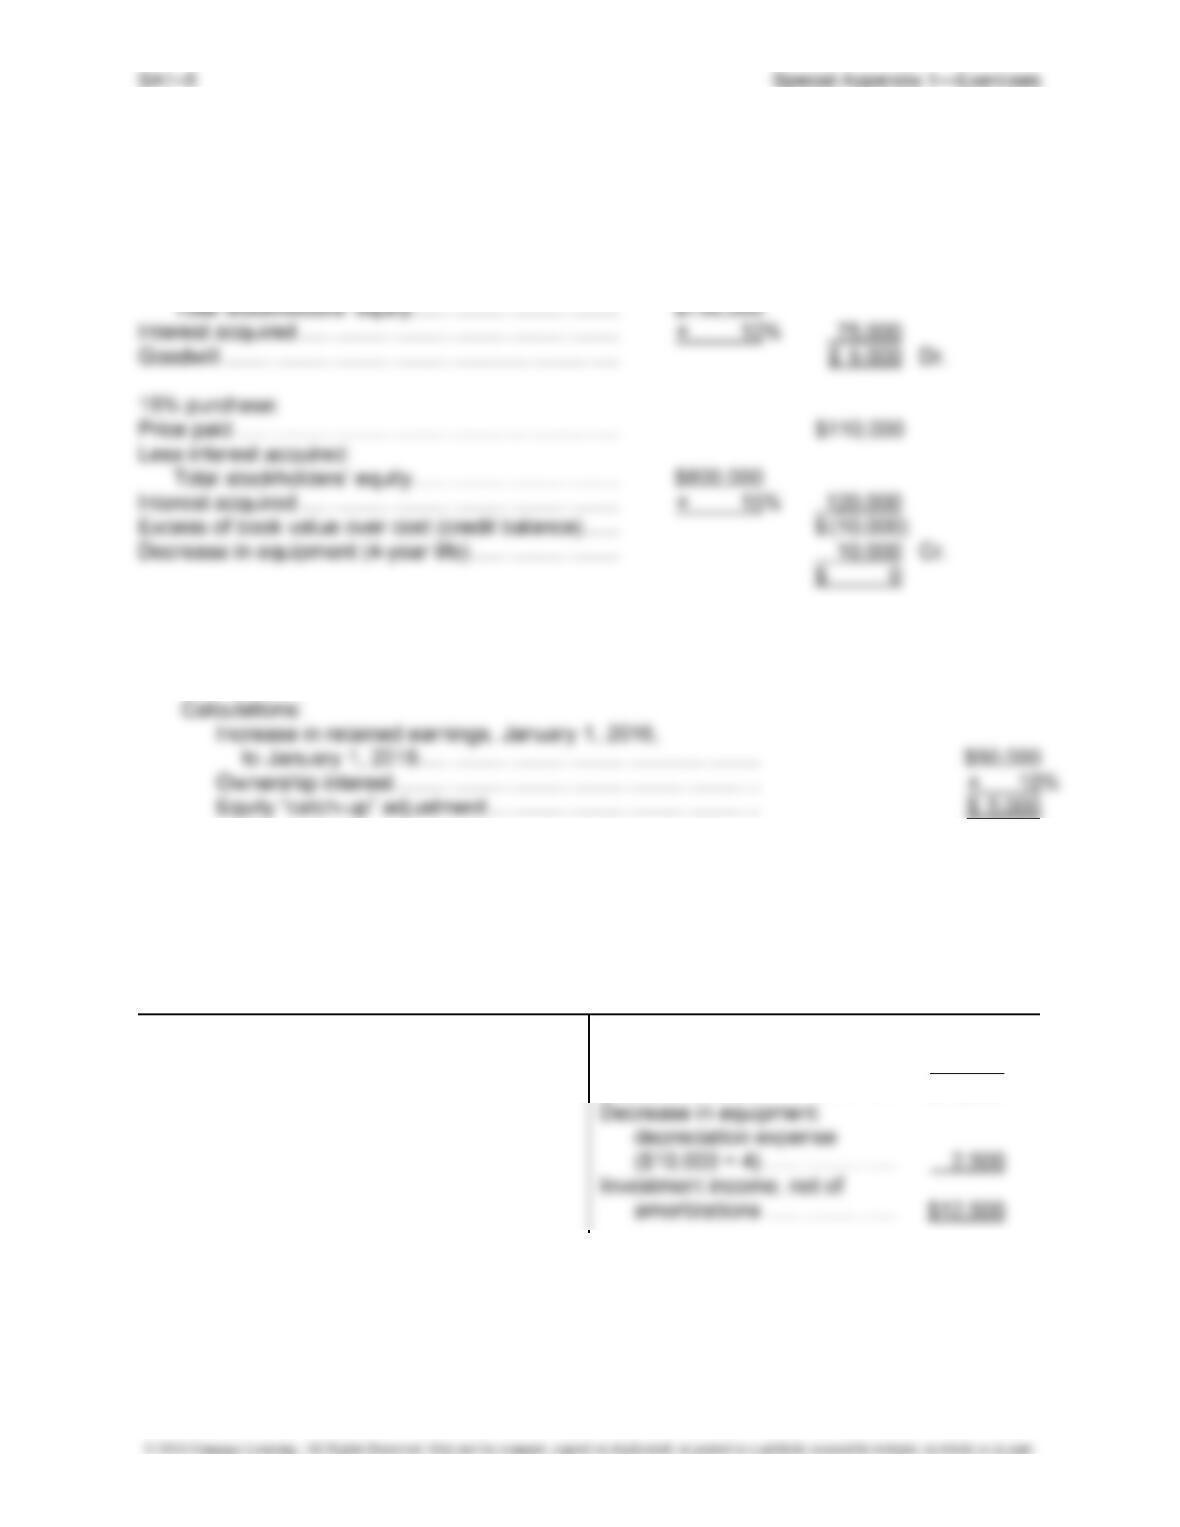
Determination and Distribution of Excess Schedule
10% purchase:
Price paid ……………………………………………………….. $80,000
Less interest acquired:
(1) Investment in Novic ………………………………………………………… 5,000
Retained Earnings …………………………………………………….. 5,000
To record equity “catch-up” entry.
(2) Investment in Novic ………………………………………………………… 10,000
Cash (50,000 shares × 25% × $0.20 per share) …………………. 2,500
Investment Income ……………………………………………………. 12,500
To record net share of subsidiary income and
dividends received.
Novic Company Income Distribution
Reported income …………………. $40,000
Ownership interest ……………….. × 25%
Share of income …………………… $10,000
EXERCISE SA1-5
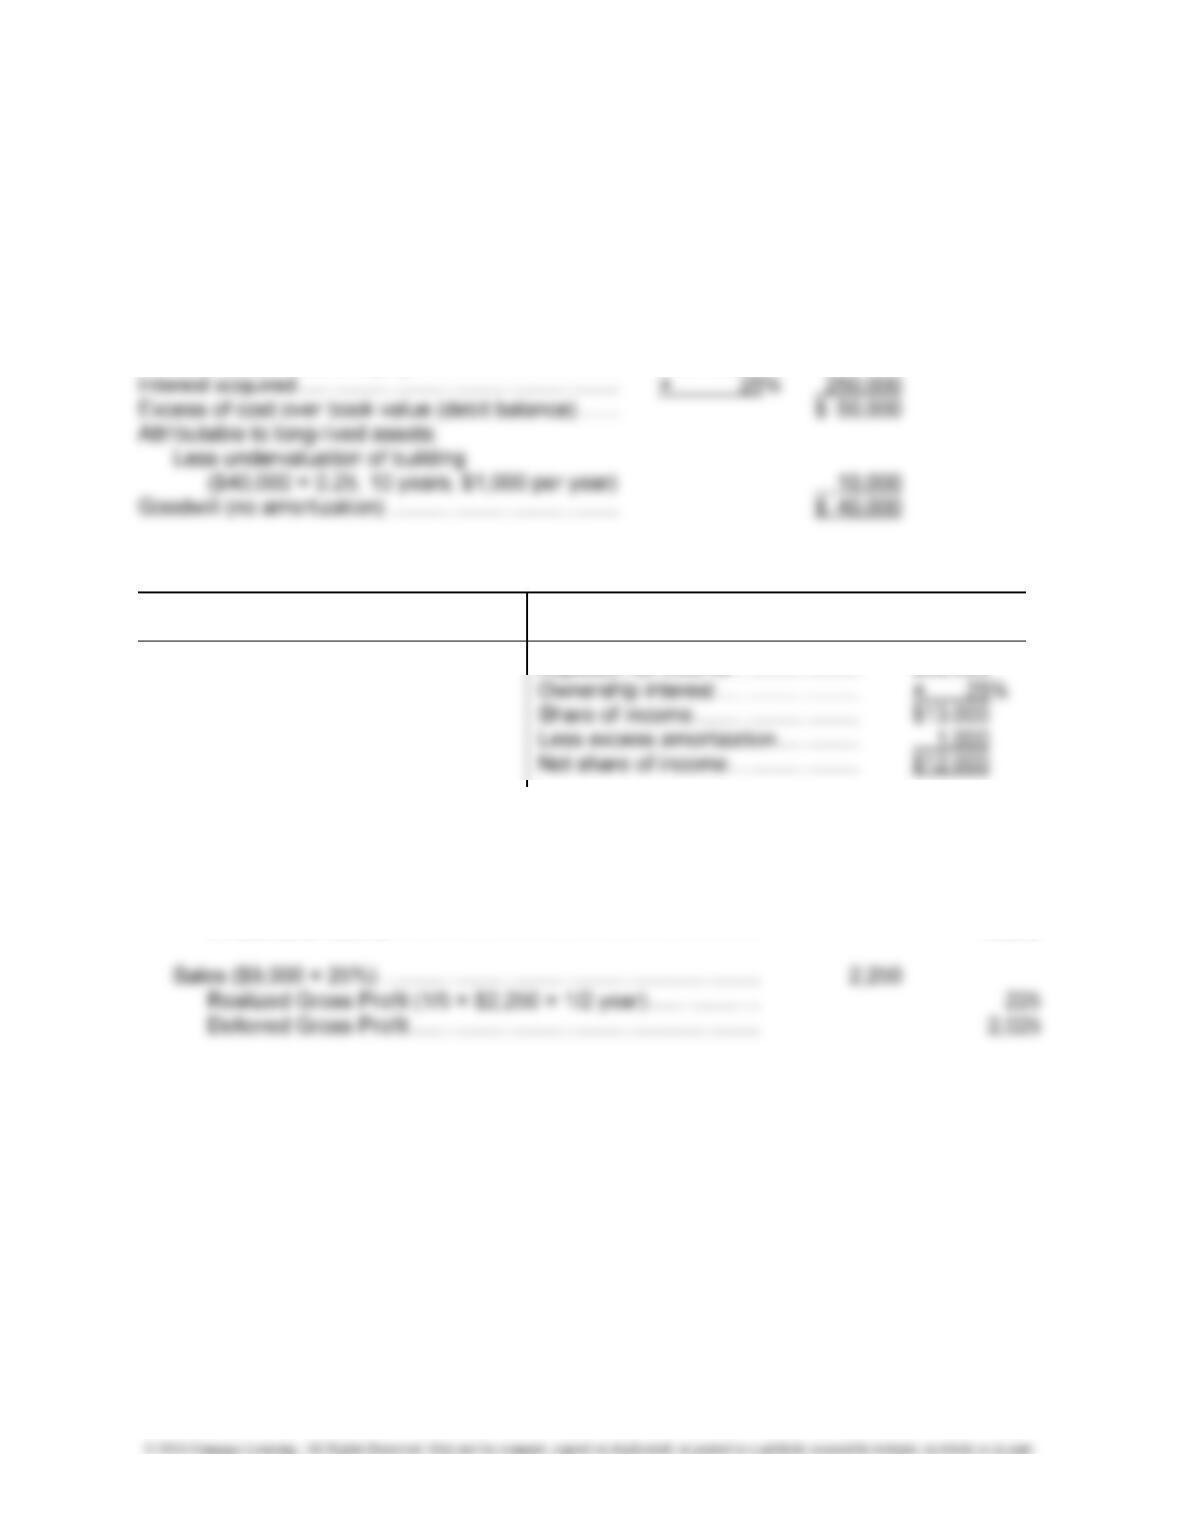
Determination and Distribution of Excess Schedule
Price paid ……………………………………………………….. $200,000
Equity interest purchased (30% × $400,000) ……….. 120,000
Excess of cost over book value (debit balance) ……. $ 80,000
Calculation of investment account balance, January 2, 2019:
Original cost ……………………………………………………. $200,000
Share of income:
2017 …………………………………………………………. $50,000
2018 …………………………………………………………. 45,000
$95,000 × 30% 28,500
SA1–7 Special Appendix 1—Problems
PROBLEMS
PROBLEM SA1-1
Determination and Distribution of Excess Schedule
Price paid for investment in Fowler …………………….. $300,000
Less interest acquired:
Total stockholders’ equity …………………………….. $1,000,000
Fowler Company Income Distribution (2016)
Reported net income ………………… $52,000
Adjusted net income …………………. $52,000
2016 Entries:
Cash ($10,000 × 25%) ……………………………………………………… 2,500
Investment in Fowler ($12,000 – $2,500 dividends) ……………… 9,500
Investment Income ……………………………………………………… 12,000
Problem SA1-1, Concluded
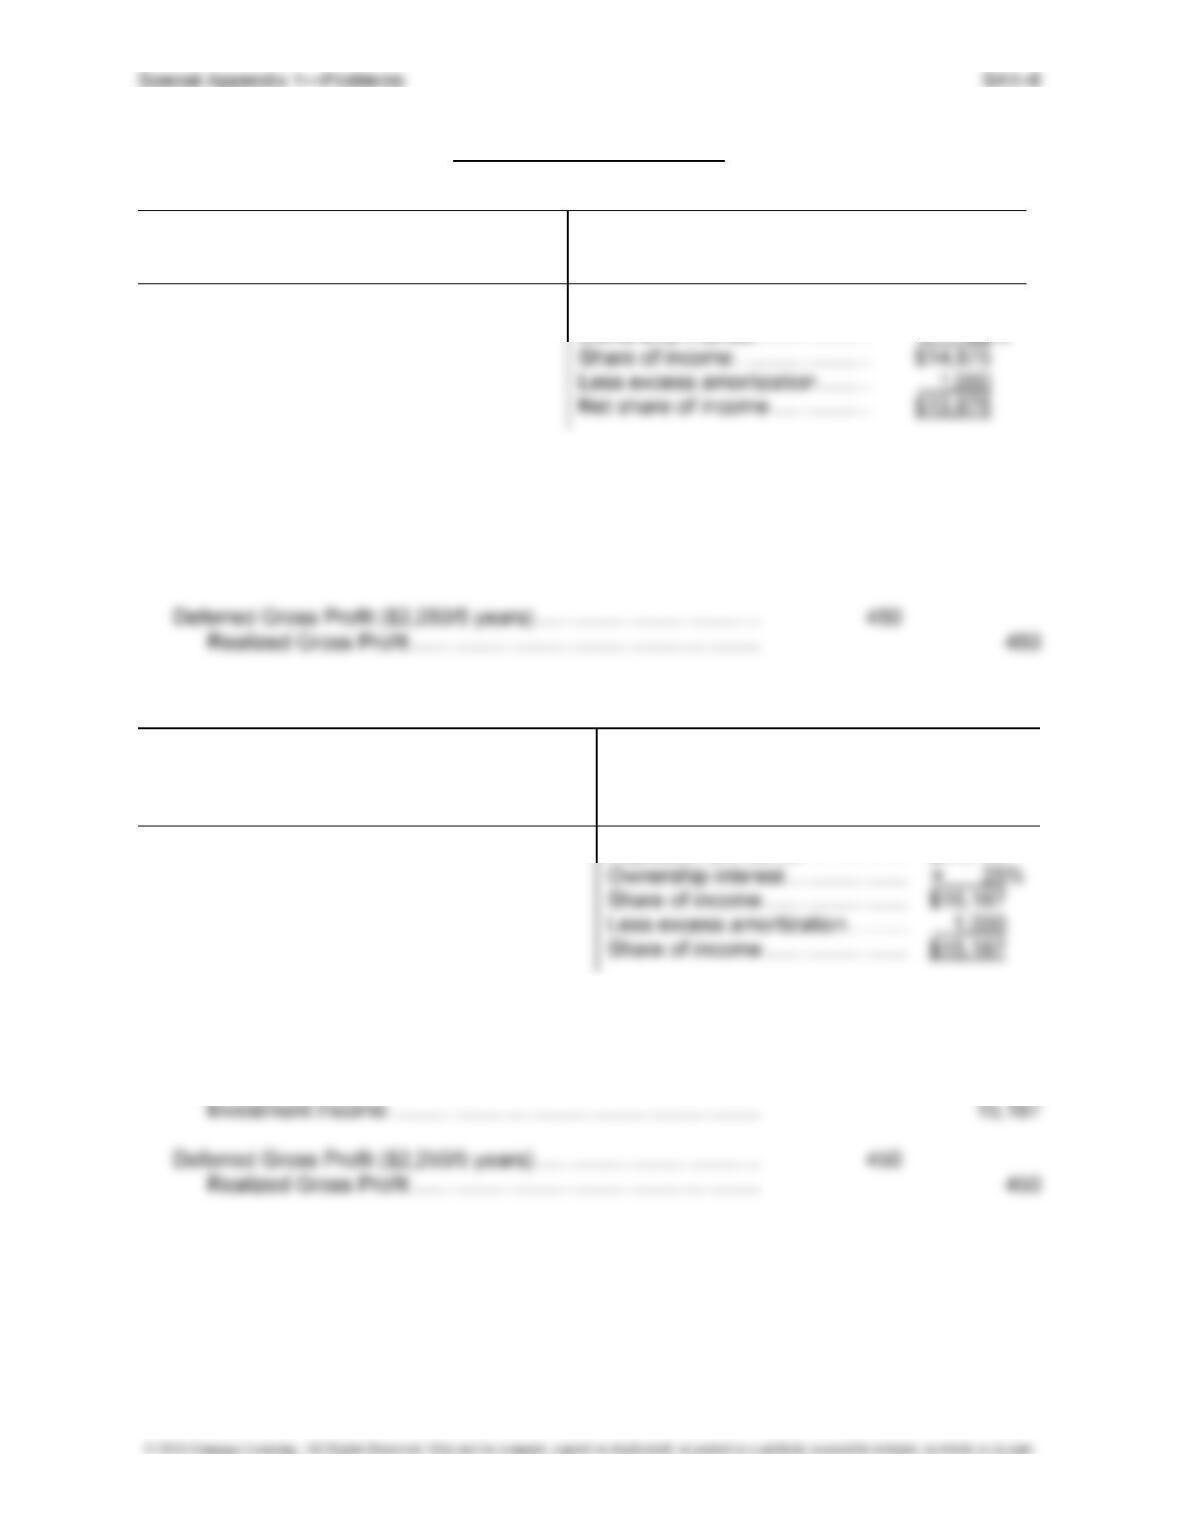
Fowler Company Income Distribution (2017)
Profit in ending inventory Reported net income ……………. $60,000
($2,000 × 25%) …………………… $500
Adjusted net income …………….. $59,500
Ownership interest ………………. × 25%
2017 Entries:
Cash ($10,000 × 25%) ……………………………………………………… 2,500
Investment in Fowler ($13,875 – $2,500 dividends) ……………… 11,375
Investment Income ……………………………………………………… 13,875
Fowler Company Income Distribution (2018)
Profit in ending inventory Reported net income …………….. $65,000
($3,000 × 25%) …………………… $750 Beginning inventory profit
($2,000 × 25%) ……………….. 500
Adjusted net income ……………… $64,750
2018 Entries:
Cash ($10,000 × 25%) ……………………………………………………… 2,500
Investment in Fowler ($15,187 – $2,500 dividends) ……………… 12,687
PROBLEM SA1-2
2016 Entries:
Cash ($10,000 × 25%) ……………………………………………………… 2,500
Investment in Fowler ($360,000 – $300,000) ……………………….. 60,000
Dividend Income ………………………………………………………… 2,500
Unrealized Gain on Investment …………………………………….. 60,000
Investment in Fowler ………………………………………………….. 15,000
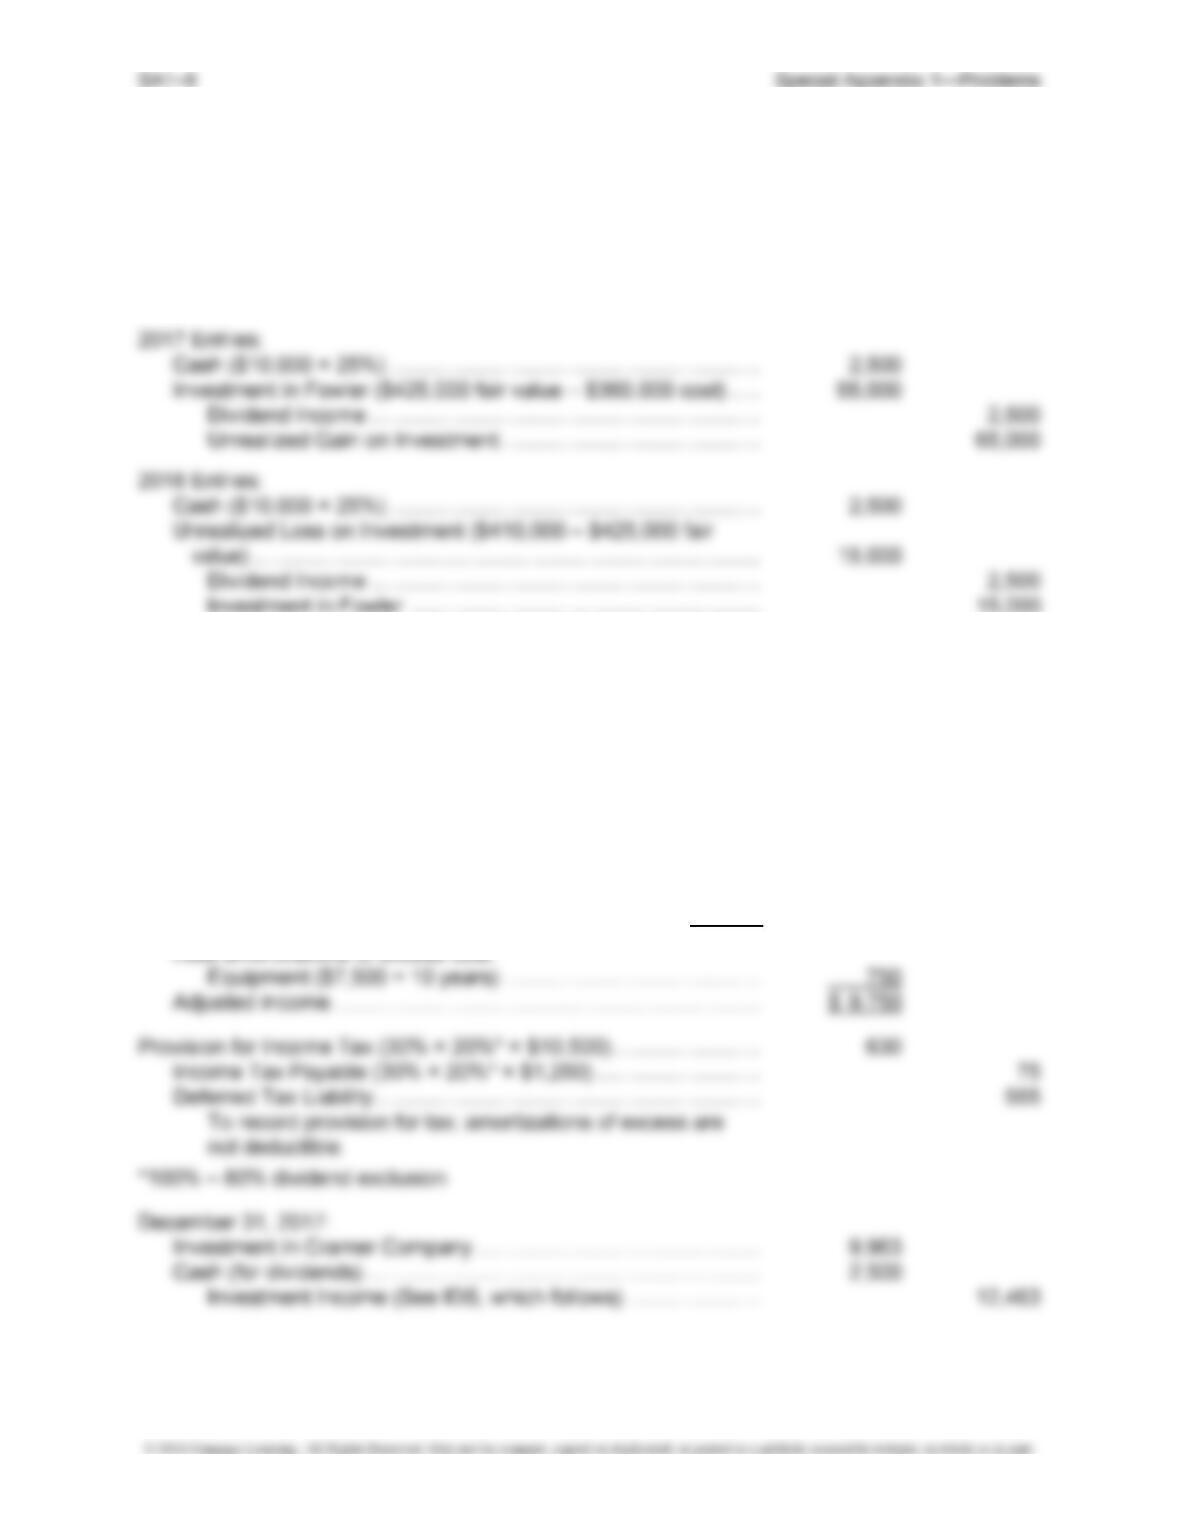
PROBLEM SA1-3
December 31, 2016:
Investment in Cramer Company ………………………………………… 8,500
Cash (for dividends) …………………………………………………………. 1,250
Investment Income ……………………………………………………… 9,750
Reported income of Cramer
($60,000 – $18,000 tax) …………………………. $42,000
Ownership interest ……………………………………… × 25% $10,500
Problem SA1-3, Continued
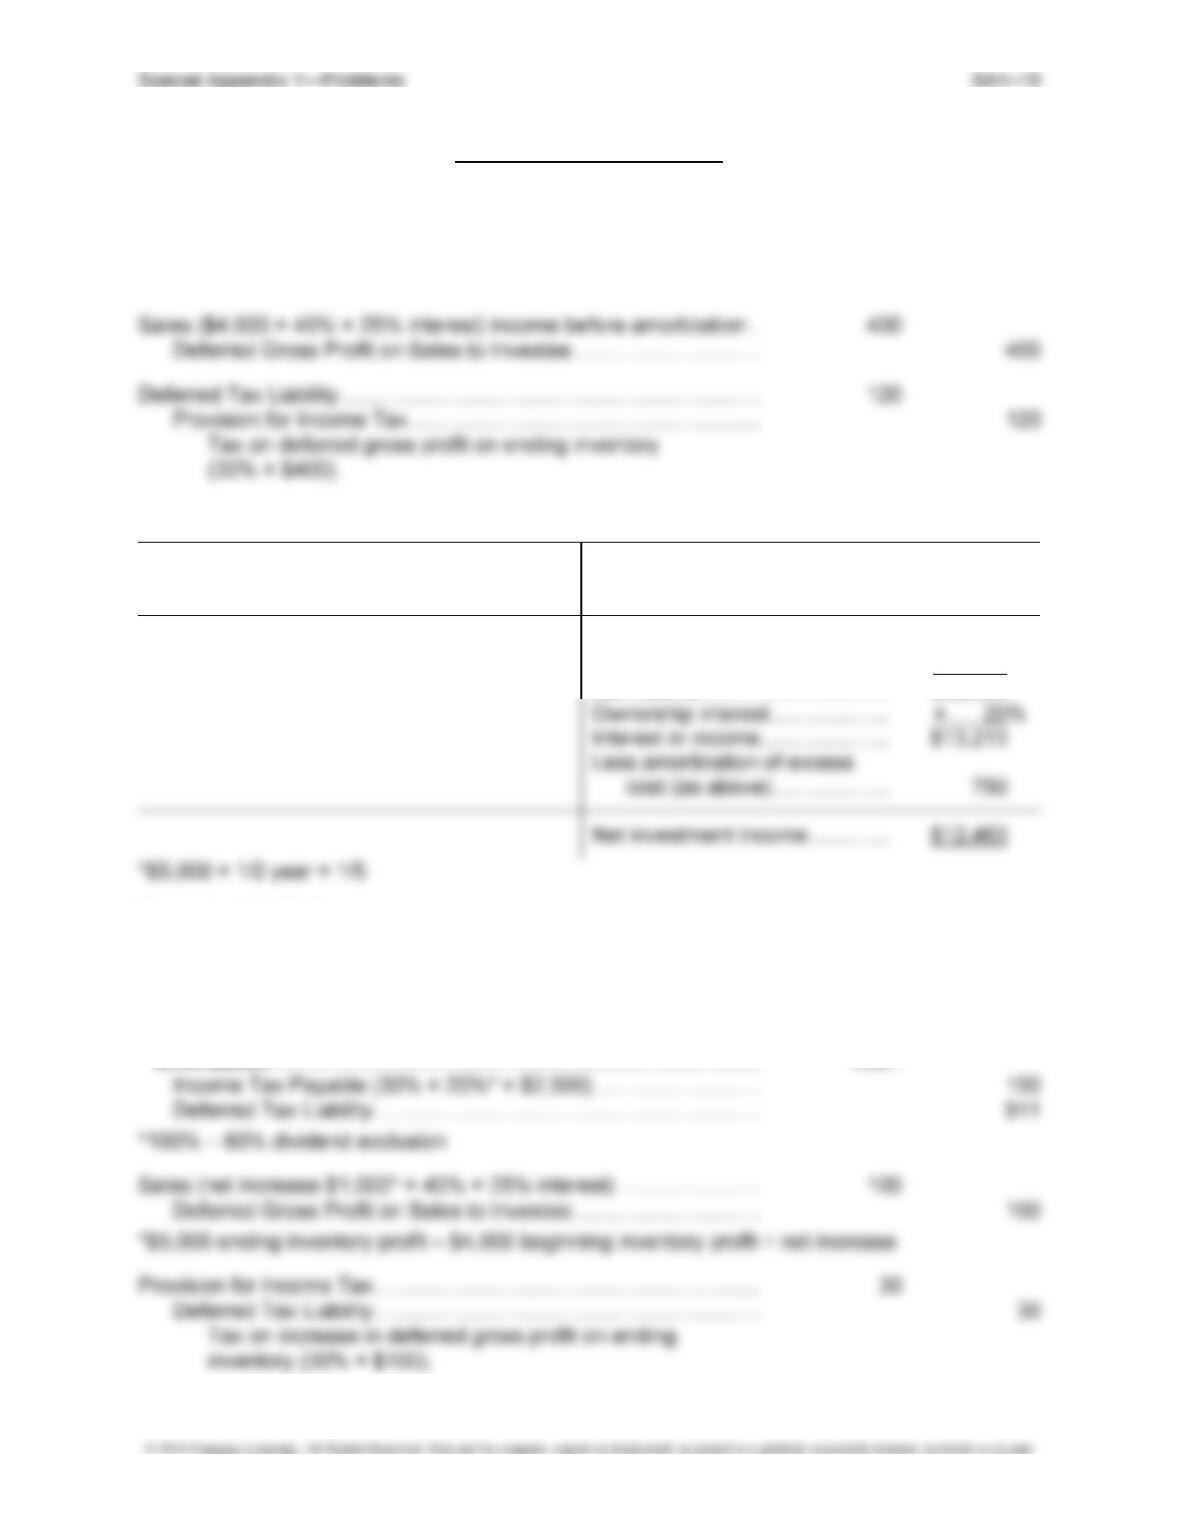
Provision for Income Tax (30% × 20%* × $13,213) ……………………. 793
Income Tax Payable (30% × 20%* × $2,500) ………………………. 150
Deferred Tax Liability ……………………………………………………….. 643
*100% – 80% dividend exclusion
Cramer Company Income Distribution (2017)
Gain on machine sale ………………. $5,000 Reported net income …………….. $80,000
Realized gain on machine* ……. 500
Adjusted income ………………….. $75,500
Income tax (30%) …………………. 22,650
Net income ………………………….. $52,850
December 31, 2018:
Investment in Cramer Company ………………………………………… 14,425
Cash (for dividends) …………………………………………………………. 2,500
Investment Income (See IDS, which follows) ………………….. 16,925
Provision for Income Tax (30% × 20%* × $17,675) income before
SA1–11 Special Appendix 1—Problems
Problem SA1-3, Concluded
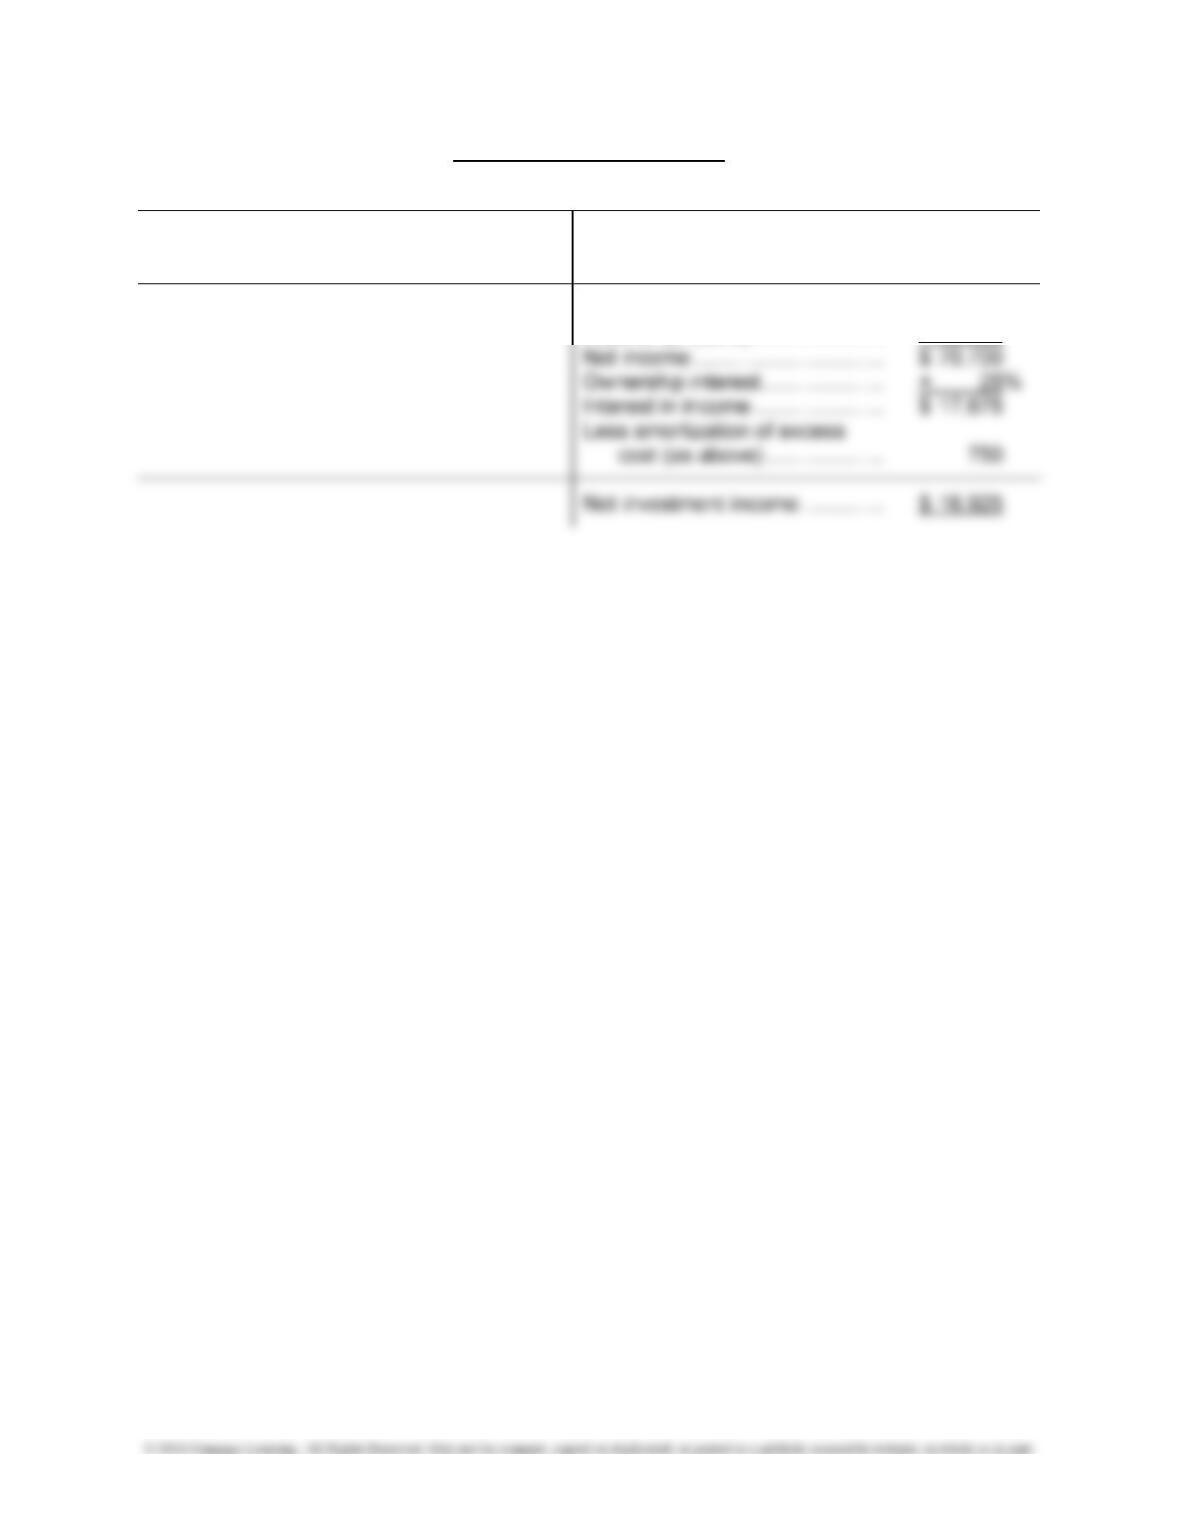
Cramer Company Income Distribution (2018)
Reported net income …………….. $100,000
Realized gain on machine ……… 1,000
Adjusted income …………………… $101,000
Income tax (30%) …………………. 30,300