Import Tariffs and Quotas
Under Imperfect Competition
1. Figure 8-1 shows the Home no-trade equilibrium under perfect competition (with
the price PC
), and under monopoly (with the price PM
). In this question, we compare
the welfare of Home consumers in these two situations.
a. Under perfect competition, with the price PC, label the triangle of consumer
surplus and the triangle of producer surplus. Outline the area of total Home
surplus (the sum of consumer surplus and producer surplus).
b. Under monopoly, with the price PM, label the consumer surplus triangle.
c. Producer surplus is the same as the profits earned by the monopolist. To measure
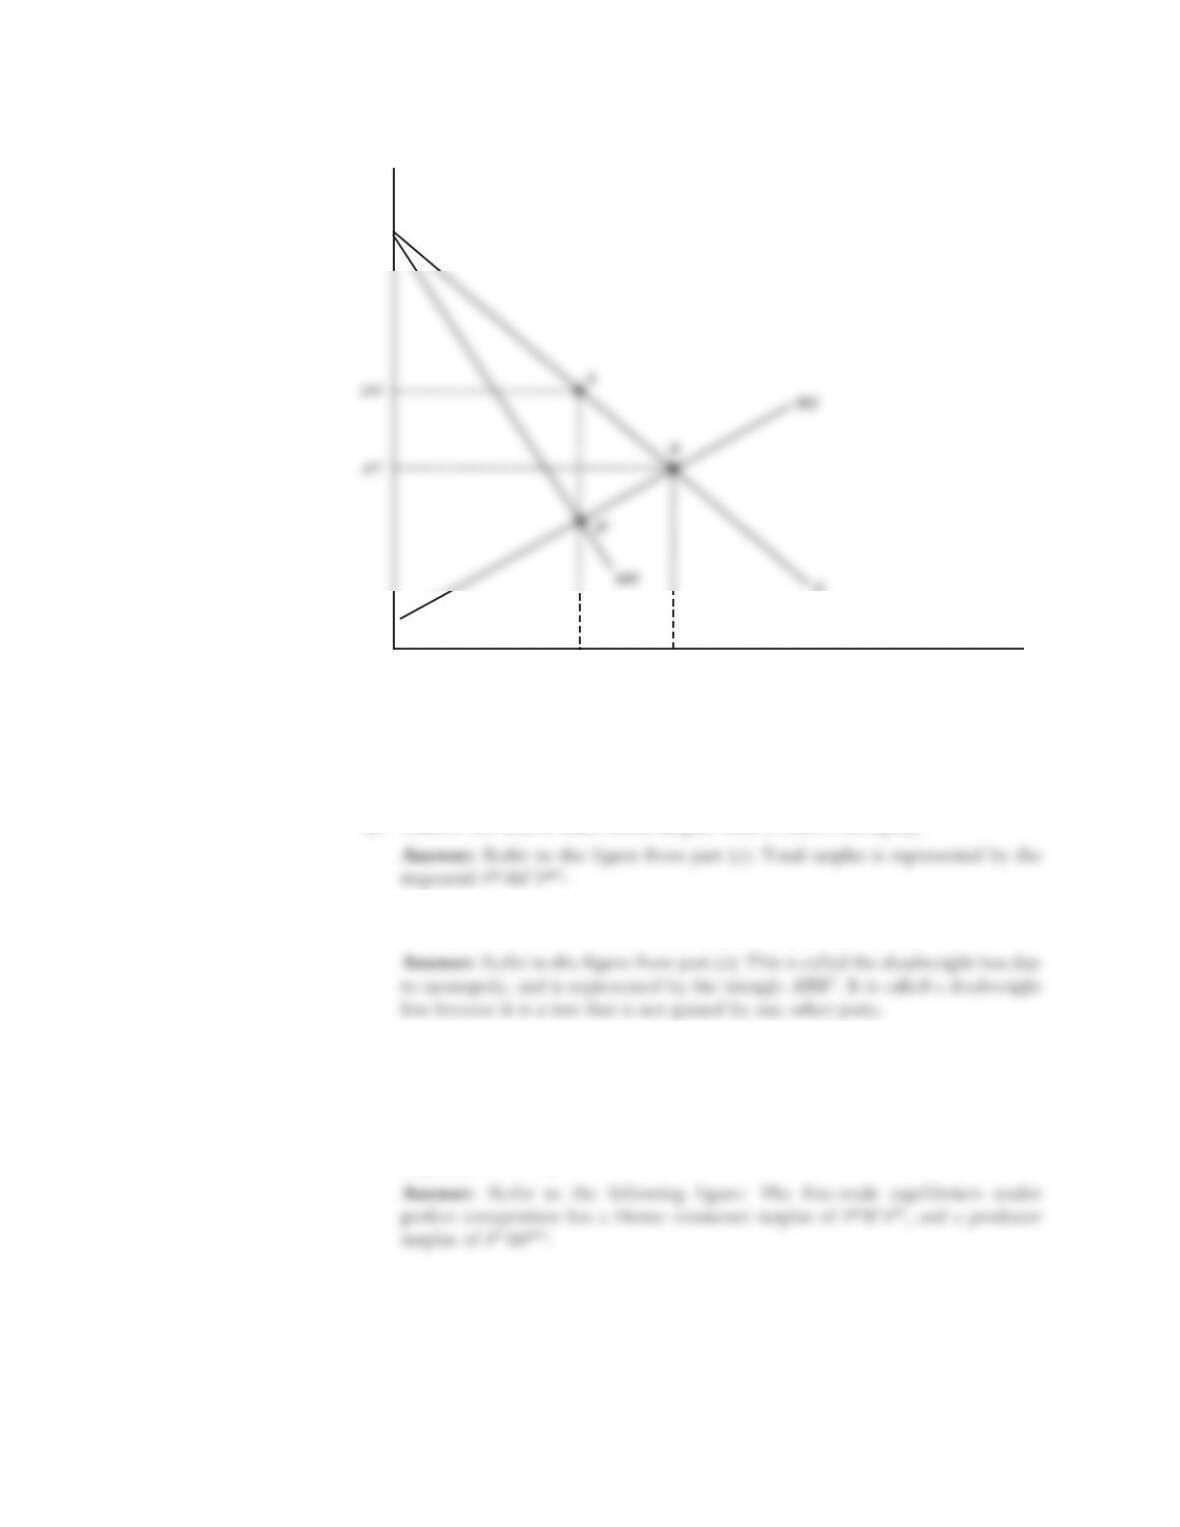
this, label the point in Figure 8-1 where the MR curve intersects MC at point
B 9. For selling the units between zero and QM, marginal costs rise along the MC
curve, up to B 9. The monopolist earns the difference between the price PM and
MC for each unit sold. Label the difference between the price and the MC curve
as producer surplus, or profits.
S-71
8
S-72 Solutions n Chapter 8 Import Tariffs and Quotas Under Imperfect Competition
e. Compare your answer with parts (a) and (d), and outline what is the difference
between these two areas. What is this difference called and why?
2. Figure 8-2 shows the free-trade equilibrium under perfect competition and under
monopoly (both with the price PW
). In this problem, we compare the welfare of
Home consumers in the no-trade situation and under free trade.
a. Under perfect competition, with the price PW, label the triangle of consumer
surplus and the triangle of producer surplus. Outline the area of total Home
surplus (PDB9BPMC).
Price
PD
PMC
QCQuantityQM
MR D
Solutions n Chapter 8 Import Tariffs and Quotas Under Imperfect Competition S-73
b. Based on your answer to part (a) in this problem and part (a) of the last problem,
outline the area of gains from free trade under perfect competition.
c. Under monopoly, still with the price PW, again label the triangle of consumer
surplus and the triangle of producer surplus.
d. Based on your answer to part (c) in this problem and part (d) of the last problem,
outline the area of gains from free trade under Home monopoly.
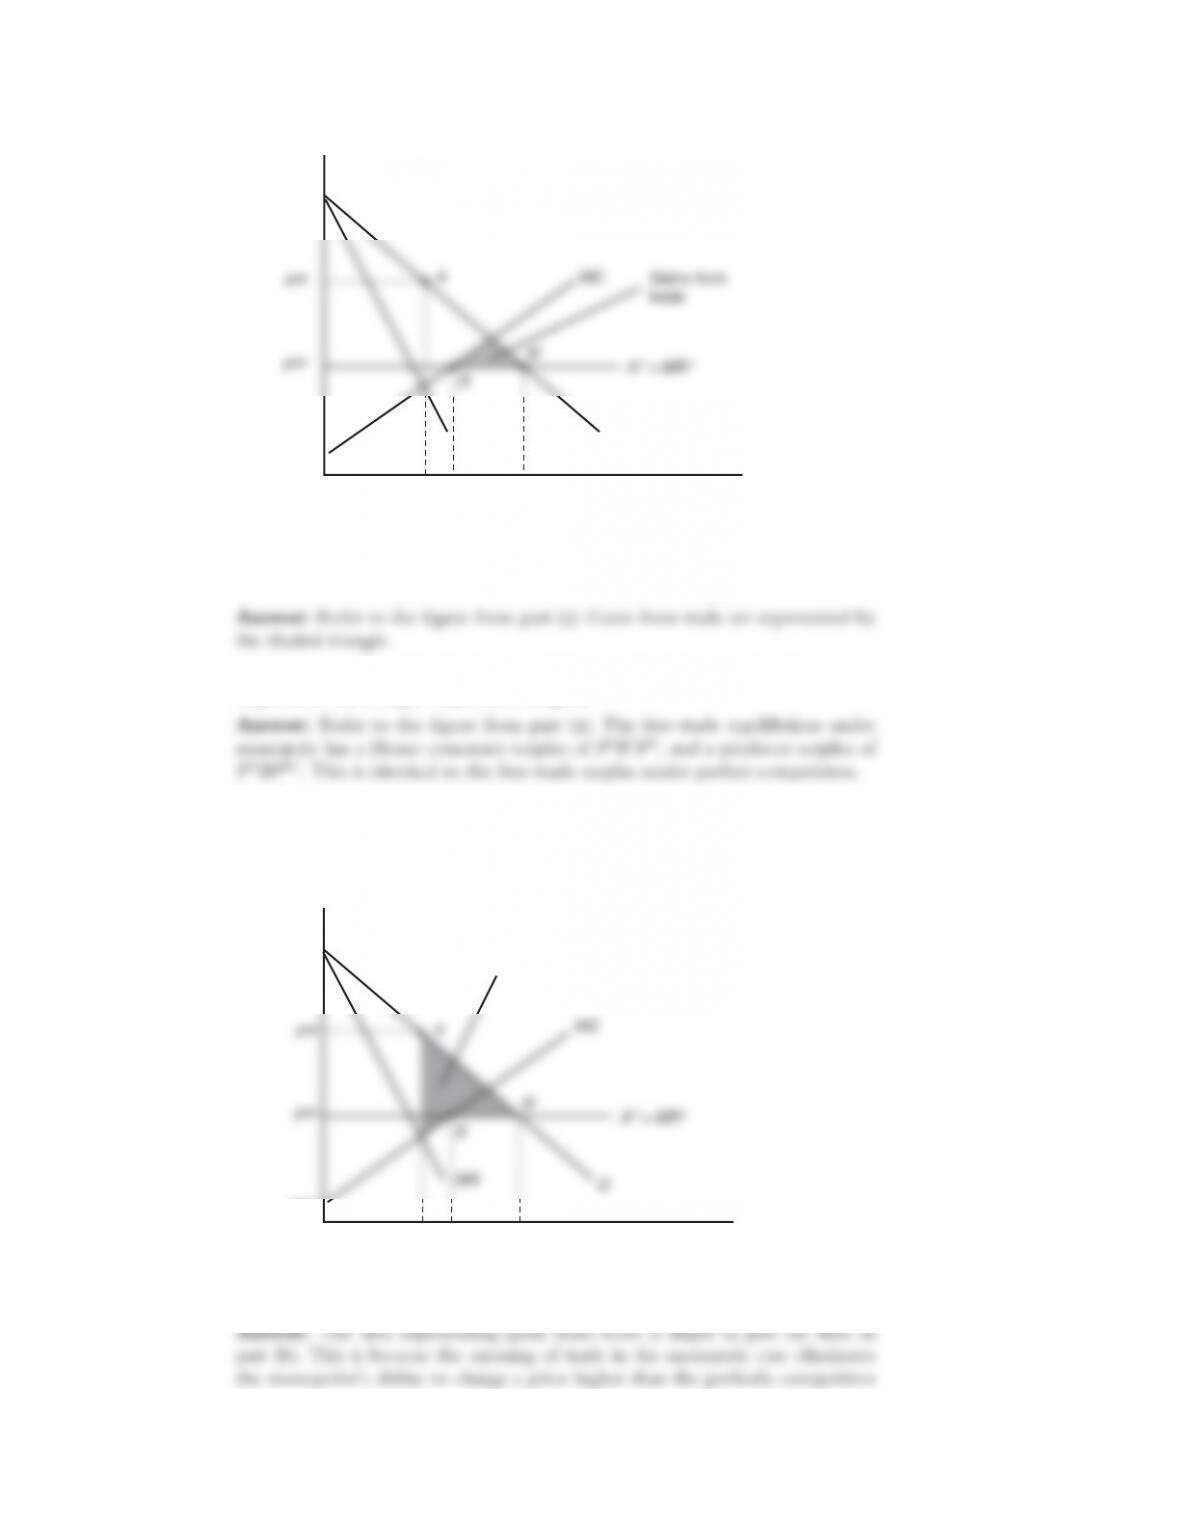
Answer: Refer to the following figure: Gains from trade are represented by the
shaded area.
e. Compare your answer with parts (b) and (d). That is, which area of gains from
trade is higher and why?
Price
Quantity
MR
B
PD
PMC
QMS1D1
D
Price
Gains from
trade
D
MR
B
PD
QMS1D1
PMC
Quantity
3. Rank the following in ascending order of Home welfare and justify your answers. If
two items are equivalent, indicate this accordingly.
a. Tariff t in a small country with perfect competition
b. Tariff t in a small country with a Home monopoly
c. Quota with the same imports M in a small country, with a Home monopoly
d. Tariff t in a country facing a Foreign monopoly
4. Refer to the prices of Japanese automobile imports under the VER (Figure 8-5) and
answer the following:
a. What component of the price of imported automobiles from Japan rose the most
during the period 1980 to 1985?
b. Sketch how Figure 8-5 and 8-6 might have looked if the U.S. had applied a tariff
to Japanese auto imports instead of the VER (with the same level of imports).
In words, discuss how the import prices and U.S. prices might have compared
under a tariff and the VER.
c. Which policy—a tariff or the VER—would have been least costly to U.S.
consumers?
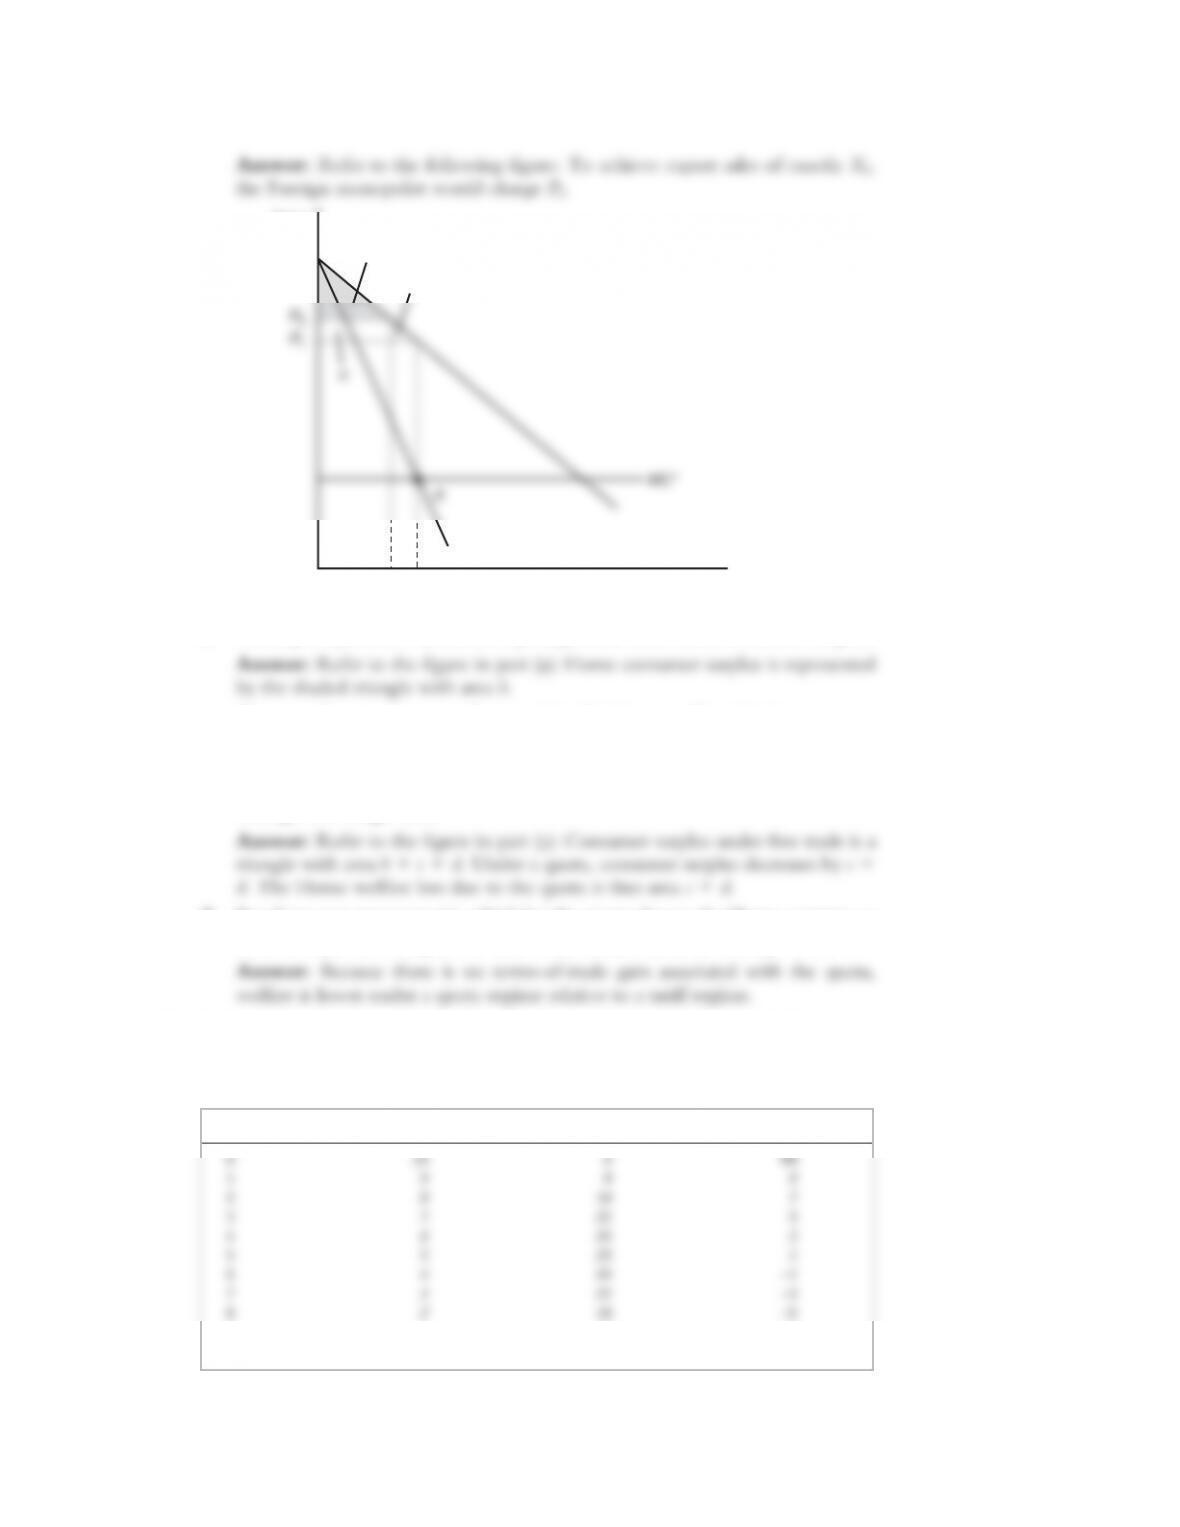
5. In this problem, we analyze the effects of an import quota applied by a country fac-
ing a Foreign monopolist. In Figure 8-7, suppose that the Home country applies an
import quota of X2, meaning that the Foreign firm cannot sell any more than that
amount.
a. To achieve exports sales of X2, what is the highest price that the Foreign firm
can charge?
Solutions n Chapter 8 Import Tariffs and Quotas Under Imperfect Competition S-75
b. At the price you have identified in part (a), what is the Home consumer surplus?
c. Compare the consumer surplus you identified in part (b) with the consumer
surplus under free trade. Therefore, outline in Figure 8-7 the Home losses due
to the quota. Hint: Remember that there is no Home firm, so you do not need
to take into account Home producer surplus or tariff revenue. Assume that quota
rents go to Foreign firms.
d. Based on your answer to (c), which has the greater loss to the Home country—a
tariff or a quota, leading to the same level of sales X2 by the Foreign firm?
6. Suppose that the demand curve for a good is represented by the straight line
P = 10 – Q
Answer: In italics in the following chart.
Price
Foreign Exports
MR
X2X1
d
b
Quantity Price Total Revenue Marginal Revenue
9 1 9 –7
10 0 0 –9
S-76 Solutions n Chapter 8 Import Tariffs and Quotas Under Imperfect Competition
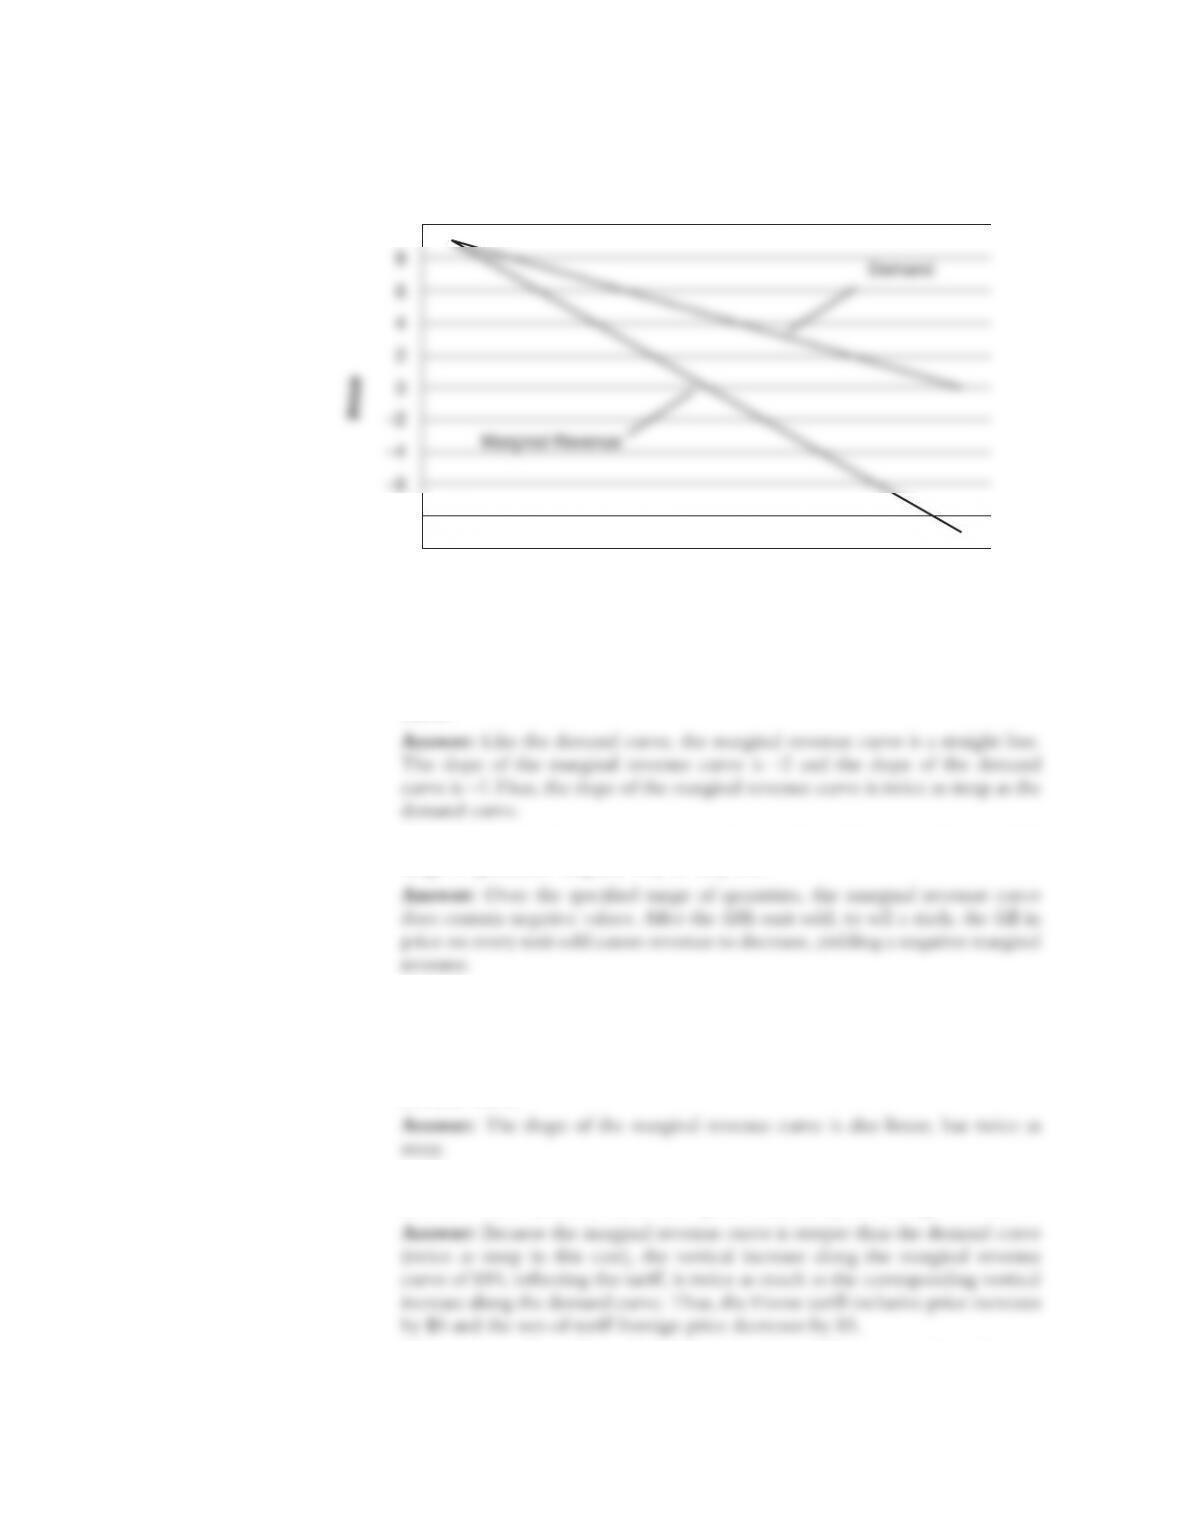
a. Draw a graph containing both the demand curve and marginal revenue curve.
Answer:
b. Is the marginal revenue curve a straight line as well? What is the slope of the
marginal revenue curve? How does that slope compare with that of the demand
c. Does the marginal revenue curve contain negative values over the specified
range of quantities? Explain why or why not.
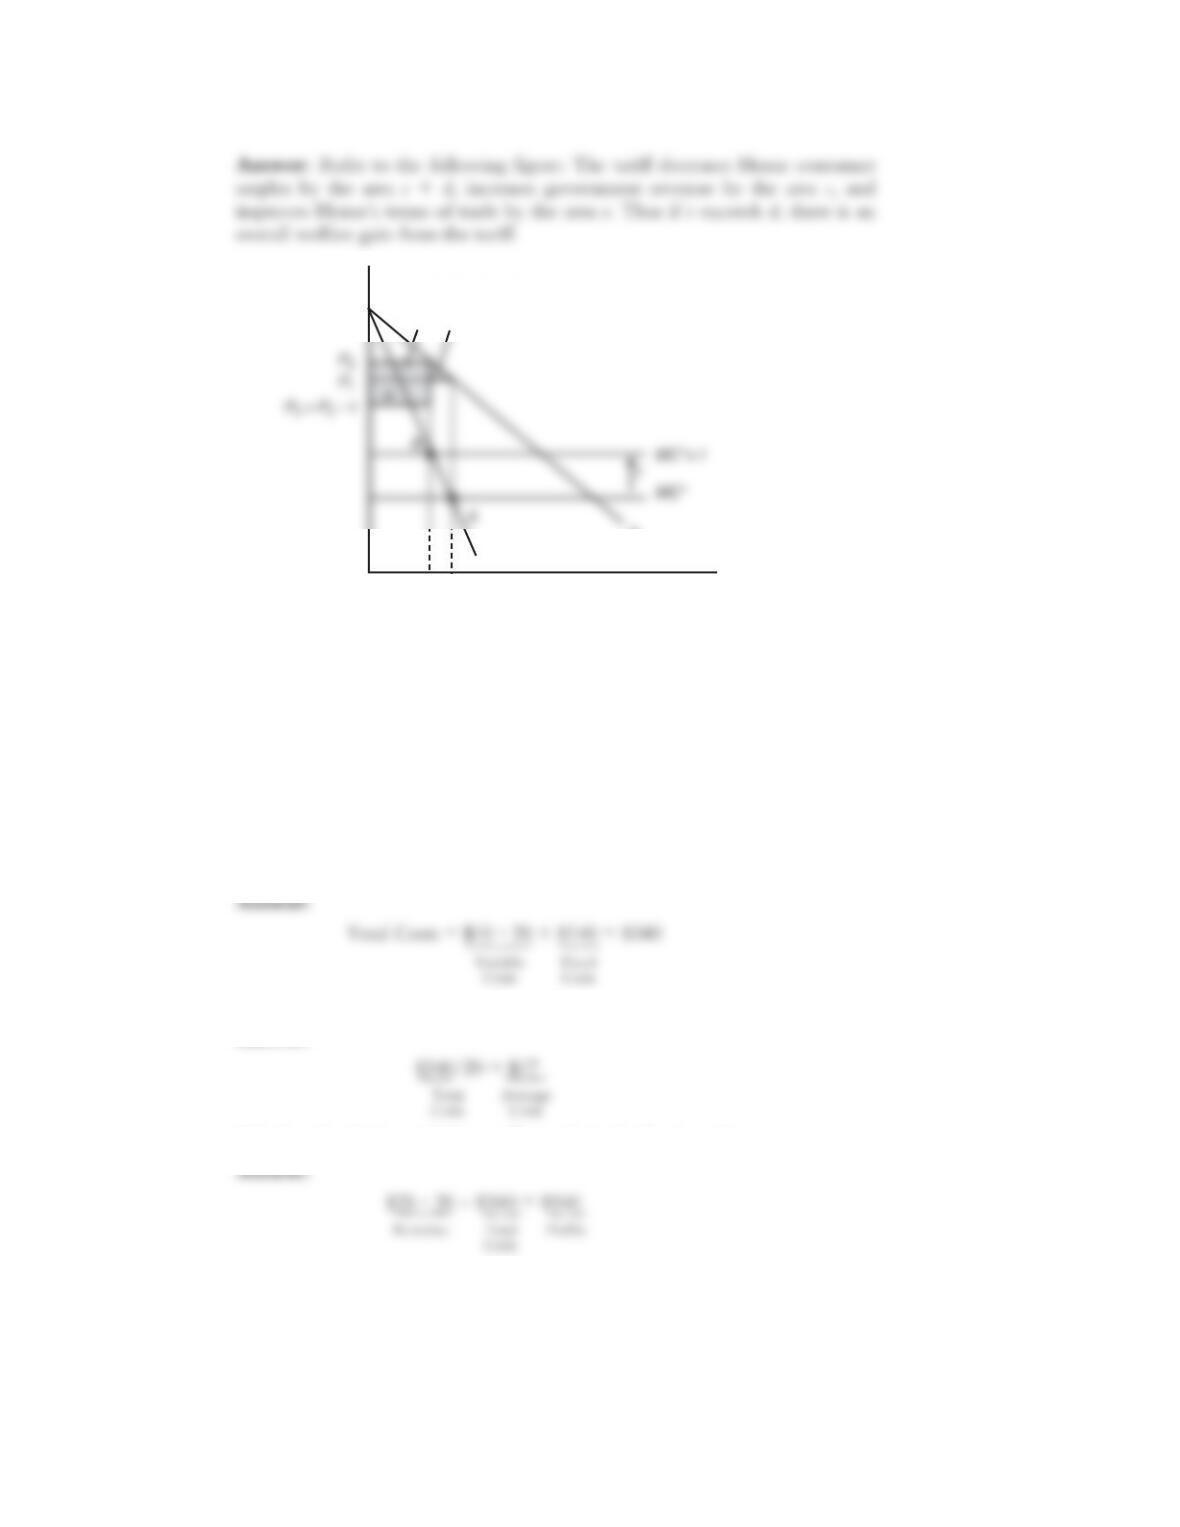
7. Consider the case of a Foreign monopoly with no Home production, shown in
Figure 8-7. Starting from free trade at point A, consider a $10 tariff applied by the
Home government.
a. If the demand curve is linear, as in Problem 6, what is the shape of the marginal
revenue curve?
b. How much does the tariff-inclusive Home price increase because of the tariff,
and how much does the net-of-tariff price received by the Foreign firm fall?
c. Discuss the welfare effects of implementing the tariff. Use a graph to illustrate
under what conditions, if any, there are increases in Home welfare.
Quantity
10
–8
–10
1 2 3 4 5 6 7 8 9 10
Solutions n Chapter 8 Import Tariffs and Quotas Under Imperfect Competition S-77
8. Suppose the Home firm is considering whether to enter the Foreign market. Assume
that the Home firm has the following costs and demand:
Fixed costs = $140
Marginal costs = $10 per unit
Local price = $25
Local quantity = 20
Export price = $15
Export quantity = 10
a. Calculate the firm’s total costs from selling only in the local market.
d. Should the Home firm enter the Foreign market? Briefly explain why.
Answer: The firm should enter the Foreign market because it would be earning
an additional $50. The firm is able to earn the extra profit because the export-
ing price, $15, although lower than the average costs, $17, is higher than the
marginal cost of $10.
Price
Foreign ExportsX2
X1
B
cd
D
MC*+ t
MR
Costs
S-78 Solutions n Chapter 8 Import Tariffs and Quotas Under Imperfect Competition
e. Calculate the firm’s profit from selling to both markets.
f. Is the Home firm dumping? Briefly explain.
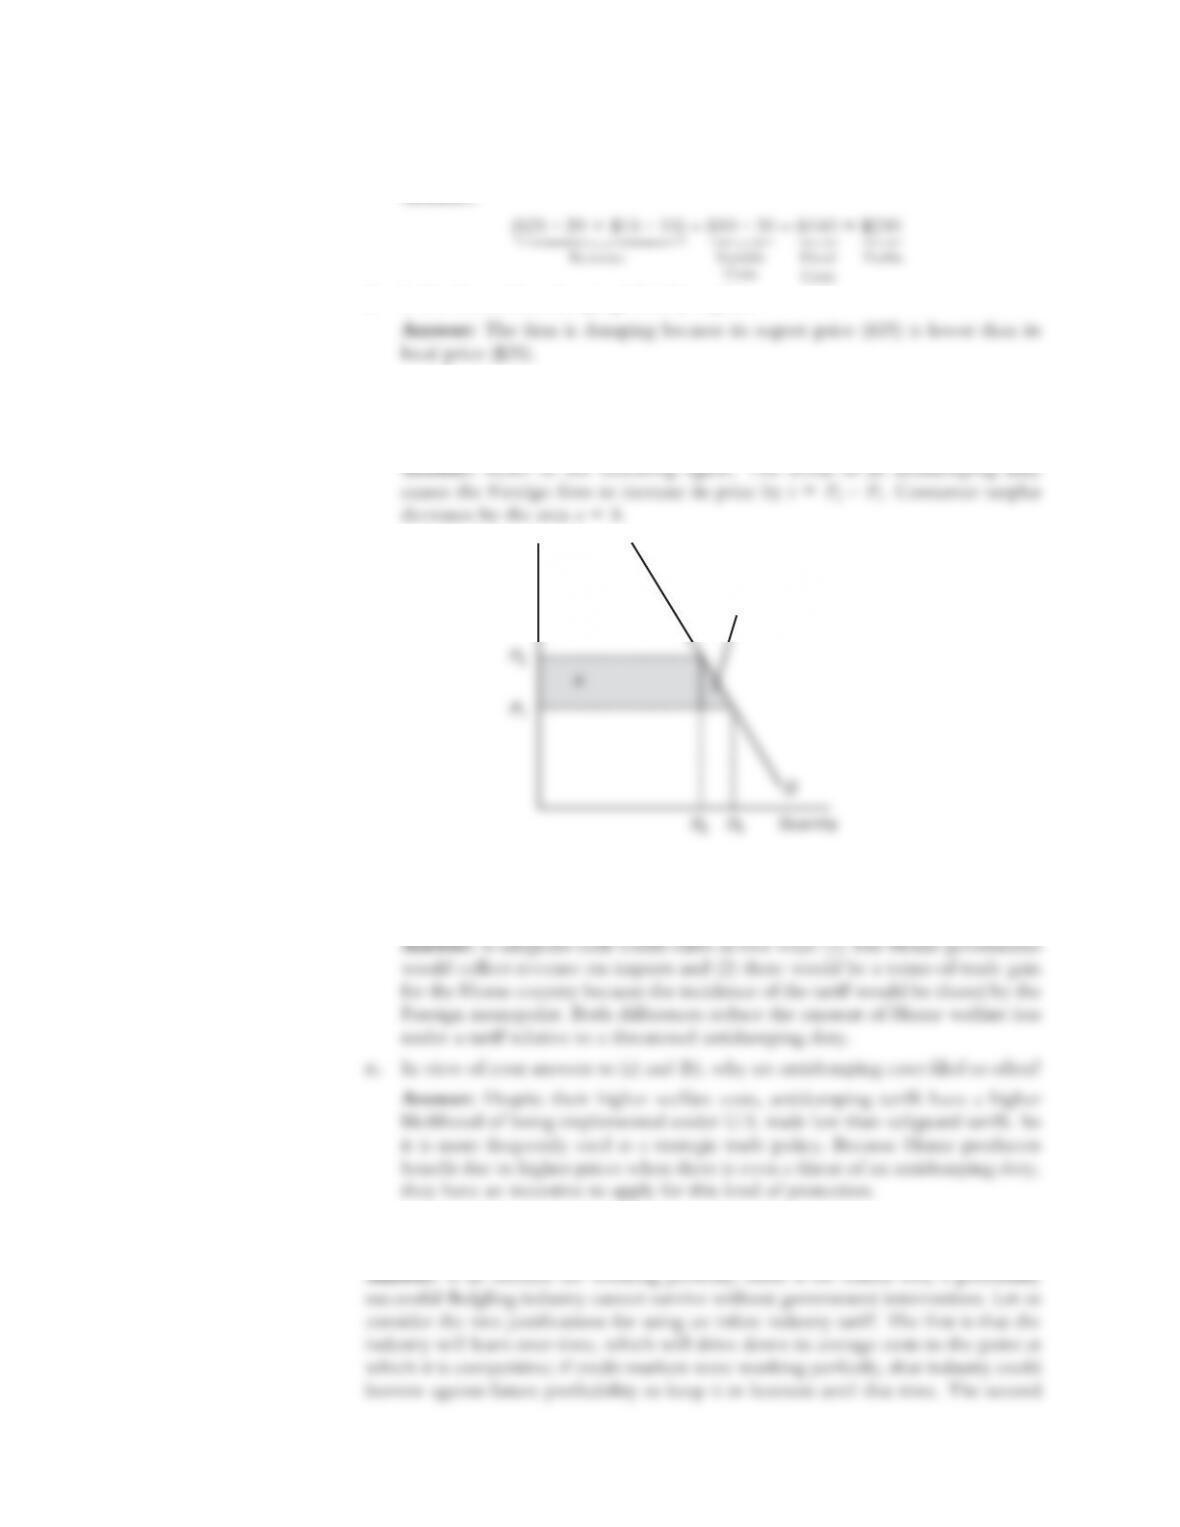
9. Suppose that in response to a threatened antidumping duty of t, the Foreign monopoly
raises its price by the amount t.
a. Illustrate the losses for the Home country.
b. How do these losses compare with the losses from a safeguard tariff of the
amount t, applied by the Home country against the Foreign monopolist?
10. Why is it necessary to use a market failure to justify the use of infant industry protec-
tion?
Price
Quantity
D
b
a
D2
P2
P1
D1
{
Revenue Variable
Costs
{
Fixed
Costs
{
{
Profits
11. What is a positive externality? Explain the argument of knowledge spillovers as a
potential reason for infant industry protection.
12. If infant industry protection is justified, is it better for the Home country to use a
tariff or a quota, and why?
13. Figures A, B, and C are taken from a paper by Chad Bown “The Pattern of Anti-
dumping and Other Types of Contingent Protection” (World Bank, PREM Notes
No. 144, October 21, 2009), and updated from Chad Brown, 2012, “Global Anti-
dumping Database,” available at http://econ.worldbank.org/ttbd/
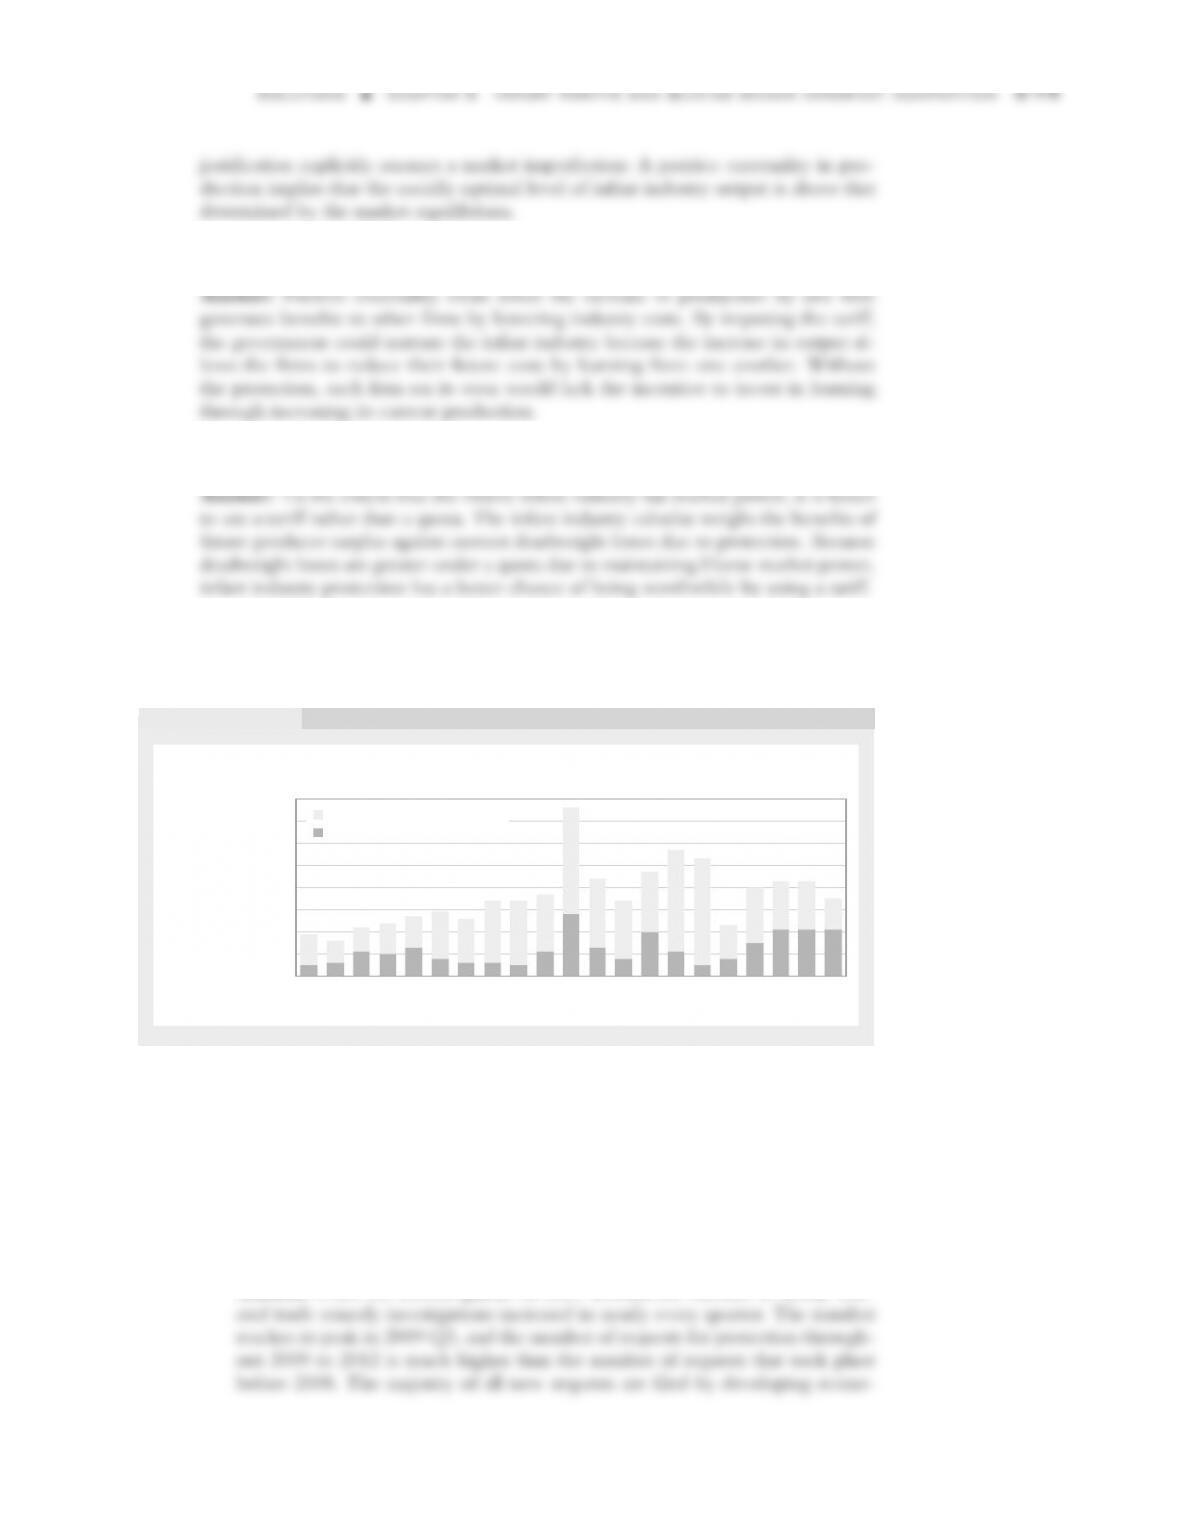
a. Figure A shows the number of newly initiated trade remedy investigations, in-
cluding safeguard (SF), China safeguard (CSF), antidumping (AD), and counter-
vailing duty (CVD) (a countervailing duty is used when foreign firms receive a
subsidy from their government, and then the CVD prevents them from charging
lower prices in the importing country). Each bar shows the number of new cases
in each quarter of the year (Q1, Q2, etc.) for 2007 through Q1 of 2012. The
number of cases is graphed separately for developing countries and developed
countries. What does this graph tell us about what has happened to the number
of such cases since 2007? What might have caused this pattern?
FIGURE A
Number of
investigations
80
70
60
50
40
30
20
10
0
Initiated by developing economies
Initiated by developed economies
Newly Initiated Trade Remedy Investigations, 1Q 2007–1Q 2012
(including all AD, SF, CSF, CVD cases)
1Q–
2007
2Q–
2007
3Q–
2007
4Q–
2007
1Q–
2008
2Q–
2008
3Q–
2008
4Q–
2008
1Q–
2009
2Q–
2009
3Q–
2009
4Q–
2009
1Q–
2010
2Q–
2010
3Q–
2010
4Q–
2010
1Q–
2011
2Q–
2011
3Q–
2011
4Q–
2011
1Q–
2012
S-80 Solutions n Chapter 8 Import Tariffs and Quotas Under Imperfect Competition
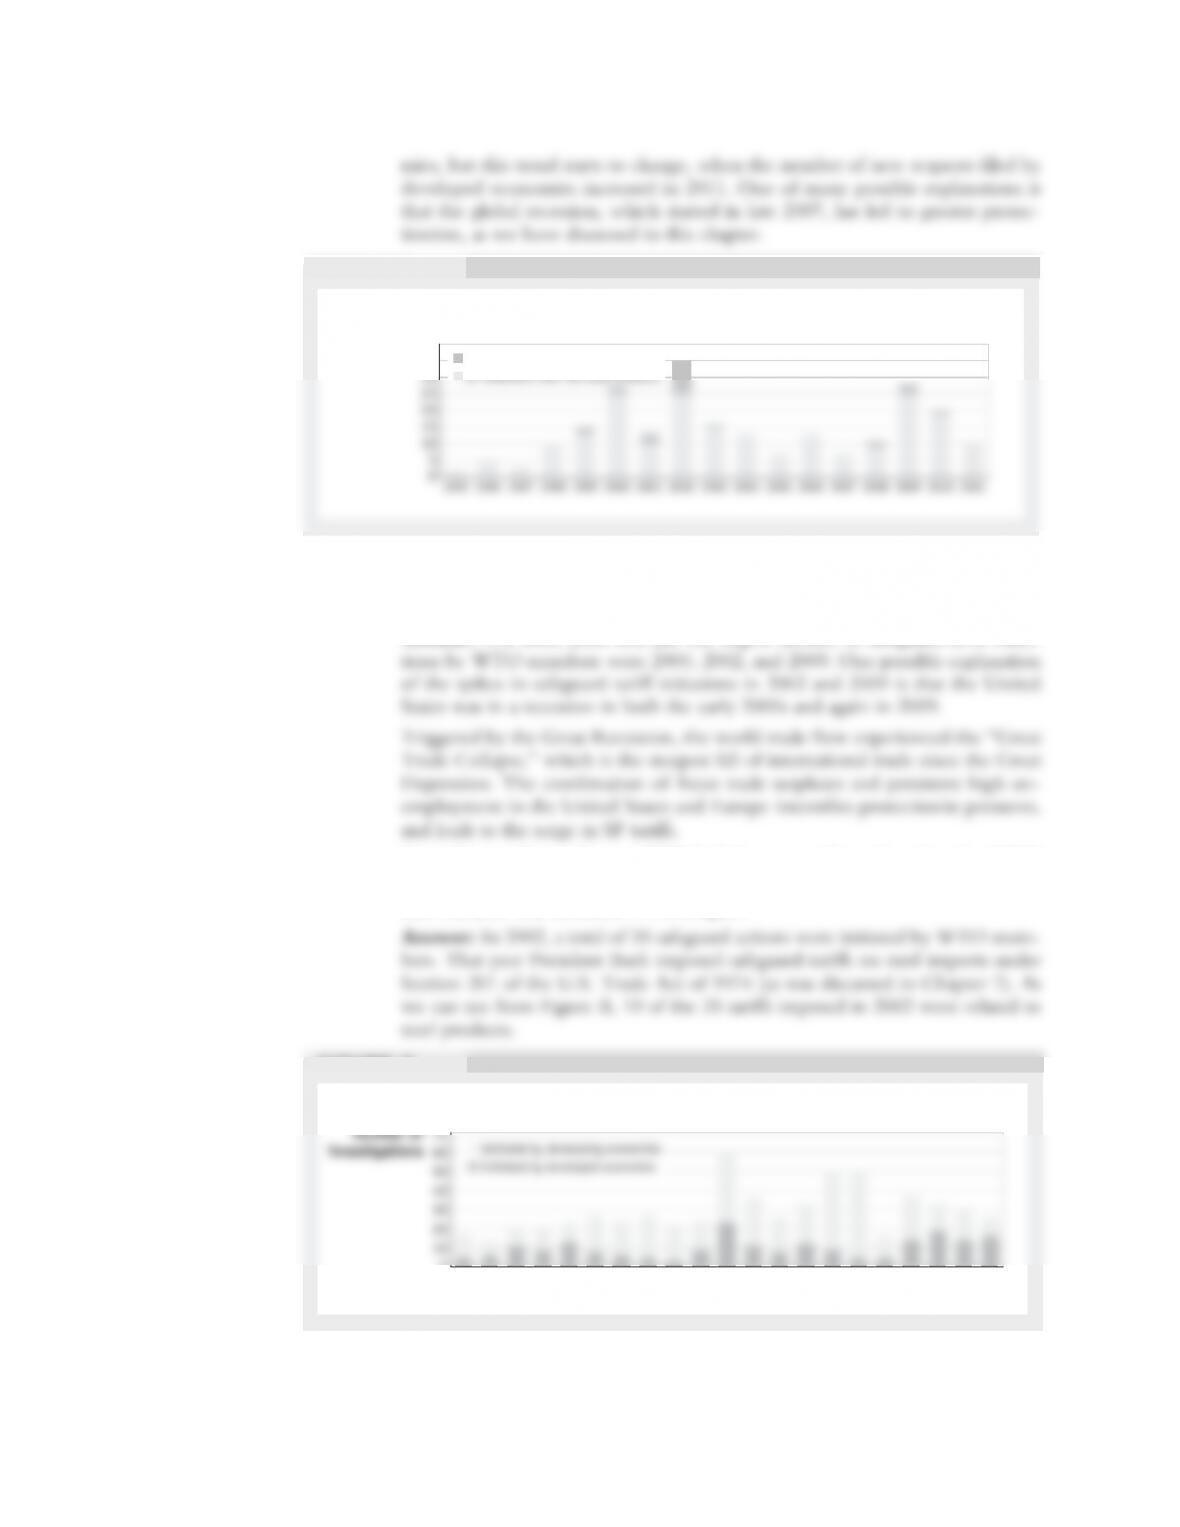
b. Figure B shows the number of safeguard (SF) tariff initiations by WTO members.
Since 1995, what three years saw the largest numbers of safeguards? What might
explain these increases? (Hint: consider the U.S. business cycle over these years.)
c. According to Figure B, year 2002 had the most safeguards actions by WTO
members. How many actions were started that year, and what U.S. safeguard
case that year was discussed in this chapter?
d. Figure C shows the number of newly initiated antidumping (AD) investigations, for
quarters of the year from 2007 through Q1 of 2012. Compare the number of cases
FIGURE B
Number of
initiations
40
35
SF initiations over steel products
Safeguard Initiations by WTO Members, 1995–2011
FIGURE C
0
Newly Initiated Antidumping Investigations, 1Q 2007–1Q 2012
1Q–
2007
3Q–
2007
1Q–
2008
3Q–
2008
1Q–
2009
3Q–
2009
1Q–
2010
3Q–
2010
1Q–
2011
3Q–
2011
1Q–
2012
Solutions n Chapter 8 Import Tariffs and Quotas Under Imperfect Competition S-81
in this graph with Figure A, which included safeguard (SF), China safeguard (CSF),
antidumping (AD), and countervailing duty (CVD). What can you conclude about
the total number of SF, CSF, and CVD cases as compared to the number of AD
cases?