
Increasing Returns to Scale
and Monopolistic Competition
1. Explain how increasing returns to scale in production can be a basis for trade.
2. Why is trade within a country greater than trade between countries?
3. Starting from the long-run equilibrium without trade in the monopolistic compe-
tition model, as illustrated in Figure 6-5, consider what happens when the Home
country begins trading with two other identical countries. Because the countries are
all the same, the number of consumers in the world is three times larger than in a
single country, and the number of firms in the world is three times larger than in a
single country.
a. Compared with the no-trade equilibrium, how much does industry demand D
increase? How much does the number of firms (or product varieties) increase?
Does the demand curve D /N
A still apply after the opening of trade? Explain why
or why not.
b. Does the d1 curve shift or pivot due to the opening of trade? Explain why or
S-53
6
c. Compare your answer to (b) with the case in which Home trades with only one
other identical country. Specifically, compare the elasticity of the demand curve
d. Illustrate the long-run equilibrium with trade and compare it with the long-run
equilibrium when Home trades with only one other identical country.
4. Starting from the long-run trade equilibrium in the monopolistic competition
model, as illustrated in Figure 6-7, consider what happens when industry demand
D increases. For instance, suppose that this is the market for cars and lower gasoline
prices generate higher demand D.
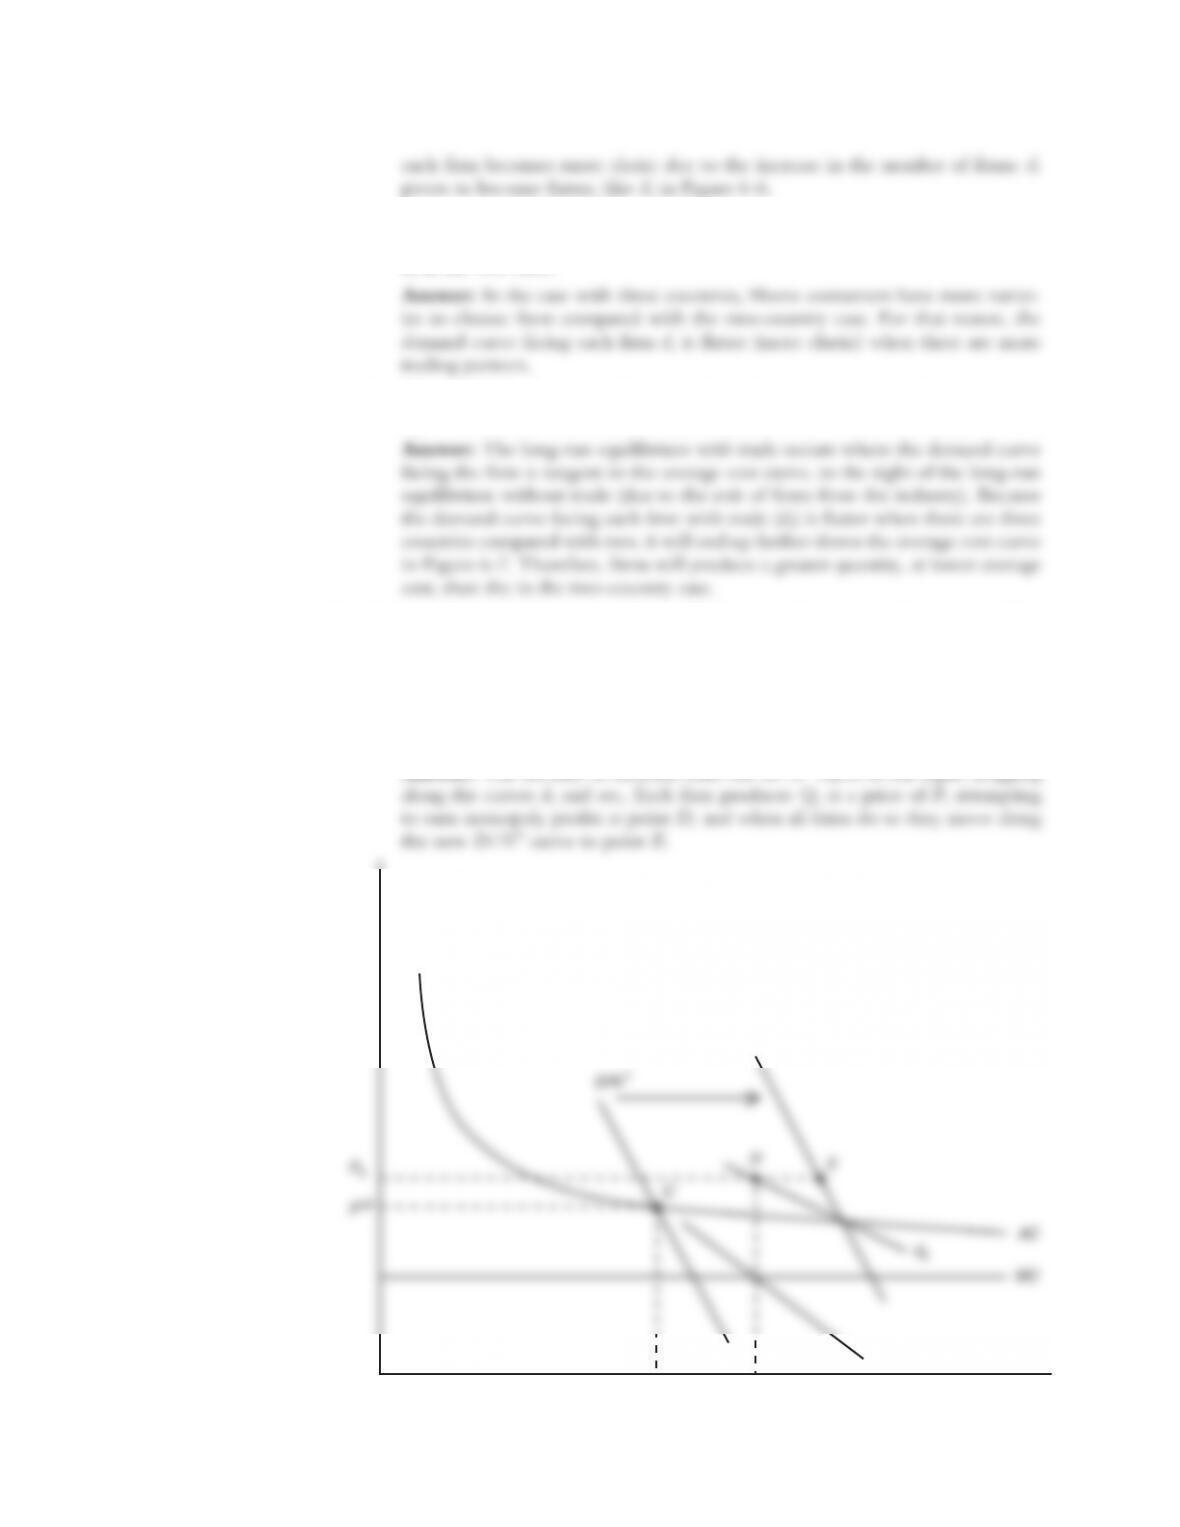
a. Redraw Figure 6-7 for the Home market and show the shift in the D /N
T curve
and the new short-run equilibrium.
T curve to the right, dragging
the new D /N
S-54 Solutions n Chapter 6 Increasing Returns to Scale and Monopolistic Competition
Quantity
Price
MC
AC
mr4
d4
P4
D/N T
Q4
Q3
PW
C
E
D

b. From the new short-run equilibrium, is there exit or entry of firms, and why?
price exceeds average cost. As a result, firms enter the industry and N
c. Describe where the new long-run equilibrium occurs, and explain what has hap-
pened to the number of firms and the prices they charge.
T and d4 to the left
5. Our derivation of the gravity equation from the monopolistic competition model
used the following logic:
(i) Each country produces many products.
(ii) Each country demands all of the products that every other country produces.
(iii) Thus, large countries demand more imports from other countries.
The gravity equation relationship does not hold in the Heckscher-Ohlin model.
Explain how the logic of the gravity equation breaks down in the Heckscher-Ohlin
model: that is, which of the statements just listed is no longer true in the Heckscher-
Ohlin model?
6. The United States, France, and Italy are among the world’s largest producers. To
answer the following questions, assume that their markets are monopolistically com-
petitive, and use the gravity equation with B 5 93 and n 5 1.25.
a. Using the gravity equation, compare the expected level of trade between the
b. The distance between Paris and Rome is 694 miles. Would you expect more
French trade with Italy or with the United States? Explain what variable (i.e.,
Solutions n Chapter 6 Increasing Returns to Scale and Monopolistic Competition S-55
GDP in 2012 ($bn) Distance from the United States (miles)
France $ 2,776 5,544
Italy 2,196 6,229
United States 14,991 —
7. What evidence is there that Canada is better off under the free-trade agreement with
the United States?
8. In the section “Gains and Adjustment Costs for the United States under NAFTA,”
we calculated the lost wages of workers displaced due to NAFTA. Prior experience
in the manufacturing sector shows that about two-thirds of these workers obtain new
jobs within three years. One way to think about that re-employment process is that
one-third of workers find jobs in the first year, and another one-third of remain-
ing unemployed workers find a job each subsequent year. Using this approach, in
the table that follows, we show that one-third of workers get a job in the first year
(column 2), leaving two-thirds of workers unemployed (column 4). In the second
year, another (1/3) ? (2/3) 5 2/9 of workers get a job (column 2), so that 1/3 1
2/9 5 5/9 of the workers are employed (column 3). That leaves 1 – 5/9 = 4/9 of
the workers unemployed (column 4) at the end of the second year.
a. Fill in two more rows of the table using the same approach as for the first two
rows.
Answer:
b. Notice that the fraction of workers finding a job each year (column 2) has the
formula:
Fraction Finding Job 5 1
}
3 ? 12
}
32Year–1
S-56 Solutions n Chapter 6 Increasing Returns to Scale and Monopolistic Competition
Fraction Total Fraction Total Fraction
Year Finding Job Employed Unemployed
1 1/3 1/3 1 – 1/3 5 2/3
2 1/3 ? 2/3 5 2/9 1/3 1 2/9 5 5/9 1 – 5/9 5 4/9
3 1/3 ? 4/9 5 4/27
4
5
6 1/3(2/3)Year–1
4 1/3 ? 8/27 5 8/81 19/27 1 8/81 5 65/81 1 – 65/81 5 16/81
5
6 1/3(2/3)Year–1
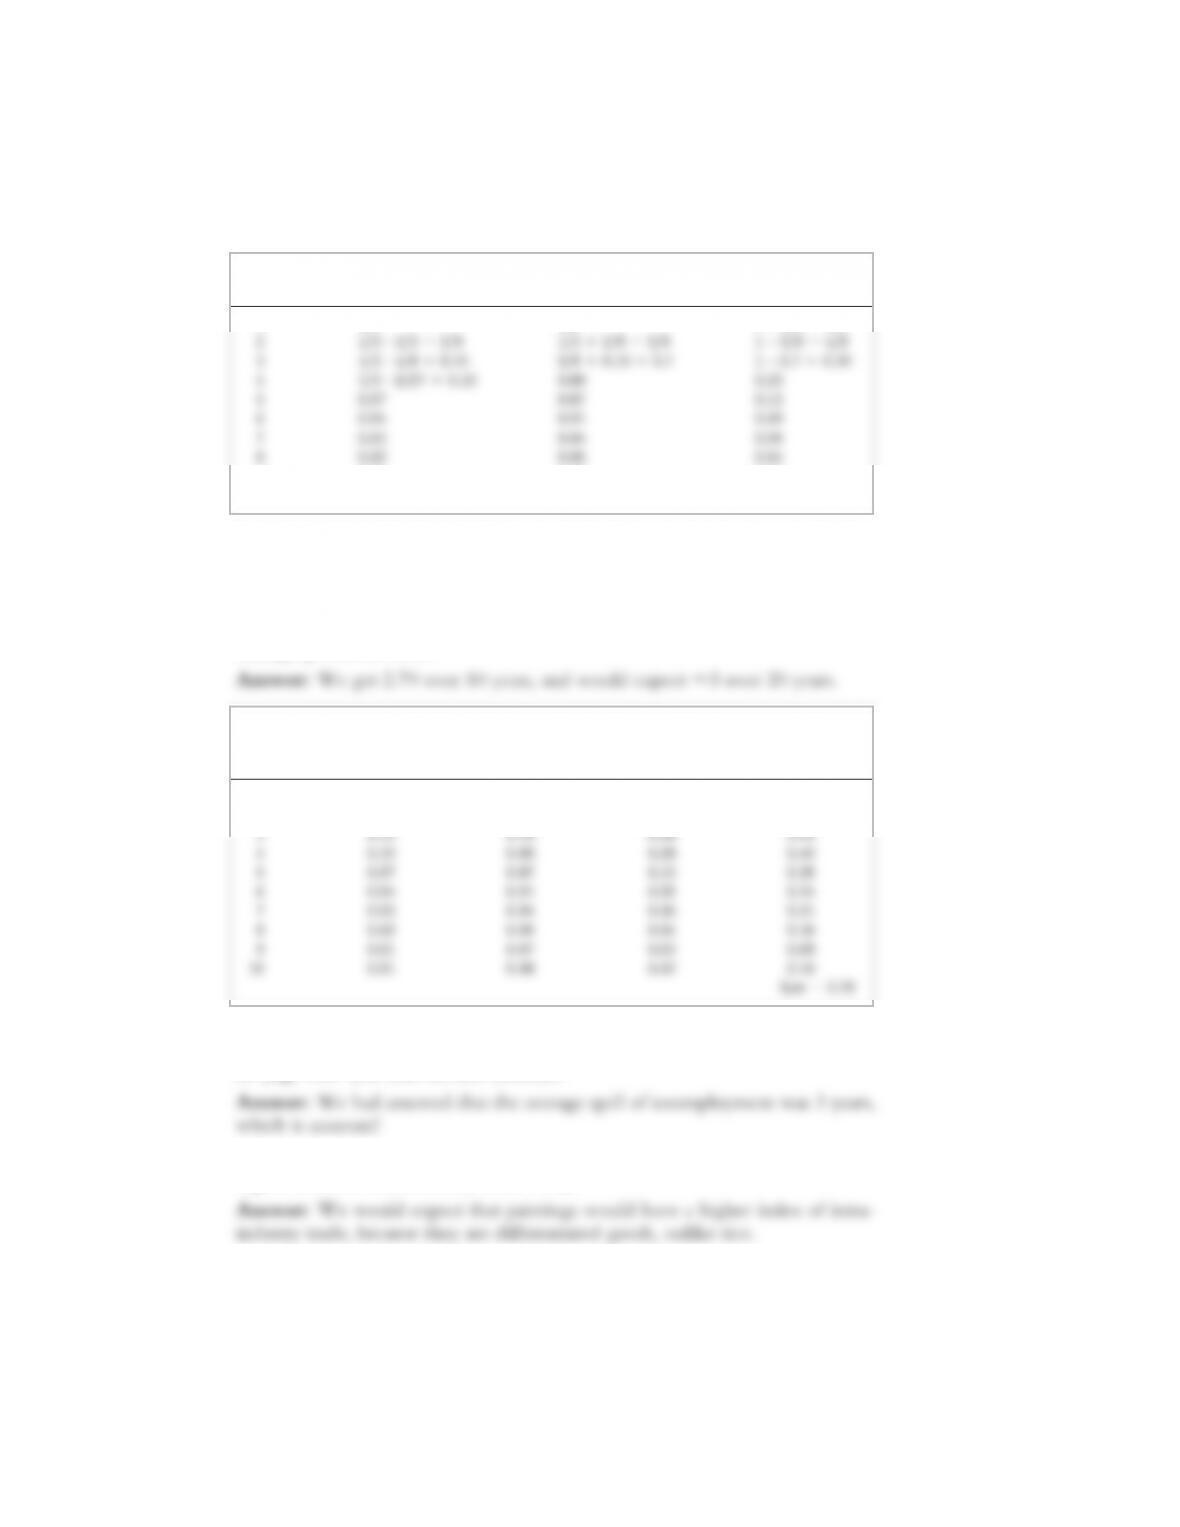
Using this formula, fill in six more values for the fraction of workers finding a
job (column 2), up to year 10.
Answer:
c. To calculate the average spell of unemployment, we take the fraction of workers
finding jobs (column 2), multiply it by the years of unemployment (column 1),
and add up the result over all the rows. By adding up over 10 rows, calculate
what the average spell of unemployment is. What do you expect to get when
adding up over 20 rows?
d. Compare your answer to (c) with the average three-year spell of unemployment
9. a. Of two products, rice and paintings, which product do you expect to have a
higher index of intra-industry trade? Why?
b. Access the U.S. TradeStats Express website at http://tse.export.gov/. Click on
“National Trade Data” then “Global Patterns of U.S. Merchandise Trade.”
Under the “Product” section, change the item to rice (HS 1006) and obtain
the export and import values. Do the same for paintings (HS 9701), and then
calculate the intra-industry trade index for rice and paintings in 2012. Do your
Solutions n Chapter 6 Increasing Returns to Scale and Monopolistic Competition S-57
Fraction Total Fraction Total Fraction
Year Finding Job Employed Unemployed
9 0.01 0.97 0.03
10 0.01 0.98 0.02
Total
Fraction Fraction Total Fraction Average
Year Finding Job Employed Unemployed Spell
1 0.33 0.33 0.67 0.33
2 0.22 0.56 0.44 0.44

calculations confirm your expectation from part (a)? If your answers did not
confirm your expectation, explain.
S-58 Solutions n Chapter 6 Increasing Returns to Scale and Monopolistic Competition
5261 069 954 5283 079082
,,,,,,
+
()
½