
Movement of Labor and Capital
Between Countries
1. In the short-run specific-factors model, examine the impact on a small country fol-
lowing a natural disaster that decreases its population. Assume that land is specific to
agriculture, capital is specific to manufacturing, and labor is free to move between
the two sectors.
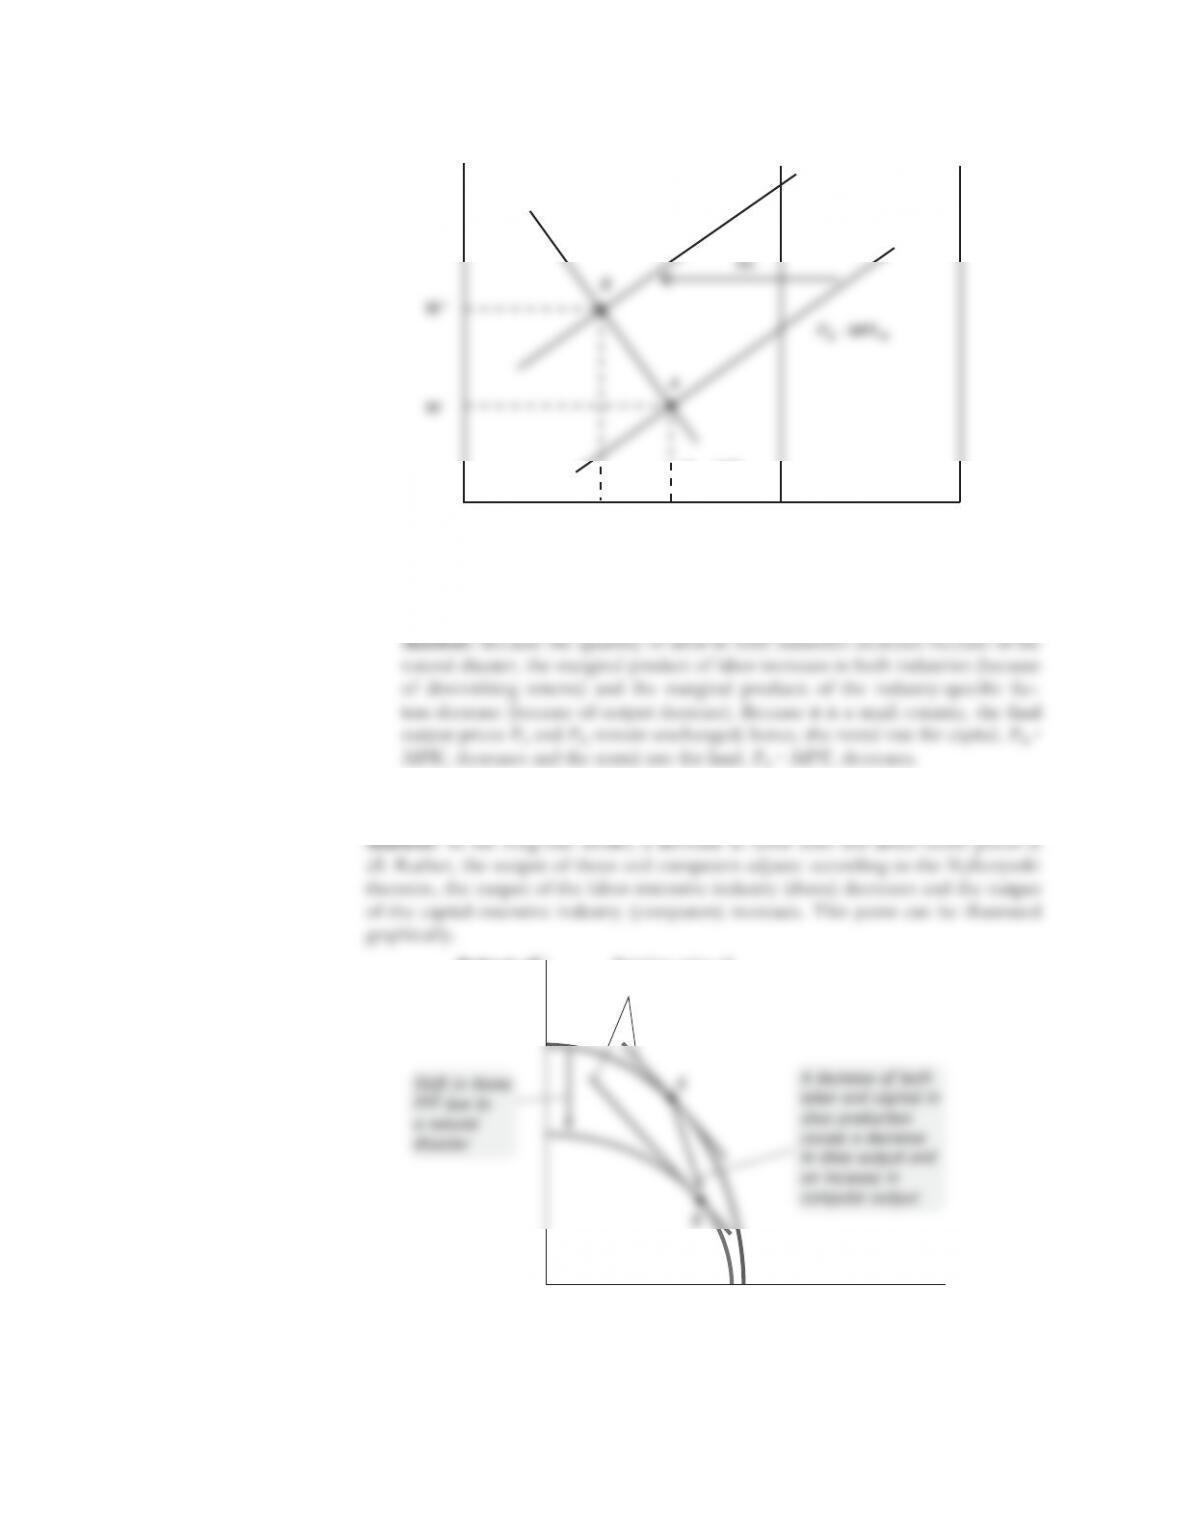
a. In a diagram similar to Figure 5-2, determine the impact of the decrease in the
workforce on the output of each industry and the equilibrium wage.
S-41
5
b. What happens to the rentals on capital and land?
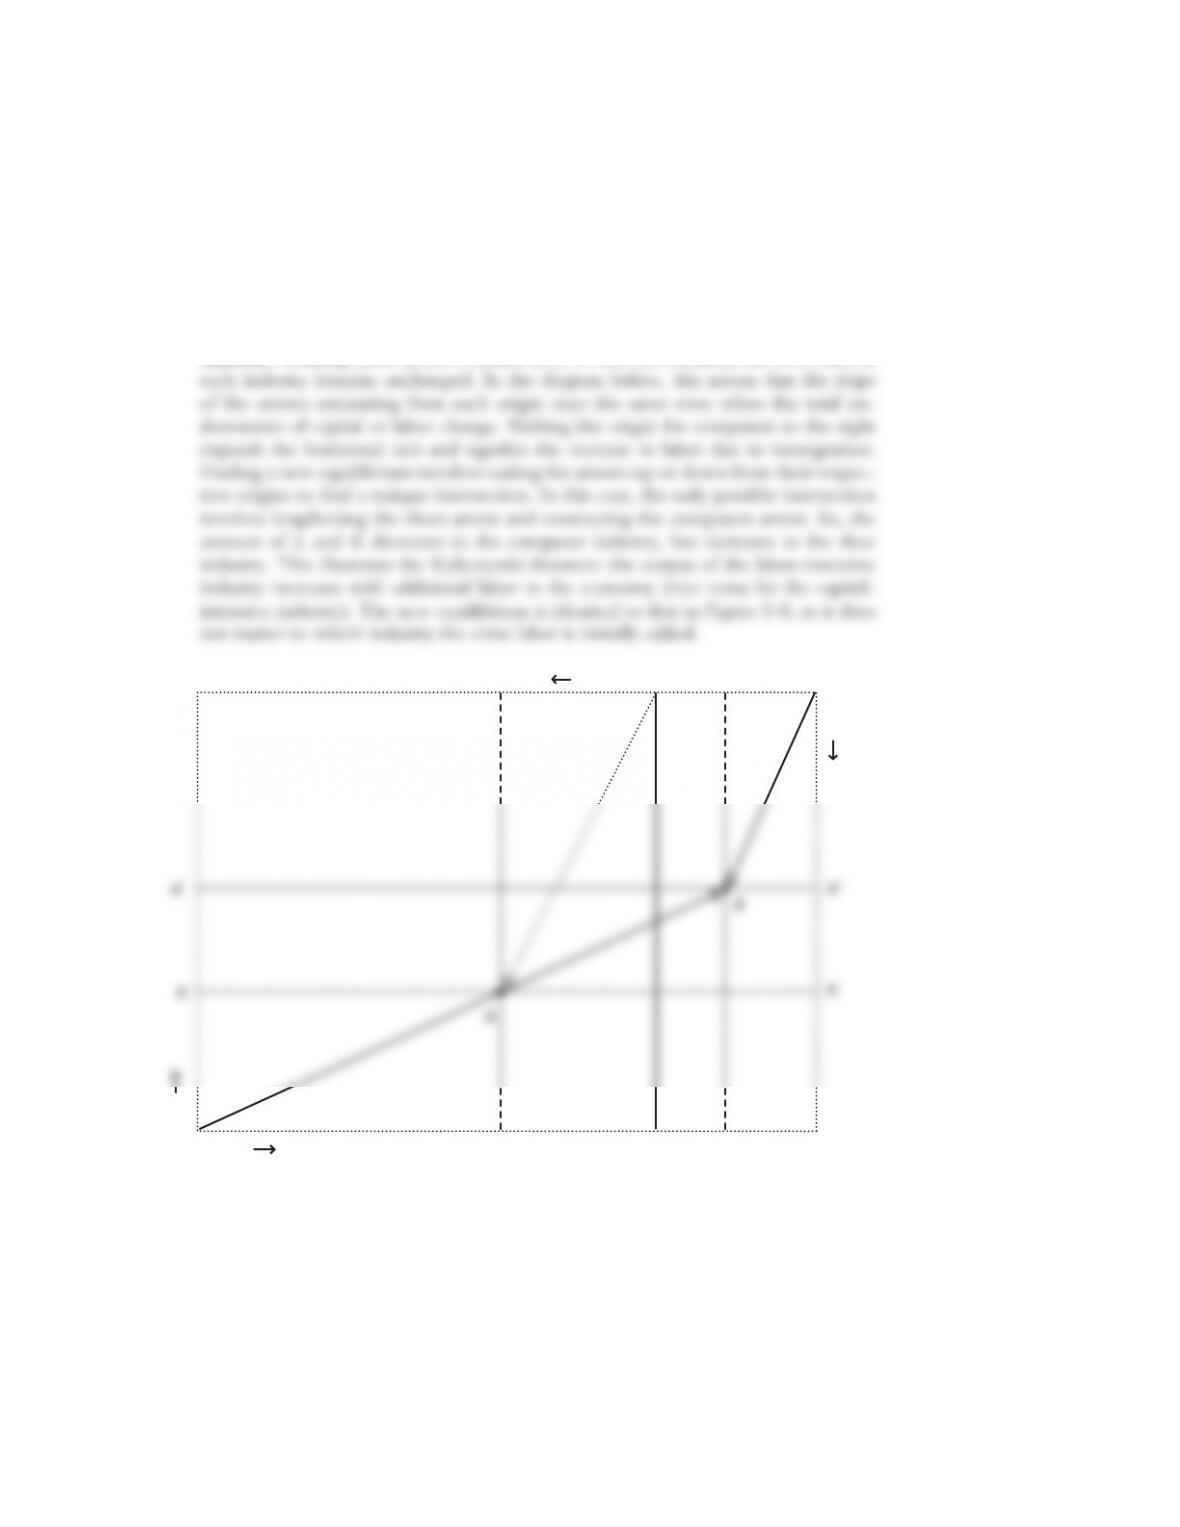
2. How would your answer to Problem 1 change if instead we use the long-run model,
with shoes and computers produced using labor and capital?
S-42 Solutions n Chapter 5 Movement of Labor and Capital Between Countries
Wage, W
(PA · MPLA )
PM · MPLM
B
W
0
M
0
A
LL
0
A
Output of
shoes, QS
Output of
computers, Q
C
Relative price of
computers, PC/PS
A decrease of both
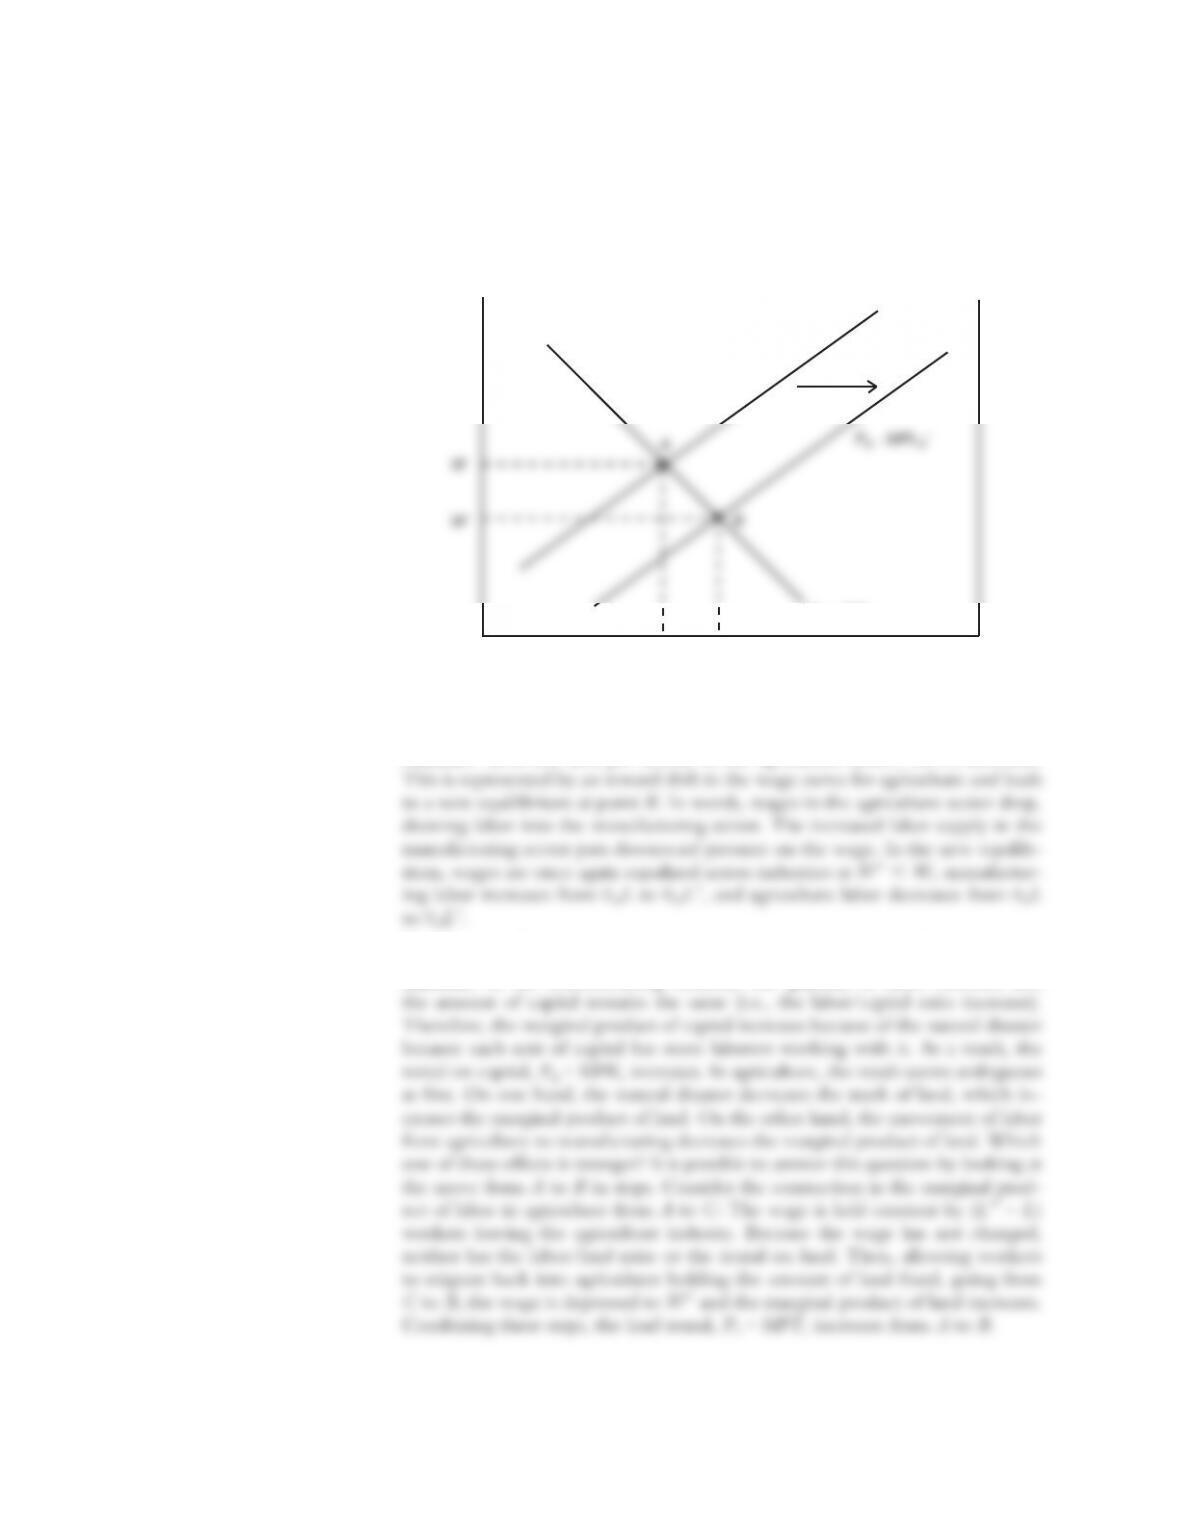
3. Consider an increase in the supply of labor due to immigration, and use the long-run
model. Figure 5-8 shows the box diagram and the leftward shift of the origin for
the shoe industry. Redraw this diagram, but instead, shift to the right the origin for
computers. That is, expand the labor axis by the amount D L, but shift it to the right
rather than to the left. With the new diagram, show how the amount of labor and
capital in shoes and computers is determined, without any change in factor prices.
Carefully explain what has happened to the amount of labor and capital used in each
industry and to the output of each industry.
Solutions n Chapter 5 Movement of Labor and Capital Between Countries S-43
0
S
L
S
K
S
K
C
0
C
L
C
0
C
L
L
LL
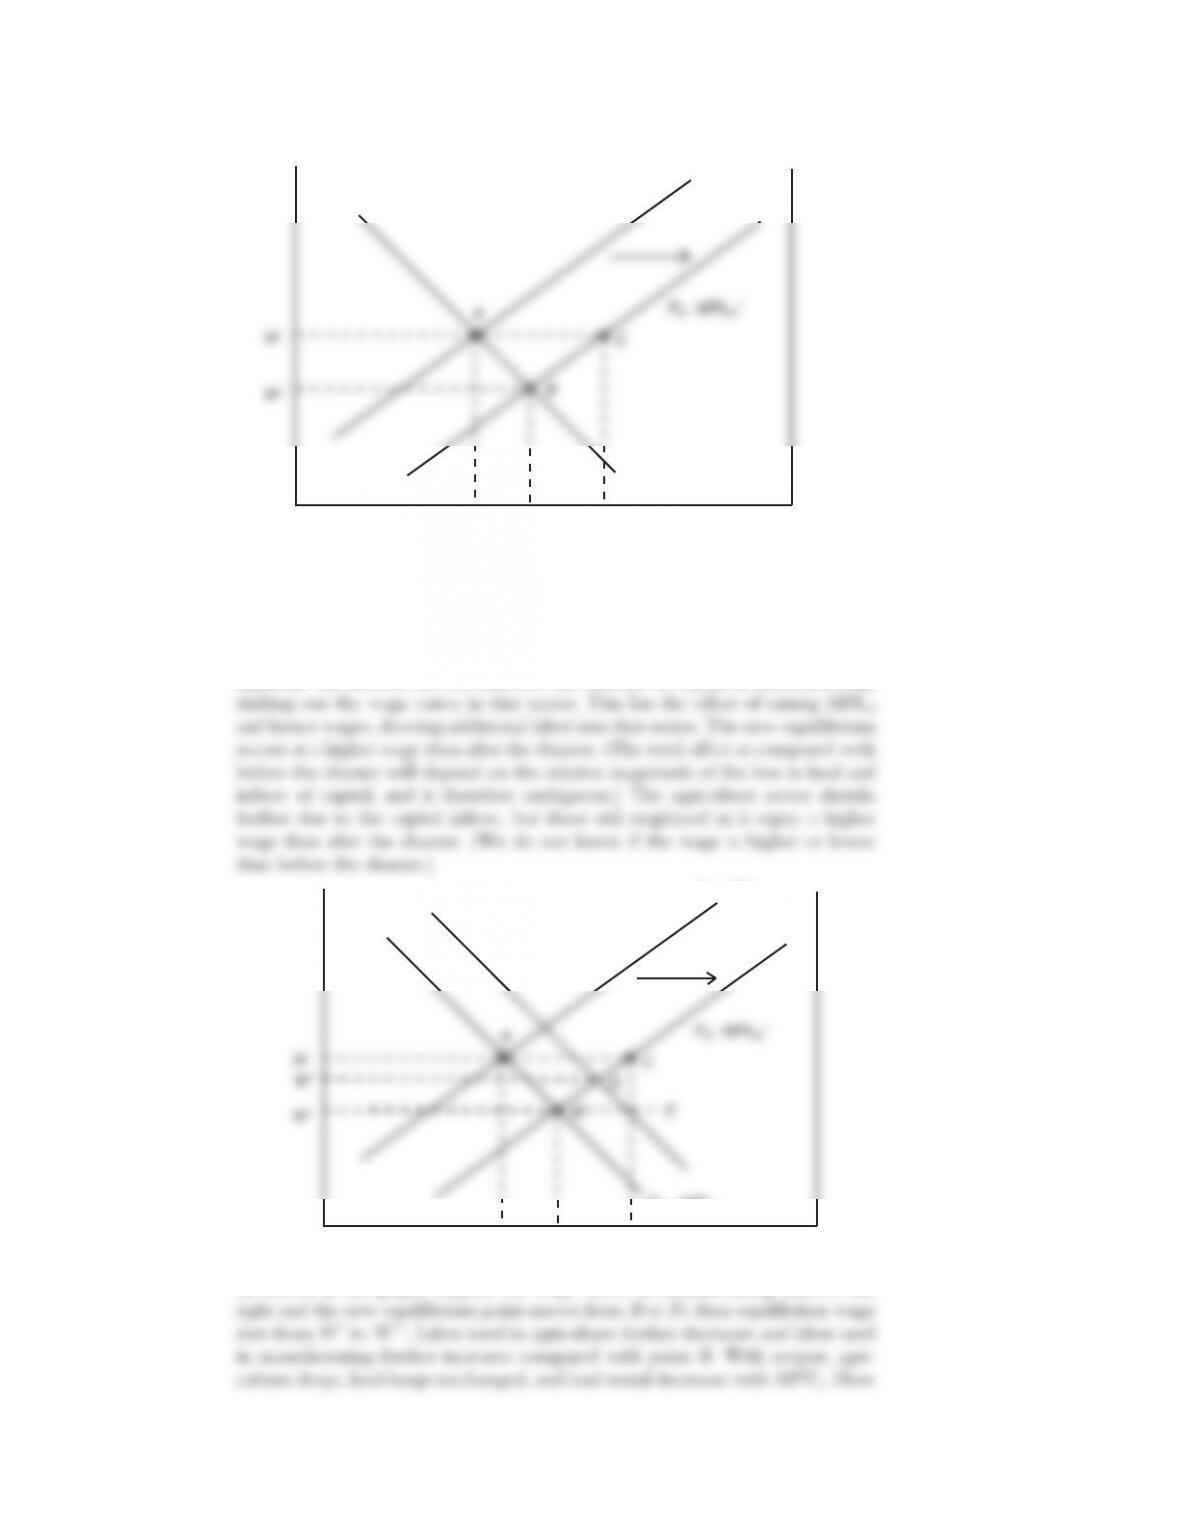
4. In the short-run specific-factors model, consider a decrease in the stock of land. For
example, suppose a natural disaster decreases the quantity of arable land used for
planting crops.
a. Redraw panel (a) of Figure 5-11 starting from the initial equilibrium at point A.
Answer:
b. What is the effect of this change in land on the quantity of labor in each industry
and on the equilibrium wage?
c. What is the effect on the rental on land and the rental on capital?
S-44 Solutions n Chapter 5 Movement of Labor and Capital Between Countries
Wage, W
PA · MPLA
PM · MPLM
0
M
0
A
L
L
d. Now suppose that the international community wants to help the country struck
by the natural disaster and decides to do so by increasing its level of FDI. So
the rest of the world increases its investment in physical capital in the stricken
country. Illustrate the effect of this policy on the equilibrium wage and rentals.
Solutions n Chapter 5 Movement of Labor and Capital Between Countries S-45
Wage, W
PA · MPLA
PM · MPLM
0
M
0
A
LL
L
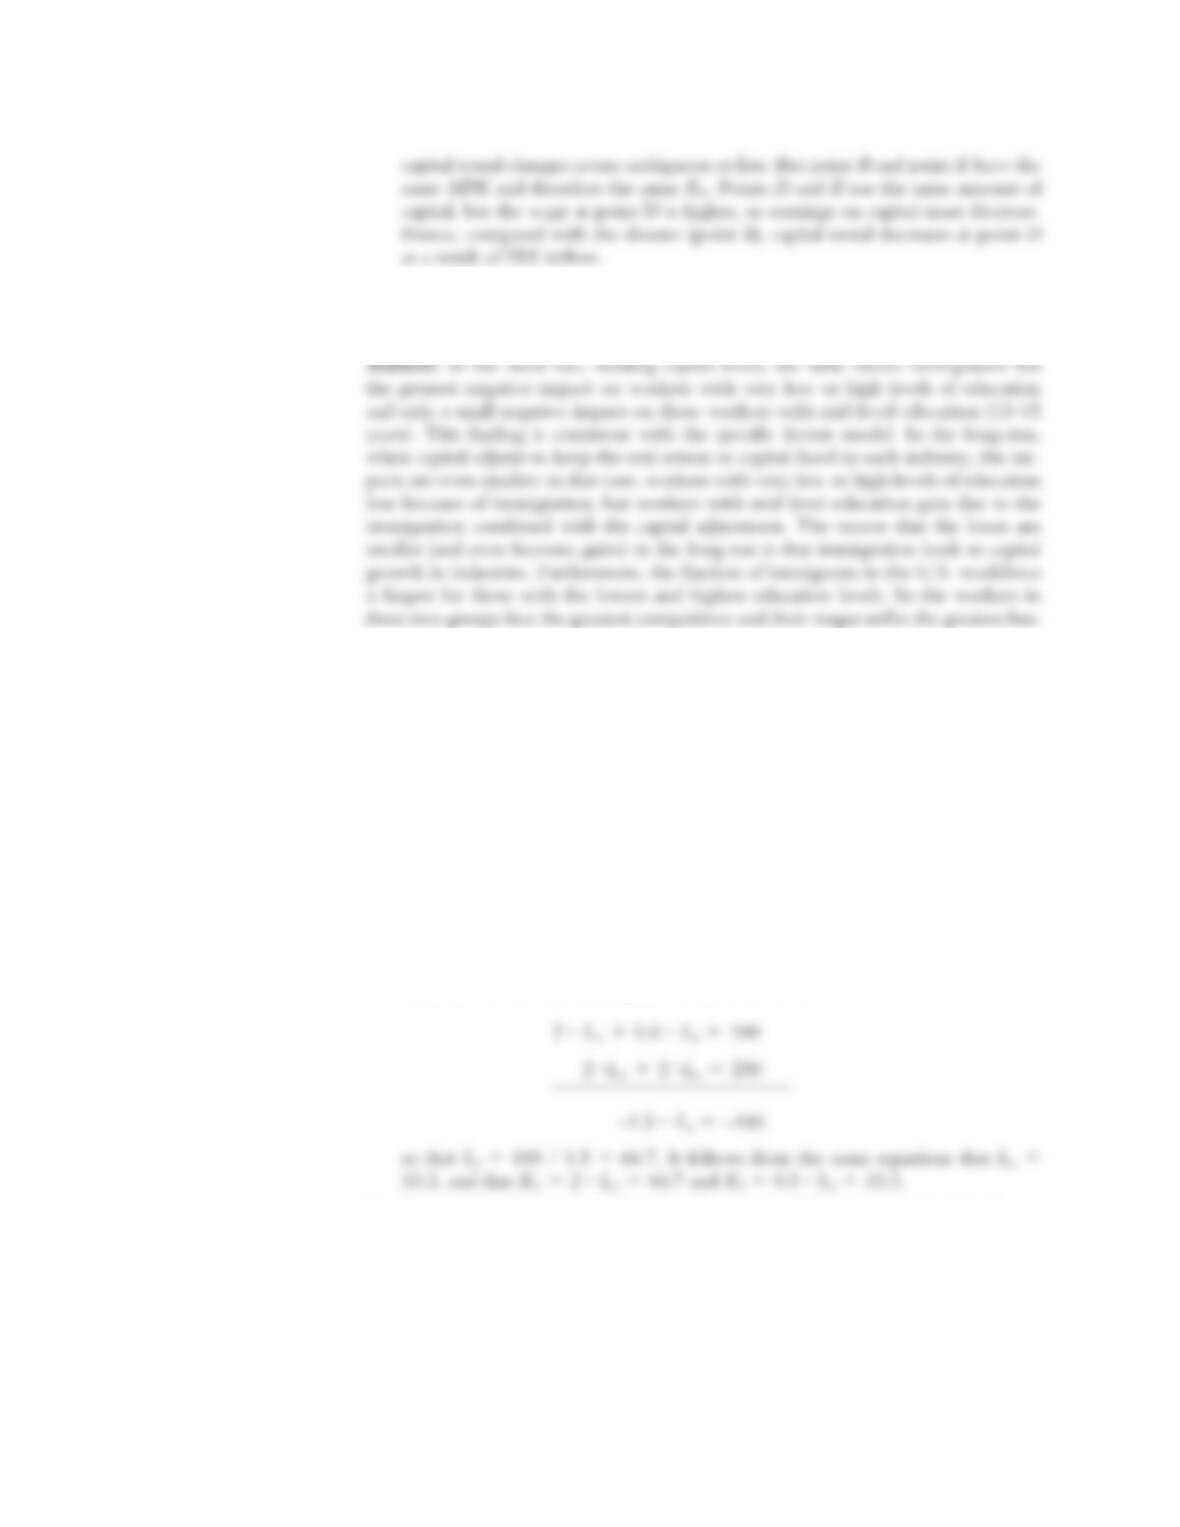
5. According to part A of Table 5-1, what education level loses most (that is, has the
greatest decrease in wage) from immigration to the United States? Does this result
depend on keeping the rental on capital constant? Explain why or why not.
6. Suppose that computers use 2 units of capital for each worker, so that KC 5 2 ? LC ,
whereas shoes use 0.5 units of capital for each worker, so that KS 5 0.5 ? LS. There
are 100 workers and 100 units of capital in the economy.
a. Solve for the amount of labor and capital used in each industry. Hint: The box
diagram shown in Figure 5-7 means that the amount of labor and capital used in
each industry must add up to the total for the economy, so that:
KC 1 KS 5 100, and LC 1 LS 5 100
Use the facts that KC 5 2 ? LC and KS 5 0.5 ? LS to rewrite these equations as:
2 ? LC 1 0.5 ? LS 5 100, and LC 1 LS 5 100
Use these two equations to solve for LC and LS, and then calculate the amount
of capital used in each industry using KC 5 2 ? LC and KS 5 0.5 ? LS.
Answer: The above two equations can be solved as:
b. Suppose that the number of workers increases to 125 due to immigration, keep-
ing total capital fixed at 100. Again solve for the amount of labor and capital
used in each industry. Hint: Redo the calculations from part (a), but using LC 1
LS 5 125.
S-46 Solutions n Chapter 5 Movement of Labor and Capital Between Countries
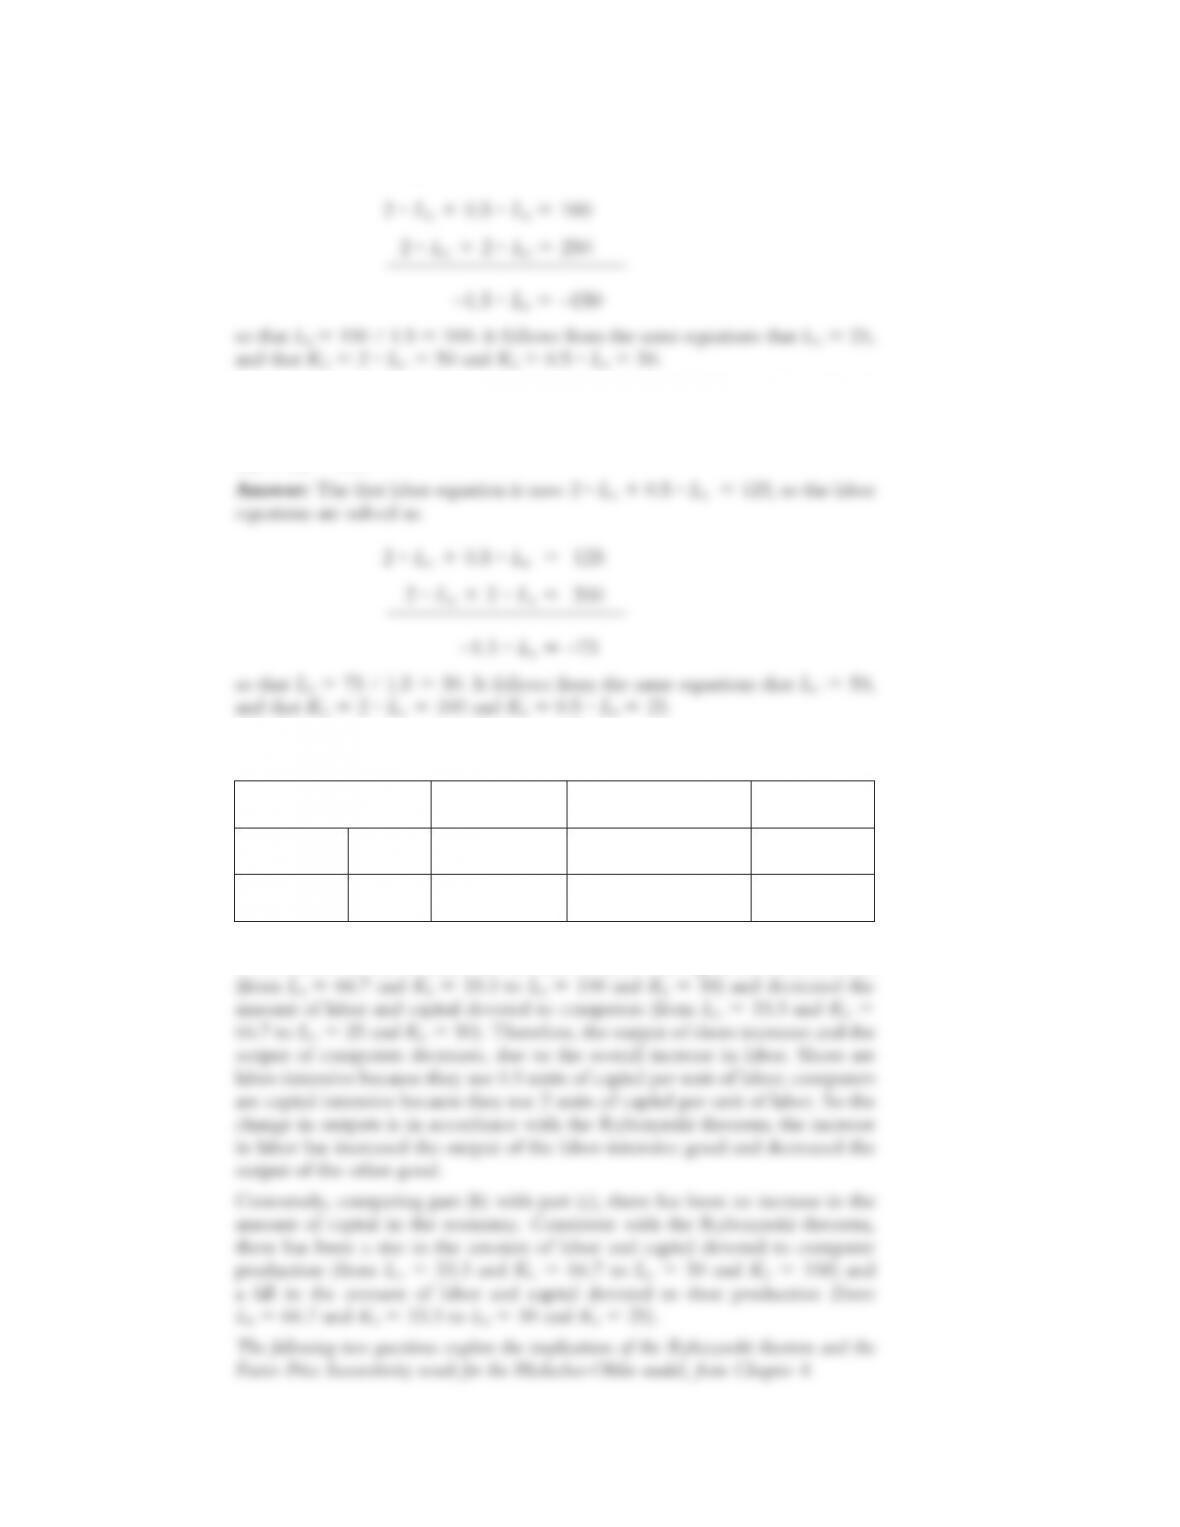
Answer: The labor equations are now solved as:
c. Suppose instead that the amount of capital increases to 125 due to FDI, keeping
the total number of workers fixed at 100. Again solve for the amount of labor
and capital used in each industry. Hint: Redo the calculations from part (a), using
KC 1 KS 5 125.
d. Explain how your results in parts (b) and (c) are related to the Rybczynski theo-
rem.
(a)
Original
(b)
Immigration
(c)
FDI
Computer K
L
66.7
33.3
50
25
100
50
Shoe K
L
33.3
66.7
50
100
25
50
Answer: Comparing part (a) with part (b), the increase in the amount of labor
in the economy has increased the amount of labor and capital devoted to shoes
Solutions n Chapter 5 Movement of Labor and Capital Between Countries S-47

7. In this question, we use the Rybczynski theorem to review the derivation of the
Heckscher-Ohlin theorem.
a. Start at the no-trade equilibrium point A on the Home PPF in Figure 4-2, panel
(a). Suppose that through immigration, the amount of labor in Home grows.
Draw the new PPF, and label the point B where production would occur with
the same prices for goods. Hint: You can refer back to Figure 5-9 to see the ef-
b. Suppose that the only difference between Foreign and Home is that Foreign
has more labor. Otherwise, the technologies used to produce each good are the
same across countries. Then how does the Foreign PPF compare with the new
Home PPF (including immigration) that you drew in part (a)? Is point B the
no-trade equilibrium in Foreign? Explain why or why not.
S-48 Solutions n Chapter 5 Movement of Labor and Capital Between Countries
Output of
shoes, QS
Output of
computers, QC
A
A*
B
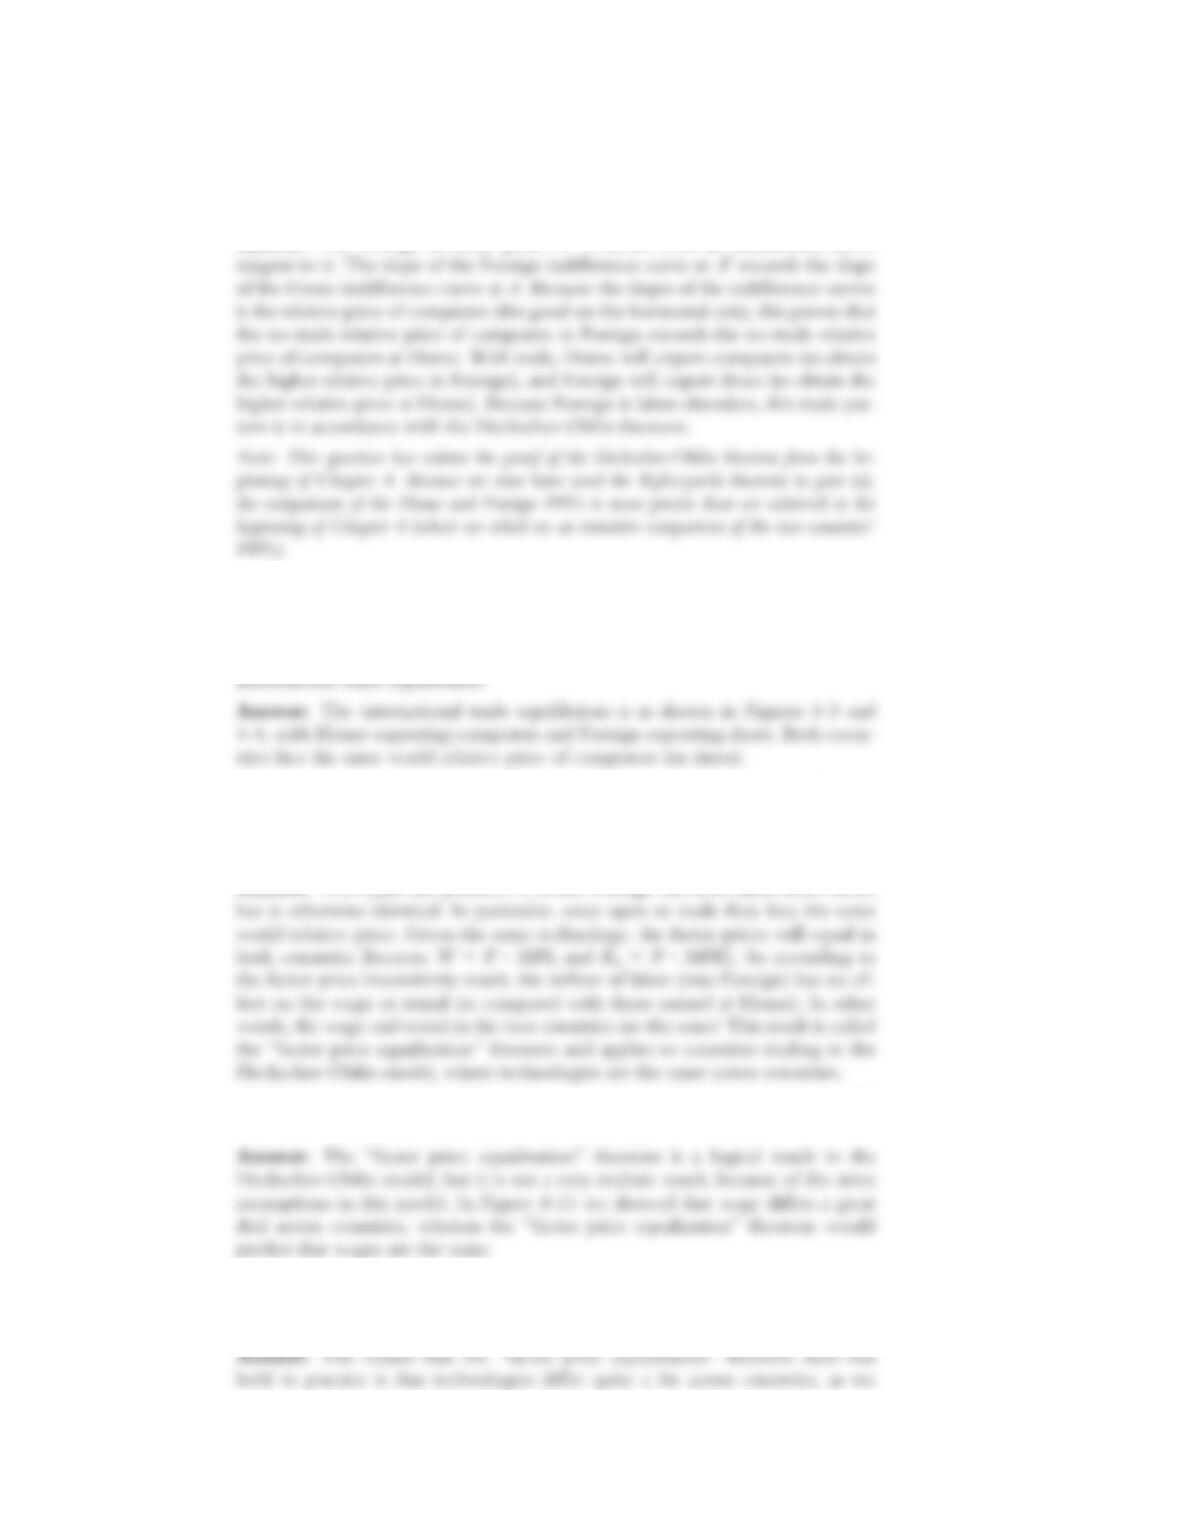
c. Illustrate a new point, A
*, that is the no-trade equilibrium in Foreign. How
do the relative no-trade prices of computers compare in Home and Foreign?
Therefore, what will be the pattern of trade between the countries, and why?
* is shown with an indifference curve
8. Continuing from Problem 7, we now use the factor price insensitivity result to com-
pare factor prices across countries in the Heckscher-Ohlin model.
a. Illustrate the international trade equilibrium on the Home and Foreign pro-
duction possibility frontiers. Hint: You can refer back to Figure 4-3 to see the
b. Suppose that the only difference between Foreign and Home is that Foreign
has more labor. Otherwise, the technologies used to produce each good are the
same across the countries. Then according to the factor price insensitivity result,
how will the wage and rental compare in the two countries?
c. Call the result in part (b) “factor price equalization.” Is this a realistic result?
Hint: You can refer back to Figure 4-9 to see wages across countries.
d. Based on our extension of the Heckscher-Ohlin model at the end of Chapter
4, what is one reason why the factor price equalization result does not hold in
reality?
Solutions n Chapter 5 Movement of Labor and Capital Between Countries S-49
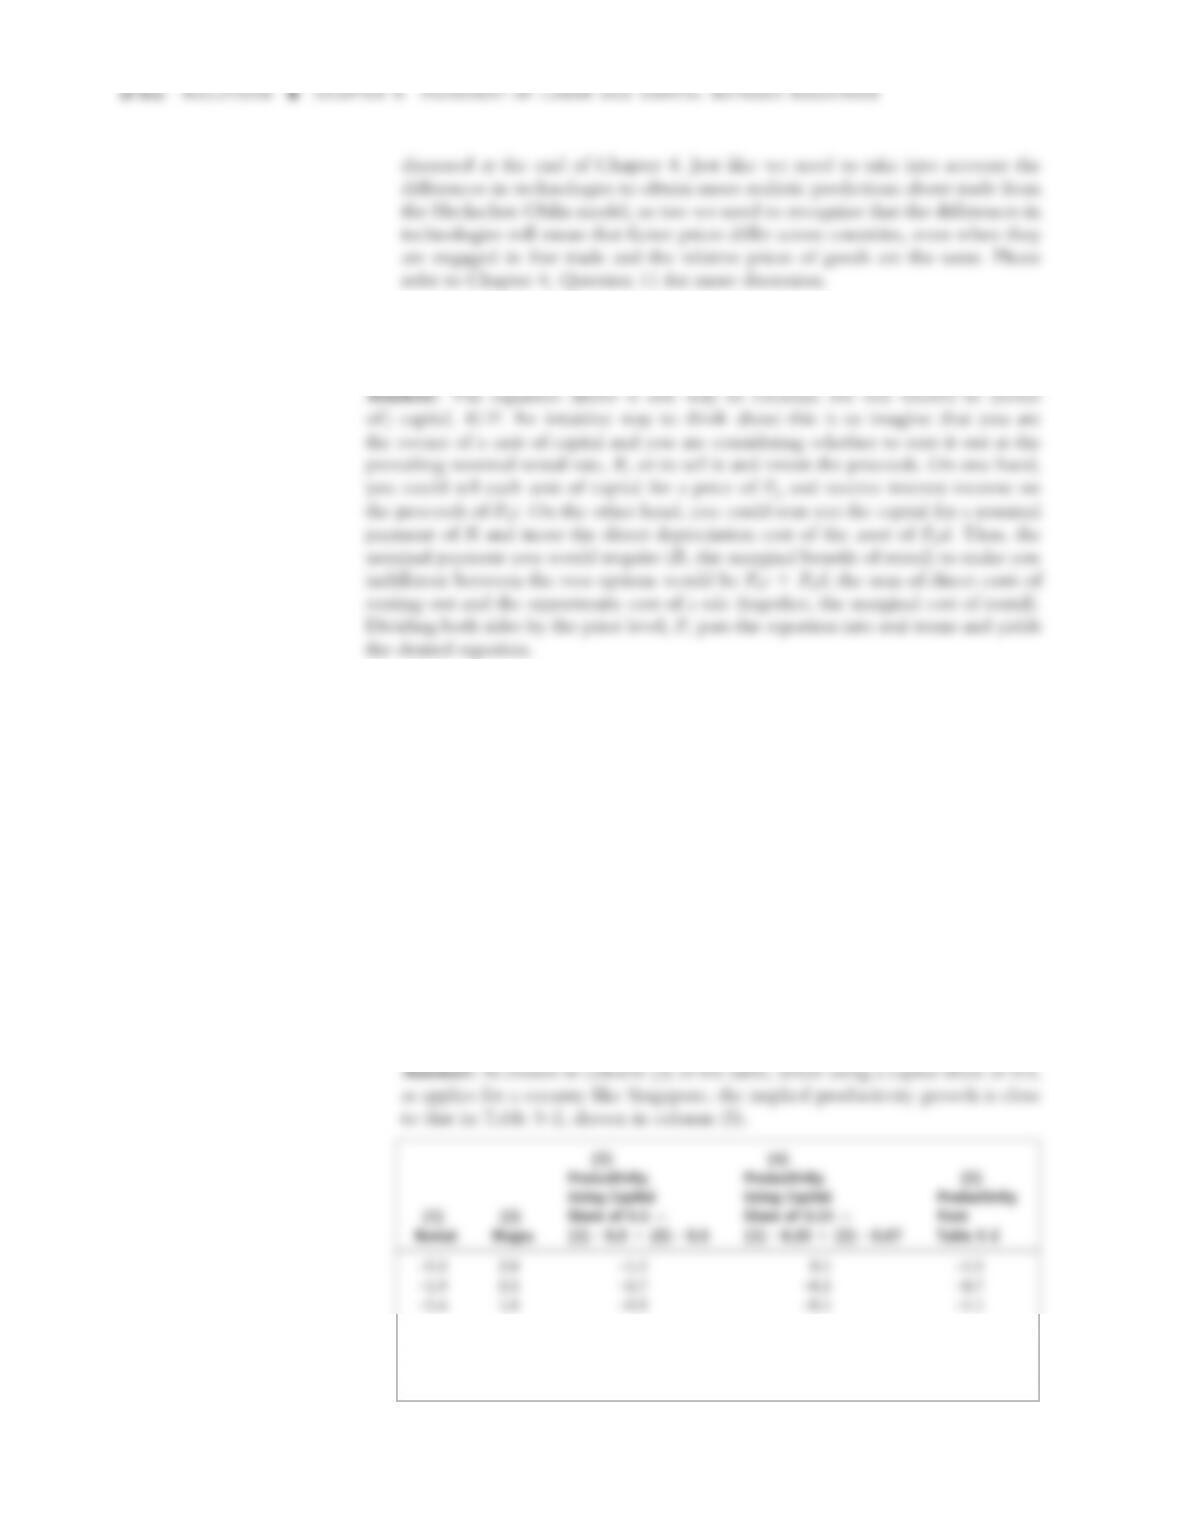
9. Recall the formula from the application, “The Effect of FDI on Rentals and Wages
in Singapore.” Give an intuitive explanation for this formula for the rental rate. Hint:
Describe one side of the equation as a marginal benefit and the other as a marginal cost.
10. In Table 5-2, we show the growth in the real rental and real wages in Singapore,
along with the implied productivity growth. One way to calculate the productivity
growth is to take the average of the growth in the real rental and real wage. The
idea is that firms can afford to pay more to labor and capital if there is productivity
growth, so in that case, real factor prices should be growing. But if there is no pro-
ductivity growth, the average of the growth in the real rental and real wage should
be close to zero.
To calculate the average of the growth in the real factor prices, we use the shares
of GDP going to capital and labor. Specifically, we multiply the growth in the real
rental by the capital share of GDP, and add the growth in the real wage multiplied
by the labor share of GDP. Then answer the following:
a. For a capital-rich country like Singapore, the share of capital in GDP is about
one half and the share of labor is also one half. Using these shares, calculate the
average of the growth in the real rental and real wage shown in each row of
Table 5-2. How do your answers compare with the productivity growth shown
in the last column of Table 5-2?
S-50 Solutions n Chapter 5 Movement of Labor and Capital Between Countries
1.6 2.7 2.2 2.3 2.2
–0.2 3.2 1.5 2.1 1.5
–0.5 3.6 1.6 2.2 1.6

Solutions n Chapter 5 Movement of Labor and Capital Between Countries S-51
b. For an industrialized country like the United States, the share of capital in GDP
is about one third, and the share of labor in GDP is about two thirds. Using
these shares, calculate the average of the growth in the real rental and real wage
shown in each row of Table 5-2. How do your answers now compare with the
productivity growth shown in the last column?
11. Figure 5-14 is a supply-and-demand diagram for the world labor market. Starting at
points A and A
*, consider a situation where some Foreign workers migrate to Home,
but not enough to reach the equilibrium with full migration (point B ). As a result
of the migration, the Home wage decreases from W to W 0 . W 9, and the Foreign
wage increases from W
* to W
** , W 9.
a. Are there gains that accrue to the Home country? If so, redraw the graph and
identify the magnitude of the gains for each country. If not, say why not.
Answer: Gains from trade in the following graph are analogous to consumer
(W
b. Are there gains that accrue to the Foreign country? If so, again show the mag-
nitude of these gains in the diagram and show the world gains.
12. A housekeeper from the Philippines is contemplating immigrating to Singapore in
search of higher wages. Suppose that the housekeeper earns approximately $2,000
annually and expects to find a job in Singapore worth approximately $5,000 annually
for a period of 3 years. Furthermore, assume that the cost of living in Singapore is
$500 more per year than at home.
Wage, WForeign
wage
0
A
LL
L
W
0*
L*

S-52 Solutions n Chapter 5 Movement of Labor and Capital Between Countries
a. What can we say about the productivity of housekeepers in Singapore versus the
Philippines? Explain.
b. What is the total gain to the housekeeper from migrating?
c. Is there a corresponding gain for the employer in Singapore? Explain.