Trade and Resources:
The Heckscher-Ohlin Model
1. This problem uses the Heckscher-Ohlin model to predict the direction of trade.
Consider the production of handmade rugs and assembly line robots in Canada and
India.
a. Which country would you expect to be relatively labor-abundant, and which is
capital-abundant? Why?
b. Which industry would you expect to be relatively labor-intensive, and which is
capital-intensive? Why?
c. Given your answers to (a) and (b), draw production possibilities frontiers for each
country. Assuming that consumer preferences are the same in both countries, add
indifference curves and relative price lines (without trade) to your PPF graphs.
What do the slopes of the price lines tell you about the direction of trade?
S-31
4
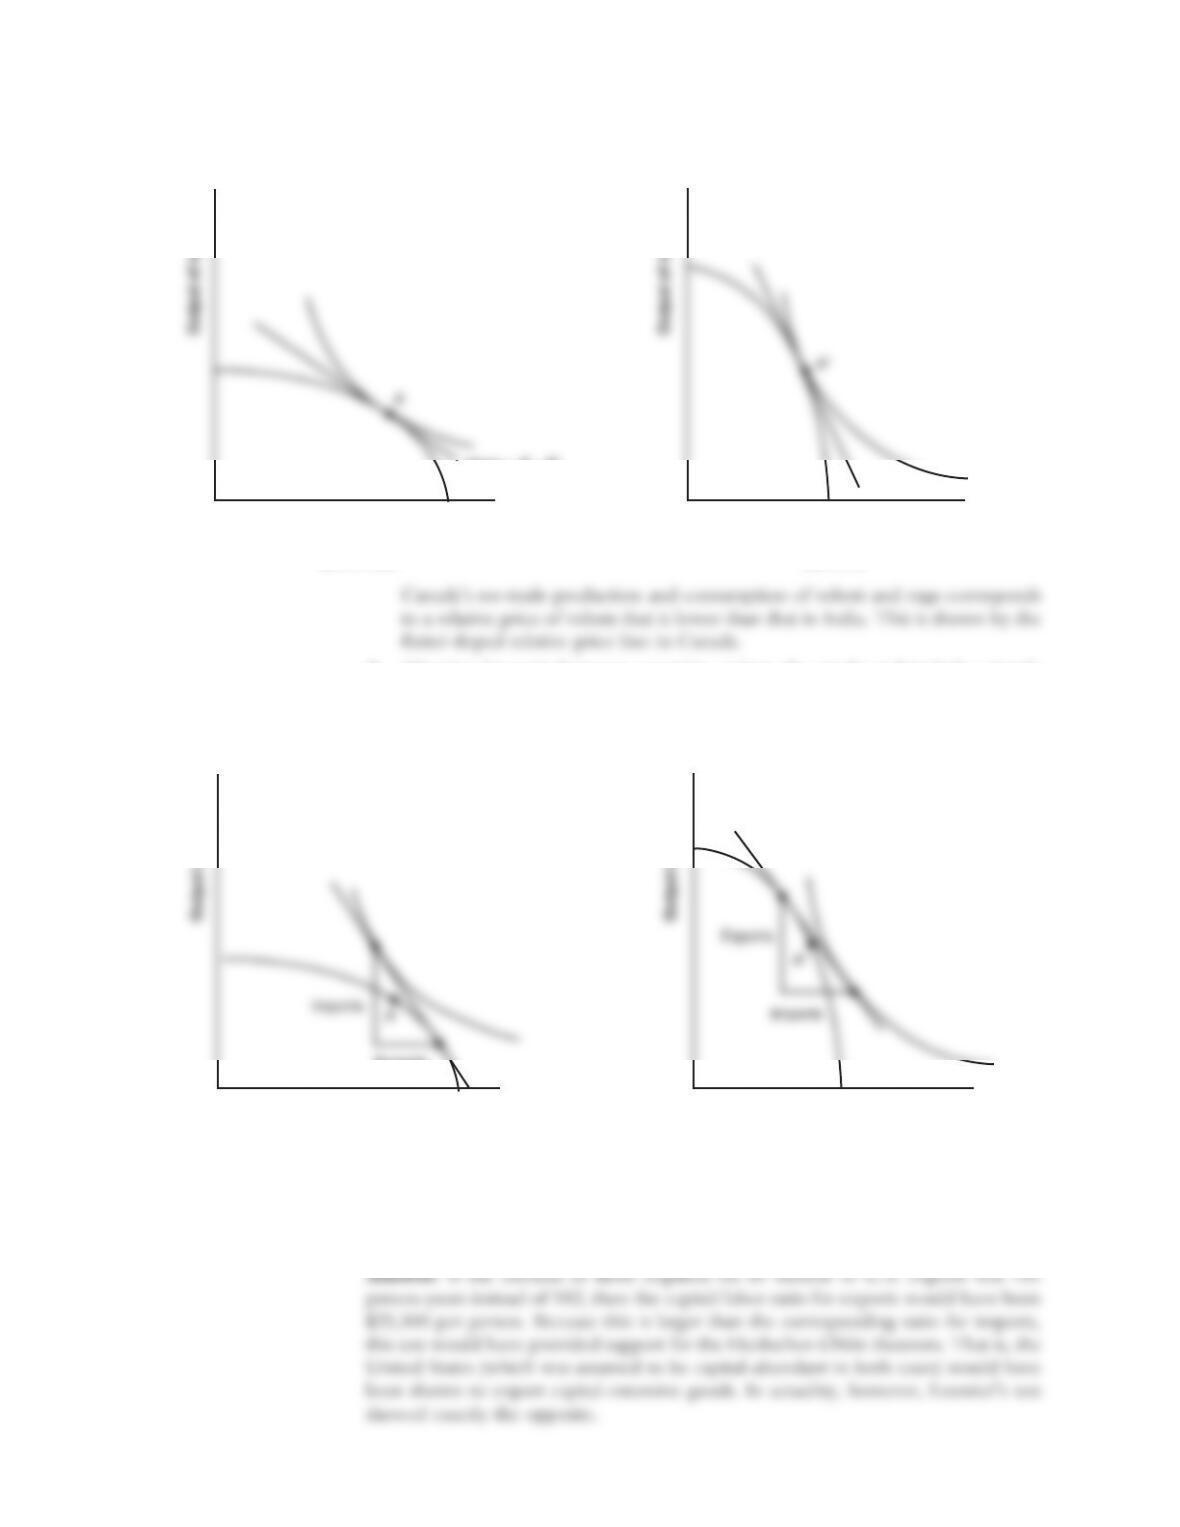
Answer: See the following figures.
d. Allowing for trade between countries, redraw the graphs and include a “trade
triangle” for each country. Identify and label the vertical and horizontal sides of
the triangles as either imports or exports.
Answer: See the following figures.
2. Leontief’s paradox is an example of testing a trade model using actual data observa–
tions. If Leontief had observed that the amount of labor needed per $1 million of U.S.
exports was 100 person-years instead of 182, would he have reached the same conclu–
sion? Explain.
S-32 Solutions n Chapter 4 Trade and Resources: The Heckscher-Ohlin Model
Output of robots,
Q
R
*O
Output of robots,
Q
RO
(b) India(a) Canada
Q
R
*U
Q
RU
A
A*
slope = PRO/PRU
slope = PR
*
O/PR
*
U
Output of robots,
Q
R
*O
Output of robots,
Q
RO
Q
R
*U
Q
RU
A
A
*
Imports Imports
Exports
(b) India(a) Canada
3. Suppose that there are drastic technological improvements in shoe production at
Home such that shoe factories can operate almost completely with computer-aided
machines. Consider the following data for the Home country:
Computers: Sales revenue 5 PCQC 5 100
Payments to labor 5 WLC 5 50
Payments to capital 5 RKC 5 50
Percentage increase in the price 5 D PC/PC 5 0%
Shoes: Sales revenue 5 PSQS 5 100
Payments to labor 5 WLS 5 5
Payments to capital 5 RKS 5 95
Percentage increase in the price 5 D PS/PS 5 50%
a. Which industry is capital-intensive? Is this a reasonable question, given that some
industries are capital-intensive in some countries and labor-intensive in others?
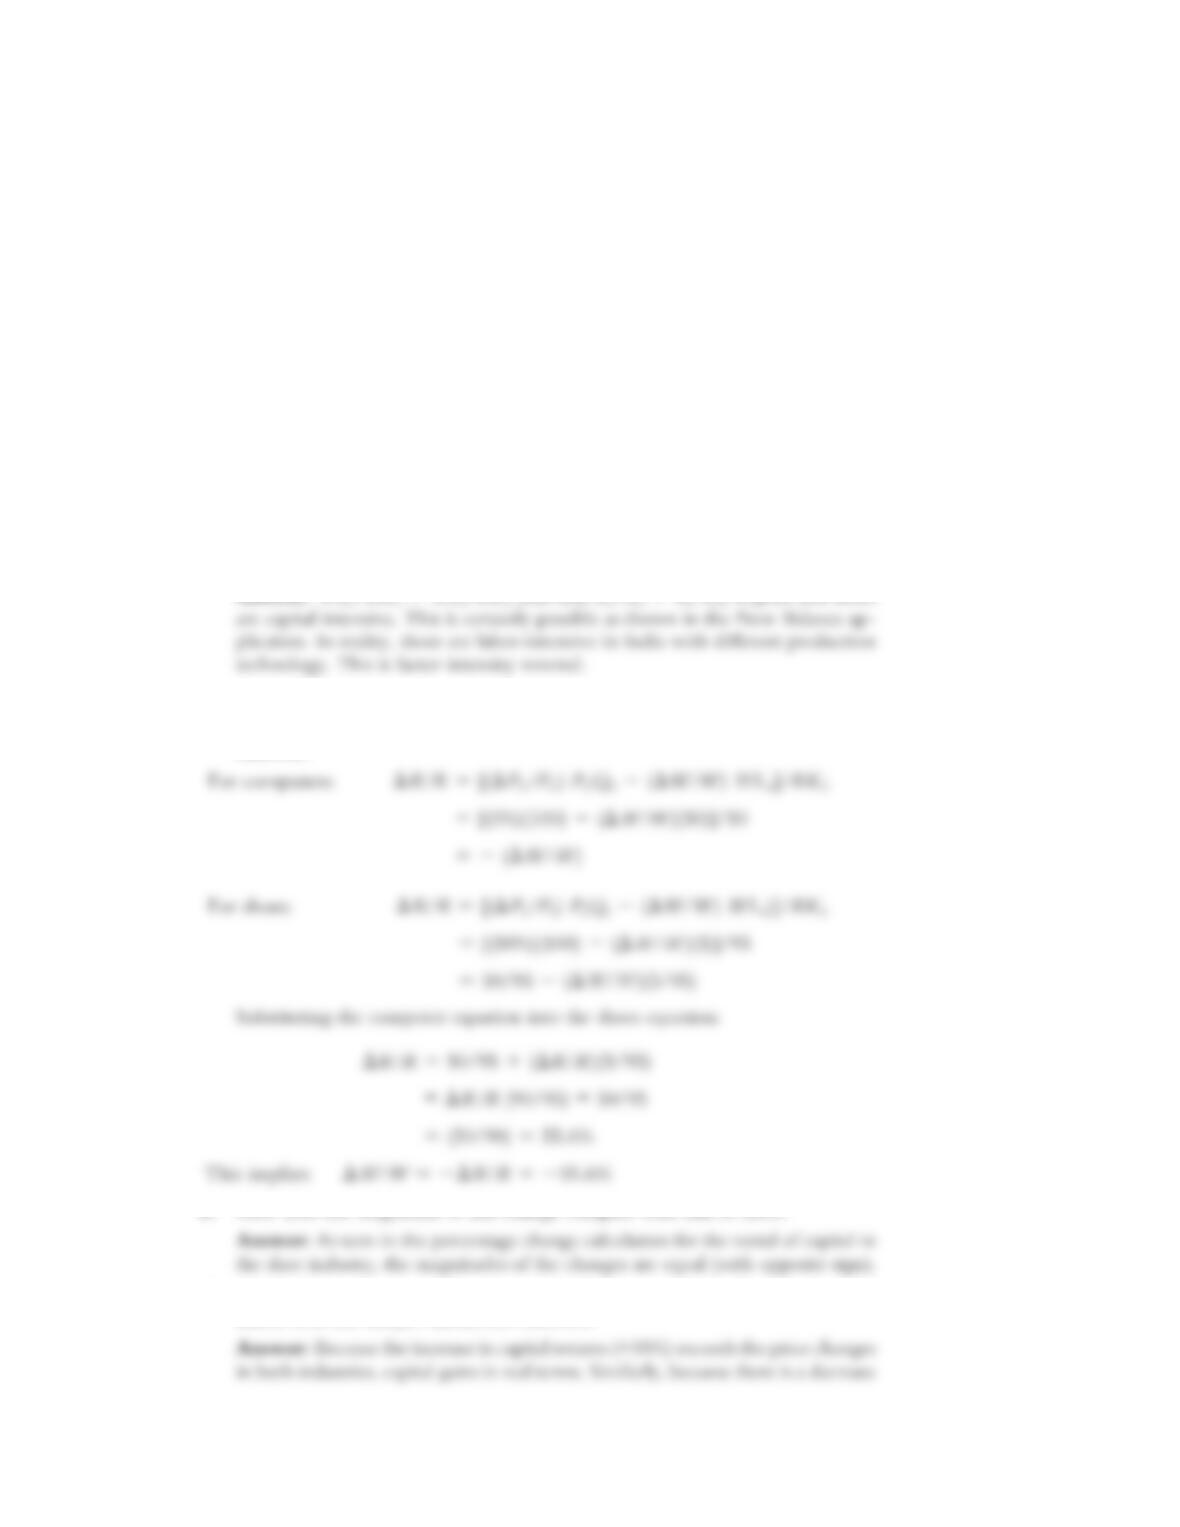
b. Given the percentage changes in output prices in the data provided, calculate the
percentage change in the rental on capital.
Answer:
d. Which factor gains in real terms, and which factor loses? Are these results con-
Solutions n Chapter 4 Trade and Resources: The Heckscher-Ohlin Model S-33
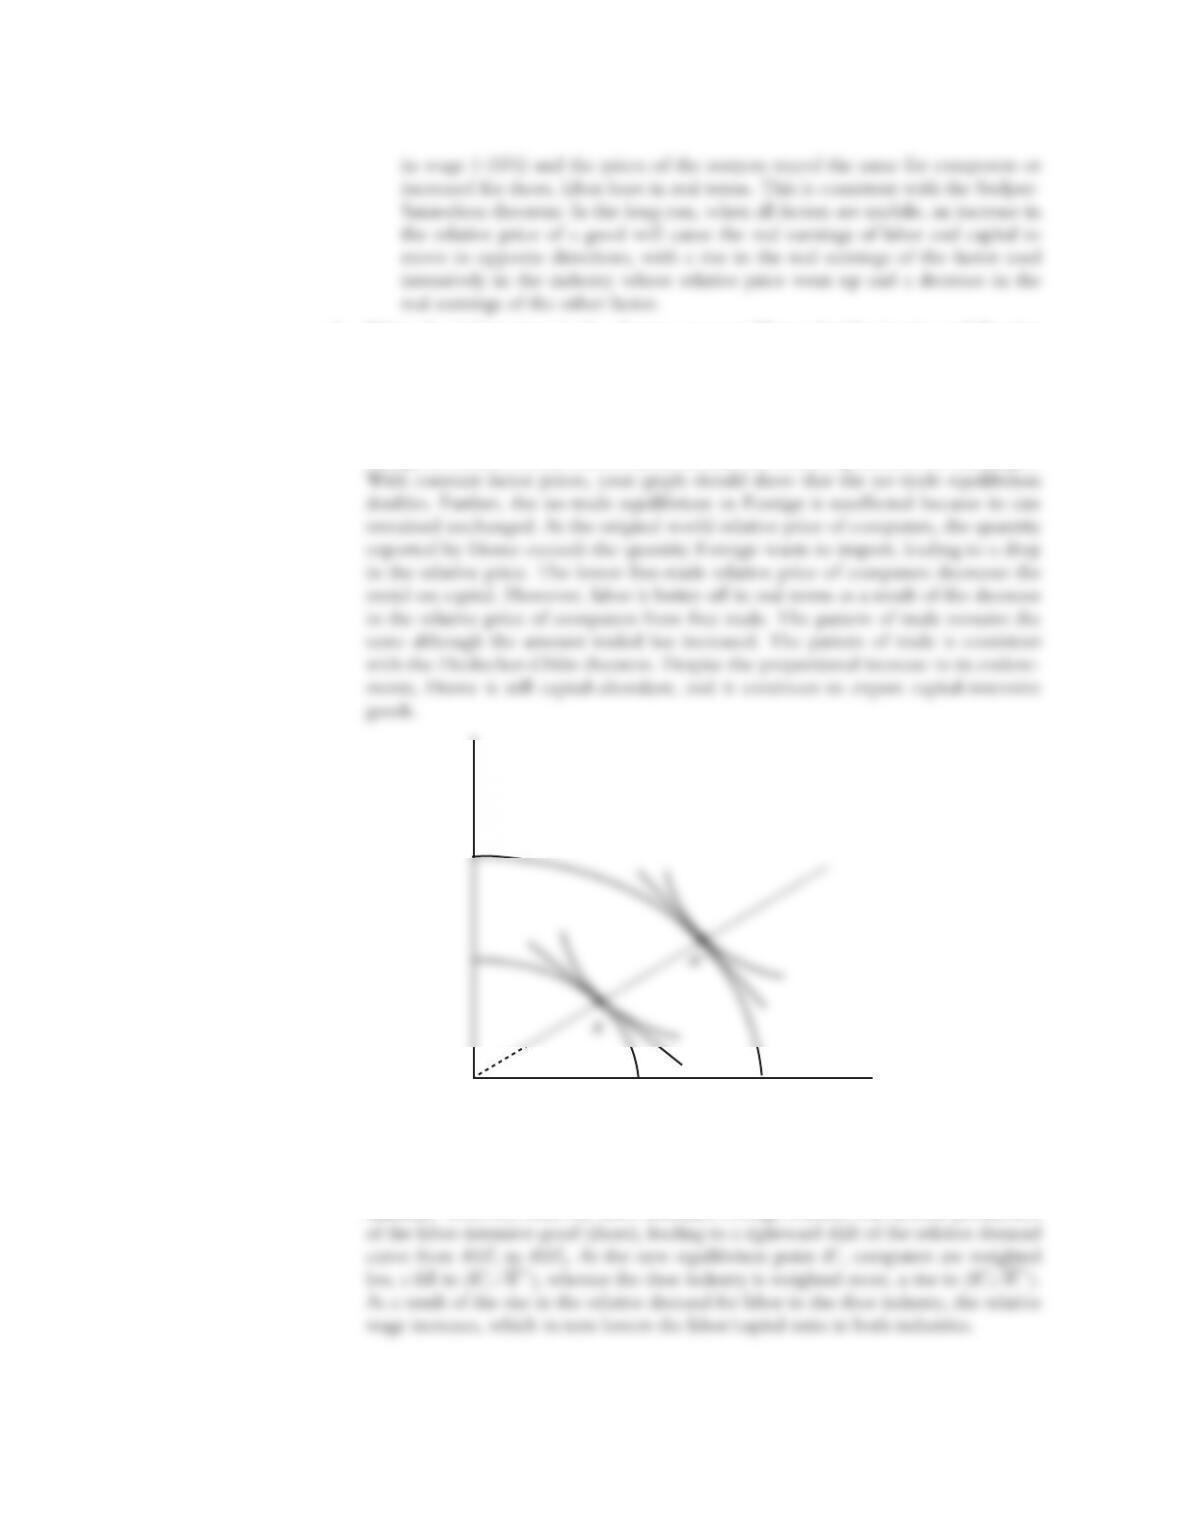
4. Using the information in the chapter, suppose Home doubles in size and Foreign
remains the same. Show that an equal proportional increase in capital and labor at
Home will change the relative price of computers, wage, rental on capital, and the
amount traded but not the pattern of trade.
Answer: An equal proportional increase in Home’s capital and labor does not
change its relative factor endowments so that the labor/capital ratio is unchanged.
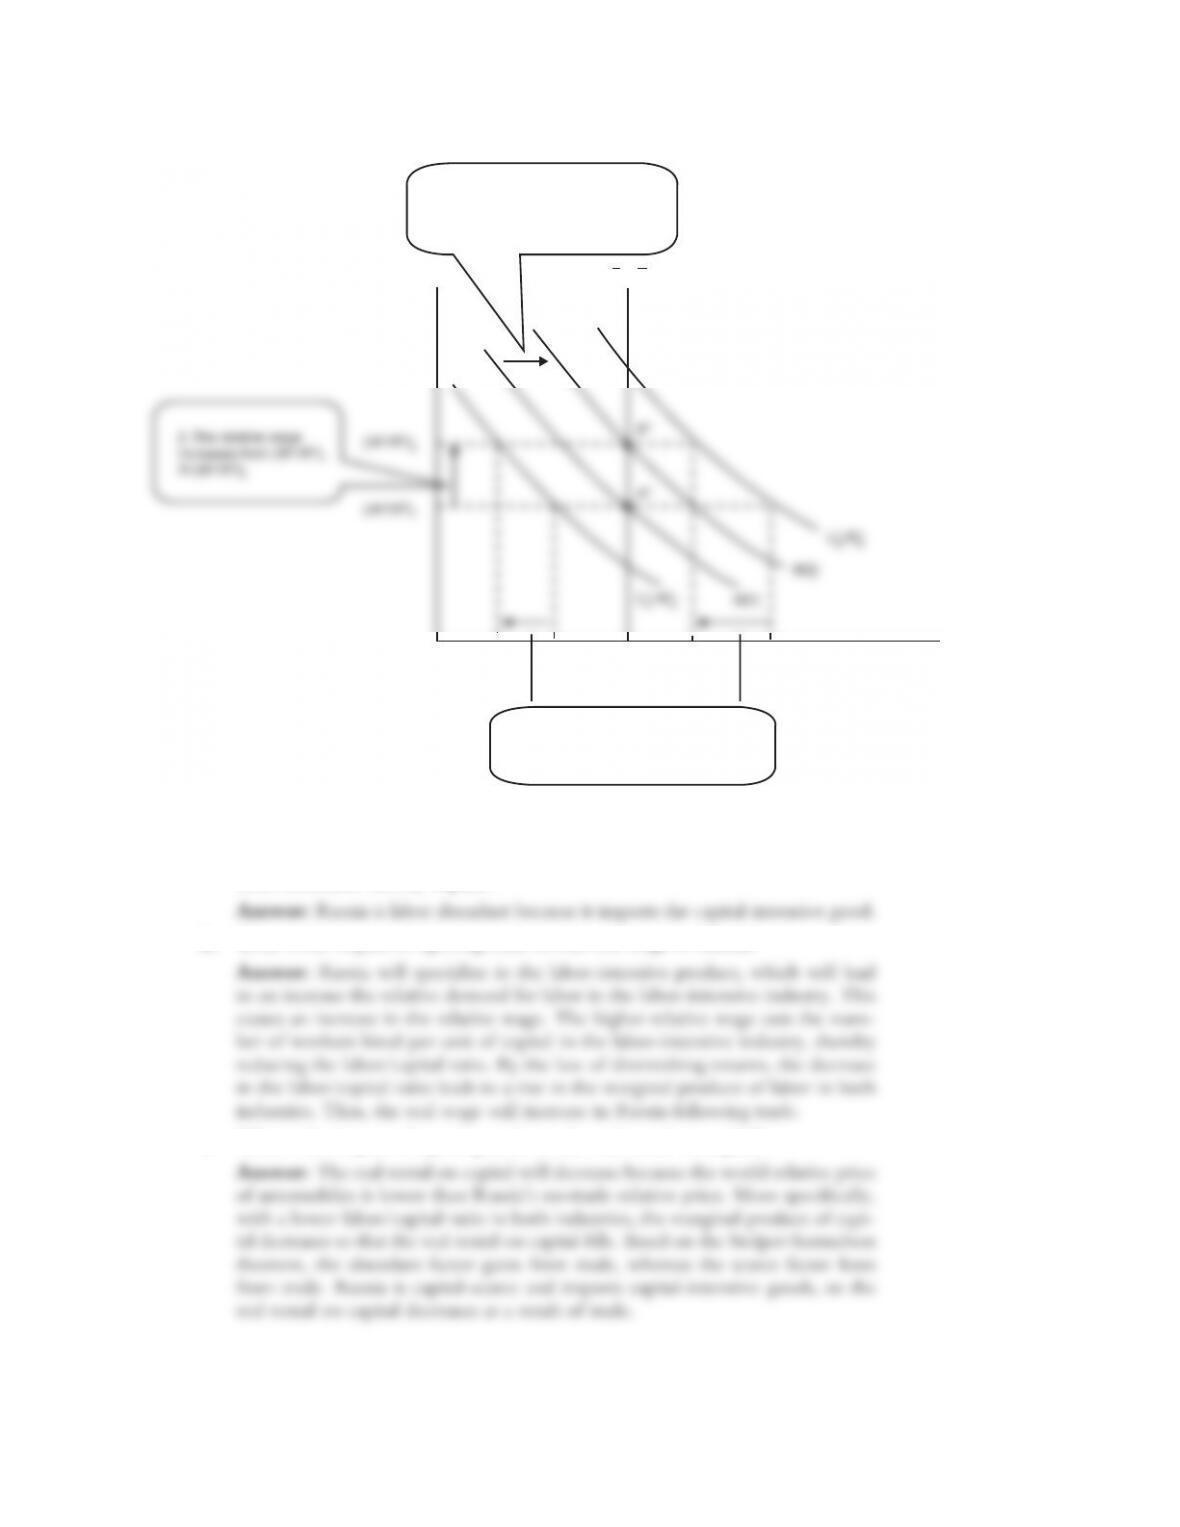
5. Using a diagram similar to Figure 4-12, show the effect of a decrease in the relative
price of computers in Foreign. What happens to the wage relative to the rental? Is
there an increase in the labor/capital ratio in each industry? Explain.
S-34 Solutions n Chapter 4 Trade and Resources: The Heckscher-Ohlin Model
A
A*
QC
QS
6. Suppose when Russia opens to trade, it imports automobiles, a capital-intensive good.
a. According to the Heckscher-Ohlin theorem, is Russia capital-abundant or
labor-abundant? Briefly explain.
c. What is the impact of opening trade on the real rental on capital?
Solutions n Chapter 4 Trade and Resources: The Heckscher-Ohlin Model S-35
Wage/Rental
Labor/Capital
1. Decrease in the relative price of
computers shifts the relative demand
curve from RD* to RD*
3. At the new relative wage, the labor/
capital ratio in each industry decreases
(L* /K* )1
L*/K*
B*
(L*
/K* )2
(L*
/K* )1
(L*
/K * )2
12
S
S
SS
C CCC
d. Which group (capital owner or labor) would support policies to limit free trade?
Briefly explain.
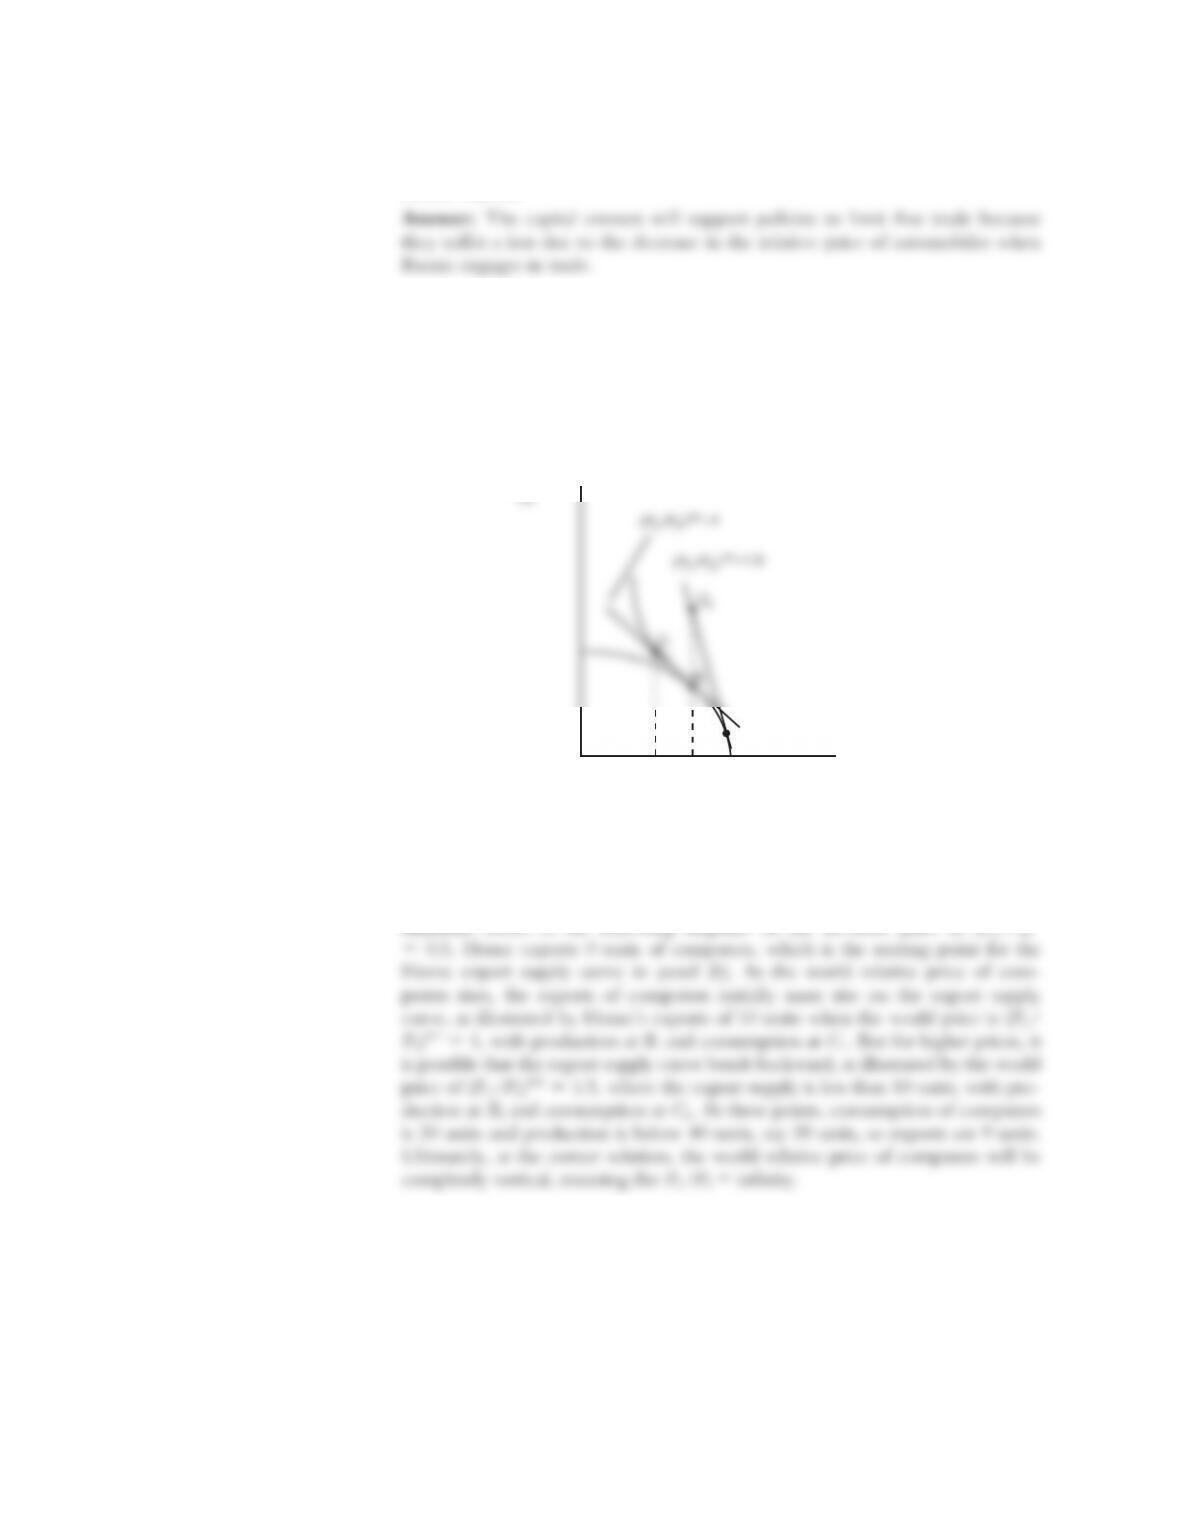
7. In Figure 4-3, we show how the movement from the no-trade equilibrium point
A to a trade equilibrium at a higher relative price of computers leads to an upward
sloping export supply, from points A to D in panel (b).
a. Suppose that the relative price of computers continues to rise in panel (a), and
label the production and consumption points at several higher prices.
Answer: See the following figure.
b. In panel (b), extend the export supply curve to show how the quantity of ex-
ports at the higher relative prices of computers.
A
S-36 Solutions n Chapter 4 Trade and Resources: The Heckscher-Ohlin Model
Output
of shoes,
Relative price
of computers,
PC /PS
Quantity of
computers
Output of
computers, QC
A
D1
C1
C2
B2
B1
D2
(PC /PS )W 1
(PC /PS )W2 1.50
(PC /PS )W1 1.00
(PC /PS )A 0.50
(PC /PS )W 1.5
(b) International Market
(a) Home
Home
exports
Foreign
imports
40302010
15105
0.75
1.25
Heckscher-Ohlin theorem? Which products are inconsistent?
Solutions n Chapter 4 Trade and Resources: The Heckscher-Ohlin Model S-37
Output
of shoes,
QS
Relative price
of computers,
PC /PS
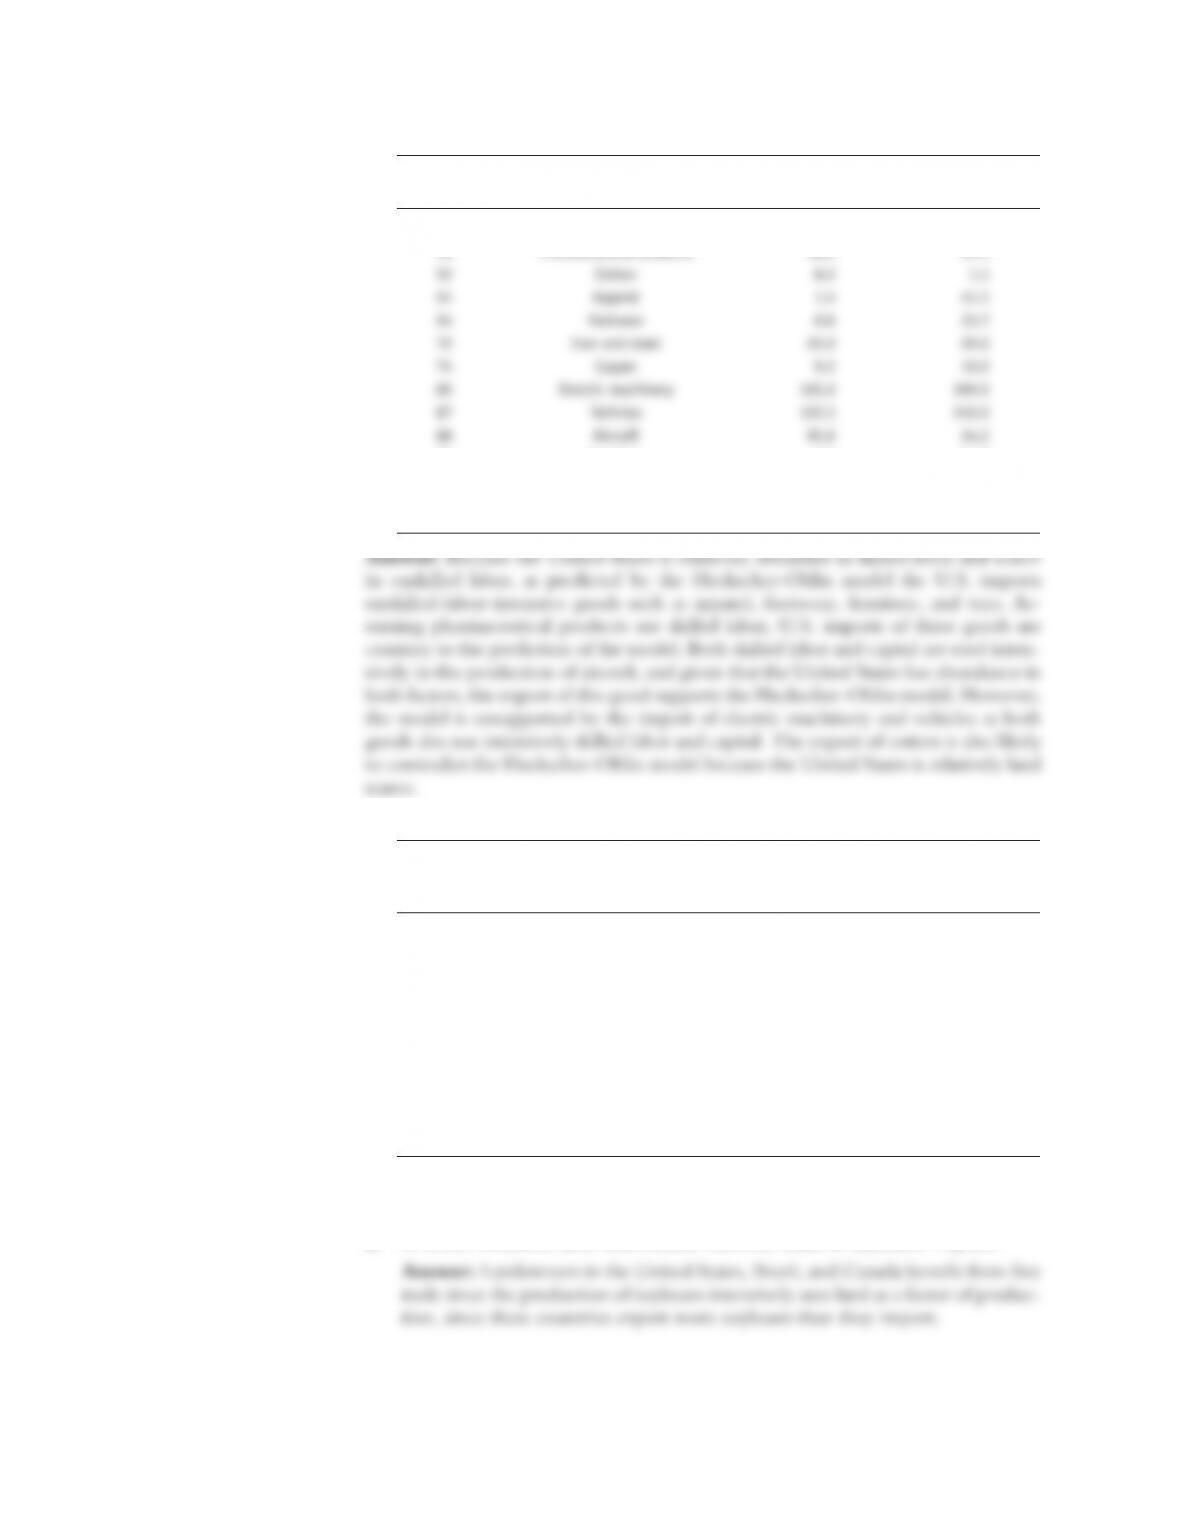
10. Following are data for soybean yield, production, and trade for 2010–2011:
Suppose that the countries listed in the table are engaged in free trade and that soy-
bean production is land-intensive. Answer the following:
S-38 Solutions n Chapter 4 Trade and Resources: The Heckscher-Ohlin Model
Export Import
HTS Level Product ($ billions) ($ billions)
22 Beverages 6.4 19.2
94 Furniture 8.7 44.3
95 Toys 4.4 27.0
Source: International Trade Administration, U.S. Department of Commerce.
Production Export Import
Yield (metric (100,000 (100,000 (100,000
ton/hectare) metric ton) metric ton) metric ton)
Australia 1.71 0.29 0.025 0.007
Brazil 3.12 748.2 258 1.18
Canada 2.75 42.5 27.8 2.42
China 1.89 144 1.64 570
France 2.95 1.23 0.24 5.42
Japan 1.60 2.19 0.0006 34.6
Mexico 1.32 2.05 0.001 37.7
Russian Federation 1.48 17.6 0.008 10.7
United States 2.79 831 423 4.45
Source: Food and Agriculture Organization.
Solutions n Chapter 4 Trade and Resources: The Heckscher-Ohlin Model S-39
c. In which countries does the move to free trade in soybeans have little or no ef-
fect on the land rental? Explain.
11. According to the Heckscher-Ohlin model, two countries can equalize wage differ-
ences by either engaging in international trade in goods or allowing high-skilled and
low-skilled labor to freely move between the two countries. Discuss whether this is
true or false, and explain why.
12. According to the standard Heckscher-Ohlin model with two factors (capital and
labor) and two goods, movement of Turkish migrants to Germany would decrease
the amount of capital-intensive products produced in Germany. Discuss whether this
is true or false, and explain why.