
Trade and Technology:
The Ricardian Model
1. At the beginning of the chapter there is a brief quotation from David Ricardo; here
is a longer version of what Ricardo wrote:
England may be so circumstanced, that to produce the cloth may require the labour of
100 men for one year; and if she attempted to make the wine, it might require the labour
of 120 men for the same time. . . .To produce the wine in Portugal, might require only the
labour of 80 men for one year, and to produce the cloth in the same country, might require
the labour of 90 men for the same time. It would therefore be advantageous for her to export
wine in exchange for cloth. This exchange might even take place, notwithstanding that the
commodity imported by Portugal could be produced there with less labour than in England.
Suppose that the amount of labor he describes can produce 1,000 yards of cloth or
1,000 bottles of wine in either country. Then answer the following:
a. What is England’s marginal product of labor in cloth and in wine, and what is
Portugal’s marginal product of labor in cloth and in wine? Which country has
absolute advantage in cloth and in wine, and why?
b. Use the formula PW/PC 5 MPLC/MPLW to compute the no-trade relative price
of wine in each country. Which country has comparative advantage in wine, and
why?
S-7
2
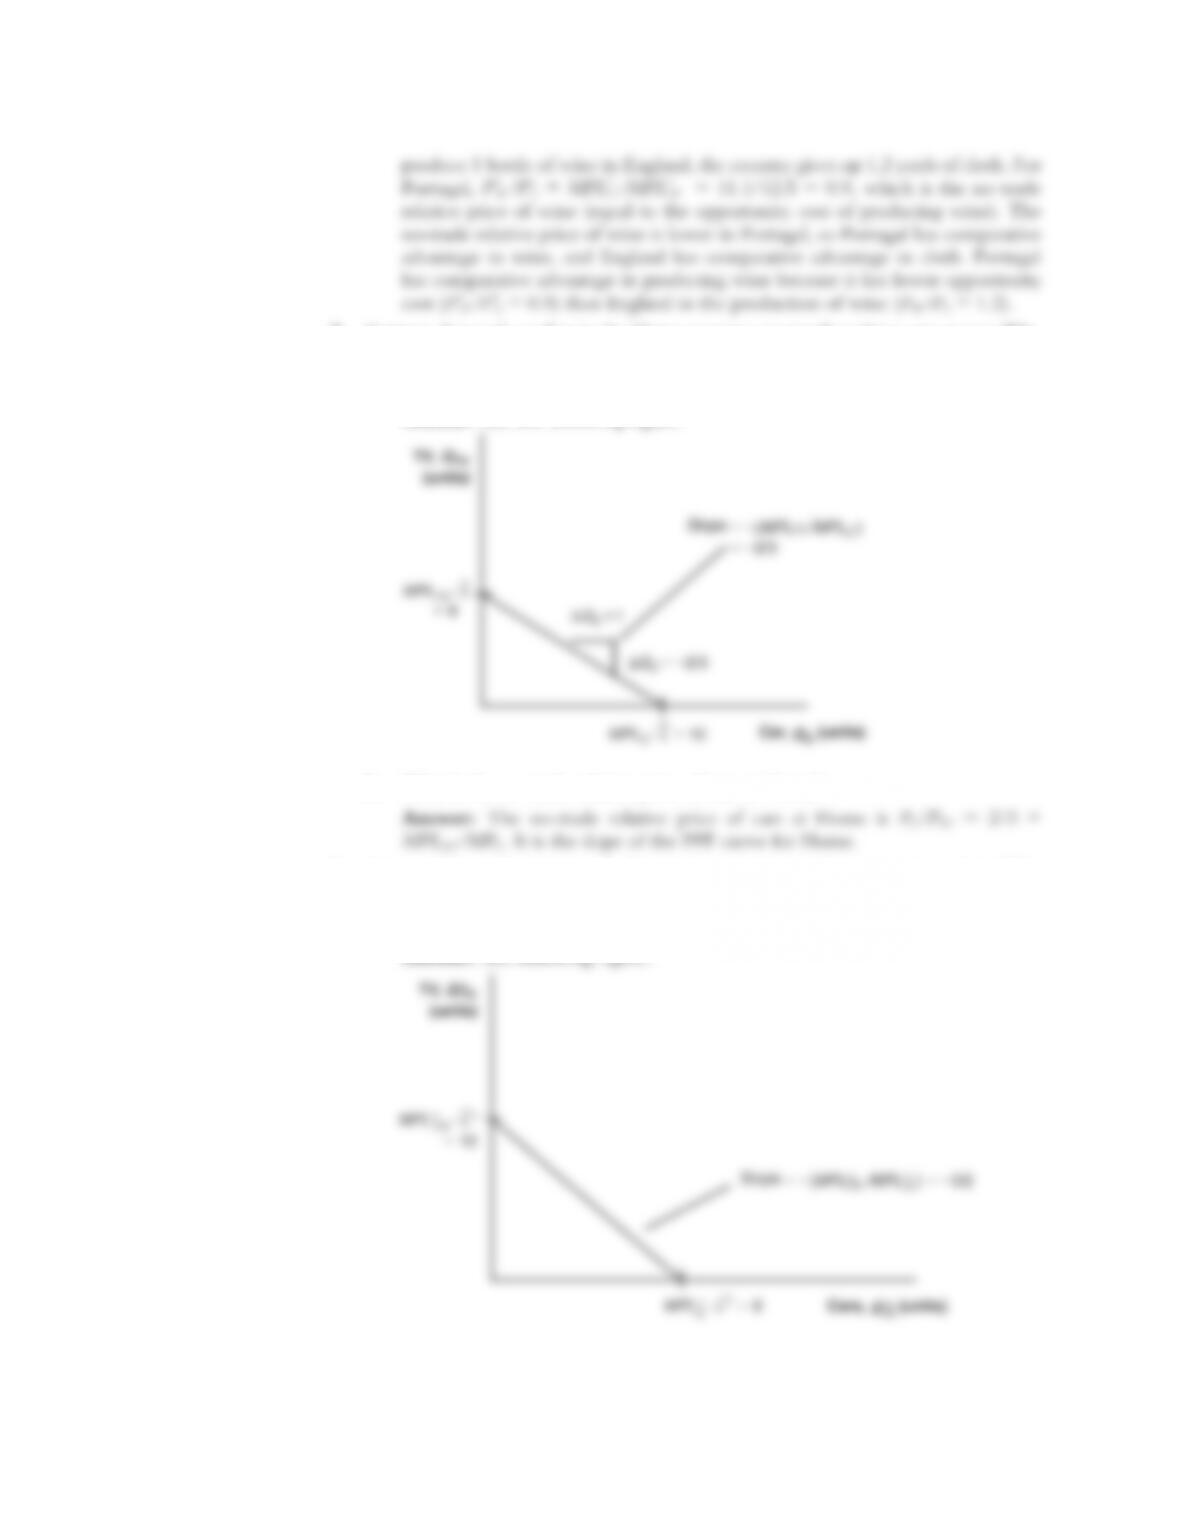
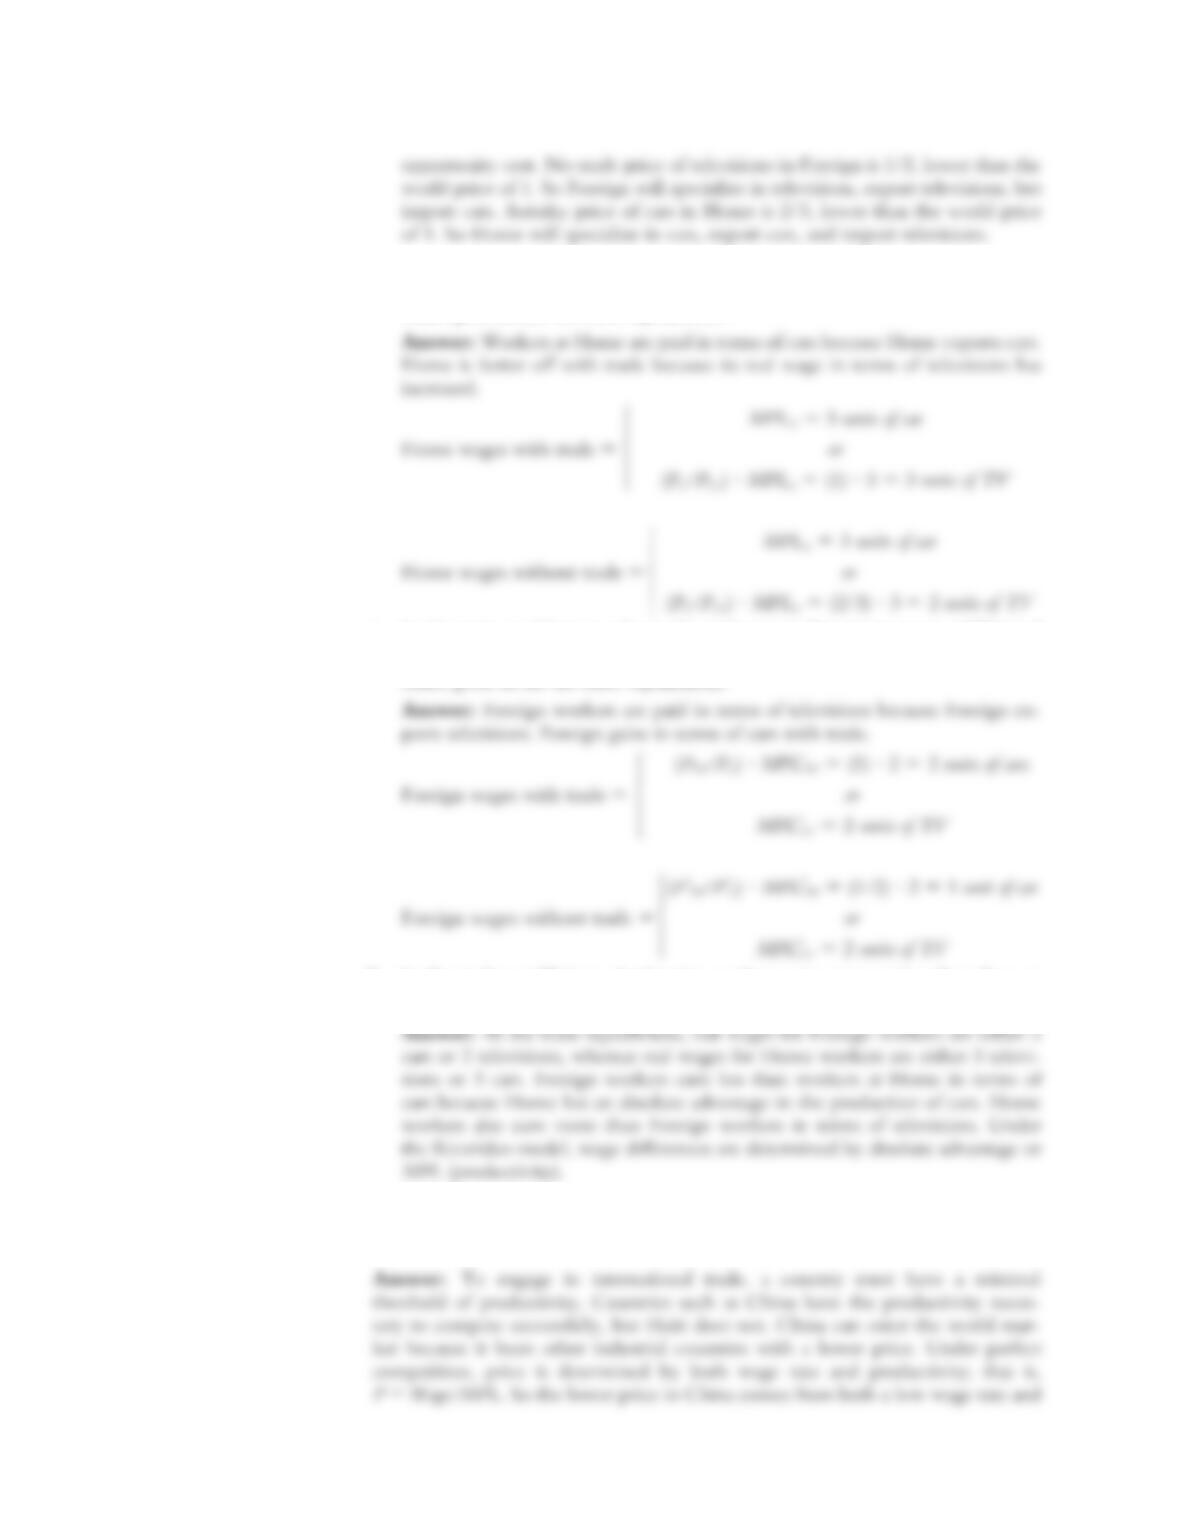
2. Suppose that each worker in the Home country can produce three cars or two TVs.
Assume that Home has four workers.
a. Graph the production possibilities frontier for the Home country.
S-8 Solutions n Chapter 2 Trade and Technology: The Ricardian Model
TV, QTV
(units)
Slope
(
MPLTV /MPLC
)
2/3
Solutions n Chapter 2 Trade and Technology: The Ricardian Model S-9
TV, QTV
(units)
28
Slope
3/2
Car,
Q*
C (units)
PPF *
Foreign
b. What is the no-trade relative price of cars in Foreign?
c. Using the information provided in Problem 2 regarding Home, in which good
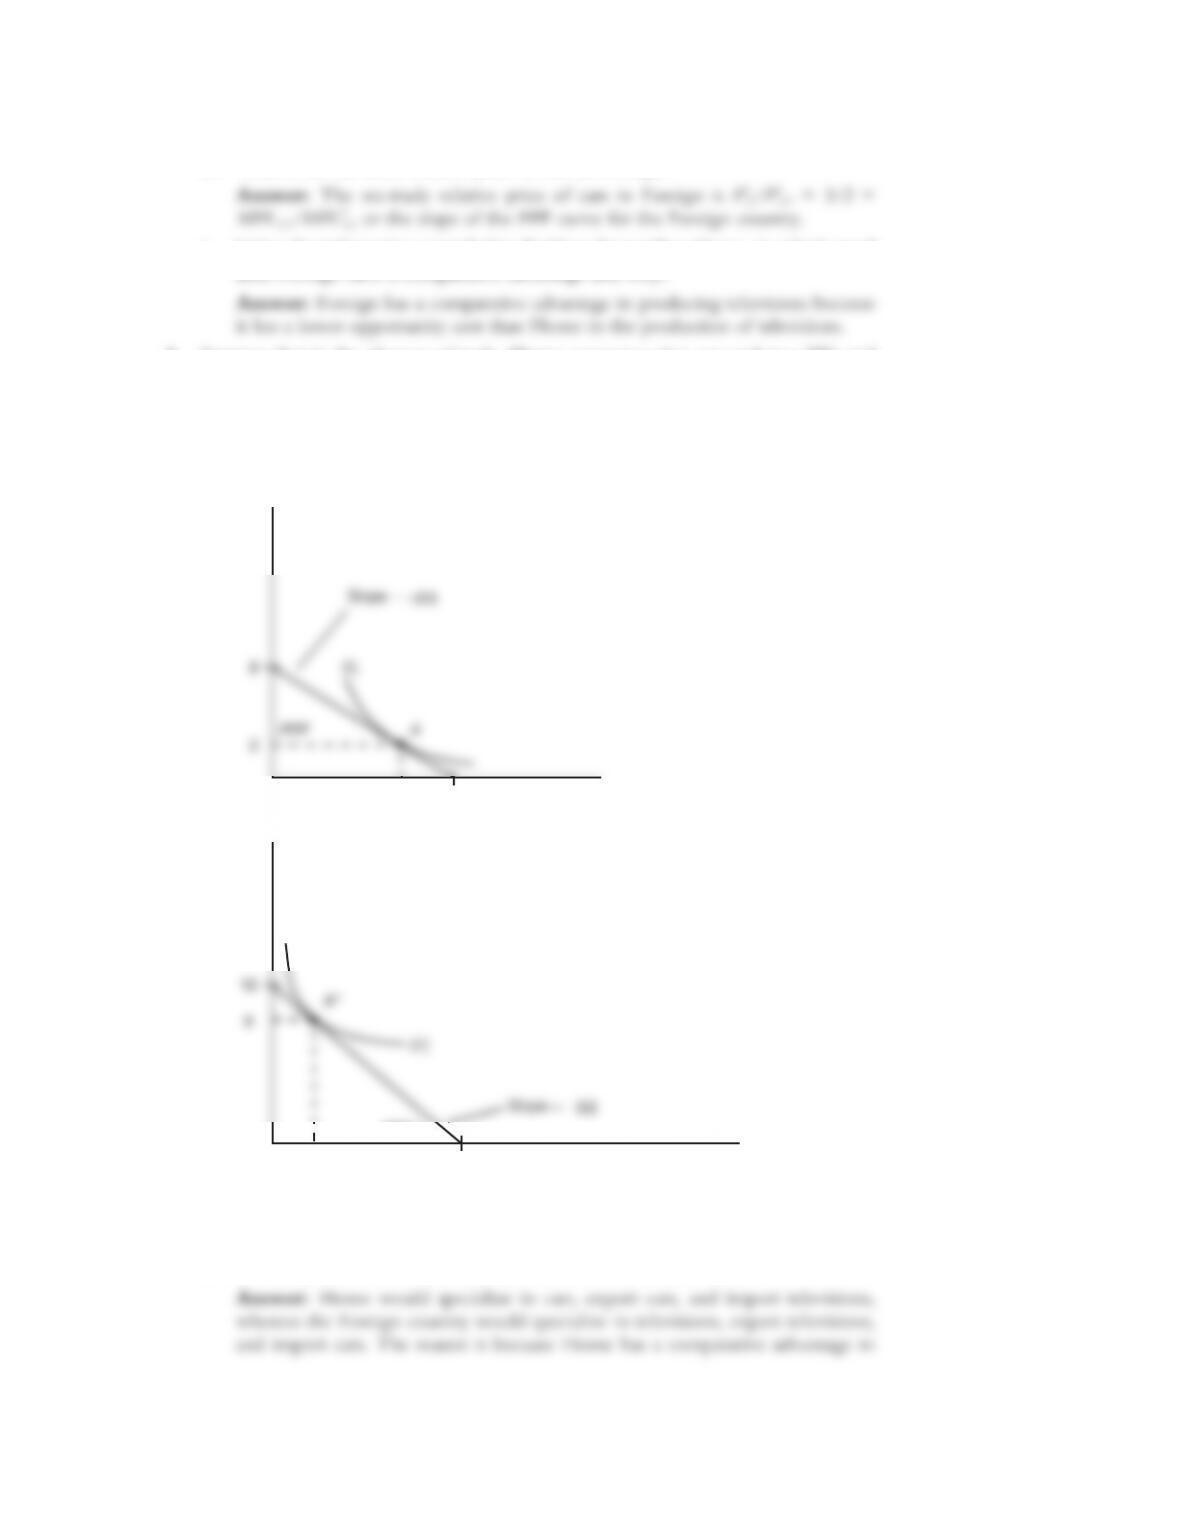
4. Suppose that in the absence of trade, Home consumes nine cars and two TVs and
Foreign consumes two cars and nine TVs. Add the indifference curve for each
country to the figures in Problems 2 and 3. Label the production possibilities fron-
tier (PPF), indifference curve (U1), and the no-trade equilibrium consumption and
production for each country.
Answer: See following figures.
5. Now suppose the world relative price of cars is PC/PTV 5 1.
a. In what good will each country specialize? Briefly explain why.
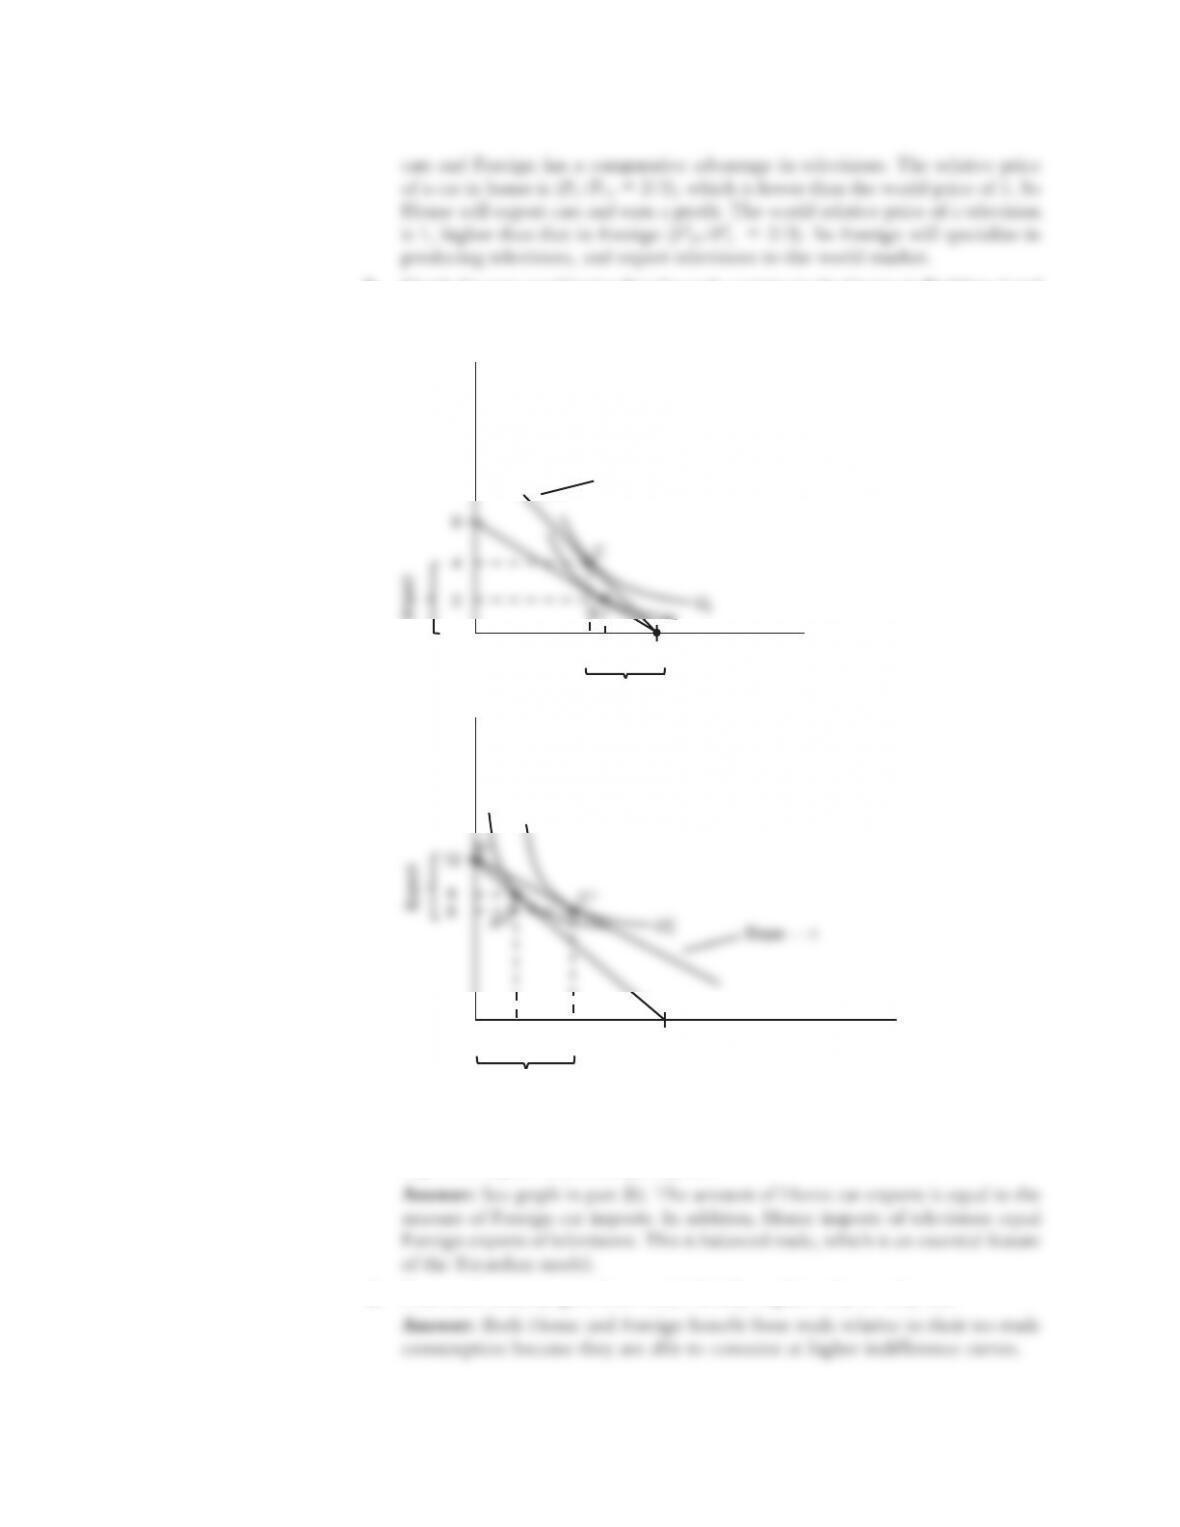
b. Graph the new world price line for each country in the figures in Problem 4 and
add a new indifference curve (U2) for each country in the trade equilibrium.
Answer: See the following figures.
c. Label the exports and imports for each country. How does the amount of Home
exports compare with Foreign imports?
d. Does each country gain from trade? Briefly explain why or why not.
S-10 Solutions n Chapter 2 Trade and Technology: The Ricardian Model
TV, QTV
(units)
4
24 8
Slope
1
C
Cars,
Q*
C (units)
Import
Foreign
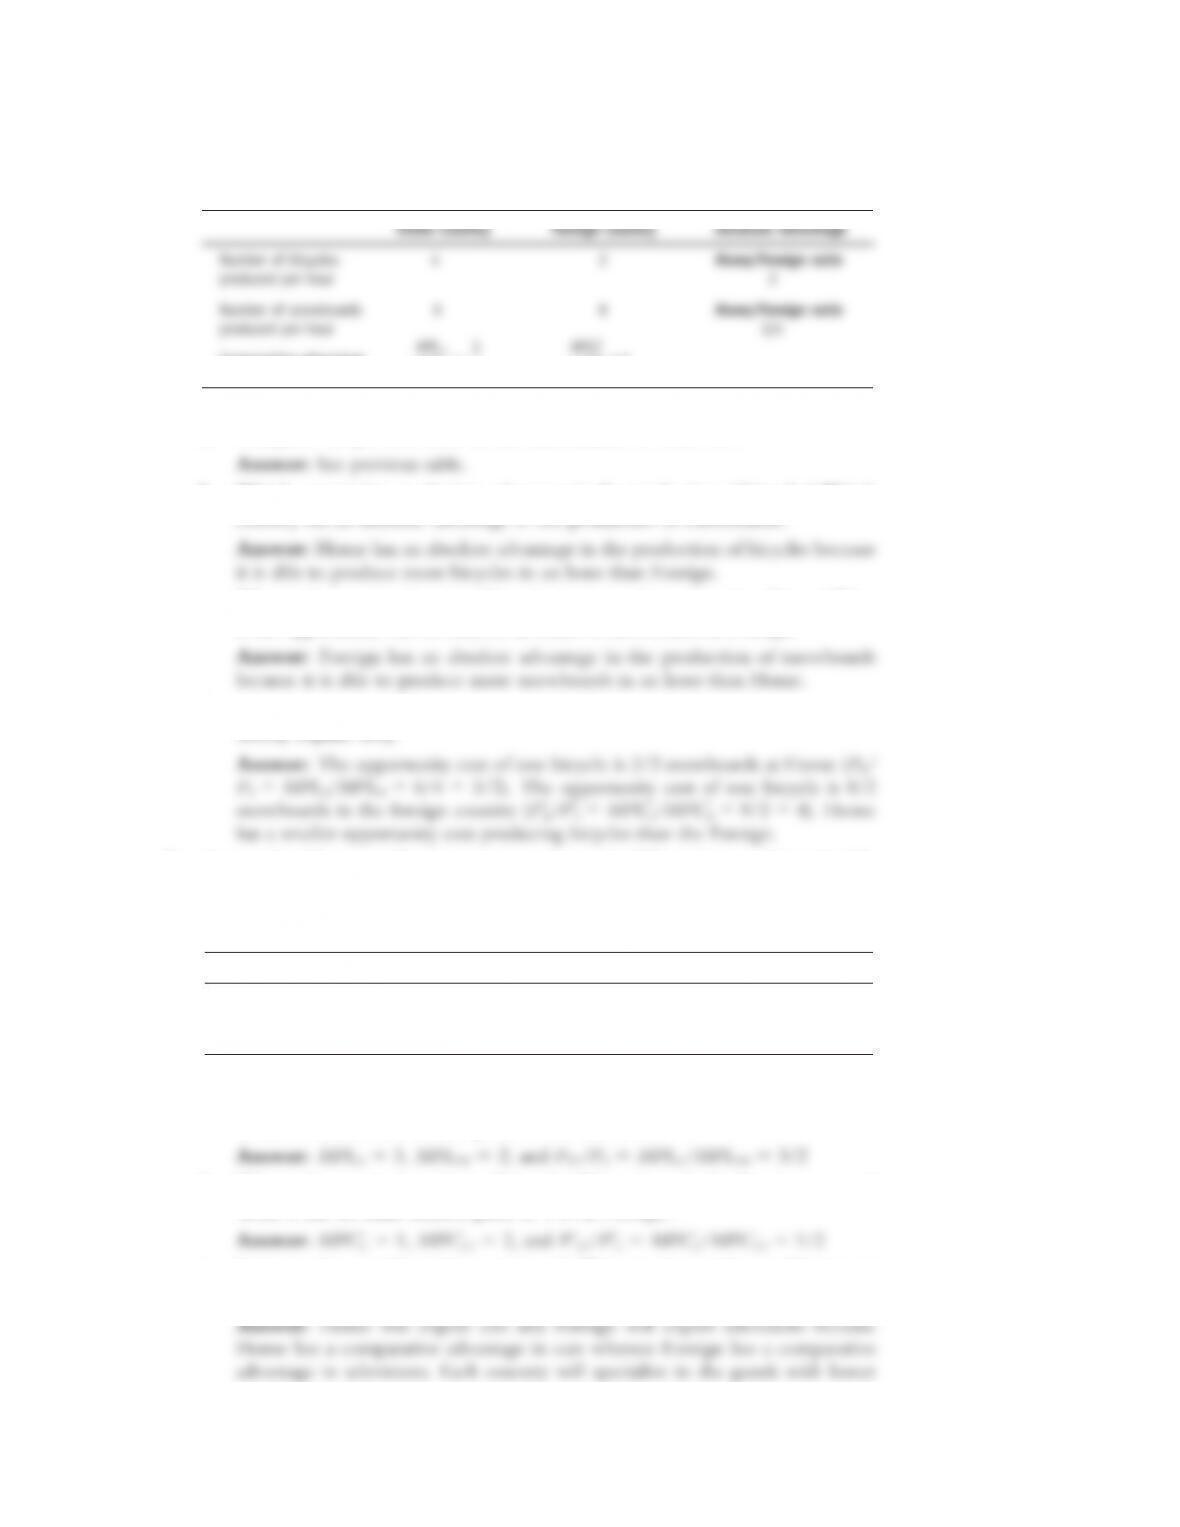
6. Answer the following question using the information given by the accompanying
table.
a. Complete the previous table in the same manner as Table 2-2.
b. Which country has an absolute advantage in the production of bicycles? Which
c. What is the opportunity cost of bicycles in terms of snowboards at Home? What
is the opportunity cost of bicycles in terms of snowboards in Foreign?
d. Which product will Home export, and which product does Foreign export?
7. Assume that Home and Foreign produce two goods, TVs and cars, and use the fol-
lowing information to answer the questions:
a. What is the marginal product of labor for TVs and cars in the Home country?
What is the no-trade relative price of TVs at Home?
b. What is the marginal product of labor for TVs and cars in the Foreign country?
c. Suppose the world relative price of TVs in the trade equilibrium is
PTV/PC 5 1. Which good will each country export? Briefly explain why.
Solutions n Chapter 2 Trade and Technology: The Ricardian Model S-11
Comparative advantage
}
M
P
L
B
5
}
2
}
}
M
P
L
*
B
= 4
In the no-trade equilibrium:
Home Country Foreign Country
WageTV 5 12 WageC 5 ? Wage*
TV 5 ? Wage*
C 5 6
MPLTV 5 2 MPLC 5 ? MPL*
TV 5 ? MPL*
C 5 1
PTV 5 ? PC 5 4 P*
TV 5 3 P*
C 5 ?
d. In the trade equilibrium, what is the real wage at Home in terms of cars and
in terms of TVs? How do these values compare with the real wage in terms of
either good in the no-trade equilibrium?
f. In the trade equilibrium, do Foreign workers earn more or less than those at
Home, measured in terms of their ability to purchase goods? Explain why.
8. Why do some low-wage countries, such as China, pose a threat to manufacturers in
industrial countries, such as the United States, whereas other low-wage countries,
such as Haiti, do not?
S-12 Solutions n Chapter 2 Trade and Technology: The Ricardian Model
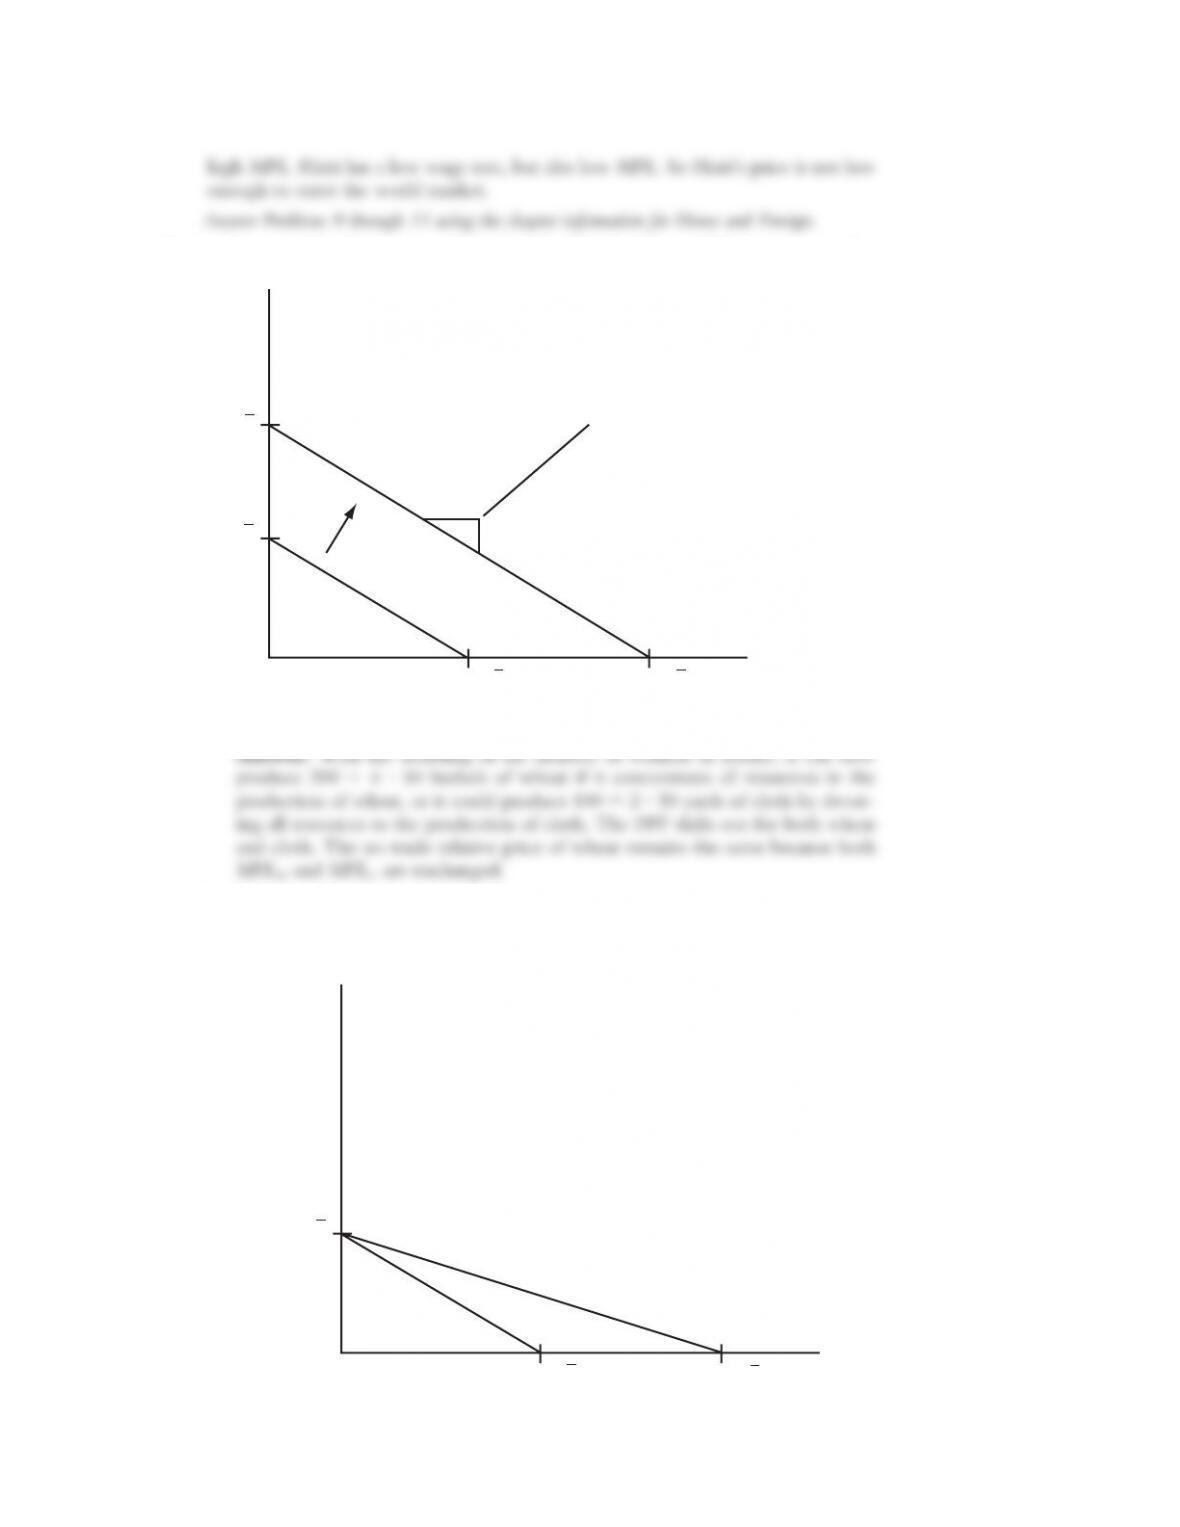
9. a. Suppose that the number of workers doubles in Home. What happens to the
Home PPF and what happens to the no-trade relative price of wheat?
b. Suppose that there is technological progress in the wheat industry such that
Home can produce more wheat with the same amount of labor. What happens
to the Home PPF, and what happens to the relative price of wheat? Describe
what would happen if a similar change occurred in industry.
Solutions n Chapter 2 Trade and Technology: The Ricardian Model S-13
Cloth, QC
(yards)
MPLC ·
L
50
MPLC ·
L
100
MPLW ·
L
100
MPLW ·
L
200
Slope
(
MPLC /MPLW
) 1/2
Wheat,
Q
W (bushels)
Cloth, QC
(yards)
MPLC ·
L
50
MPLW ·
L
100
MPL
W ·
L
200
Wheat,
Q
W (bushels)
Slope = –1/4
Slope = –1/2
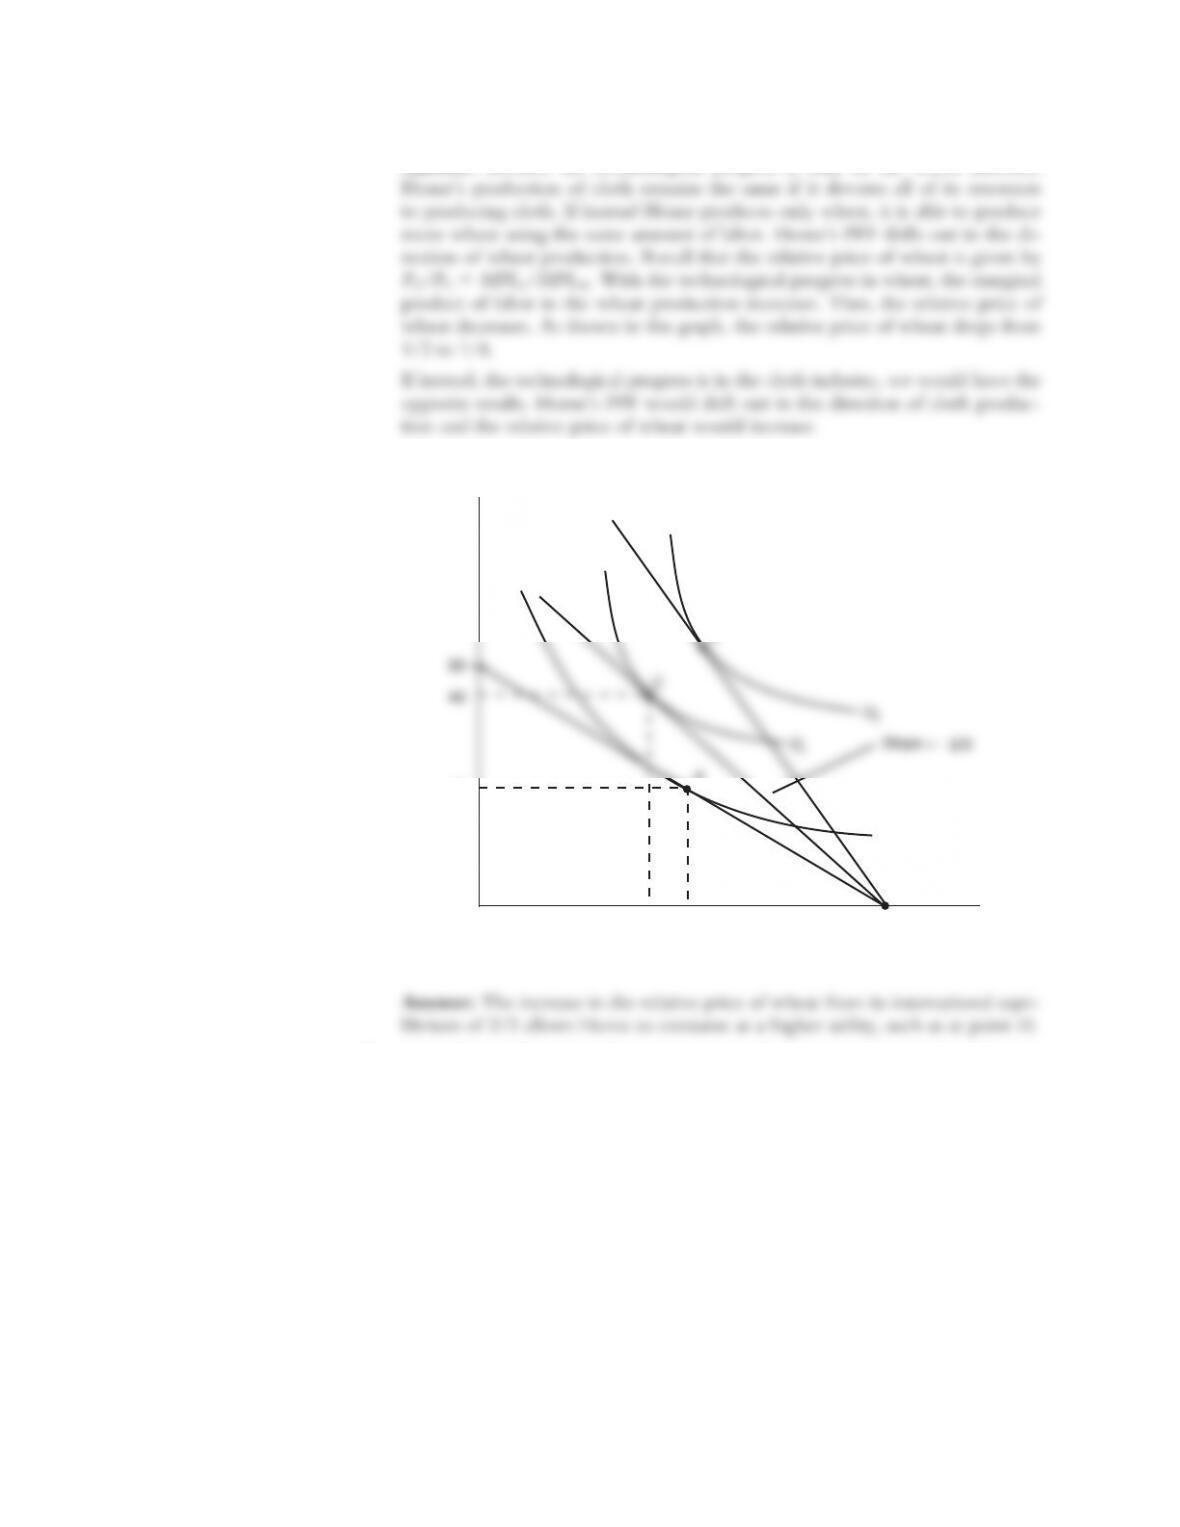
10. a. Using Figure 2-5, show that an increase in the relative price of wheat from its
world relative price of 2/3 will raise Home’s utility.
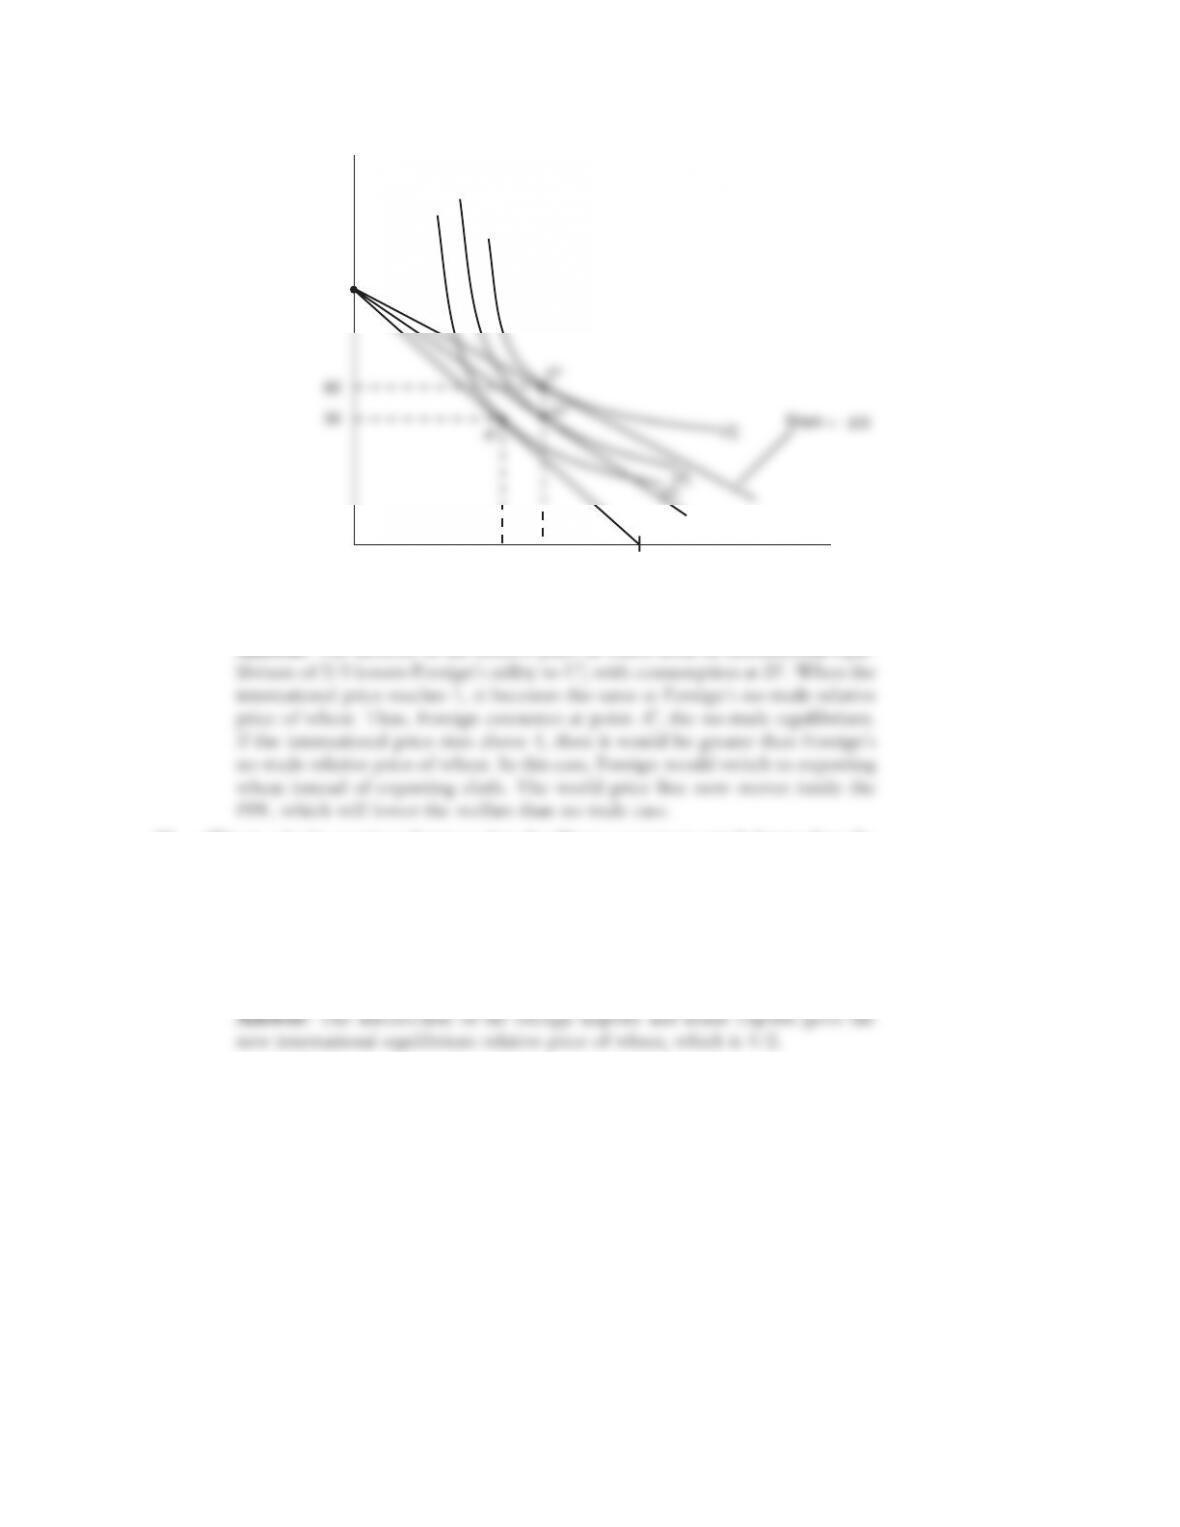
b. Using Figure 2-6, show that an increase in the relative price of wheat from its
world relative price of 2/3 will lower Foreign’s utility. What is Foreign’s utility
when the world relative price reaches 1, and what happens in Foreign when the
world relative price of wheat rises above that level?
S-14 Solutions n Chapter 2 Trade and Technology: The Ricardian Model
Cloth, QC
(yards)
10040
25
50
Slope
2/3
50
40
A
D
B
Wheat,
Q
W (bushels)
U1
U2
U3
Slope
1/2
Slope
1
11. (This is a harder question.) Suppose that the Home country is much larger than the
Foreign country. For example, suppose we double the number of workers at Home
from 25 to 50. Then Home is willing to export up to 100 bushels of wheat at its
no-trade price of PW/PC 5 1/2, rather than 50 bushels of wheat as shown in Figure
2-11. In the following, we draw a new version of Figure 2-11, with the larger Home
country.
a. From this figure, what is the new world relative price of wheat (at point D)?
Solutions n Chapter 2 Trade and Technology: The Ricardian Model S-15
Cloth, Q
*
C
(yards)
100
100
50
60
60
A*
D*
B*
Wheat,
Q*
W
(bushels)
U
*
1
U
*
2
U
*
3
b. Using this new world equilibrium price, draw a new version of the trade equi-
librium in Home and in Foreign, and show the production point and consump-
tion point in each country.
S-16 Solutions n Chapter 2 Trade and Technology: The Ricardian Model
*
Cloth, QC
(yards)
Cloth, Q
*
C
(yards)
200
50
50
60
60
100
180
100
100
B
C*
A*
D*
Wheat,
Q*
W
(bushels)
Slope
1/2
Slope
2/3
100
B
Wheat,
Q
W (bushels)
U
*
2
U
*
3
U
*
1
Home
Foreign
Slope
1/2
PW / PC
50
08
0 100
Wheat
1
Foreign imports Home exports
Solutions n Chapter 2 Trade and Technology: The Ricardian Model S-17
*
Cloth, QC
(yards)
Cloth, Q
*
C
(yards)
200
50
60
100
50
180
100
100
B
D*
Wheat,
Q*
W
(bushels)
Slope
1/2
100
A
B
Wheat,
Q
W (bushels)
U1
Home
Foreign
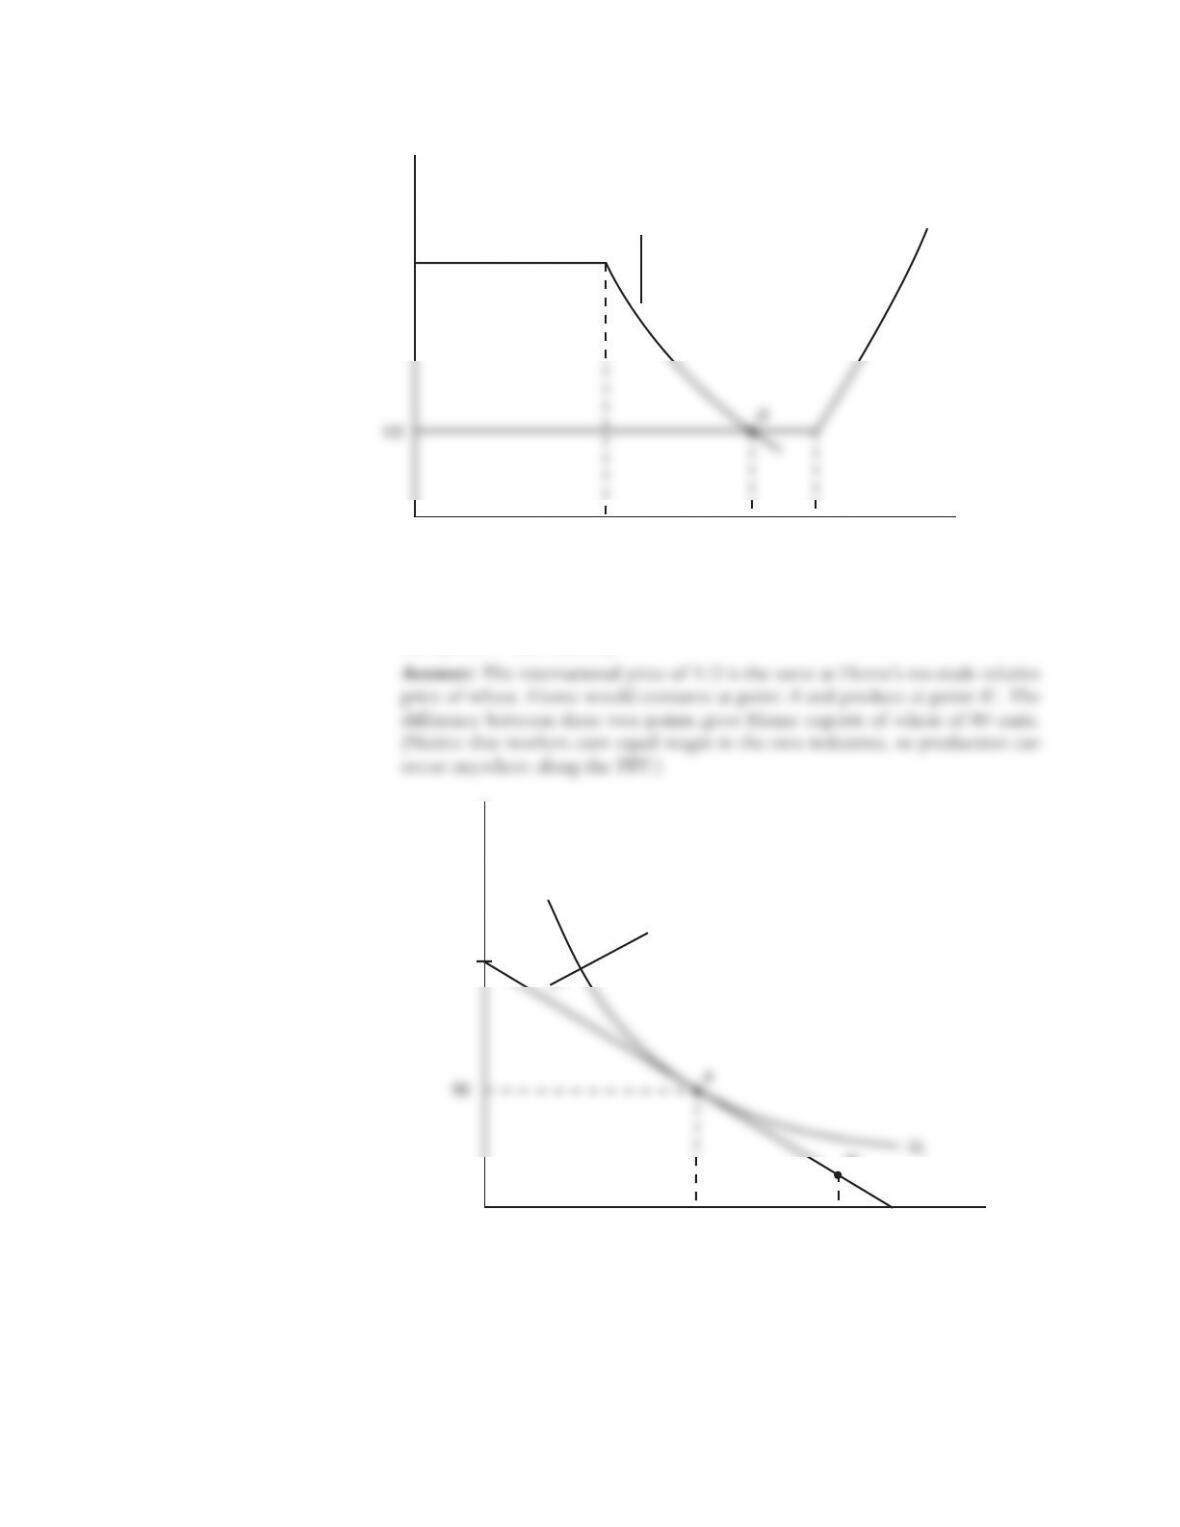
Because the international price of 1/2 is lower than Foreign’s no-trade relative
price of wheat, Foreign is able to consume at point D*, which gives higher gains
from trade than at point C*.
c. Are there gains from trade in both countries? Explain why or why not.
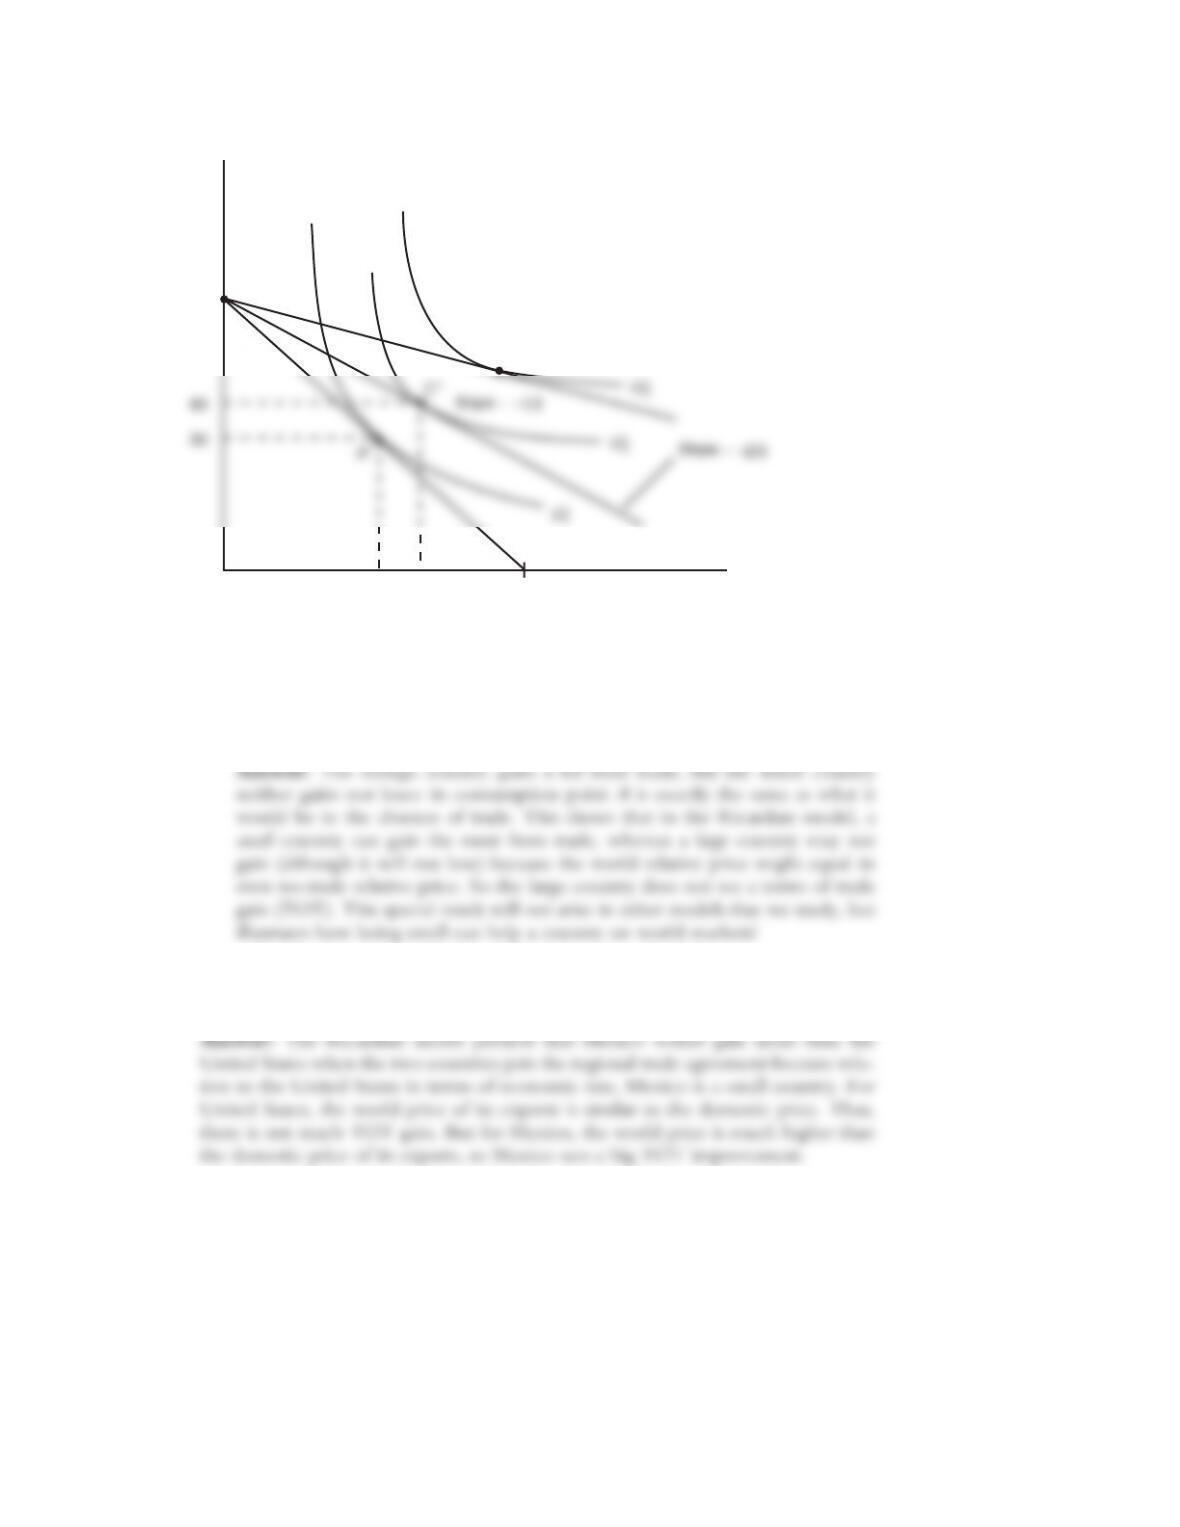
12. Using the results from Problem 11, explain why the Ricardian model predicts that
Mexico would gain more than the United States when the two countries signed the
North American Free Trade Agreement, establishing free trade between them.