Fixed Versus Floating:
International Monetary Experience
1. Using the IS-LM-FX model, illustrate how each of the following scenarios affect the
home country. Compare the outcomes when the home country has a fixed exchange
rate with the outcomes when the home currency floats.
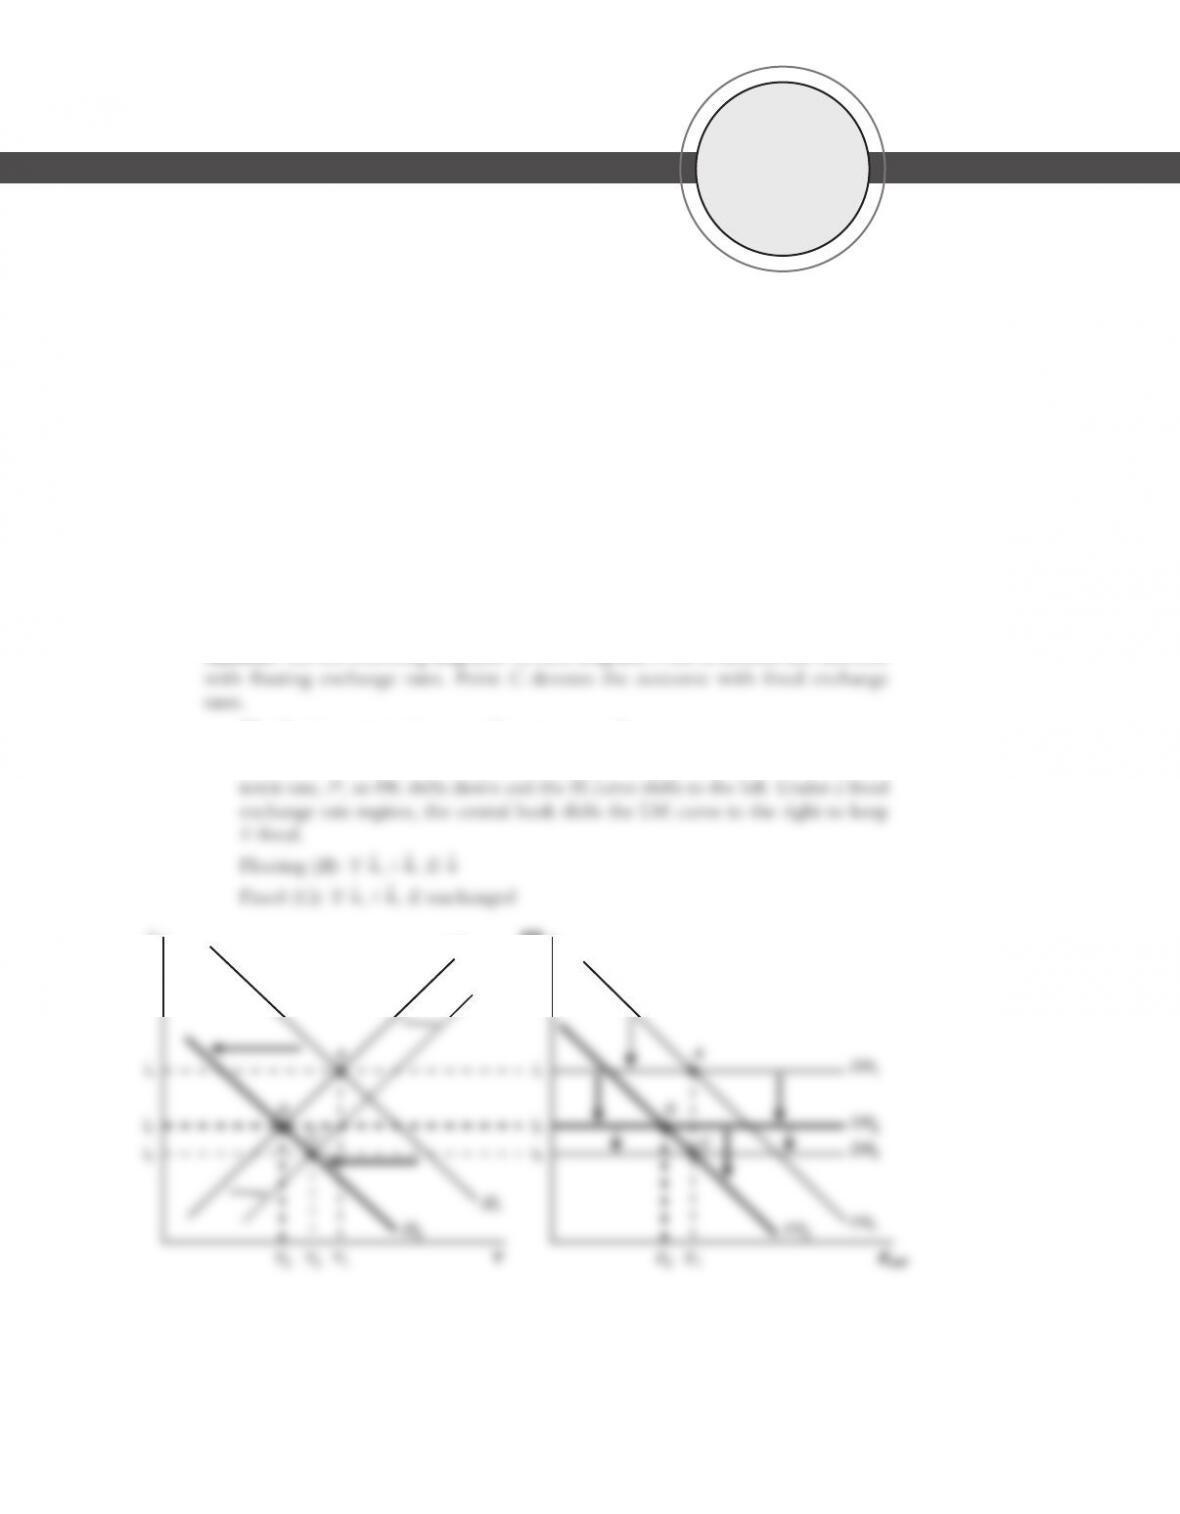
a. The foreign country increases the money supply.
Answer: An increase in foreign money supply leads to a decrease in foreign in–
S-147
iER
i1
i2
i1
i2
Y3Y1
LM3
LM1
Y2EH/F
E1
DR2
DR1
E2
Y
A
B
C
A
B
C
15
S-148 Solutions n Chapter 15 Fixed Versus Floating: International Monetary Experience
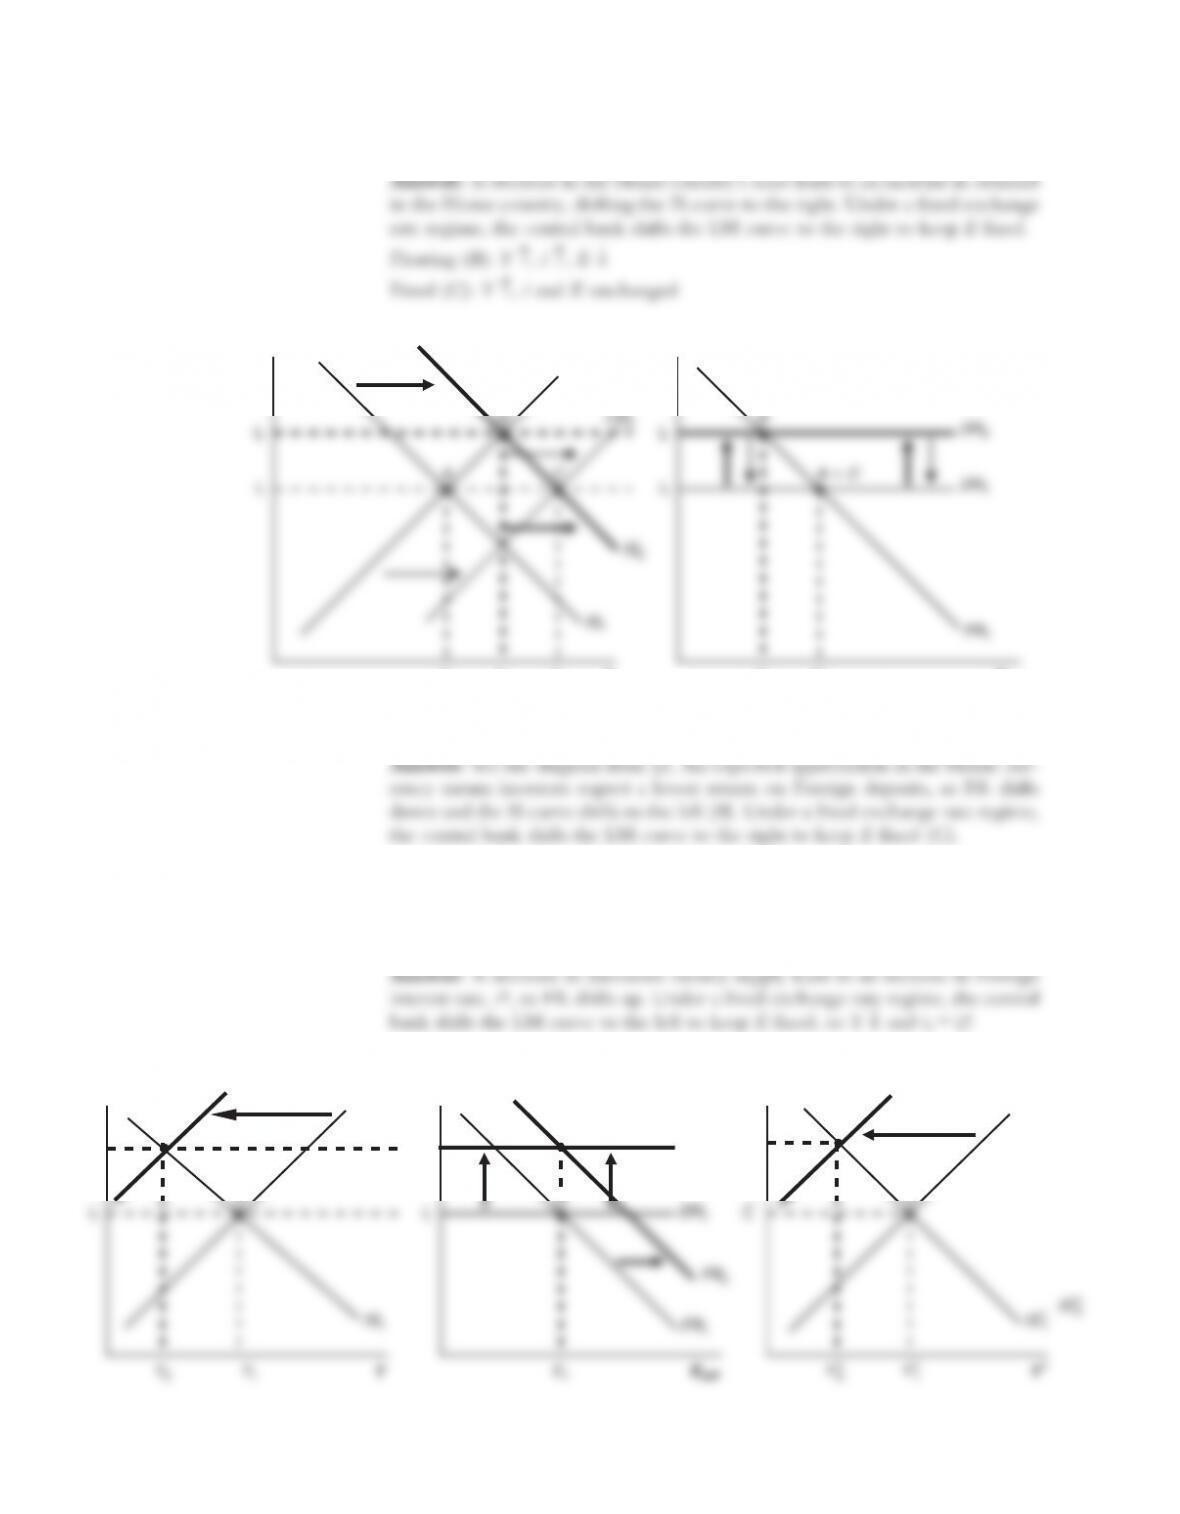
b. The home country cuts taxes.
iER
i2
i2
LM3
LM1
DR2
BB
iER
i1
i
Y1
IS1
LM1
Y2EH/F
E1
FR1
FR2
DR2
DR1
Y
A
B
i1
i2
A
B
i*
i*
1
i*
Y*
1
IS*
1
IS*
2
LM*
2
LM*
1
Y*
2Y*
A
B
LM2
c. Investors expect a future appreciation in the home currency.
2. The Lithuanian lita is currently pegged to the euro. Using the IS-LM-FX model
for Home (Lithuania) and Foreign (Eurozone), illustrate how each of the following
scenarios affect Lithuania:
a. The Eurozone reduces its money supply.
Answer: A decrease in Eurozone money supply leads to an increase in Foreign
interest rate, i*, so FR shifts up. Under a fixed exchange rate regime, the central
bank shifts the LM curve to the left to keep E fixed, so Y ↓ and i2 5 i2
*.
iER
i2
i2
LM3
LM1
DR2
AA C
BB
C
iER
i
2
Y1
IS1
LM1
Y2EH/F
E1
FR1
FR2
DR2
Y
B
i2
B
i*
i*
2
Y*
1
IS*
1
IS*
2
LM*
2
LM*
1
Y*
2Y*
B
LM2
Solutions n Chapter 15 Fixed Versus Floating: International Monetary Experience S-149
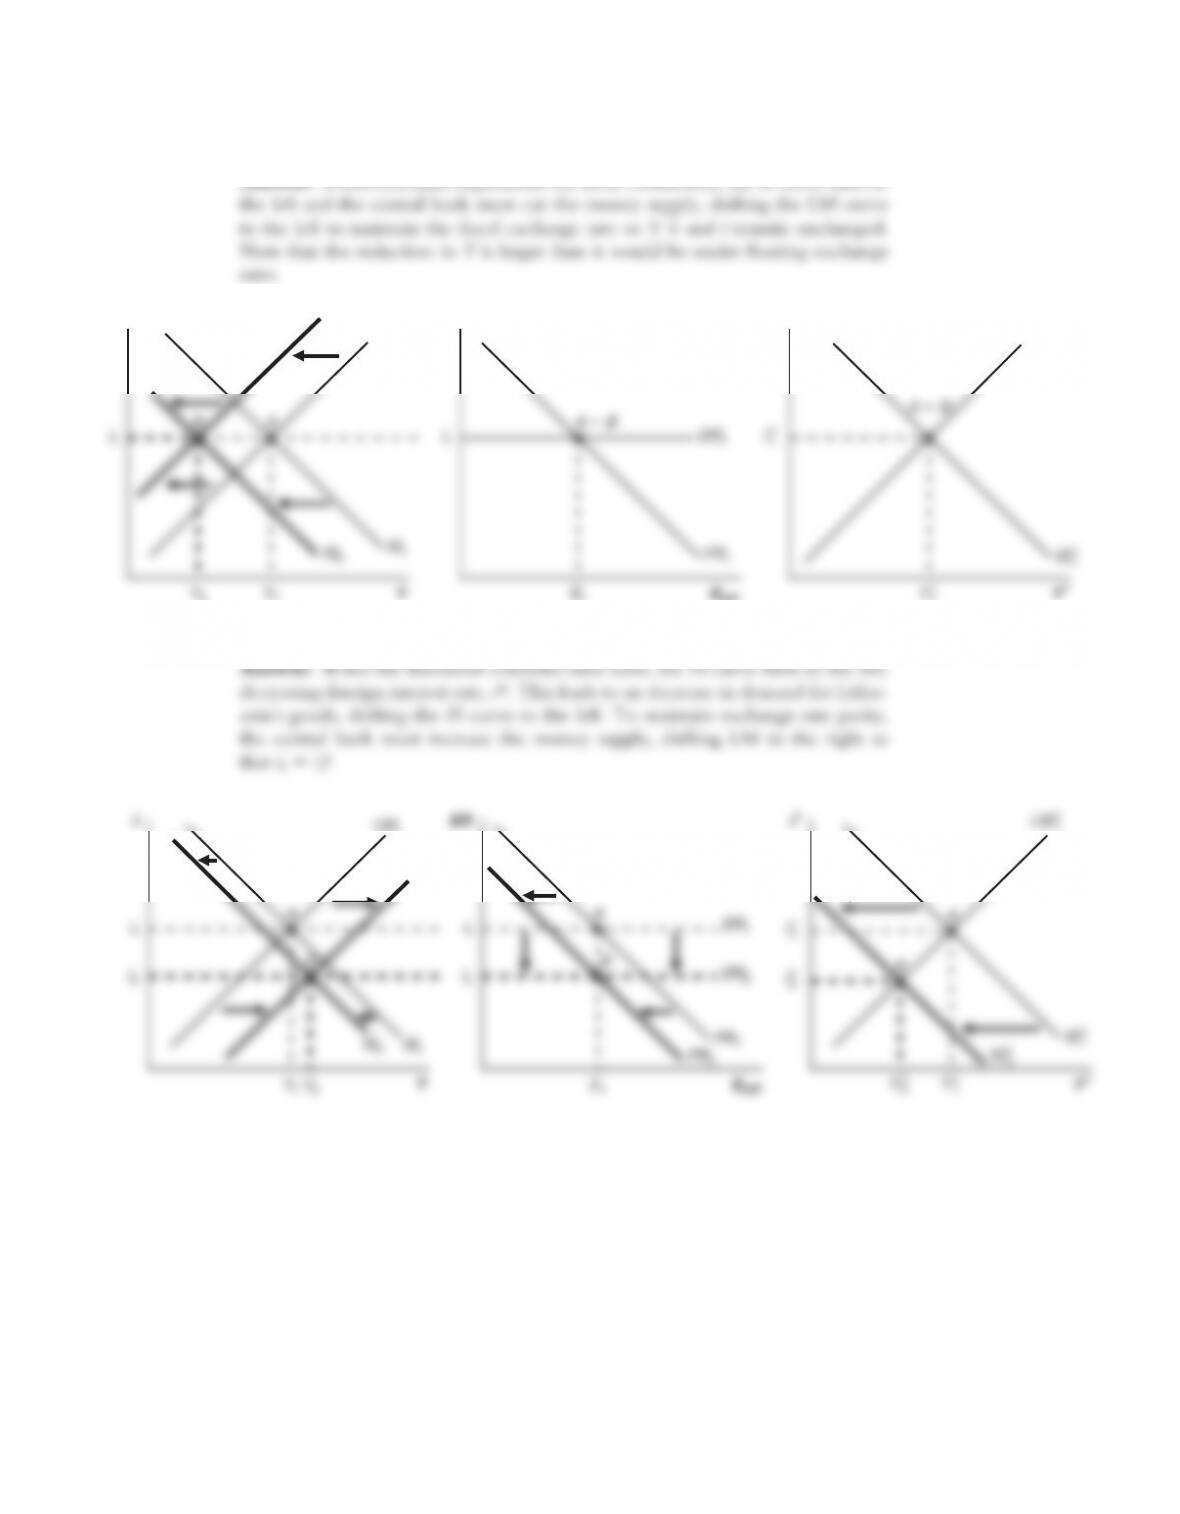
b. Lithuania cuts government spending to reduce its budget deficit.
c. The Eurozone countries increase their taxes.
iER
Y1
LM2
LM1
LM*
1
Y2EH/F
E1
YY*
1Y*
A
B
A B
i*
Y1
IS1
IS2
IS*
1
IS*
2
Y2EH/F
E1
FR1
FR2
YY*
1Y*
Y*
2
iER
i1
LM1
LM*
1
DR1
A
B
i1
A B
i*
i*
A B
Y1
IS*
2
Y2EH/F
E1
FR2
YY*
1Y*
Y*
2
S-150 Solutions n Chapter 15 Fixed Versus Floating: International Monetary Experience
3. Consider two countries that are currently pegged to the euro: Lithuania and Comoros.
Lithuania is a member of the European Union, allowing it to trade freely with other
European Union countries. Exports to the Eurozone account for the majority of Lith–
uania’s outbound trade, which mainly consists of manufacturing goods, services, and
wood. In contrast, Comoros is an archipelago of islands off the eastern coast of south–
ern Africa that exports food commodities primarily to the United States and France.
Comoros historically maintained a peg with the French franc, switching to the euro
when France joined the Eurozone. Compare and contrast Lithuania and Comoros in
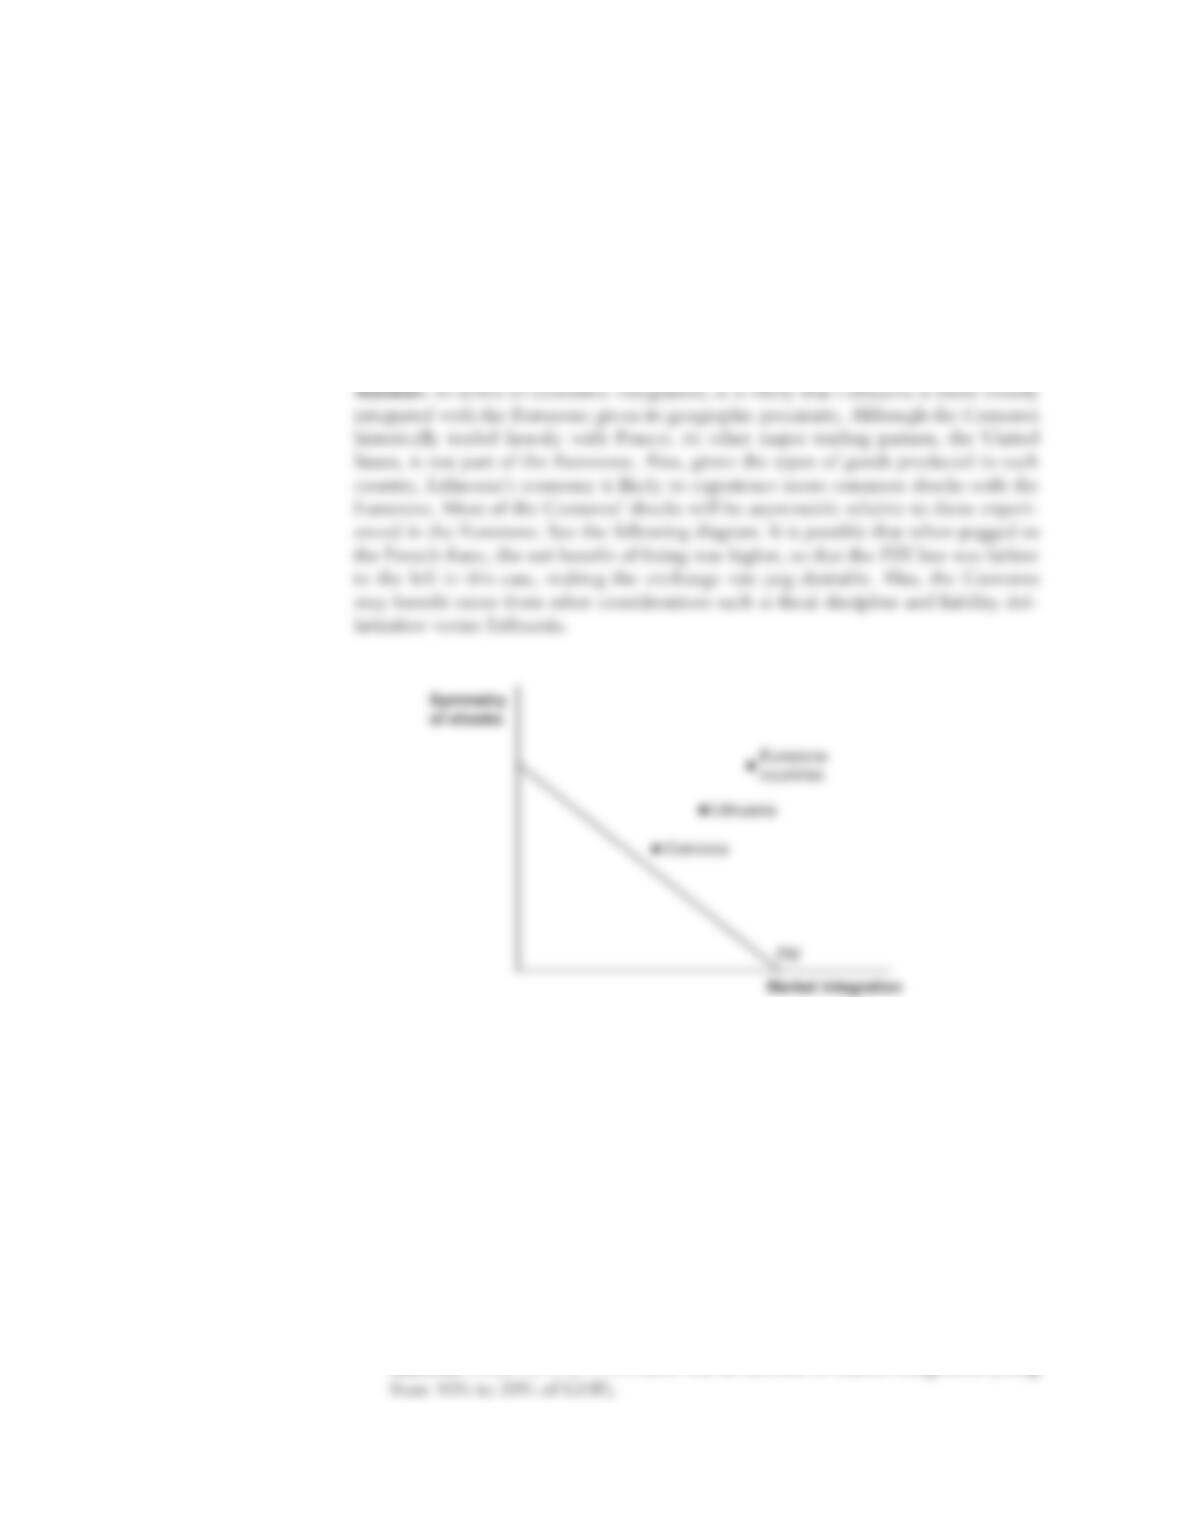
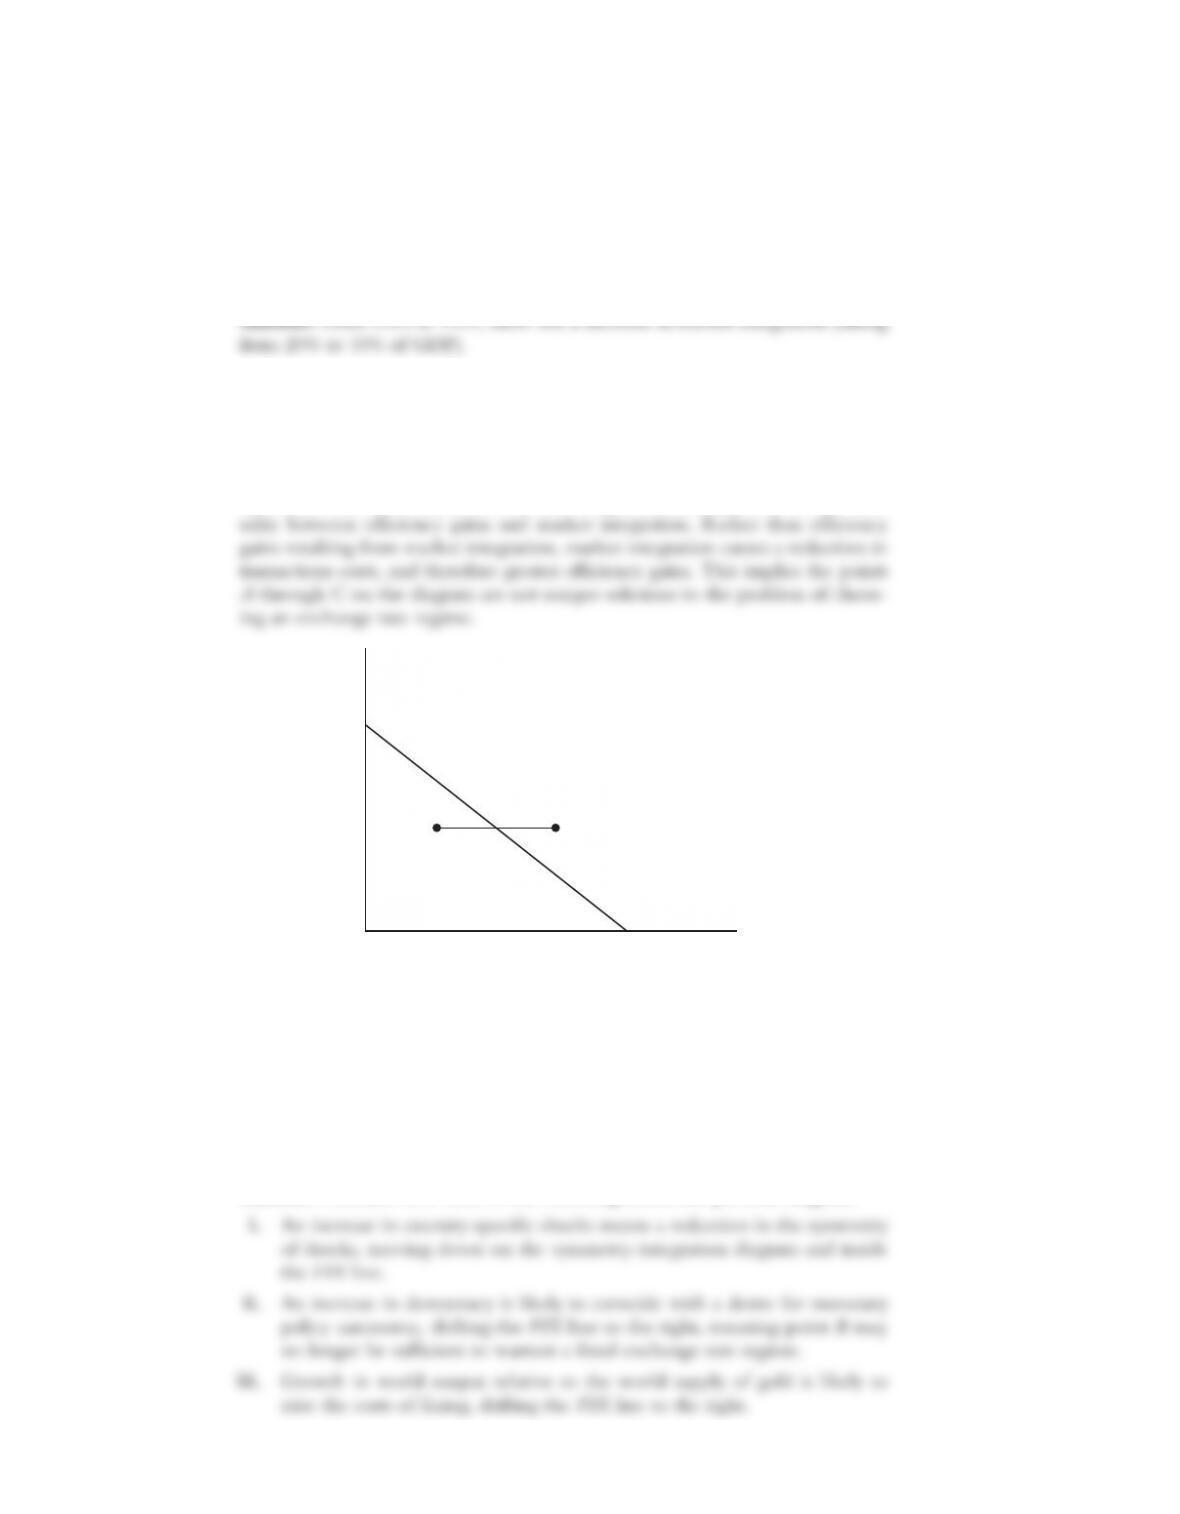
terms of their likely degree of integration symmetry with the Eurozone. Plot Comoros
and Lithuania on a symmetry-integration diagram as in Figure 15-4.
4. Use the symmetry-integration diagram as in Figure 15-4 to explore the evolution of
international monetary regimes from 1870 to 1939—that is, during the rise and fall
of the gold standard.
See the following diagram.
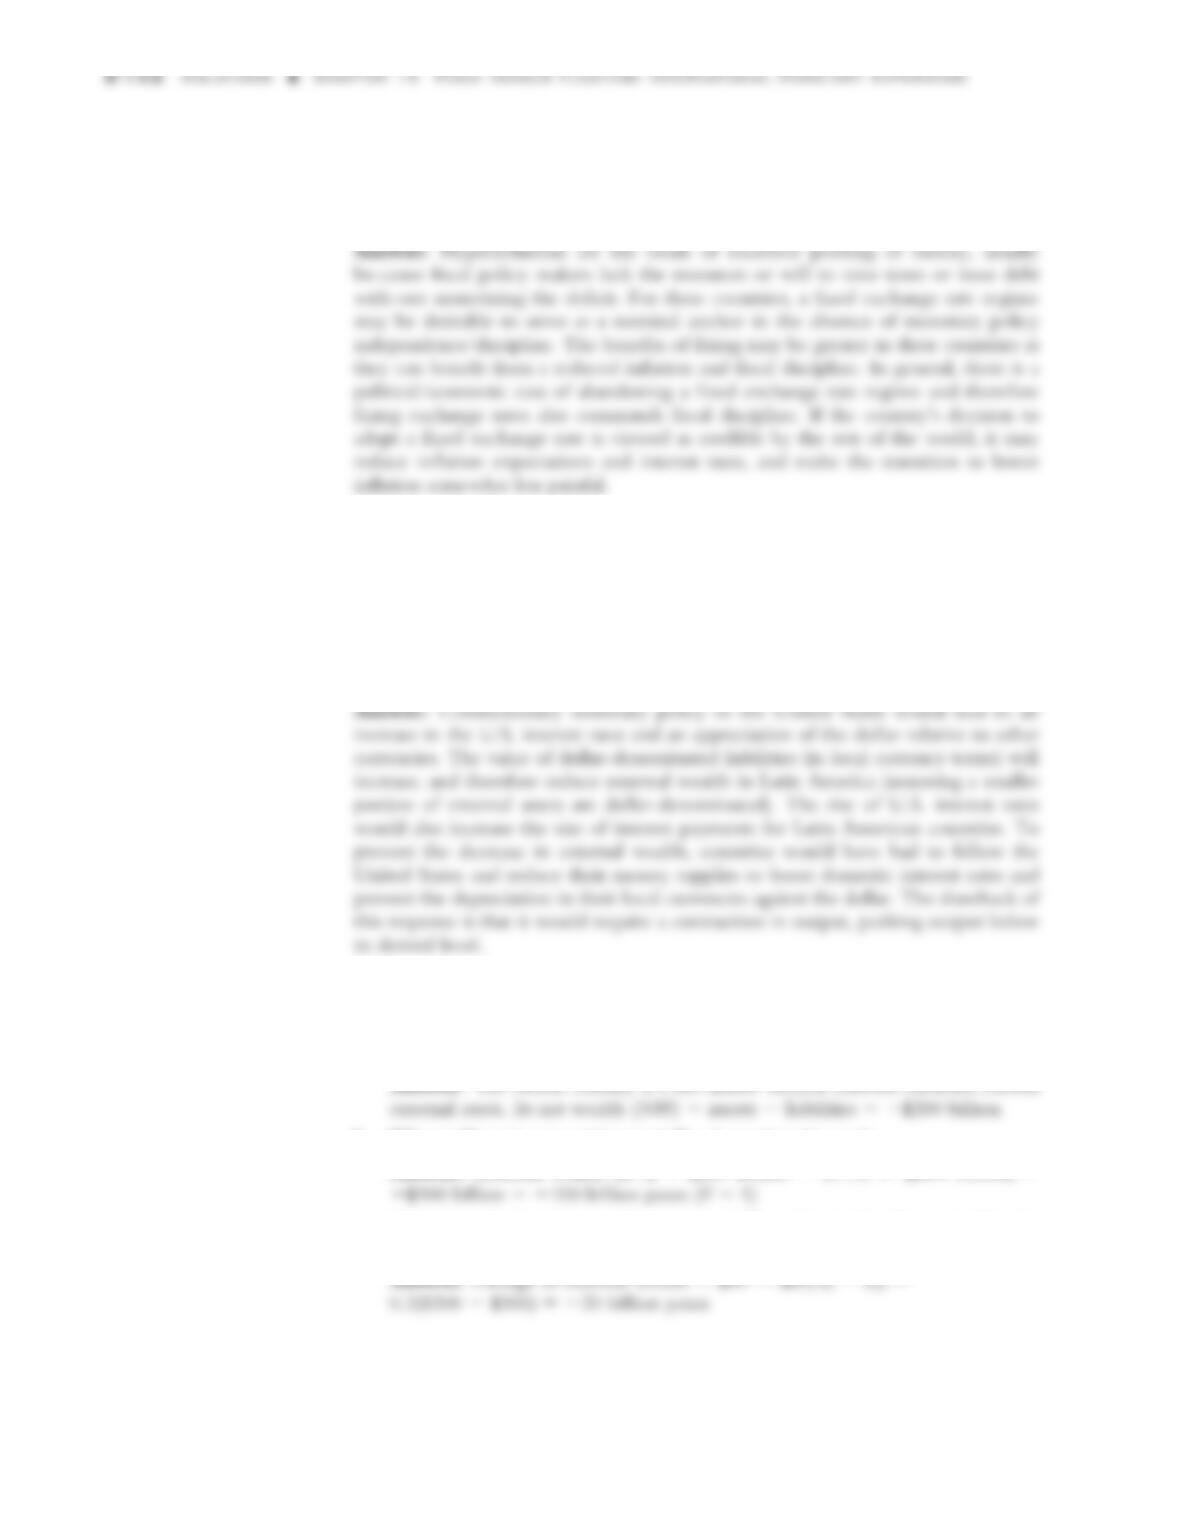
a. From 1870 to 1913, world trade flows doubled in size relative to GDP, from
about 10% to 20%. Many economic historians think this was driven by ex-
ogenous declines in transaction costs, some of which were caused by changes
in transport technology. How would you depict this shift for a pair of countries
in the symmetry-integration diagram that started off just below the FIX line in
1870? Use the letter A to label your starting point in 1870 and use B to label
the end point in 1913.
Answer: From 1870 to 1913, there was an increase in market integration (rising
from 10% to 20% of GDP).
Symmetry
of shocks
Market integration
Comoros
Lithuania
Eurozone
countries
FIX
Solutions n Chapter 15 Fixed Versus Floating: International Monetary Experience S-151
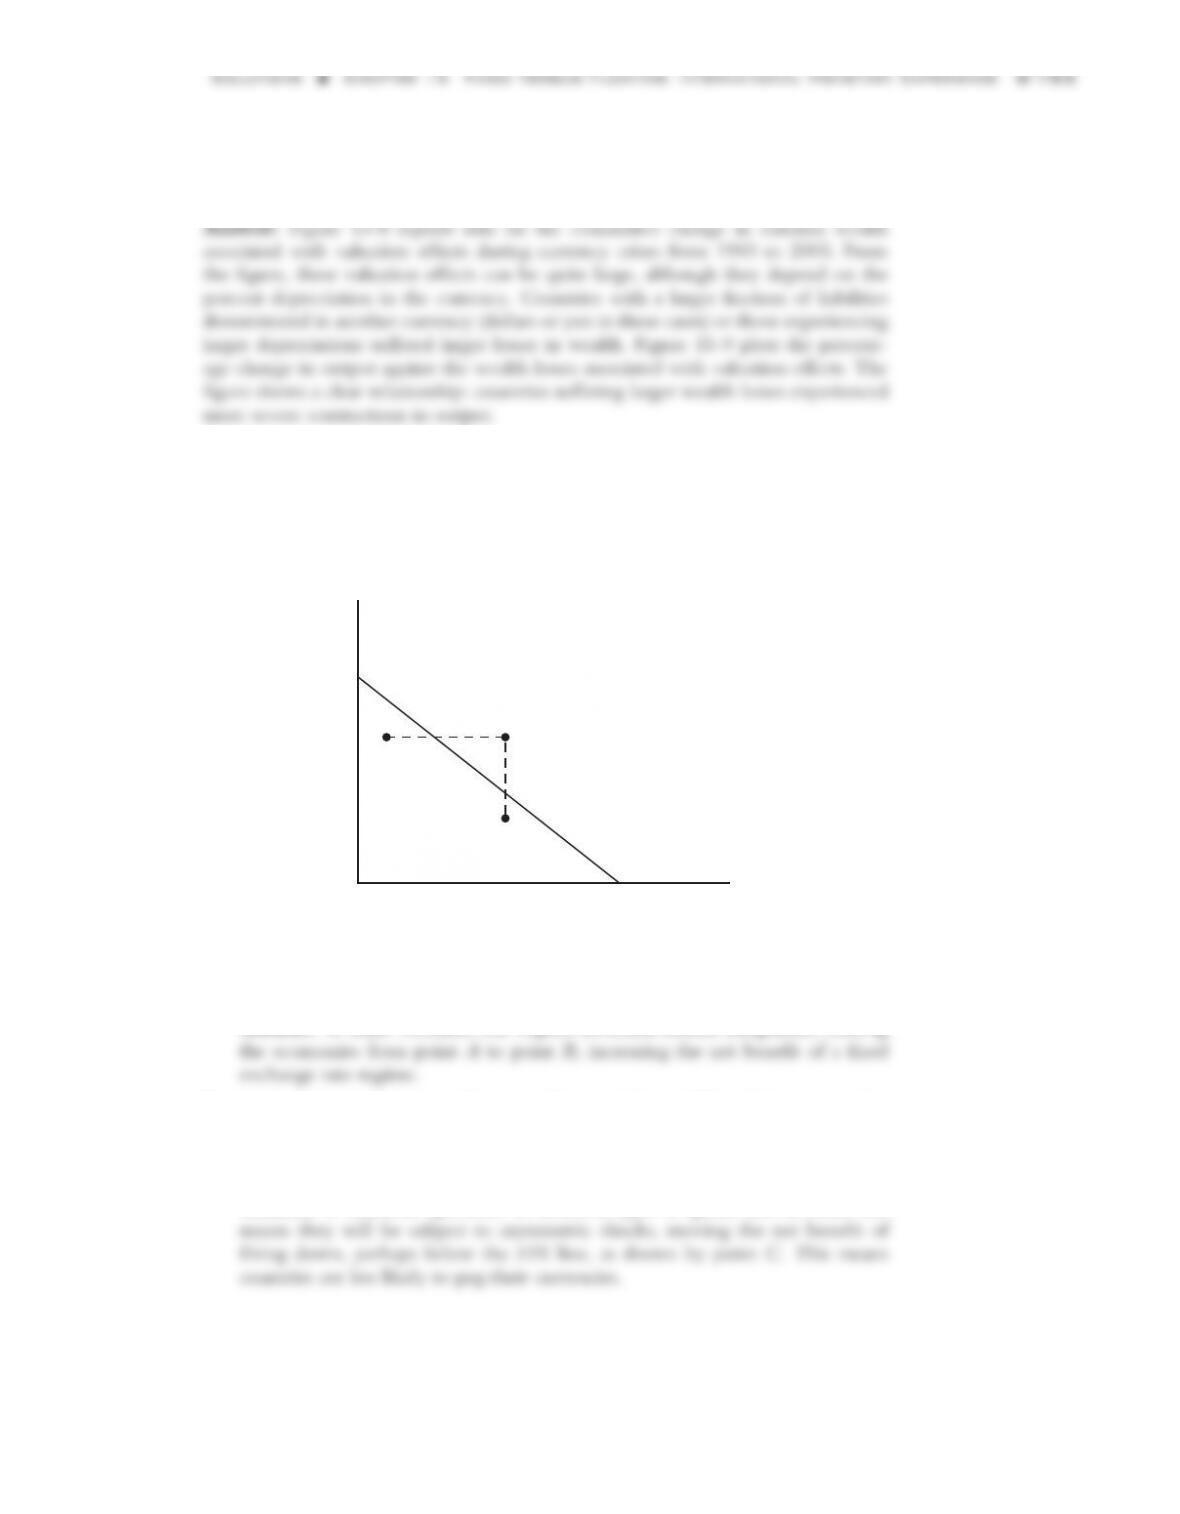
b. From 1913 to 1939, world trade flows collapsed, falling in half relative to GDP,
from about 20% back to 10%. Many economic historians think this was driven
by exogenous increases in transaction costs from rising transport costs and in-
creases in tariffs and quotas. How would you depict this shift for a pair of coun-
tries in the symmetry-integration diagram that started off just above the FIX line
in 1913? Use the letter B to label your starting point in 1913 and use C to label
the end point in 1939.
c. Other economic historians contend that these changes in transaction costs arose
endogenously. When countries went on the gold standard, they lowered their
transaction costs and boosted trade. When they left gold, costs increased. If this
is true, then do points A, B, and C represent unique solutions to the problem
of choosing an exchange rate regime?
Answer: If the costs themselves are not exogenous, this implies a reverse cau-
d. Changes in other factors in the 1920s and 1930s had an impact on the sustain-
ability of the gold standard. These included the following:
i. An increase in country-specific shocks
ii. An increase in democracy
iii. Growth of world output relative to the supply of gold
In each case, explain why these changes might have undermined commitment
to the gold standard.
Answer: Consider how each of the following affects the previous diagram:
Symmetry
of shocks
Market integration
AB
C
FIX
5. Many countries experiencing high and rising inflation, or even hyperinflation, will
adopt a fixed exchange rate regime. Discuss the potential costs and benefits of a fixed
exchange rate regime in this case. Comment on fiscal discipline, seigniorage, and
expected future inflation.
6. In the late 1970s, several countries in Latin America, notably Mexico, Brazil, and
Argentina, had accumulated large external debt burdens. A significant share of this
debt was denominated in U.S. dollars. The United States pursued contractionary
monetary policy from 1979 to 1982, raising dollar interest rates. How would this
affect the value of the Latin American currencies relative to the U.S. dollar? How
would this affect their external debt in local currency terms? If these countries had
wanted to prevent a change in their external debt, what would have been the ap-
propriate policy response, and what would have been the drawbacks?
7. Home’s currency is the peso and trades at 1 peso per dollar. Home has external assets
of $200 billion, all of which are denominated in dollars. It has external liabilities of
$400 billion, 75% of which are denominated in dollars.
a. Is Home a net creditor or debtor? What is Home’s external wealth?
b. What is Home’s net position in dollar-denominated assets?
c. If the peso depreciates to 1.2 pesos per dollar, what is the change in Home’s
external wealth in pesos?
8. Evaluate the empirical evidence on how currency depreciation affects wealth and
output across countries. How does the decision of maintaining a fixed versus floating
exchange rate regime depend on a country’s external wealth position?
9. Home signs a free-trade agreement with Foreign, which lowers tariffs and other bar-
riers to trade. Both countries are very similar in terms of economic shocks, as they
each produce very similar goods. Use a symmetry-integration diagram as in Figure
15-4 as part of your answer to the following questions.
See the following figure. Initially, the countries face similar shocks, as shown by Point A.
a. Initially, trade rises. Does the rise in trade make Home more or less likely to peg
its currency to the Foreign currency? Why?
b. In the longer run, freer trade causes the countries to follow their comparative
advantage and specialize in producing very different types of goods. Does the
rise in specialization make Home more or less likely to peg its currency to the
Foreign currency? Why?
Symmetry
of shocks
Market integration
AB
C
FIX