
National and International Accounts:
Income, Wealth, and the Balance
of Payments
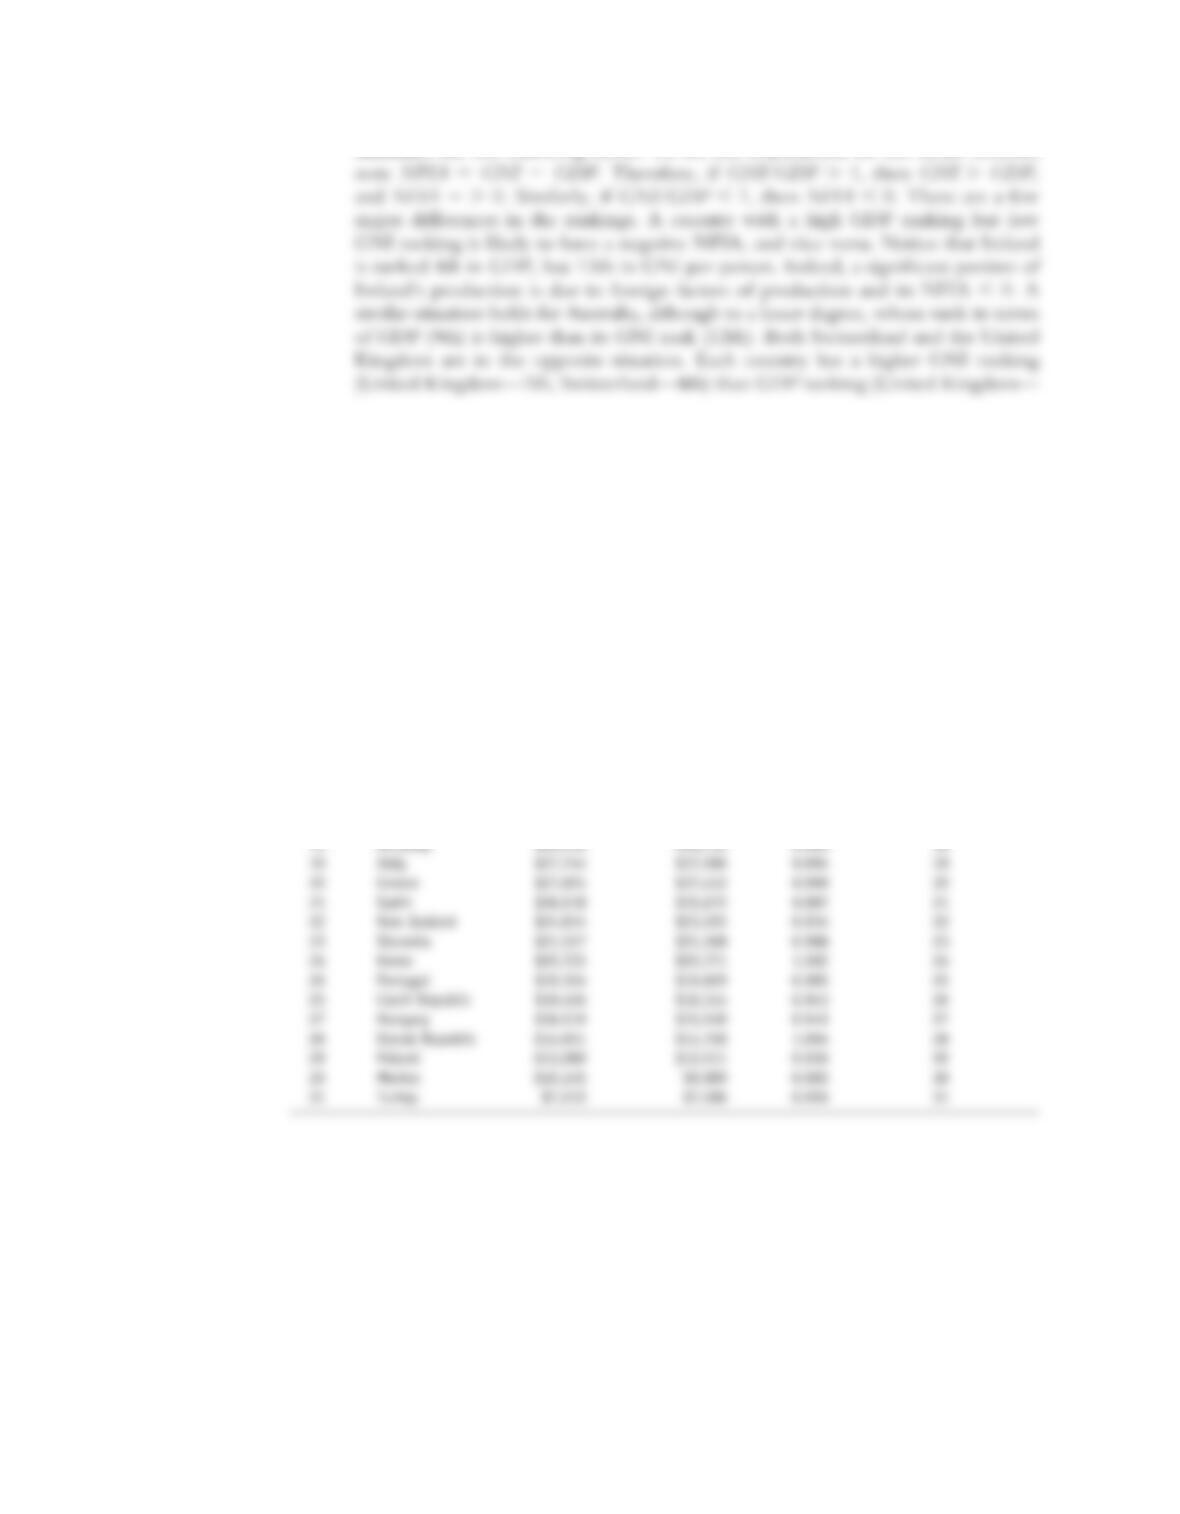
1. The following partial table of the OECD’s 2004 ranking of member countries based
on their GDP per capita. Compute the ratio of GNI to GDP in each case. What
does this imply about net factor income from abroad in each country? Compute the
GNI rankings of these countries. Are there any major differences between the GDP
and the GNI rankings? What do these differences imply? Indicate?
S-123
GDP GNI
per Person per Person
1 Luxembourg $64,843 $53,299
2 Norway $41,880 $42,062
3 United States $39,660 $39,590
4 Ireland $36,536 $31,151
5 Switzerland $34,740 $37,638
6 Netherlands $33,571 $34,527
7 Iceland $33,271 $31,897
8 Austria $33,235 $32,843
9 Australia $32,643 $31,462
10 Canada $32,413 $31,751
11 Denmark $32,335 $32,232
12 Belgium $31,985 $31,675
13 United Kingdom $31,780 $32,470
14 Sweden $31,072 $31,007
15 Germany $29,916 $28,732
16 Finland $29,833 $30,361
17 Japan $29,173 $29,739
18 France $29,006 $29,287
19 Italy $27,744 $27,586
20 Greece $27,691 $27,412
21 Spain $26,018 $25,672
22 New Zealand $24,834 $23,205
23 Slovenia $21,527 $21,268
24 Korea $20,723 $20,771
25 Czech Republic $19,426 $18,314
26 Portugal $19,324 $19,029
27 Hungary $16,519 $15,548
28 Slovak Republic $14,651 $14,708
29 Poland $13,089 $12,511
30 Mexico $10,145 $9,989
31 Turkey $7,212 $7,186
13
S-124 Solutions n Chapter 13 National and International Accounts
GDP GNI per
Ranking Country GDP per Person GNI per Person GNI/GDP Ratio Ranking
1 Luxembourg $64,843 $53,299 0.822 1
2 Norway $41,880 $42,062 1.004 2
3 United States $39,660 $39,590 0.998 3
5 Switzerland $34,740 $37,638 1.083 4
6 Netherlands $33,571 $34,527 1.028 5
8 Austria $33,235 $32,843 0.988 6
13 United Kingdom $31,780 $32,470 1.022 7
11 Denmark $32,335 $32,232 0.997 8
7 Iceland $33,271 $31,897 0.959 9
10 Canada $32,413 $31,751 0.980 10
12 Belgium $31,985 $31,675 0.990 11
9 Australia $32,643 $31,462 0.964 12
4 Ireland $36,536 $31,151 0.853 13
14 Sweden $31,072 $31,007 0.998 14
16 Finland $29,833 $30,361 1.018 15
17 Japan $29,173 $29,739 1.019 16
18 France $29,006 $29,287 1.010 17
15 Germany $29,916 $28,732 0.960 18
19 Italy $27,744 $27,586 0.994 19
20 Greece $27,691 $27,412 0.990 20
21 Spain $26,018 $25,672 0.987 21
22 New Zealand $24,834 $23,205 0.934 22
23 Slovenia $21,527 $21,268 0.988 23
24 Korea $20,723 $20,771 1.002 24
26 Portugal $19,324 $19,029 0.985 25
25 Czech Republic $19,426 $18,314 0.943 26
27 Hungary $16,519 $15,548 0.941 27
28 Slovak Republic $14,651 $14,708 1.004 28
29 Poland $13,089 $12,511 0.956 29
30 Mexico $10,145 $9,989 0.985 30
31 Turkey $7,212 $7,186 0.996 31
Answer: See the following tables. To see the implications for net factor income,
note NFIA 5 GNI 2 GDP. Therefore, if GNI/GDP . 1, then GNI . GDP,
and NFIA 5 . 0. Similarly, if GNI/GDP , 1, then NFIA , 0. There are a few
major differences in the rankings. A country with a high GDP ranking but low
GNI ranking is likely to have a negative NFIA, and vice versa. Notice that Ireland
is ranked 4th in GDP, but 13th in GNI per person. Indeed, a significant portion of
Ireland’s production is due to foreign factors of production and its NFIA , 0. A
similar situation holds for Australia, although to a lesser degree, whose rank in terms
of GDP (9th) is higher than its GNI rank (12th). Both Switzerland and the United
Kingdom are in the opposite situation. Each country has a higher GNI ranking
(United Kingdom—7th, Switzerland—4th) than GDP ranking (United Kingdom—
Solutions n Chapter 13 National and International Accounts S-125
13th, Denmark—5th). Both countries export more factors of production than they
import, so NFIA . 0.
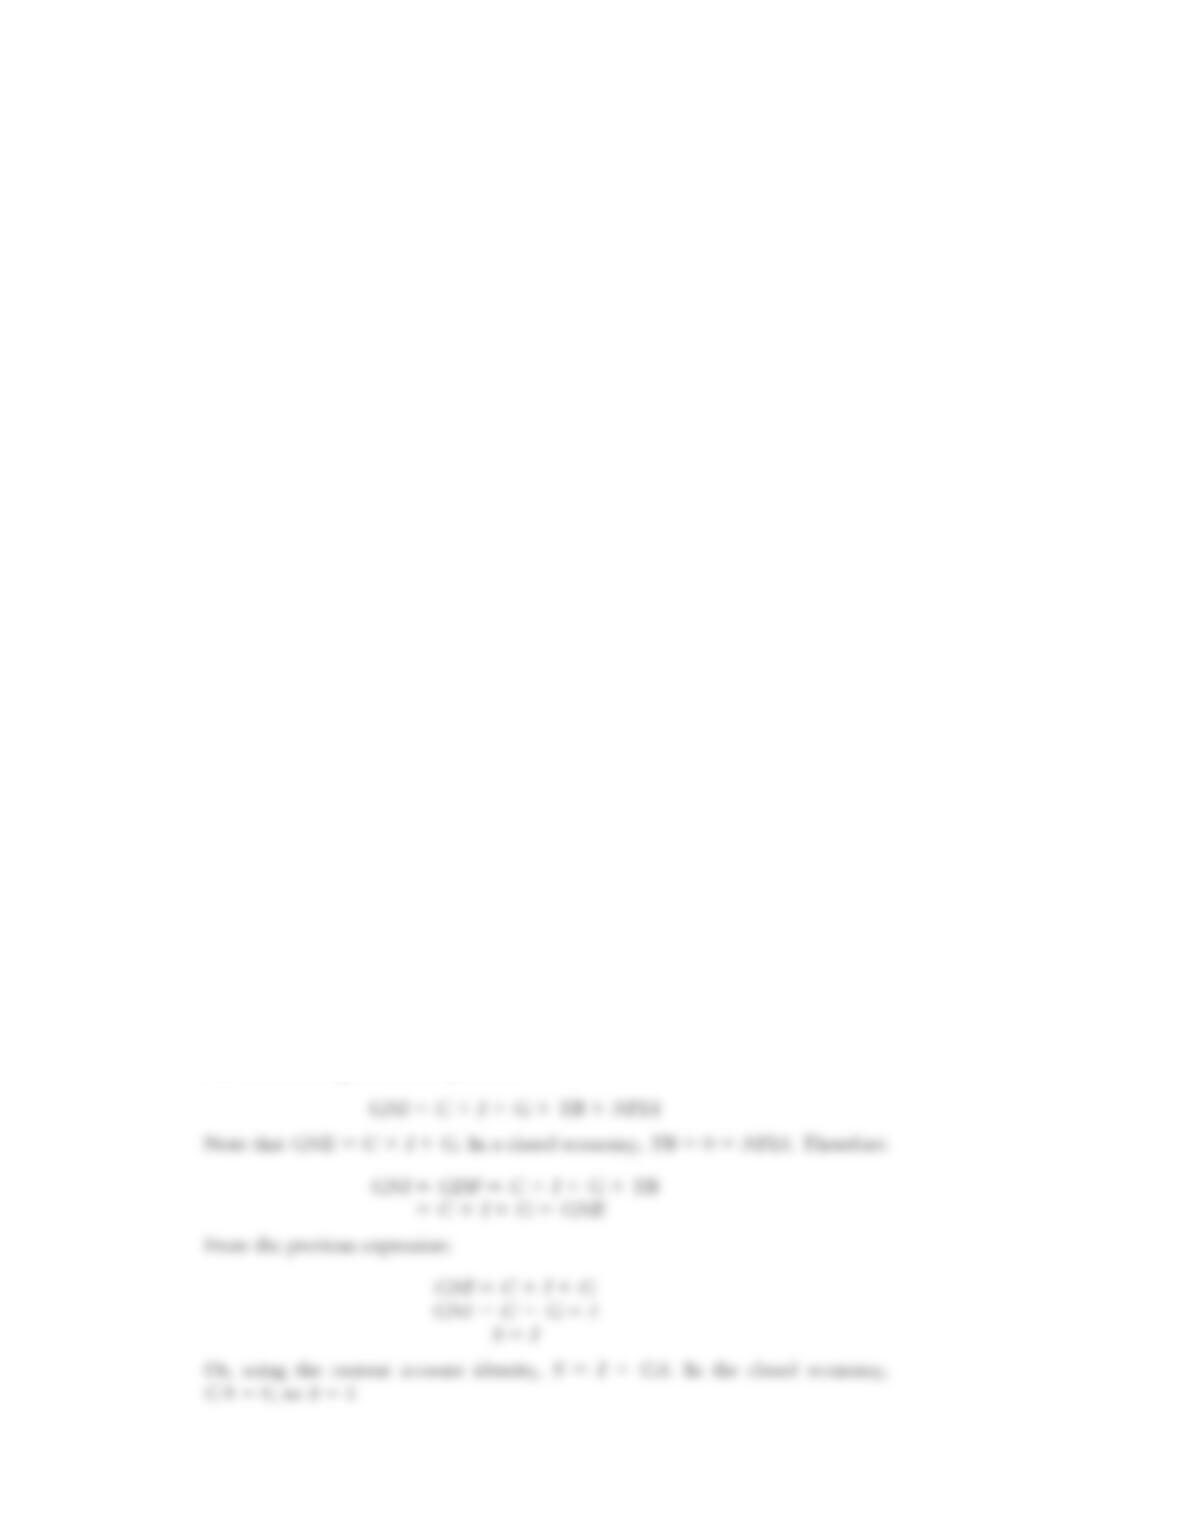
2. Note the following accounting identity for gross national income (GNI):
GNI 5 C 1 I 1 G 1 TB 1 NFIA
Using this expression, show that in a closed economy, gross domestic product
(GDP), gross national income (GNI), gross national expenditures (GNE) are the
same. Show that domestic investment is equal to domestic savings.
Answer: Starting from the expression:
GDP GNI/GDP per
Ranking Country GDP per Person GNI per Person GNI/GDP Ratio Ranking
5 Switzerland $34,740 $37,638 1.083 1
6 Netherlands $33,571 $34,527 1.028 2
13 United Kingdom $31,780 $32,470 1.022 3
17 Japan $29,173 $29,739 1.019 4
16 Finland $29,833 $30,361 1.018 5
18 France $29,006 $29,287 1.010 6
2 Norway $41,880 $42,062 1.004 7
28 Slovak Republic $14,651 $14,708 1.004 8
24 Korea $20,723 $20,771 1.002 9
3 United States $39,660 $39,590 0.998 10
14 Sweden $31,072 $31,007 0.998 11
11 Denmark $32,335 $32,232 0.997 12
31 Turkey $7,212 $7,186 0.996 13
19 Italy $27,744 $27,586 0.994 14
12 Belgium $31,985 $31,675 0.990 15
20 Greece $27,691 $27,412 0.990 16
8 Austria $33,235 $32,843 0.988 17
23 Slovenia $21,527 $21,268 0.988 18
21 Spain $26,018 $25,672 0.987 19
26 Portugal $19,324 $19,029 0.985 20
30 Mexico $10,145 $9,989 0.985 21
10 Canada $32,413 $31,751 0.980 22
9 Australia $32,643 $31,462 0.964 23
15 Germany $29,916 $28,732 0.960 24
7 Iceland $33,271 $31,897 0.959 25
29 Poland $13,089 $12,511 0.956 26
25 Czech Republic $19,426 $18,314 0.943 27
27 Hungary $16,519 $15,548 0.941 28
22 New Zealand $24,834 $23,205 0.934 29
4 Ireland $36,536 $31,151 0.853 30
1 Luxembourg $64,843 $53,299 0.822 31
S-126 Solutions n Chapter 13 National and International Accounts
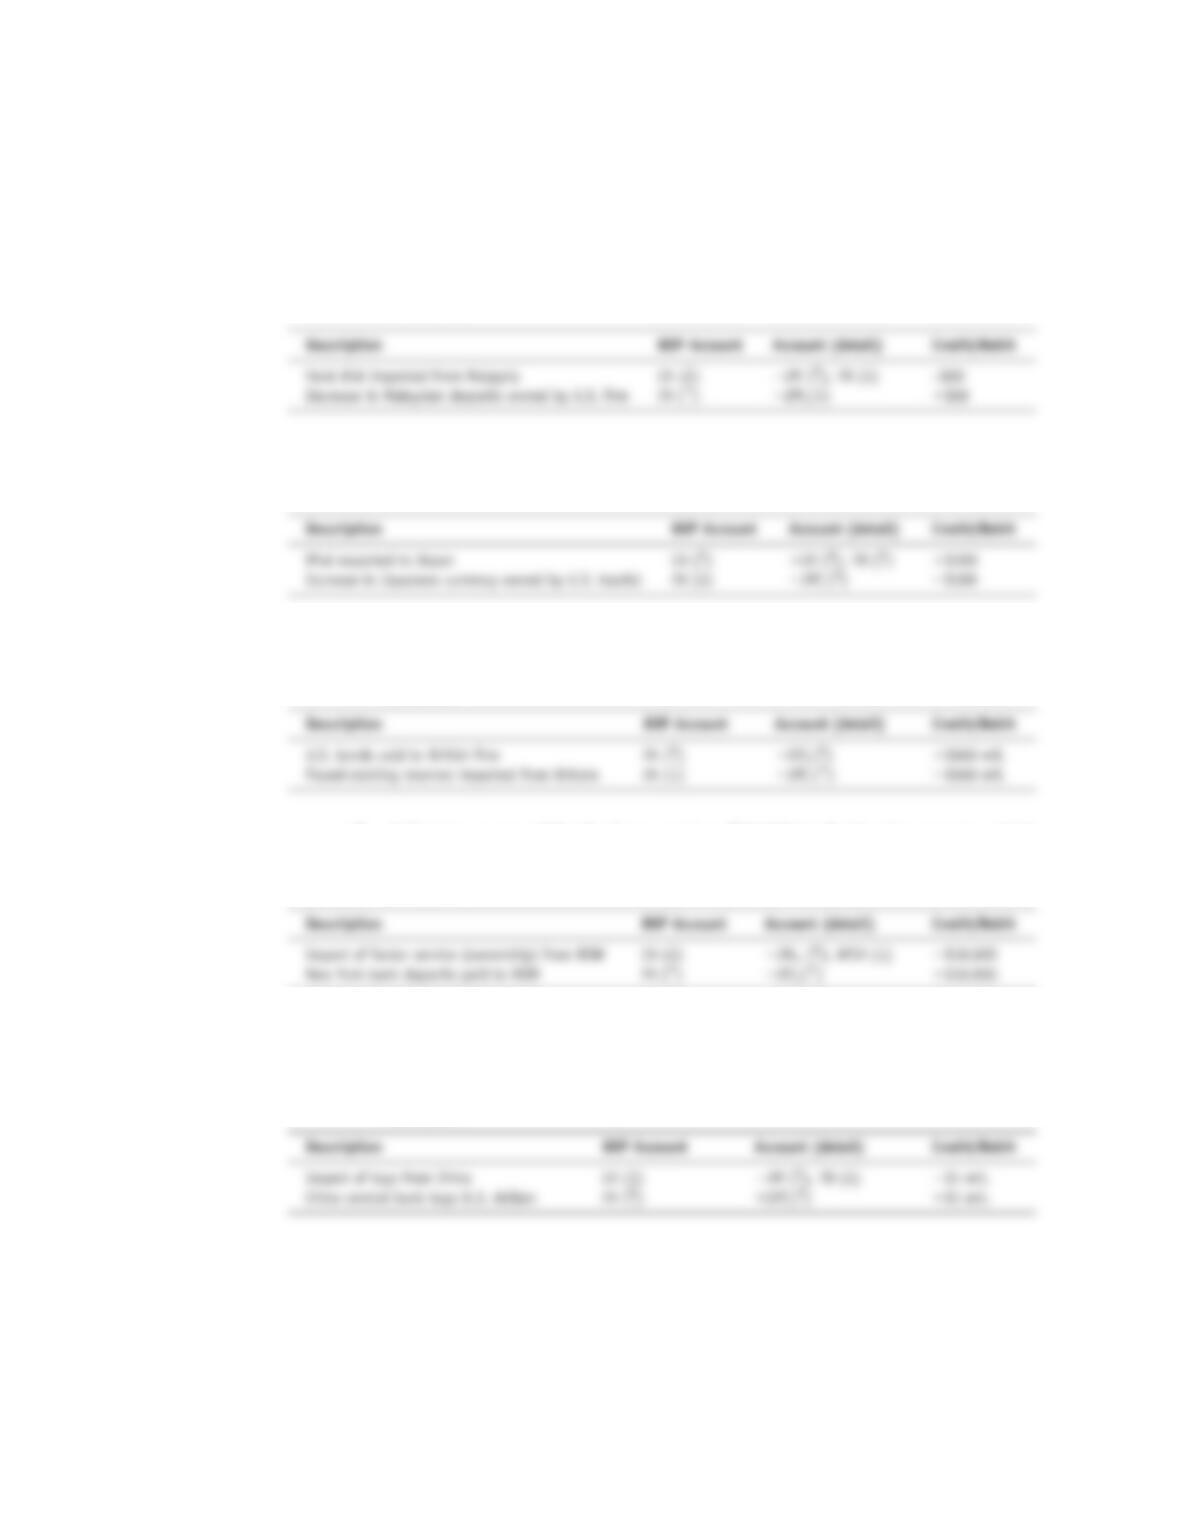
3. Show how each of the following would affect the U.S. balance of payments. Include
a description of the debit and credit items, and in each case identify which specific
account is affected (e.g., imports of goods and services, IM; exports of assets, EXA;
and so on. For this question, you may find it helpful to refer to Appendix 1.).
a. A California computer manufacturer purchases a $50 hard disk from a Malaysian
company, paying the funds from a bank account in Malaysia.
Answer:
Solutions n Chapter 13 National and International Accounts S-127
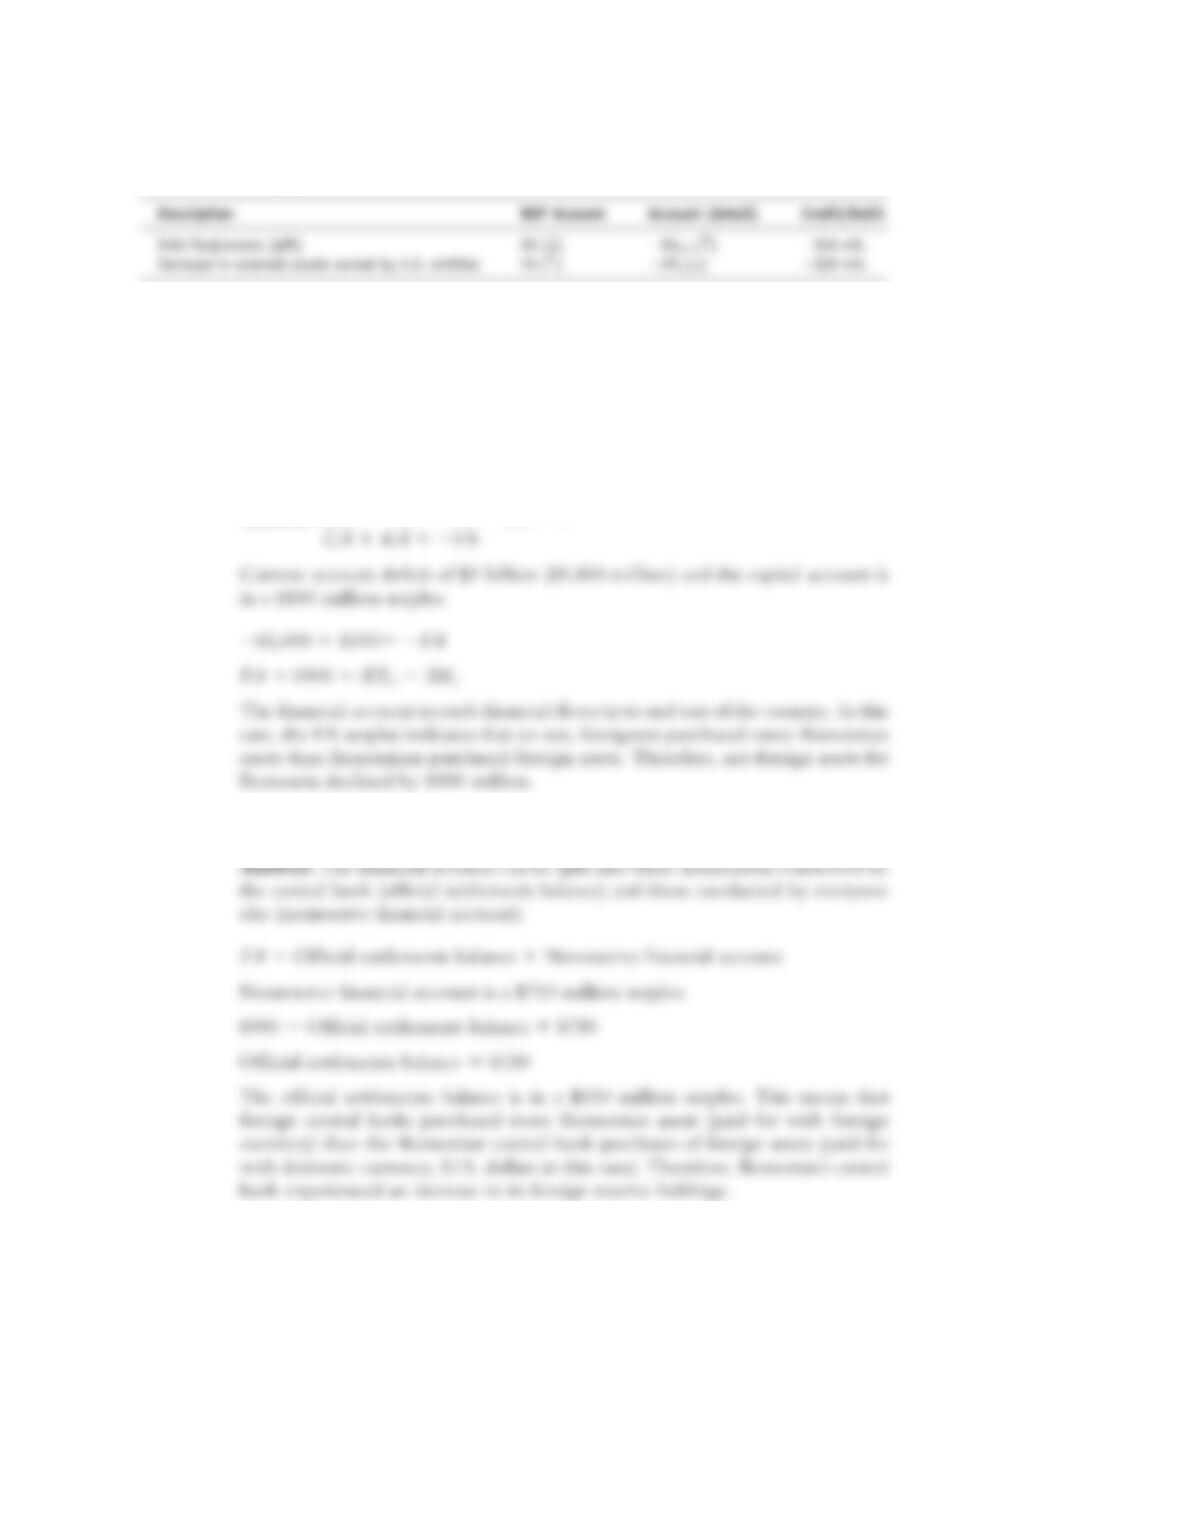
f. The U.S. government forgives a $50 million debt owed by a developing country.
Answer:
4. In 2010 the country of Ikonomia has a current account deficit of $1 billion and a
nonreserve financial account surplus of $750 million. Ikonomia’s capital account is
in a $100 million surplus. In addition, Ikonomian factors located in foreign countries
earn $700 million. Ikonomia has a trade deficit of $800 million. Assume Ikonomia
neither gives nor receives unilateral transfers. Ikonomia’s GDP is $9 billion.
a. What happened to Ikonomia’s net foreign assets during 2010? Did it acquire or
lose foreign assets during the year?
Answer: BOP 5 CA 1 FA 1 KA 5 0
b. Compute the official settlements balance (OSB). Based on this number, what
happened to the central bank’s (foreign) reserves?
Answer: The financial account can be split into those transactions conducted by
the central bank (official settlements balance) and those conducted by everyone
else (nonreserve financial account):
FA 5 Official settlements balance 1 Nonreserve financial account
Nonreserve financial account is a $750 million surplus.
$900 5 Official settlements balance 1 $750
Official settlements balance 5 $150
The official settlements balance is in a $150 million surplus. This means that
foreign central banks purchased more Ikonomian assets (paid for with foreign
currency) than the Ikonomian central bank purchases of foreign assets (paid for
with domestic currency, U.S. dollars in this case). Therefore, Ikonomia’s central
bank experienced an increase in its foreign reserve holdings.
Description BOP Account Account (detail) Credit/Debit
Debt forgiveness (gift) KA (↓) 2KAOUT (↑) 2$50 mil.
Decrease in external assets owned by U.S. entities FA (↑) 2IMF
A
(↓) 1$50 mil.
S-128 Solutions n Chapter 13 National and International Accounts
c. How much income did foreign factors of production earn in Ikonomia during
2010?
e. Using the identity BOP 5 CA 1 FA 1 KA, show that BOP 5 0.
Answer: To check our work, we can verify the BOP identity:
f. Calculate Ikonomia’s gross national expenditure (GNE), gross national income
(GNI), and gross national disposable income (GNDI).
Answer: We know that GDP 5 C 1 I 1 G 1 (EX 2 IM) 5 GNE 1 TB
5. To answer this question, you must obtain data from the Bureau of Economic Analysis
(BEA), http://www.bea.gov, on the U.S. balance of payment (BOP) tables. Go to
interactive tables to obtain annual data for 2008 (the default setting is for quarterly
data). It may take you some time to become familiar with how to navigate the web–
site. You need only refer to Table 1 on the BOP accounts. Using the BOP data, calculate
the following for the United States:
(Answers will vary because of data revisions. The figures below are based on those
given in the Table 13-3: release date September 19, 2013.)
a. Trade balance (TB), net factor income from abroad (NFIA), net unilateral trans-
fers (NUT), and current account (CA)
Answer: TB 5 2$702 billion (Line 74)
b. Financial account (FA)
Answer: FA 5 1$730 billion (Lines 40 1 55 1 70)
c. Official settlements balance (OSB), referred to as “U.S. official reserve assets”
and “Foreign official assets in the U.S.”
Answer: Official settlements balance 5 1$550 billion (Lines 41 1 56)
d. Nonreserve financial account (NRFA)
Answer: Nonreserve financial account 5 $180 billion (Lines 40 1 55 1 70 2
41 2 56)
e. Balance of payments (BOP). Note that this may not equal zero because of statis-
tical discrepancy. Verify that the discrepancy is the same as the one reported by
the BEA.
6. Continuing from the previous question, find nominal GDP for the United States in
2008 (you can find it elsewhere on the BEA site). Use this information along with
your previous calculations to calculate the following:
(Answers will vary because of data revisions. The figures below use data from NIPA
Table 1.1.5 as revised on September 26, 2013. It reports GDP = $14,720 billion.)
a. Gross national expenditure (GNE), gross national income (GNI), and gross na-
tional disposable income (GNDI)
b. In macroeconomics, we often assume the U.S. economy is a closed economy when
building models that describe how changes in policy and shocks affect the economy.
Based on the previous data (BOP and GDP), do you think this is a reasonable as–
sumption to make? Do international transactions account for a large share of total
transactions (involving goods and services, or income) involving the United States?
7. During the 1980s, the United States experienced “twin deficits” in the current ac-
count and government budget. Since 1998, the U.S. current account deficit has
grown steadily, along with rising government budget deficits. Do government bud-
get deficits lead to current account deficits? Identify other possible sources of the
current account deficits. Do current account deficits necessarily indicate problems in
the economy?
It is not clear that budget deficits cause current account deficits. There are two pos-
sibilities besides a budget deficit (SG , 0):
8. Consider the economy of Opulenza. In Opulenza, domestic investment of $400
million earned $20 million in capital gains during 2012. Opulenzans purchased $120
million in new foreign assets during the year; foreigners purchased $160 million in
Opulenzan assets. Assume the valuation effects total $1 million in capital gains.
Note that we need to assume a value for the capital account. We will assume KA 5
0 in the following transactions.
a. Compute the change in domestic wealth in Opulenza.
b. Compute the change in external wealth for Opulenza.
Answer: The change in external wealth is:
c. Compute the total change in wealth for Opulenza.
Answer: The change in total wealth is:
d. Compute domestic savings for Opulenza.
Answer: To calculate national savings, note that the change in total wealth is:
Solutions n Chapter 13 National and International Accounts S-131
e. Compute Opulenza’s current account. Is the CA in deficit or surplus?
Answer: Using the current account identity: S 5 I 1 CA:
f. Explain the intuition for the CA deficit/surplus in terms of savings in Opulenza,
financial flows, and its domestic/external wealth position.
g. How would a depreciation in Opulenza’s currency affect its domestic, external,
and total wealth? Assume that foreign assets owned by Opulenzans are denomi-
nated in foreign currency.
Answer: The answer to this question depends on how Opulenzan external
9. This question asks you to compute valuation effects for the United States in 2004
using the same methods mentioned in the chapter. Use the bea.gov website to col–
lect the data needed for this question: look under the “International” heading.
Visit the BEA’s balance of payments data page and obtain the U.S. balance of pay-
ments for 2004 in billions of dollars. Be sure to get the correct year, and annual data,
not quarterly.
Visit the BEA’s net international investment position data page and obtain the
U.S. net international investment position for end 2003 to end 2004.
Answers may vary based on data revisions. The data below were obtained in
Novem-ber 2007:
b. What was the U.S. financial account for 2004?
S-132 Solutions n Chapter 13 National and International Accounts
c. What was the U.S. change in external wealth for 2004?
Answer: Net international position (2003): 22,140,361 (2$2,140 million)
d. What was the U.S. total valuation effect for 2004?
Answer: Valuation effects from BEA 5 $402,709 million.
e. Does the answer to part (d) equal the answer to part (e) minus the answer to
part (c)? Why?
Answer: Yes. We can see this from the definition of changes in external wealth:
f. What do the BEA data indicate was the U.S. valuation effect due to exchange
rate changes for 2004?
Answer: Price effects: $64,837 million; exchange rate effects: $194,037 million;
g. What were end-2003 U.S. external liabilities? If 5% of these liabilities were in
foreign currency and were subject to a 10% exchange rate appreciation, what
decrease in U.S. external wealth resulted?
Answer: 2003 year-end U.S. external liabilities 5 $9,783,855 million
h. What were end-2003 U.S. external assets? If 65% of these assets were subject to a
10% exchange rate appreciation, what increase in U.S. external wealth resulted?
Answer: 2003 year-end U.S. external assets 5 $7,643,494 million
i. Using the answers to parts (g) and (h), what was the 2004 U.S. valuation effect
due to exchange rate changes according to your rough calculation? Is it close to
the BEA figure in part (f )?