Exchange Rates II: The Asset
Approach in the Short Run
1. Use the money market and FX diagrams to answer the following questions about the
relationship between the British pound (£) and the U.S. dollar ($). The exchange
rate is in U.S. dollars per British pound, E$/£. We want to consider how a change in
the U.S. money supply affects interest rates and exchange rates. On all graphs, label
the initial equilibrium point A.
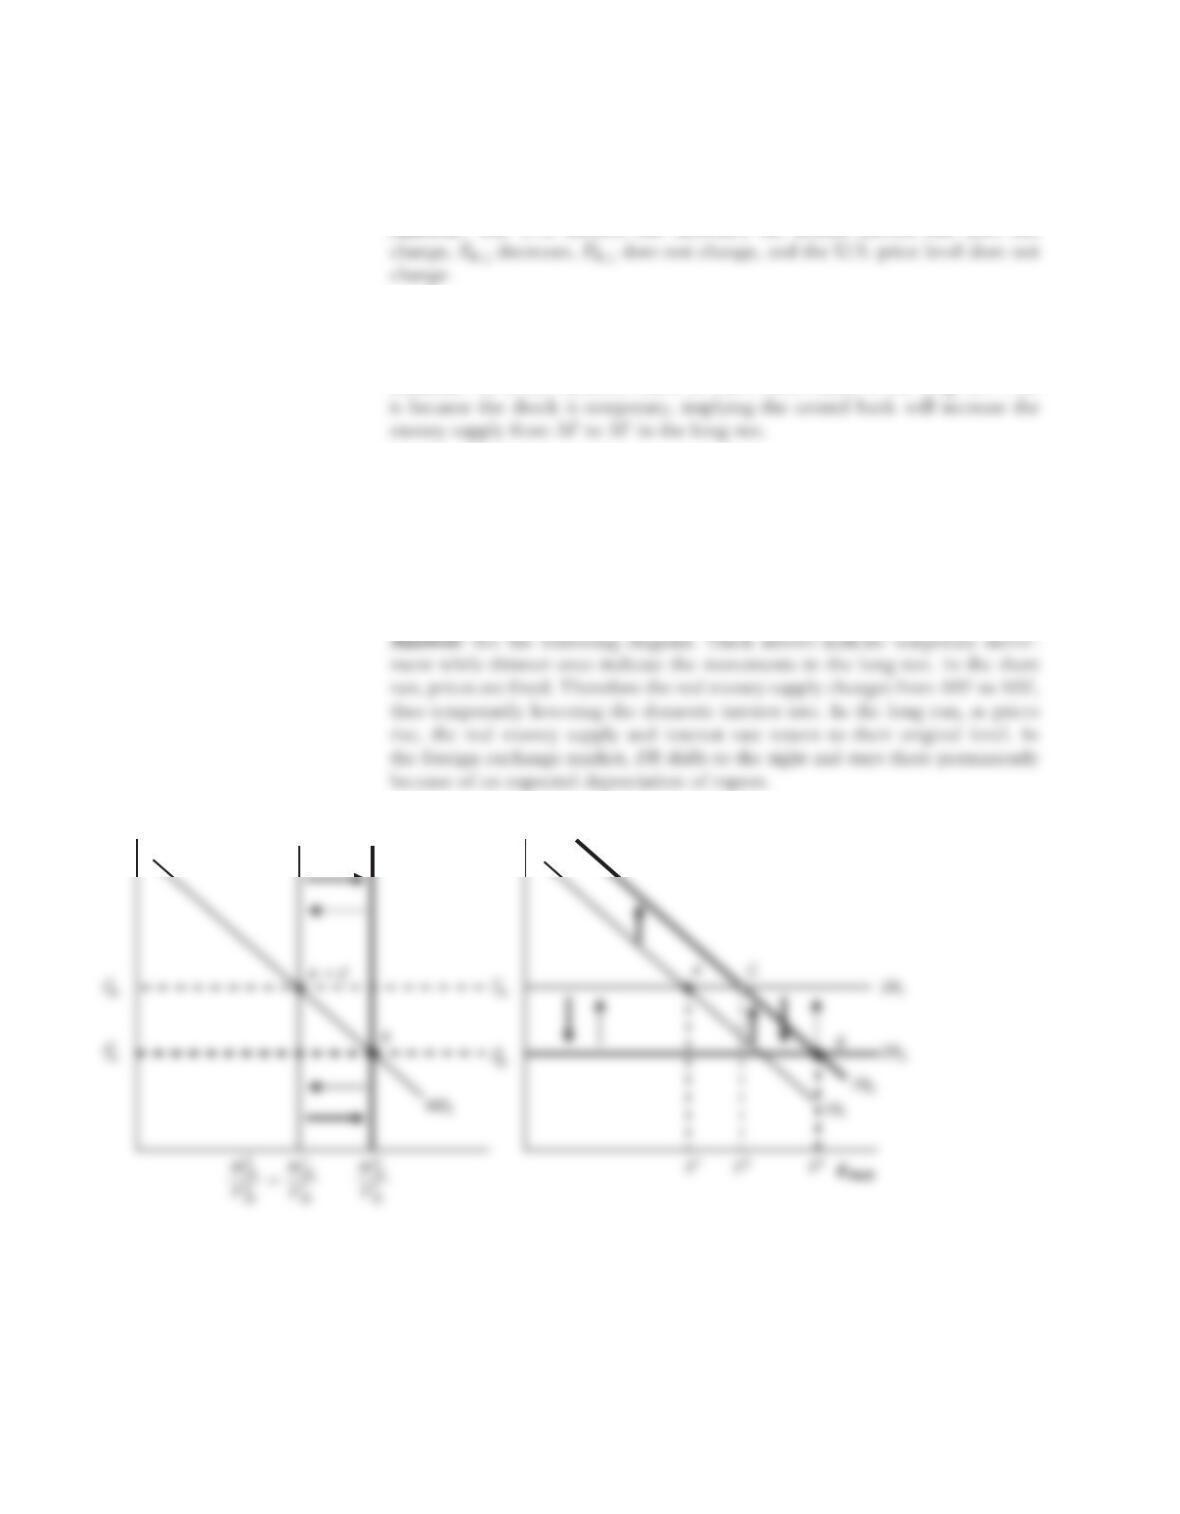
a. Illustrate how a temporary decrease in the U.S. money supply affects the money
and FX markets. Label your short-run equilibrium point B and your long-run
equilibrium point C.
Answer: See the diagram below.
S-113
i1
$
MS1
MS
2
MD 1
i1
$
DR1
FR
1
E1
E
2
E$/£
M1
US
P1
US
M2
US
P1
US
12
S-114 Solutions n Chapter 12 Exchange Rates II: The Asset Approach in the Short Run
b. Using your diagram from (a), state how each of the following variables changes
in the short run (increase/decrease/no change): U.S. interest rate, British interest
rate, E$/£, Ee
$/£, and the U.S. price level.
c. Using your diagram from (a), state how each of the following variables changes
in the long run (increase/decrease/no change relative to their initial values at
point A): U.S. interest rate, British interest rate, E$/£, Ee
$/£, and U.S. price level.
2. Use the money market and FX diagrams from (a) to answer the following questions.
This question considers the relationship between the Indian rupees (Rs) and the U.S.
dollar ($). The exchange rate is in rupees per dollar, ERs/$. On all graphs, label the
initial equilibrium point A.
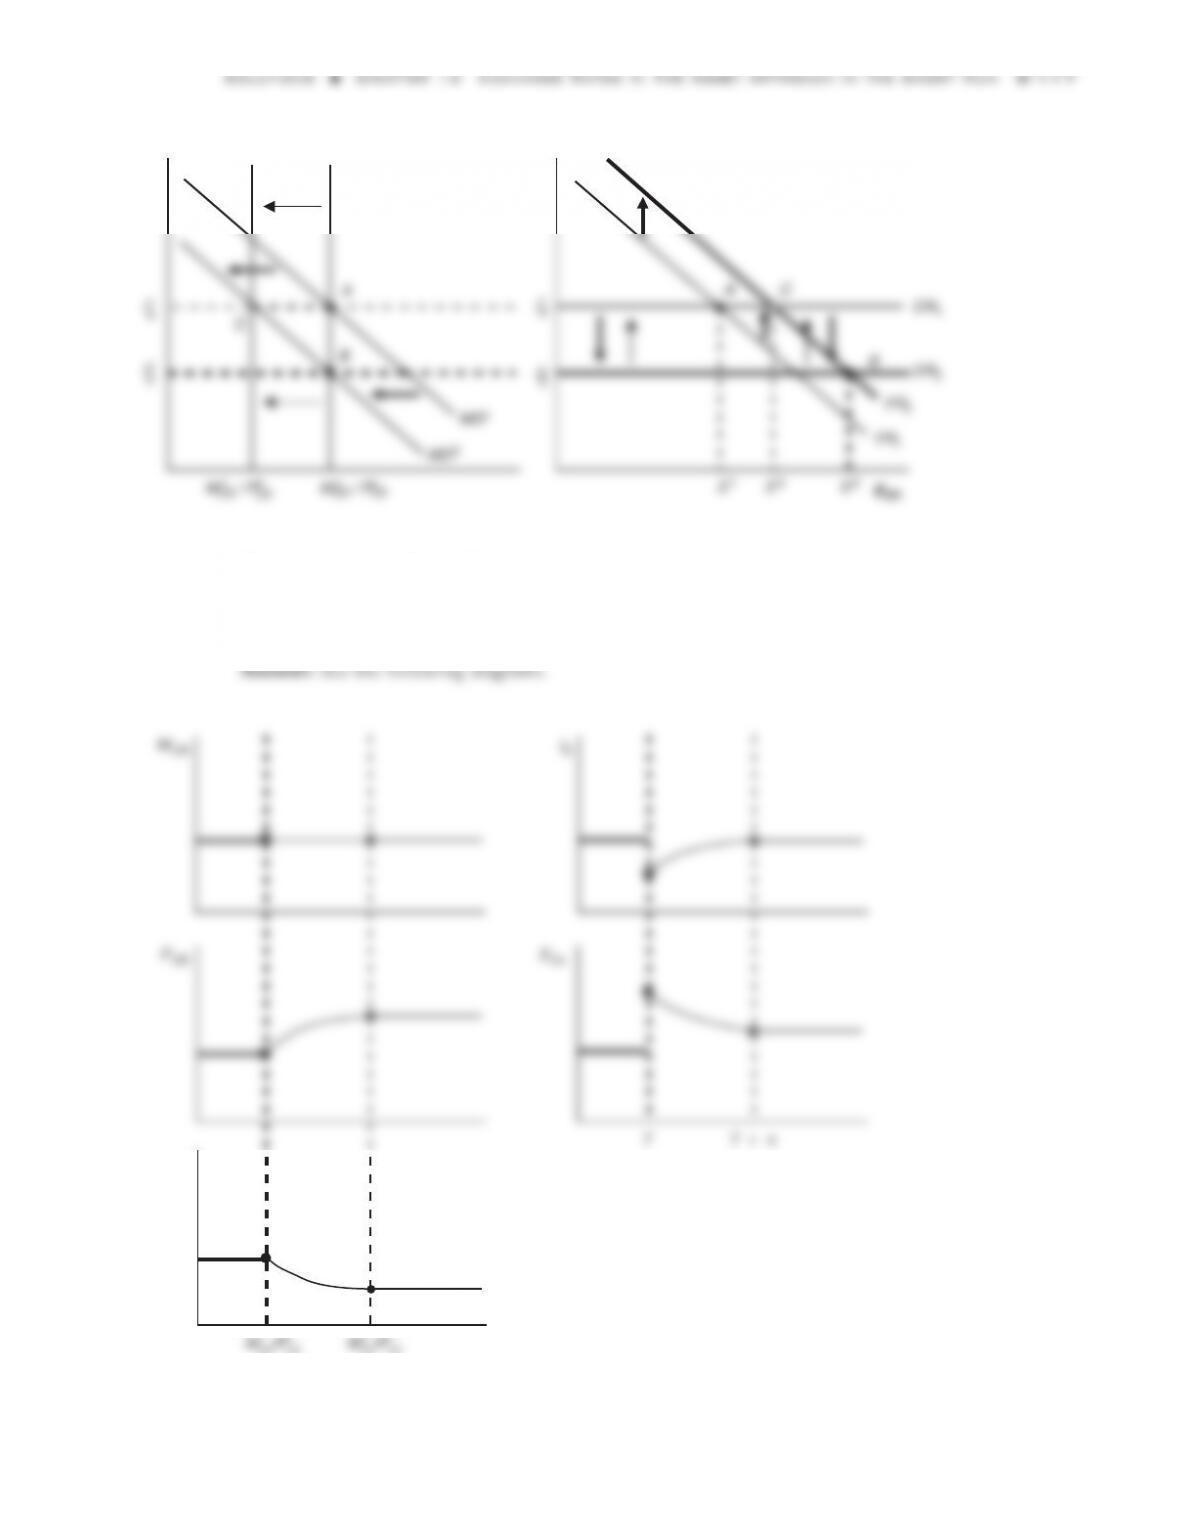
a. Illustrate how a permanent increase in India’s money supply affects the money
and FX markets. Label your short-run equilibrium point B and your long-run
equilibrium point C.
iRs
MS1MS2
A C
ER
A C
Solutions n Chapter 12 Exchange Rates II: The Asset Approach in the Short Run S-115
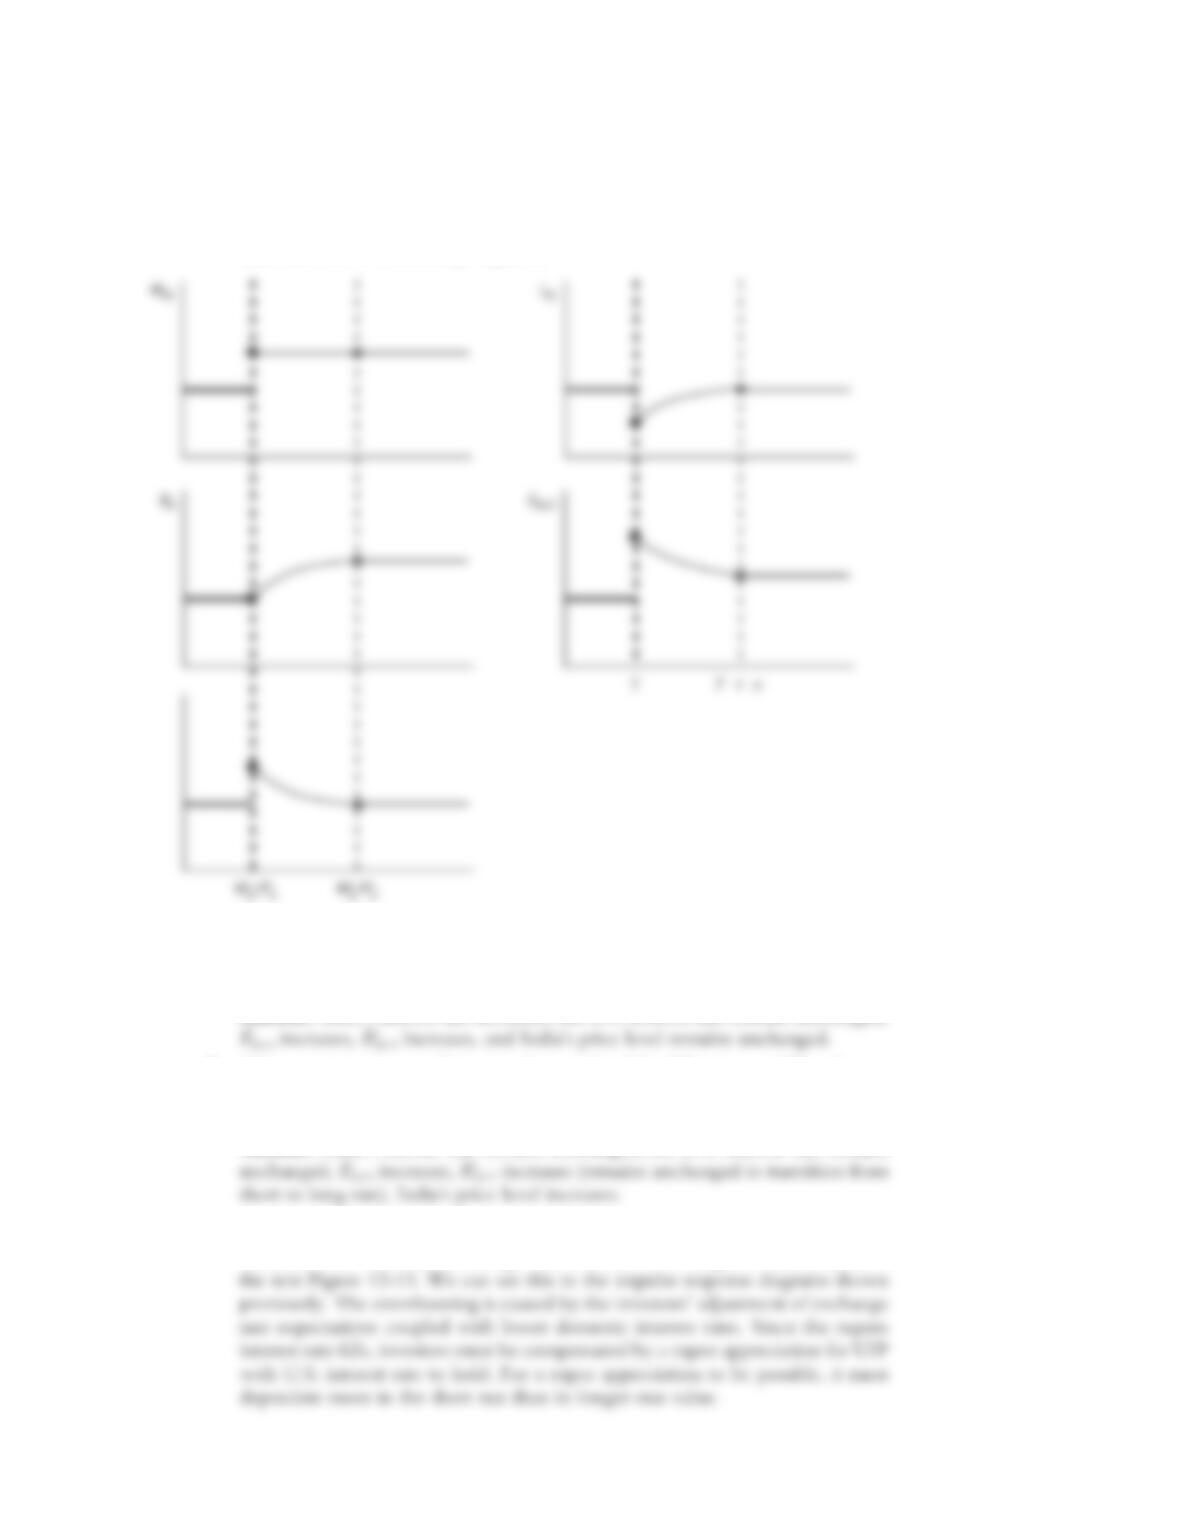
b. By plotting them on a chart with time on the horizontal axis, illustrate how each
of the following variables changes over time (for India): nominal money supply
MIN, price level PIN, real money supply MIN/PIN, India’s interest rate iRs, and the
exchange rate ERs/$.
Answer: See the following diagrams.
c. Using your previous analysis, state how each of the following variables changes
in the short run (increase/decrease/no change): India’s interest rate iRs, ERs/$ Ee
Rs/$,
and India’s price level PIN.
d. Using your previous analysis, state how each of the following variables changes
in the long run (increase/decrease/no change relative to their initial values at
point A): India’s interest rate iRs, ERs/$ Ee
Rs/$, India’s price level PIN.
e. Explain how overshooting applies to this situation.
Answer: The short-run exchange rate overshoots its long-run value, EE as in
the text Figure 12-13. We can see this in the impulse response diagrams shown
previously. The overshooting is caused by the investors’ adjustment of exchange
rate expectations coupled with lower domestic interest rates. Since the rupees
interest rate falls, investors must be compensated by a rupee appreciation for UIP
with U.S. interest rate to hold. For a rupee appreciation to be possible, it must
depreciate more in the short run than its longer-run value.
MIN
P
IN
iRs
TT n
ERs/$
MIN/PIN MIN/PIN
1122
3. Is overshooting (in theory and in practice) consistent with purchasing power parity?
Consider the reasons for the usefulness of PPP in the short run versus the long run
and the assumption we’ve used in the asset approach (in the short run versus the long
run). How does overshooting help to resolve the empirical behavior of exchange
rates in the short run versus the long run?
4. Use the money market and foreign exchange (FX) diagrams to answer the follow-
ing questions. This question considers the relationship between the euro (€) and the
U.S. dollar ($). The exchange rate is in U.S. dollars per euro, E$/€. Suppose that with
financial innovation in the United States, real money demand in the United States
decreases. On all graphs, label the initial equilibrium point A.
a. Assume this change in U.S. real money demand is temporary. Using the FX and
money market diagrams, illustrate how this change affects the money and FX
markets. Label your short-run equilibrium point B and your long-run equilib-
rium point C.
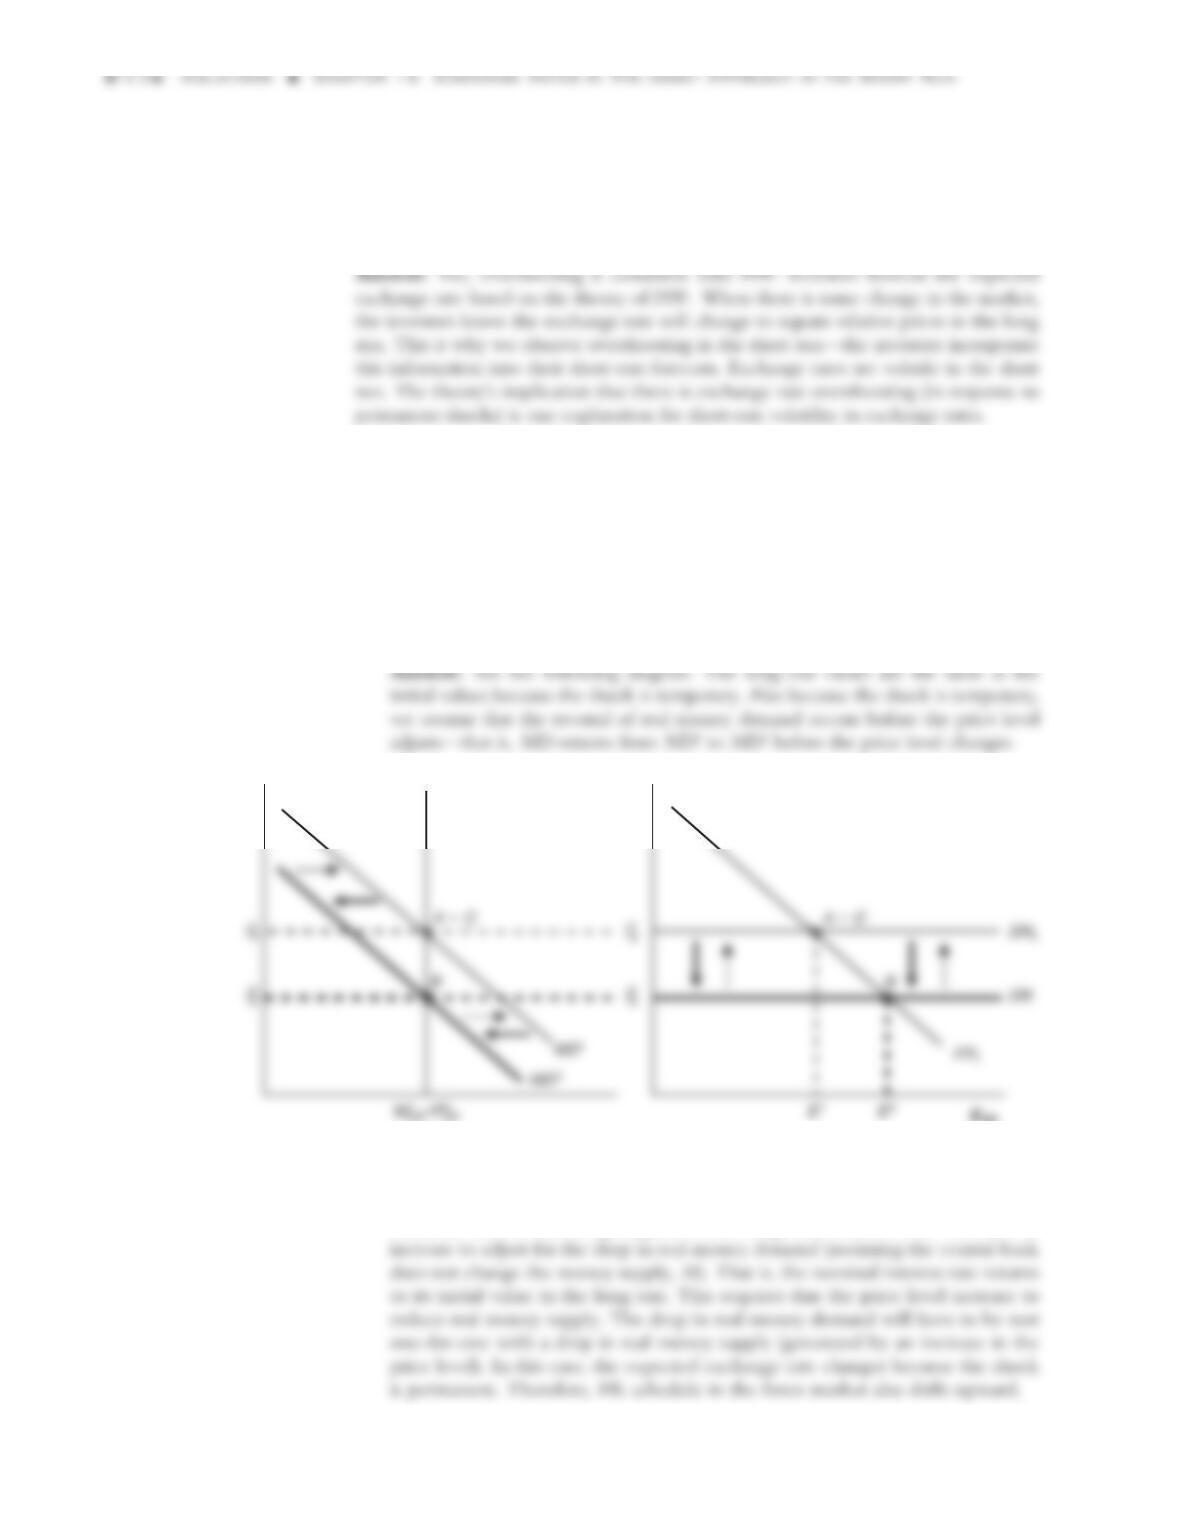
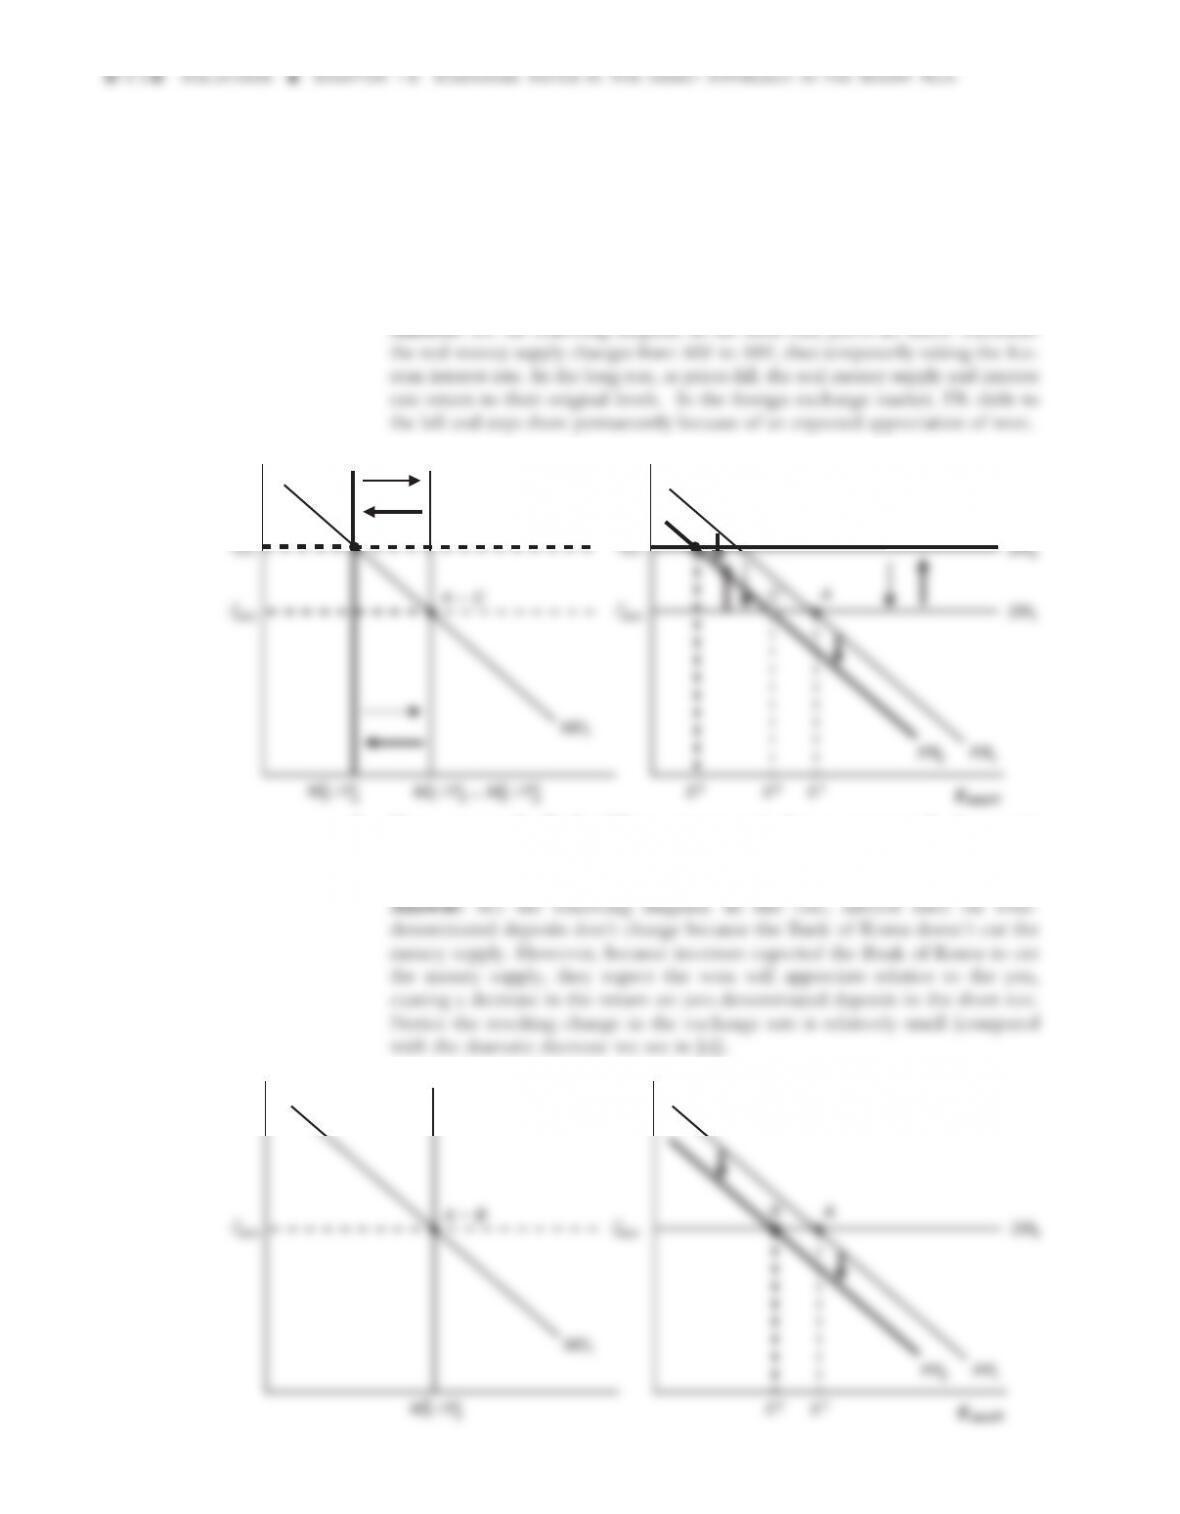
b. Assume this change in U.S. real money demand is permanent. Using a new dia-
gram, illustrate how this change affects the money and FX markets. Label your
short-run equilibrium point B and your long-run equilibrium point C.
Answer: See the following diagram. In the long run, the price level will have to
i$
MS
1
A
CA
C
ER
ER
A C
i$
MS1
MS3
A
ER
A C
i$
MS1
MS3
A
5. This question considers how the FX market will respond to changes in monetary
policy. For these questions, define the exchange rate as Korean won per Japanese
yen, EWON/¥. Use the FX and money market diagrams to answer the following ques-
tions. On all graphs, label the initial equilibrium point A.
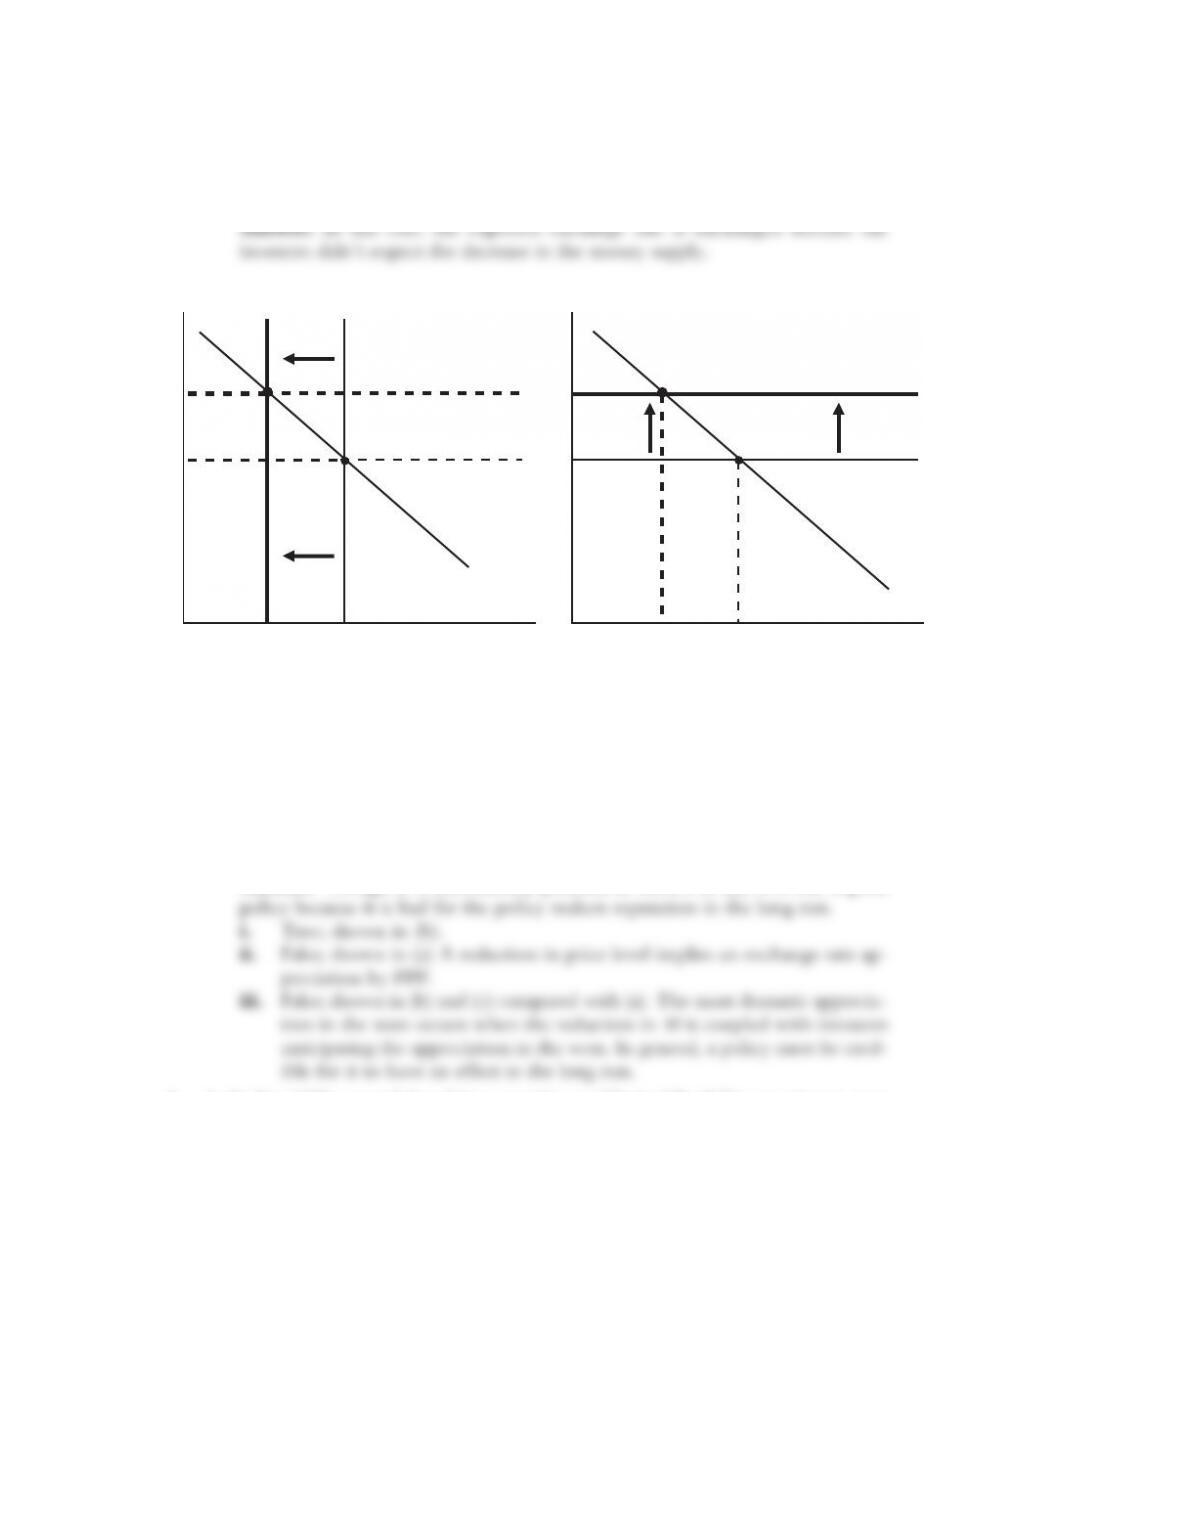
a. Suppose the Bank of Korea permanently decreases its money supply. Illustrate
the short-run (label the equilibrium point B) and long-run effects (label the
equilibrium point C) of this policy.
iwon
MS1
MS2
ER
B
B
Solutions n Chapter 12 Exchange Rates II: The Asset Approach in the Short Run S-119
c. Finally, suppose the Bank of Korea permanently decreases its money supply but
this change is not anticipated. When the Bank of Korea implements this policy,
how will this affect the FX market in the short run?
iwon
i1
won
i2
woni2
won
i1
won
MS1
MS2
MD1
M1
K / P1
K
M2
K / P1
K
A
B
ER
DR1
DR
FR1
E1
E2
A
B
Ewon/¥
2
d. Using your previous answers, evaluate the following statements:
i. If a country wants to increase the value of its currency, it can do so (tem-
porarily) without raising domestic interest rates.
ii. The central bank can reduce both the domestic price level and the value of
its currency in the long run.
iii. The most effective way to increase the value of a currency is through sur-
prising investors.
6. In the late 1990s, several East Asian countries used limited flexibility or currency pegs
in managing their exchange rates relative to the U.S. dollar. This question considers
how different countries responded to the East Asian Currency Crisis (1997–1998).
For the following questions, treat the East Asian country as the home country and
the United States as the foreign country. Also, for the diagrams, you may assume
these countries maintained a currency peg (fixed rate) relative to the U.S. dollar.
Also, for the following questions, you need consider only the short-run effects.
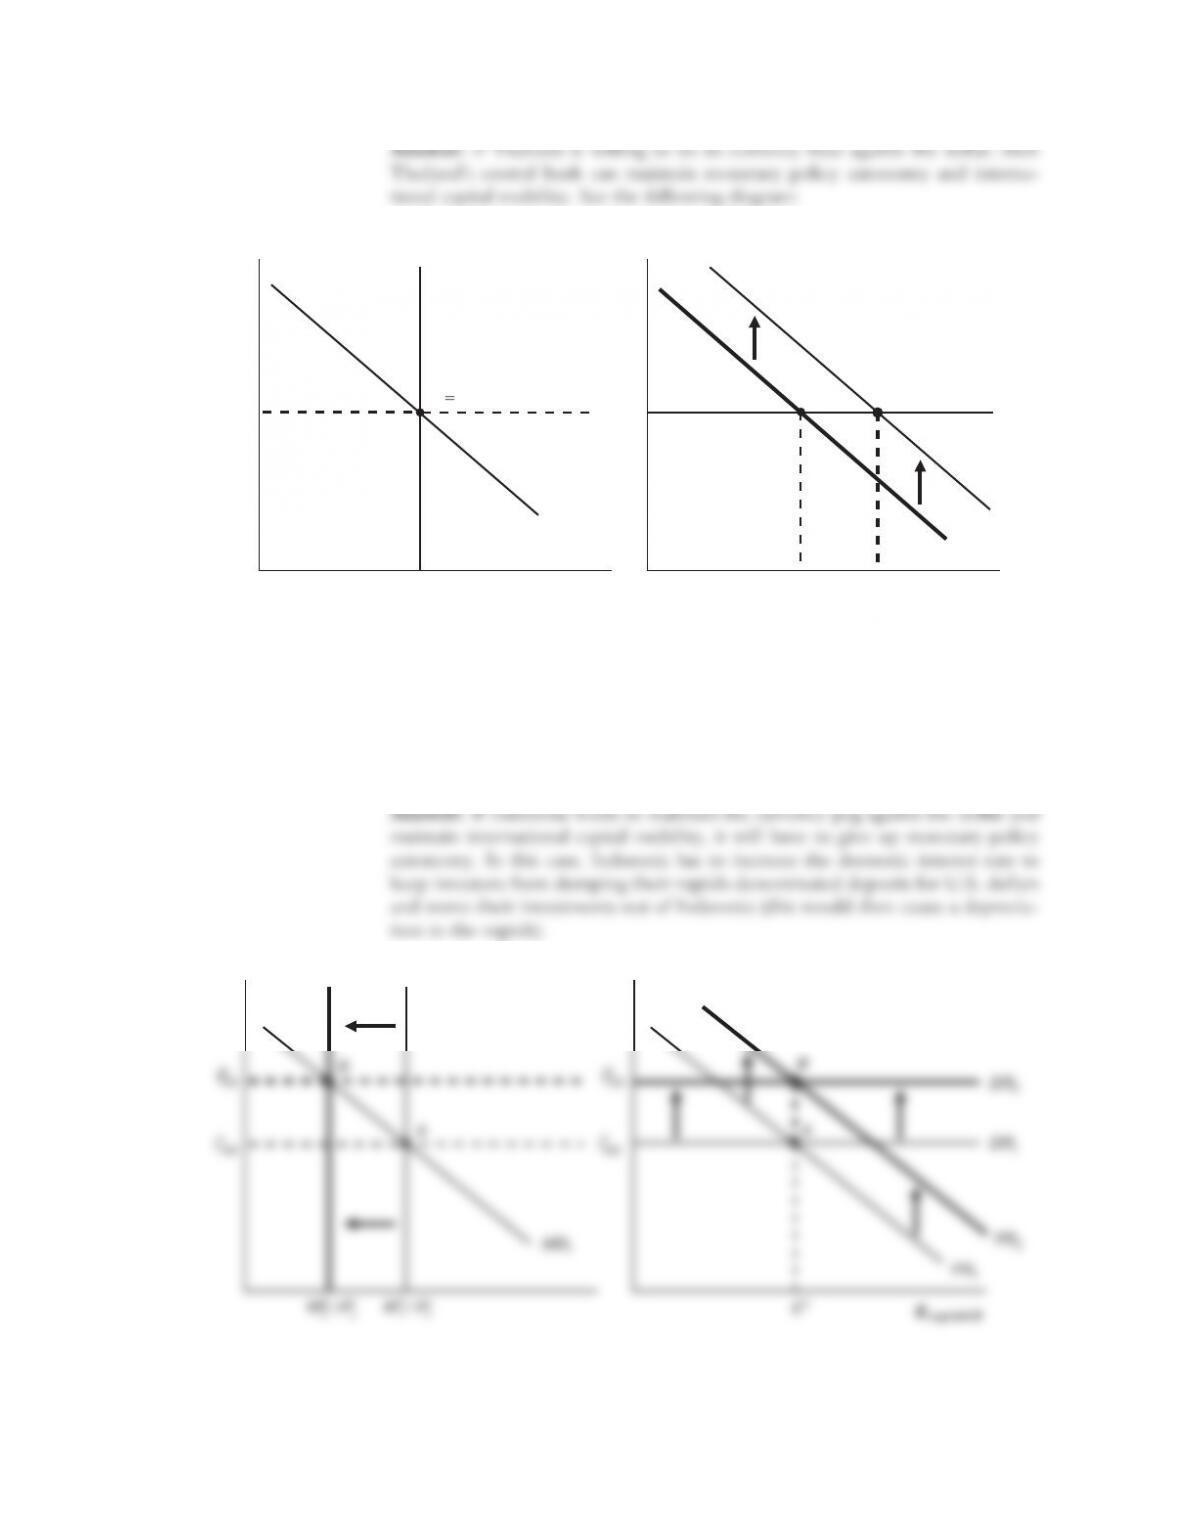
a. In July 1997, investors expected that the Thai baht would depreciate. That is,
they expected that Thailand’s central bank would be unable to maintain the cur-
rency peg with the U.S. dollar. Illustrate how this change in investors’ expecta-
tions affects the Thai money market and the FX market, with the exchange rate
defined as baht (B) per U.S. dollar, denoted EB/$. Assume the Thai central bank
wants to maintain capital mobility and preserve the level of its interest rate and
abandons the currency peg in favor of a floating exchange rate regime.
S-120 Solutions n Chapter 12 Exchange Rates II: The Asset Approach in the Short Run
ibaht
i1
baht i1
baht
MS1
MD1
M1
T / P1
T
A B
ER
DR1
FR1
FR2
E1E2
AB
Ebaht/$
irup
i1
rup
i2
rup
i1
rup
i2
rup
MS1
MS2
M1
I / P1
I
M2
I / P1
I
A
B
ER
DR1
DR2
FR1
E1
A
B
Erupiah/$
b. Indonesia faced the same constraints as Thailand—investors feared Indonesia
would be forced to abandon its currency peg. Illustrate how this change in in-
vestors’ expectations affects the Indonesian money market and the FX market,
with the exchange rate defined as rupiahs (Rp) per U.S. dollar, denoted ERp/$.
Assume the Indonesian central bank wants to maintain capital mobility and the
currency peg.
ibaht
i1
baht i1
baht
MS1
MD1
M1
T / P1
T
A B
ER
DR1
FR1
FR2
E1E2
AB
Ebaht/$
irup
i2
rup
i2
rup
MS1
MS2
M1
I / P1
I
M2
I / P1
I
A
B
ER
DR2
FR1
E1
A
B
Erupiah/$
Solutions n Chapter 12 Exchange Rates II: The Asset Approach in the Short Run S-121
c. Malaysia had a similar experience, except that it used capital controls to maintain
its currency peg and preserve the level of its interest rate. Illustrate how this change
in investors’ expectations affects the Malaysian money market and the FX market,
with the exchange rate defined as ringgit (RM) per U.S. dollar, denoted ERM/$.
You need show only the short-run effects of this change in investors’ expectations.
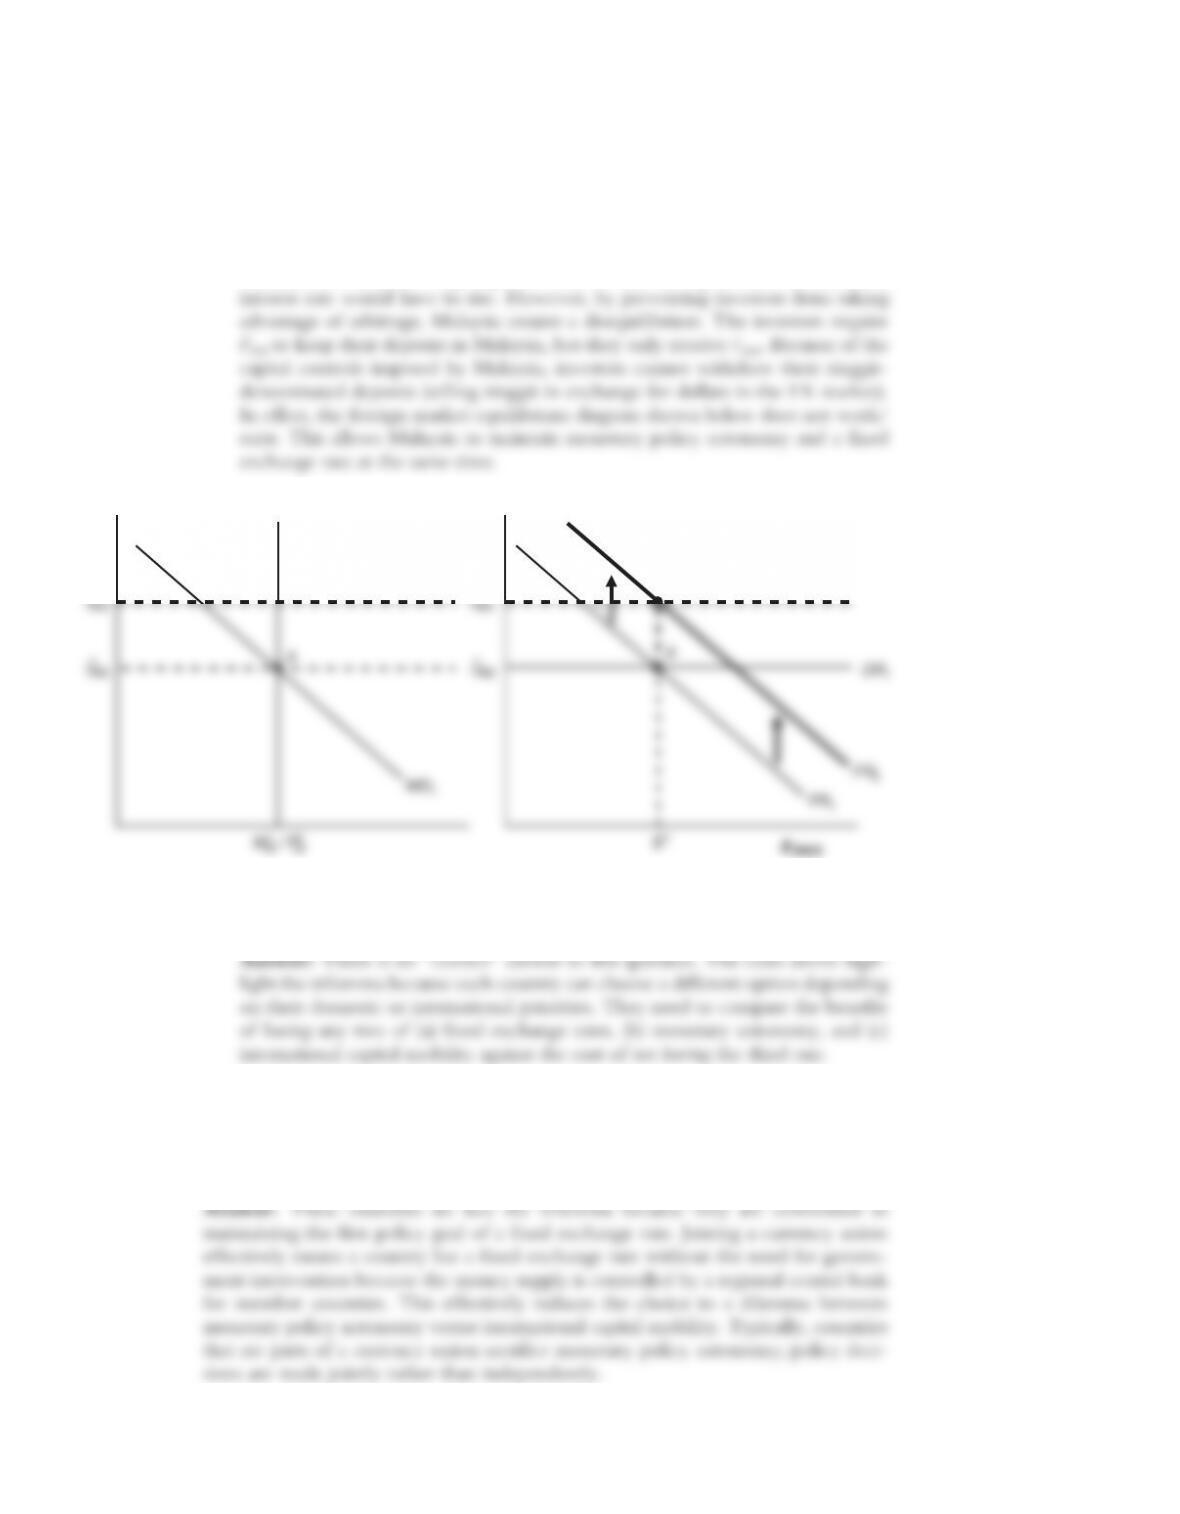
Answer: See the following diagram. In the absence of capital controls Malaysian
iRM
i1
RM
i2
RM
i1
RM
i2
RM
MS1
MD1
A
ER
DR1
FR1
FR2
A
B
d. Compare and contrast the three approaches just outlined. As a policy maker,
which would you favor? Explain.
7. Several countries have opted to join currency unions. Examples include the Euro
area, the CFA franc union in West Africa, and the Caribbean currency union. This
involves sacrificing the domestic currency in favor of using a single currency unit in
multiple countries. Assuming that once a country joins a currency union it will not
leave, do these countries face the policy trilemma discussed in the text? Explain.
8. During the Great Depression, the United States remained on the international gold
standard longer than other countries. This effectively meant that the United States was
committed to maintaining a fixed exchange rate at the onset of the Great Depression.
The U.S. dollar was pegged to the value of gold along with other major currencies,
including the British pound, the French franc, and so on. Many researchers have
blamed the severity of the Great Depression on the Federal Reserve and its failure
to react to economic conditions in 1929 and 1930. Discuss how the policy trilemma
applies to this situation.
9. On June 20, 2007, John Authers, investment editor of the Financial Times, wrote the
following in his column “The Short View”:
The Bank of England published minutes showing that only the narrowest
possible margin, 5–4, voted down [an interest] rate hike last month. Nobody
foresaw this. . . . The news took sterling back above $1.99, and to a 15-year
high against the yen.
Can you explain the logic of this statement? Interest rates in the United Kingdom
had remained unchanged in the weeks since the vote and were still unchanged after
the minutes were released. What news was contained in the minutes that caused
traders to react? Use the asset approach.
10. We can use the asset approach to both make predictions about how the market will
react to current events and understand how important these events are to investors.
Consider the behavior of the Union/Confederate exchange rate during the Civil
War. How would each of the following events affect the exchange rate, defined as
Confederate dollars per Union dollar, EC$/$?
a. The Confederacy increases the money supply by 2,900% between July and De-
cember of 1861.
b. The Union Army suffers a defeat in Battle of Chickamauga in September 1863.
c. The Confederate Army suffers a major defeat with Sherman’s March in the au-
tumn of 1864.
Answer: Just the opposite of (b) above: depreciation in the Confederate dollar is